Gold (XAU/USD) & Silver (XAG/USD) – Updated Sentiment Analysis

Gold (XAU/USD) & Silver (XAG/USD) – Updated Sentiment Analysis

Gold (XAU/USD) Trading Outlook: Conflicting Signals as Retail Sentiment Shifts

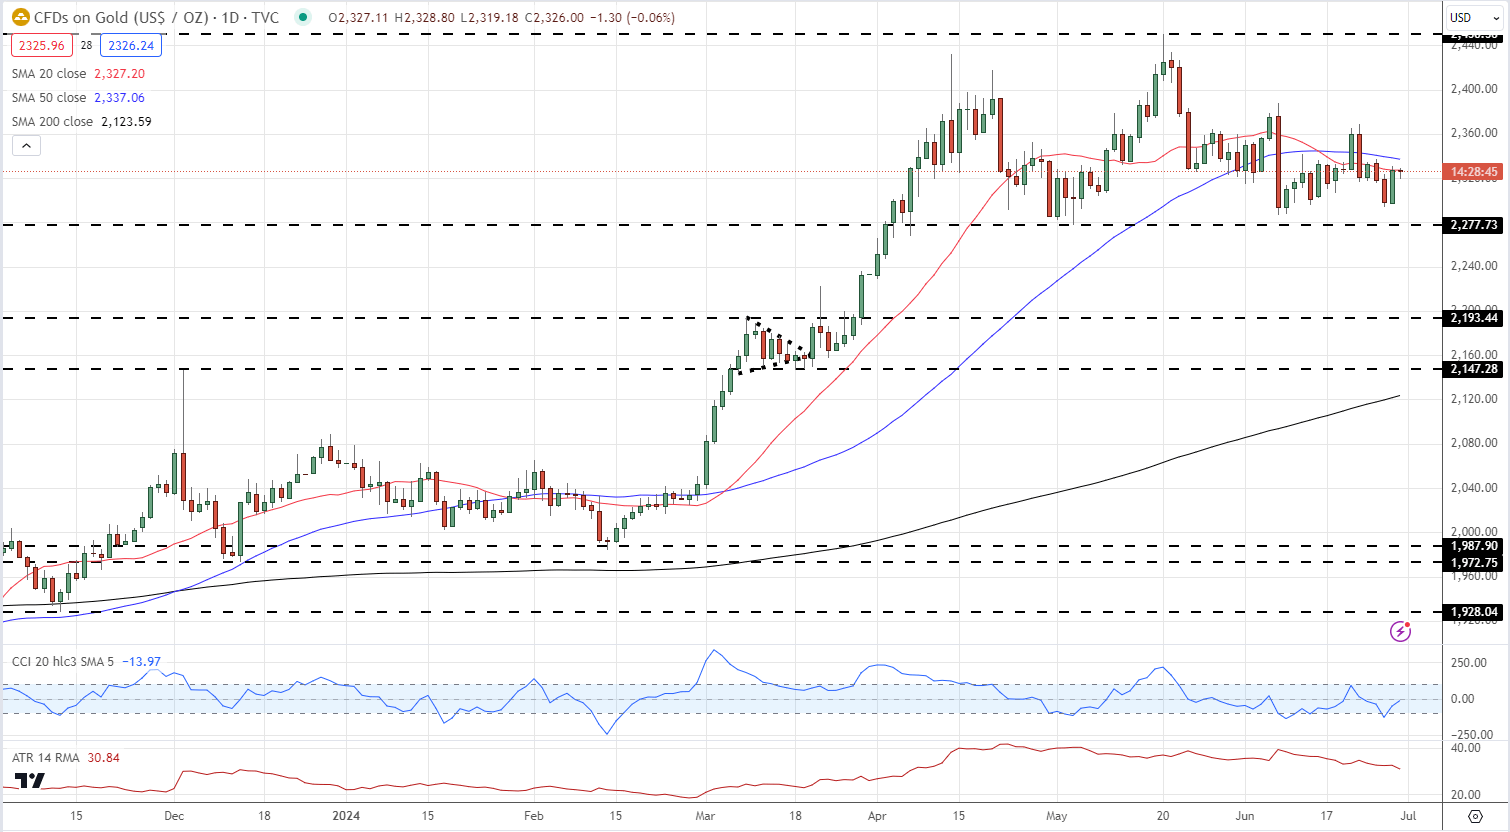
The latest IG retail trader data presents a nuanced picture for gold trading. With 57.34% of traders holding net-long positions and a long-to-short ratio of 1.34 to 1, the market appears bullish. However, our contrarian approach to crowd sentiment indicates potential downward pressure on gold prices.

Recent shifts in trader positioning add complexity to the outlook. Net-long positions have dropped 17.44% since yesterday but increased 3.80% over the past week. Conversely, net-short positions have surged 19.70% daily while declining 2.78% weekly. These conflicting trends contribute to a mixed trading bias for gold.

Gold Daily Price Chart

image1.png

Silver (XAG/USD) Latest: Retail Sentiment Reaches Extreme Levels

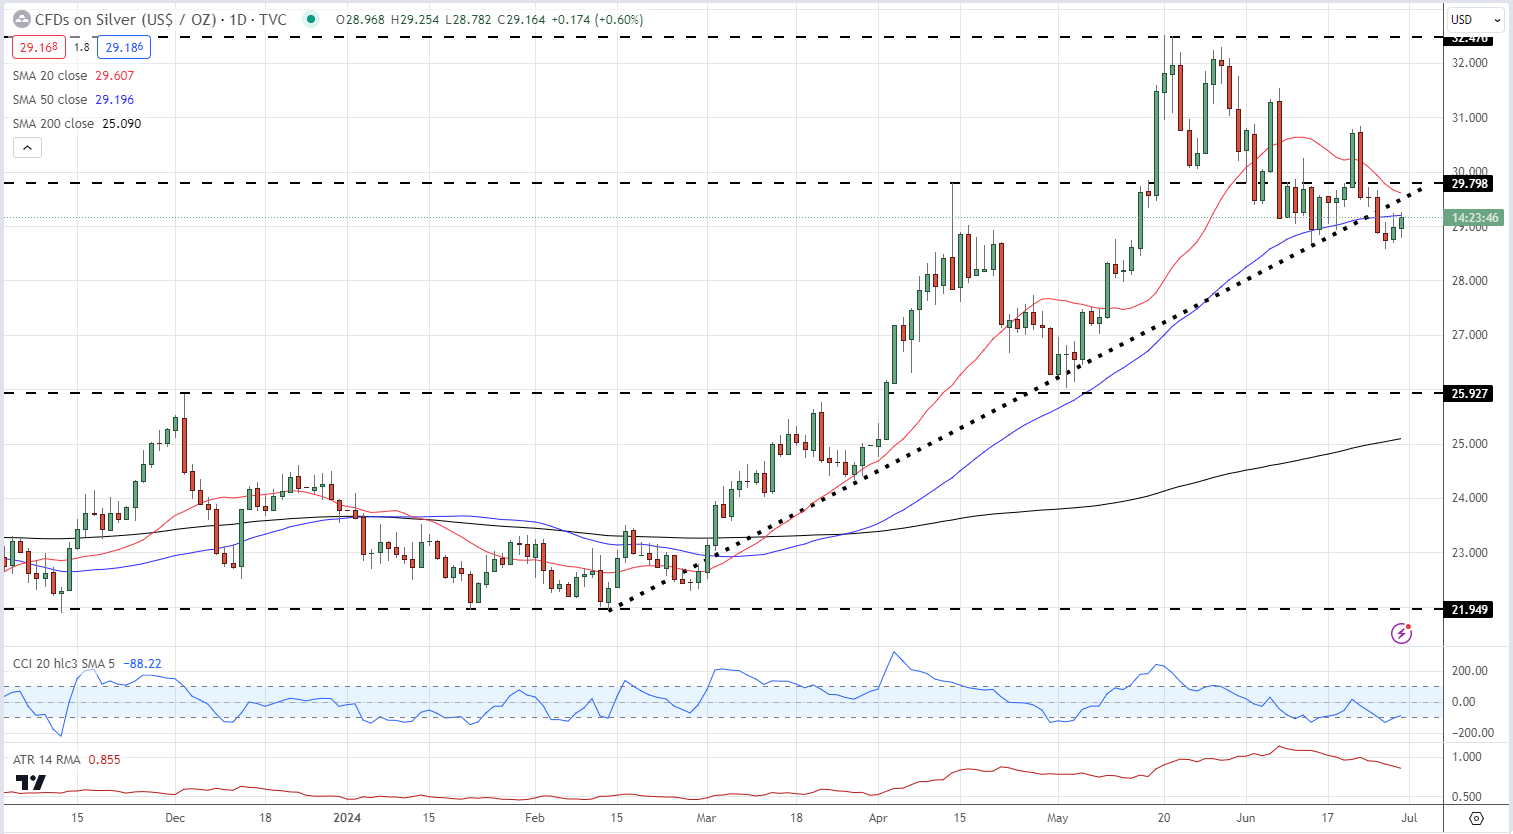
Current retail trader data reveals an exceptionally bullish stance on silver, with 85.36% of traders net-long and a striking 5.83 to 1 long-to-short ratio. However, this extreme sentiment may paradoxically suggest a potential decline in silver prices, as our analysis typically counters crowd positioning.The bullish bias has intensified recently, with net-long traders increasing by 1.69% daily and 9.86% weekly. Meanwhile, net-short traders have decreased by 11.76% since yesterday and 24.81% over the week. These trends contribute to a strengthened silver-bearish contrarian trading bias, highlighting the importance of careful market analysis.

Silver Daily Price Chart

image2.png

Price Action Trends

Price Action Trends

Most organic things live and experience the world in cycles. Whether it’s seasons or moods or growth, contraction often leads to expansion and when that expansion gets ahead of itself – it contracts, and the cycle goes on.

Most human beings are like this, they have good days and bad days. Weather is obviously like this, but so are many sports teams or fads or, well pretty much anything else that’s governed and determined by human behavior. Markets, of course, are like this is as well.

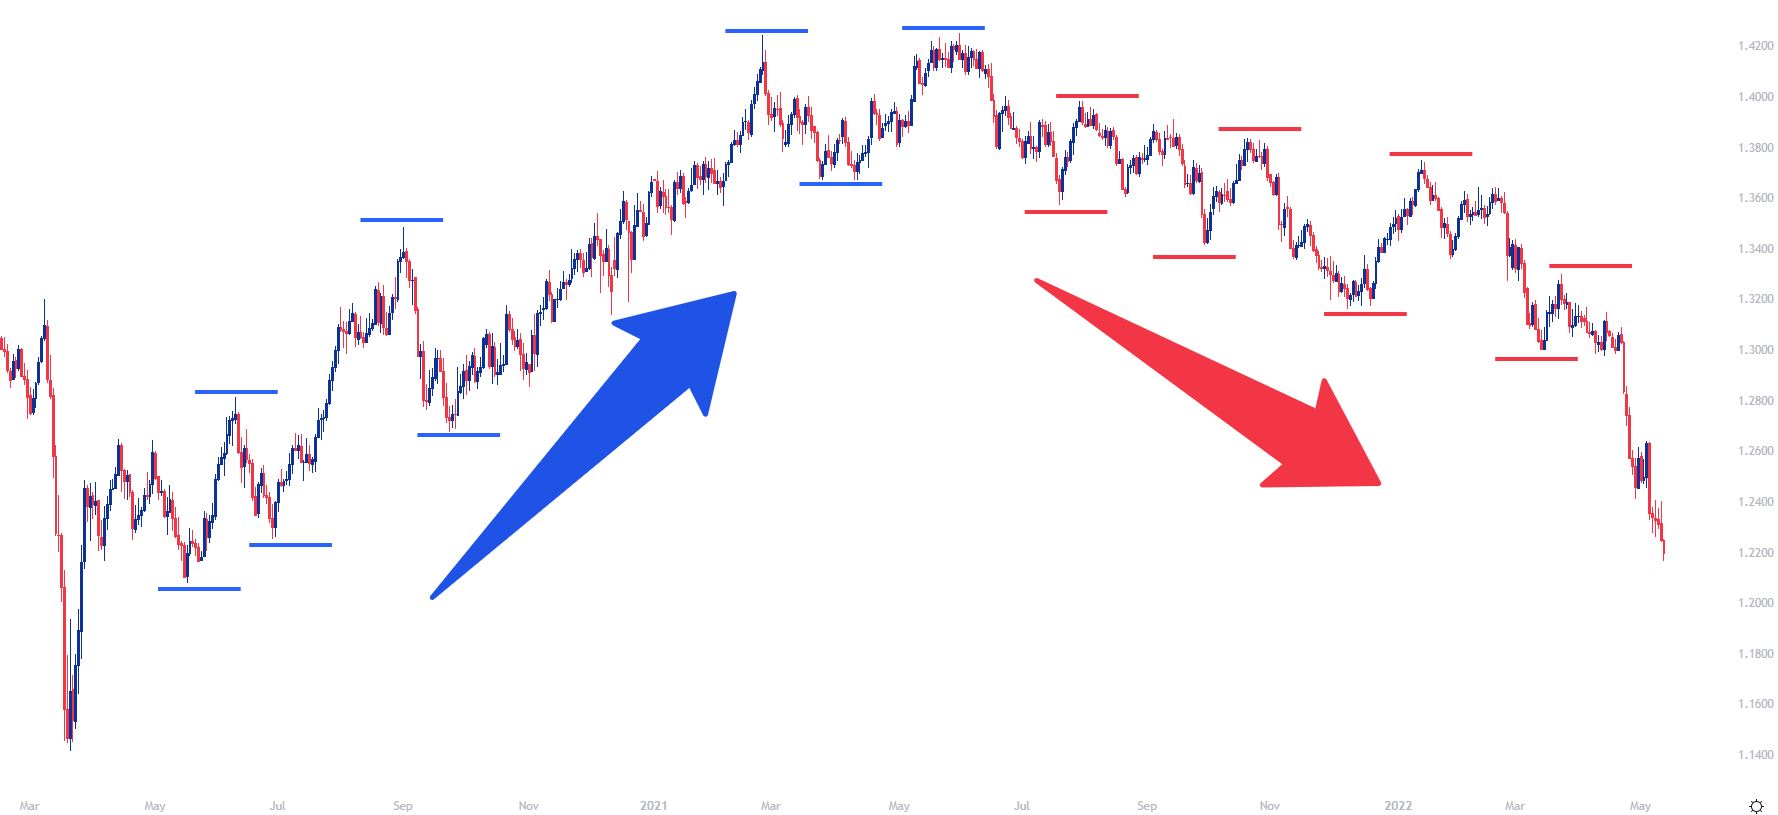
But, more than cyclicality, it’s rare that a market will make a linear movement in a singular direction, even when compelled to do so. More often than not we’ll see a steady progression of higher-highs and higher-lows as buyers pile into an up-trend or a series of lower-lows and lower-highs as a sell-off increasingly gains momentum.

It’s like the old adage of ‘two steps forward, one step back.’ The net is still a positive and a gain has been made; but rarely is that gain going to show in a sustainable manner by moving in a linear format.

Price trends are often like this, and the logic behind it makes sense. Something good happens and that compels people to buy. Perhaps the good thing was a strong earnings report from a company or maybe it was a better-than-expected GDP report that shows even greater growth coming into that economy.

But after that motivation has been priced-in and there’s nobody left to buy, what happens? Likely, price will drop until buyers do step-in and if that good news that previously brought new buyers into the equation remains relevant, there should be ample motive for buyers to step-in before the entirety of the move is retraced, and that’s what can lead to a higher-low.

And if that good news keeps coming, this scenario can continue to play out as a series of higher-highs and higher-low builds, allowing for a bullish uptrend. This cycle takes place on a number of different time frames in a number of different ways but the general gist is the same, something good getting priced in can lead to a series of higher-highs and higher-lows and, on the other hand, something negative getting priced-in can bring on a series of lower-lows and lower-highs.

GBP/USD Daily Price Chart: Higher-Highs and Higher-Lows, Lower-Lows and Lower-Highs

Price Action Trends

The degree of those two steps forward and one step back differ, however, and the basis for that is generally going to be decided by just how excited the market is to price in that new information.

In some cases, it might seem as though it’s more of a ’ten steps forward, one step back,’ and this illustrates greater momentum as that ‘new’ information is getting priced-in. We’re looking at one such scenario in the next chart.

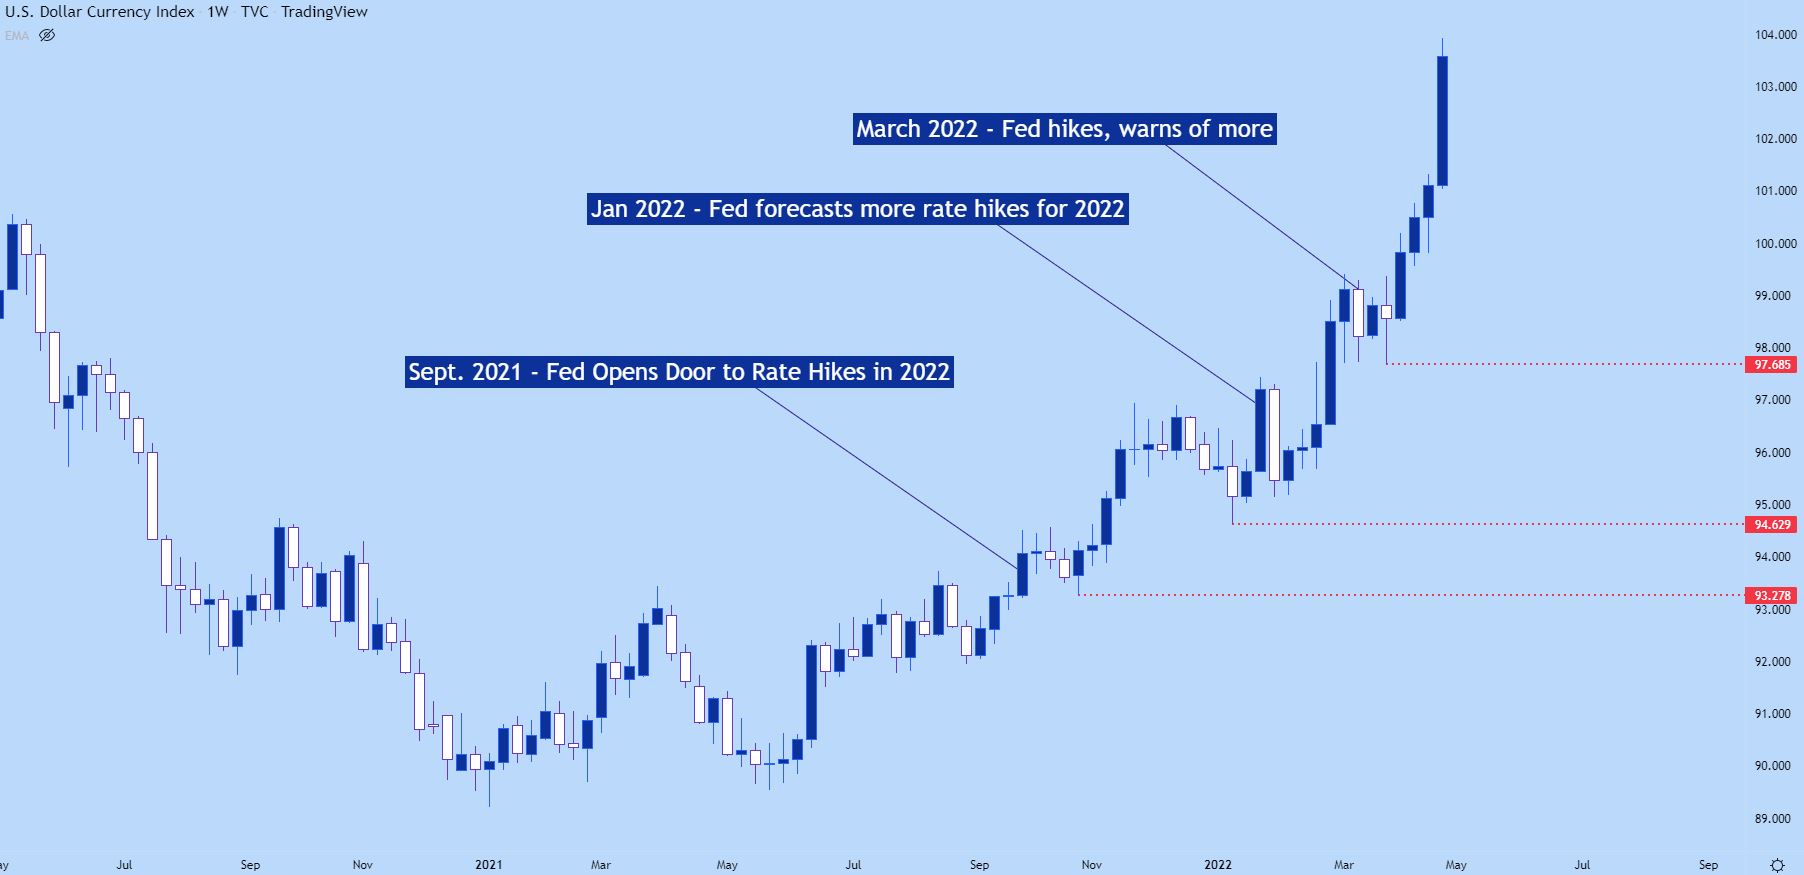
On the below weekly chart of the US Dollar, we’re looking at a bullish trend getting priced-in as the Federal Reserve started to open the door to rate hikes in late-2021. At the September rate decision, the Fed forecast one hike for 2022, which compelled buyers to jump into the market which forced a fresh higher-high. Later in the year, the Fed began to open the door to even more rate hikes in response to the continued gains in inflation, and that led to even higher-highs. And as that theme continued to drive so did the bullish trend.

US Dollar Weekly Price Chart

Chart prepared by James Stanley; US Dollar Weekly Chart, May 2020 – May 2022

While the higher highs are surely attractive in the above chart, the more compelling part may be the red lines or the higher-lows that followed those higher-highs.

This is illustration of the ‘one step back’ after the ‘two steps forward’ as price pushes in the trend-side direction. And for traders that are looking to get long in the trend, they’ll likely want to wait for one of those ‘one step back’ deals before looking to take on exposure. This wouldn’t necessarily require catching the exact low of that step back but, this would also give the trader some element of strategy outside of just getting long and hoping that the trend continues, as that higher-low could afford the ability to place stops below so that if the trend does bend, the loss could be mitigated.

Introduction to Basic Trendline Analysis

Introduction to Basic Trendline Analysis

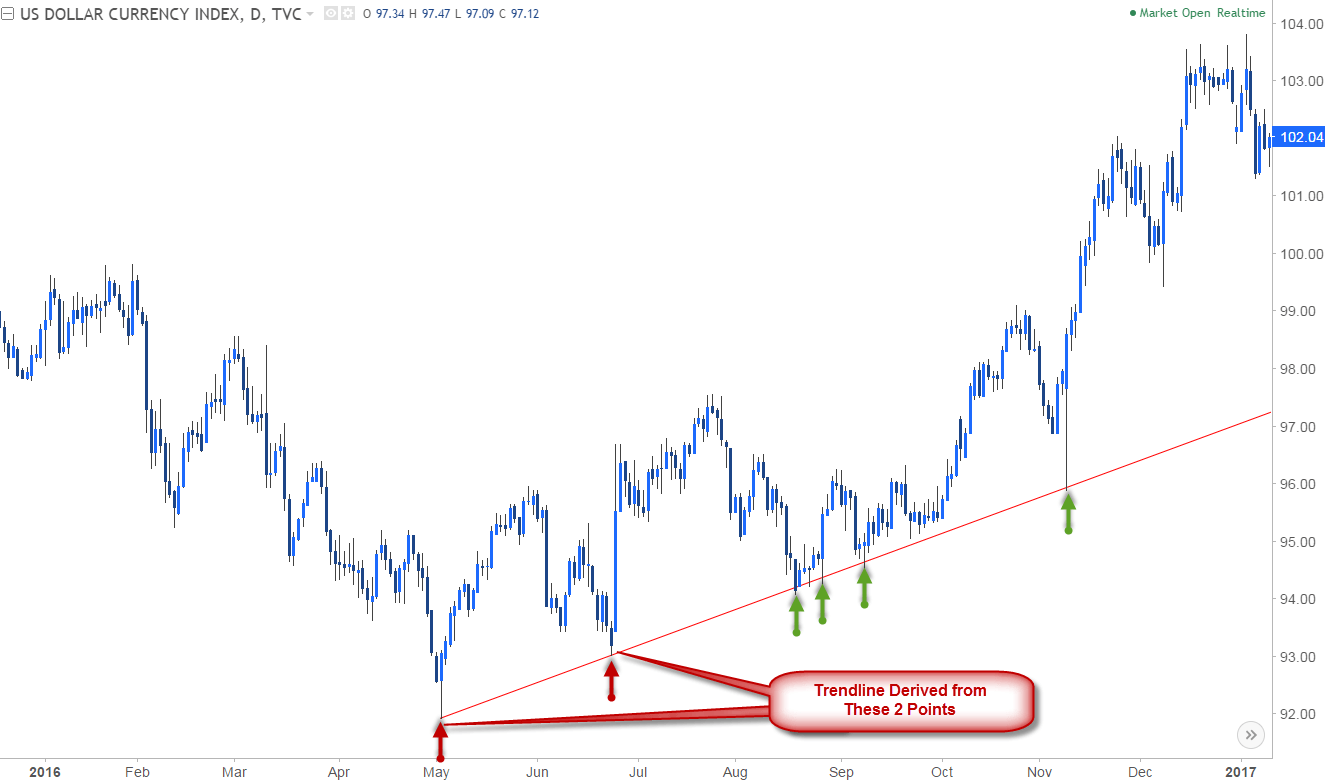
Trendlines are the simplest and single most important (and largely underutilized) tool in your trading arsenal. Extending a line off key highs & lows in price is an objective way of assessing the gradient or slope of a trending market. This key step can help identify where the price is likely to find support (floor) or resistance (ceiling).

DXY Daily Price Chart

Trendline Analysis on DXY Daily Chart

Note that trendline analysis can be viewed as more of an art form than a science as it requires some form of subjectivity. That said, when drawing trendlines, the more touch points the market has, the stronger conviction the slope offers. This means that the reaction off the trendline (slope) becomes increasingly effective.

In the example of the U.S. Dollar Index, the positive slope casts a bullish outlook, with the broad game plan to buy as price trends higher. So where should our entry point be? A pullback into trendline support would be the most favorable entry

Trendline Analysis on DXY Daily Chart

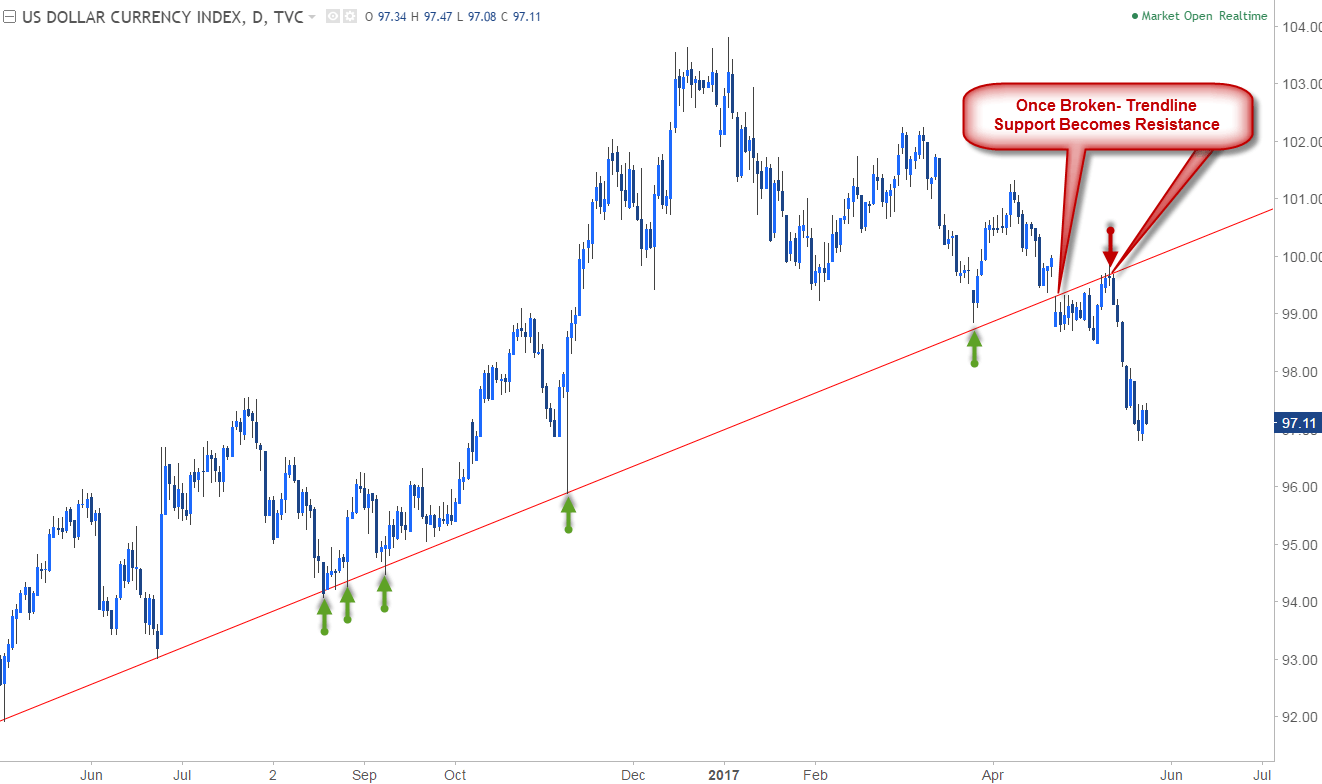
With the same respect, a break often offers sharper and more significant reversals. Once a trendline support is broken, the slope now becomes resistance for prices, and often foreshadows a change in market behavior. This slope can now be seen as a reference of invalidation for the current move lower.

AUD/NZD Daily Price Chart

Trendline Analysis on AUD/NZD Daily Chart.

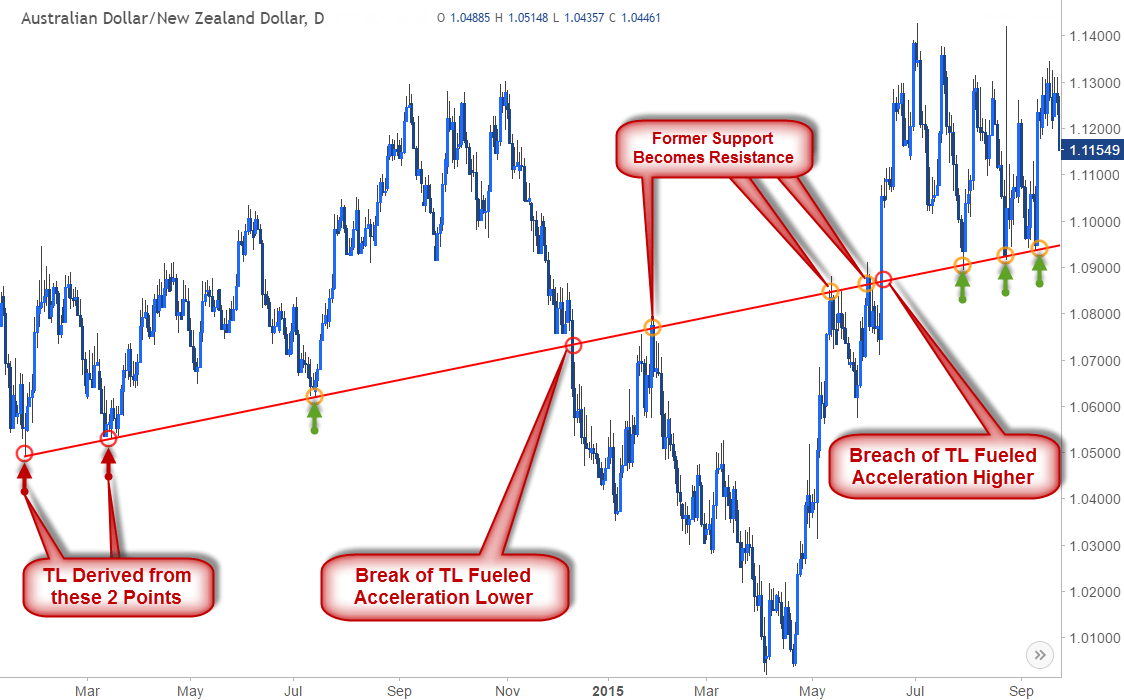
Likewise, a breach above a trendline resistance sees that line as support for the subsequent move higher. The AUD/NZD example above shows how a single trendline can offer plays on both sides of the spectrum as support & resistance. Once the slope broke in December, if offered clear resistance on the subsequent rally in early 2015 before moving lower. Likewise, the breach above in June fueled a rally higher, which inevitably found support back at that same trendline.

Key Takeaways on Trendline Analysis

Some important aspects to keep in mind when drawing trendlines:

  • Two points is speculative, three points confirms– It’s important to note that any two reference points can offer a trendline- however it’s the third touch point that confirms the validity of the slope. Therefore before relying too heavily on a given gradient, look for that third touchpoint for conviction.
  • Assessing the break– You should always be trading under the assumption the trendline will hold- but when trying to ascertain whether price is actually breaking, one of the most important things to consider is timeframe. As a rule of thumb, I’ll typically look for a daily close to confirm or invalidate the break of a given trendline. However, when utilizing shorter time-frames price action will be the biggest tell- look for a reaction / change in behavior at the break with a pullback & retest of the slope as support/resistance to validate the break. We will discuss multi-timeframe analysis in more detail in part 3 of this series.
  • A break of a trendline should fuel acceleration- When a slope is broken as resistance or support, the subsequent move should see prices follow through in the direction of the break. If prices break and fail to accelerate in that direction, often times this will be a sign of a ‘false break’ scenario (also known as a ‘throw-over’). These exhaustion trades are typical in mature trends and can often precede key reversals in price.
  • Don’t chase the break– The way you will want to trade the breach of a trendline is to wait for a pullback in price to test the slope as support – your stop will be below this low. Likewise, on a break of support, wait for the market to retest the trendline as resistance- That pivot high will be your stop on the short.

This fundamental use of trendlines is constant across slope analysis and is the basis of the methodology.

Introduction to Multi-Time Frame Analysis

Introduction to Multi-Time Frame Analysis

Benefits of Multi-timeframe Analysis

As explored in previous articles on trendlines and pitchforks / median-lines are used to locate key reaction zones in price. These same principles can be applied to multiple time frames to offer a more complete view of current market trends.

The idea is to, ‘see the forest through the trees’ – in other words, before entering a trade based on a given setup, you will always want to have a broader opinion of where the market is relative to trend. By viewing price action in various timeframes we can identify possible entry points within a given price advance / decline as well as help in timing these moves.

EURAUD Daily

Multi-Timeframe Analysis for EUR/AUD Daily Chart

Consider the EURAUD daily chart above- The pair was trading in a clear downtrend off the 2015 highs with a descending channel formation highlighting support into the April lows around 1.3678. As discussed in earlier lessons, the confluence of trendlines & key high / lows in price will often represent more significant areas of support & resistance. In this example, price is testing down-trend support – the focus now shifts to the near-term picture for further clarity on how we would trade this possible rebound.

Multi-Timeframe Analysis on EUR/AUD 240min Chart

Just because price is at support, doesn’t mean we can simply assume it will hold. Prices need to establish some form of behavioral change before we can look to trade against the broader trend. As we drill down into the 4-hour chart, an embeddednear-term descending channel formation can be identified (red). A break above channel resistance as price comes off key support would shift the near-term focus higher in the pair and will serve as our ‘trigger’ to get into the trade.

Multi-timeframe Analysis EUR/AUD Daily Chart

To identify our topside targets, we can derive an ascending pitchfork formation off the most recent low-high-low to construct an up-slope. The initial target on such a trade would be at the median-line (bisector) of the pattern with the focus weighted to the topside while above the lower median-line parallel.

Multi-Timeframe Analysis on EUR/AUD 240min Chart

Fast forward a few weeks and the pair indeed broke above down-channel resistance and came back to test that line as support (long-entry). The advance continued into the median-line followed by a break and rally into the upper median-line parallel a few days later. This simple example illustrates how analyzing price action through various lenses of time can help identifying trading opportunities within the context of a larger trend (also called primary trend). Oftentimes secondary (or even tertiary) trends within these patterns will offer near-term setups to trade against the primary trend.

Key Takeaways on Mulit-Timeframe Analysis

Some important aspects to keep in mind when utilizing multi-timeframe analysis

  • Too many time frames render useless – Some fall into the pitfall of trying to time entry/exit when all the time frames line up with a signal- but this will rarely happen.
  • When scaling down in time-frames, utilize a ratio of 1:4 to 1:6 between the trigger and the trend timeframes. For example, if you are taking a trade off the four-hour chart, look for the daily chart for trend analysis. If you are looking for a trade off the one-hour- look at the four-hour for trend analysis.
  • Recognize when you’re counter-trend trading – Often times the near-term picture will offer setups against the primary trend like the EURAUD example above. It’s important to approach these trades with more caution, meaning lower leverage and more conservative stops.

Multi-timeframe analysis allows traders to focus on the appropriate timing of trades as well as help identify when trends may be reaching exhaustion. In the example above, if the EURAUD had stayed within the confines of the near-term descending channel formation, no attempts would have been made on the long-side. With the same respect, had we not viewed the trade within the context of the broader trend highlighted on the daily chart, we may have missed the turn all together. Keeping that in mind, always trade within the context of the primary trend and look for near-term price action to offer triggers in time and price.

US Dollar Slips After US Durable Goods, Jobs Data – US Q1 GDP Meets Forecasts

US Dollar Slips After US Durable Goods, Jobs Data – US Q1 GDP Meets Forecasts

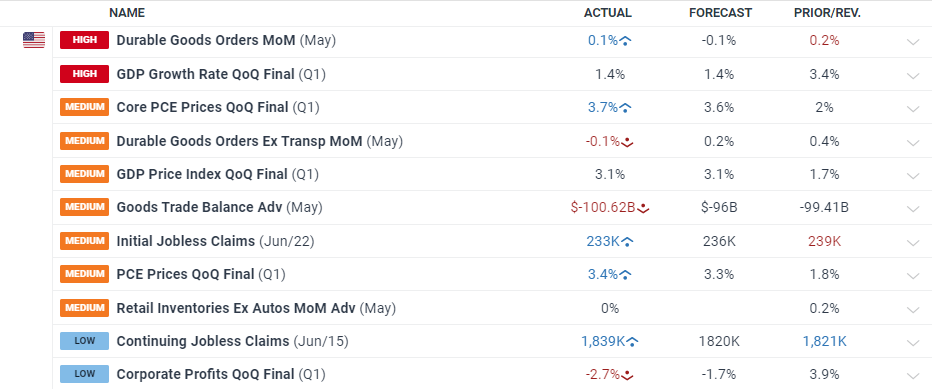
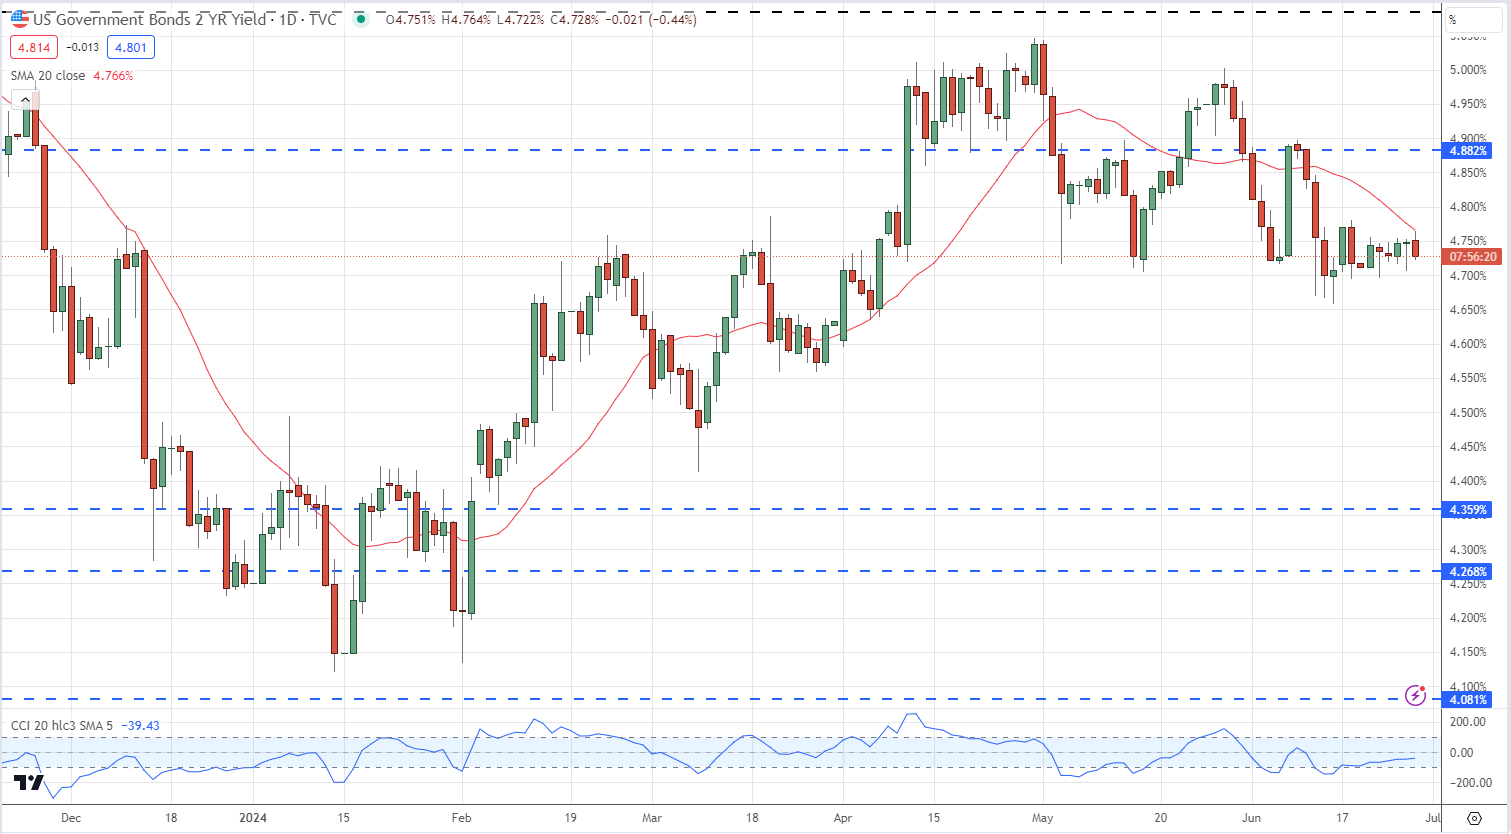
The US dollar index slipped lower after the latest batch of US data showed economic activity slowing down. The final Q1 US GDP figure came in as forecast at 1.4%, while the May Durable Goods release came in slightly better-than-expected at 0.1% vs forecasts of -0.1%. However, the April monthly figure was downgraded from an original 0.7% to 0.2%.

image1.png

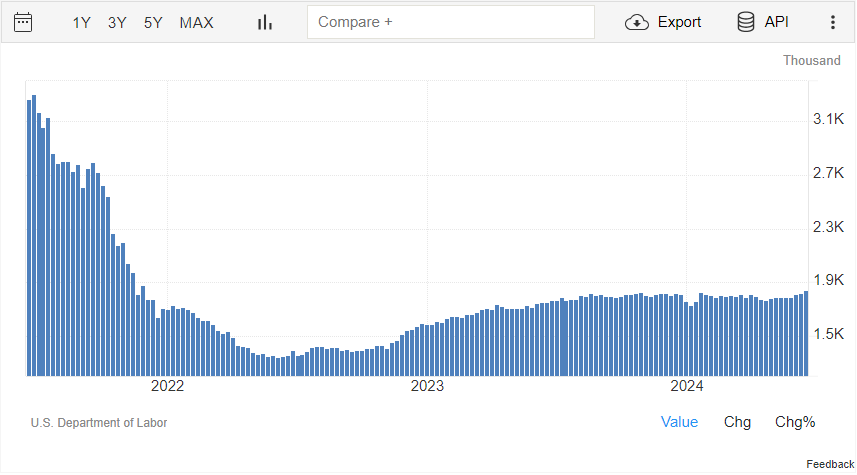
In the labor space, US continuing jobless claims – the number of unemployed workers who filed for benefits at least two weeks ago – crept higher, rising to levels last seen in November 2021.

US Continuing Jobless Claims

image2.png

US Treasury Two-Year Yield

image3.png

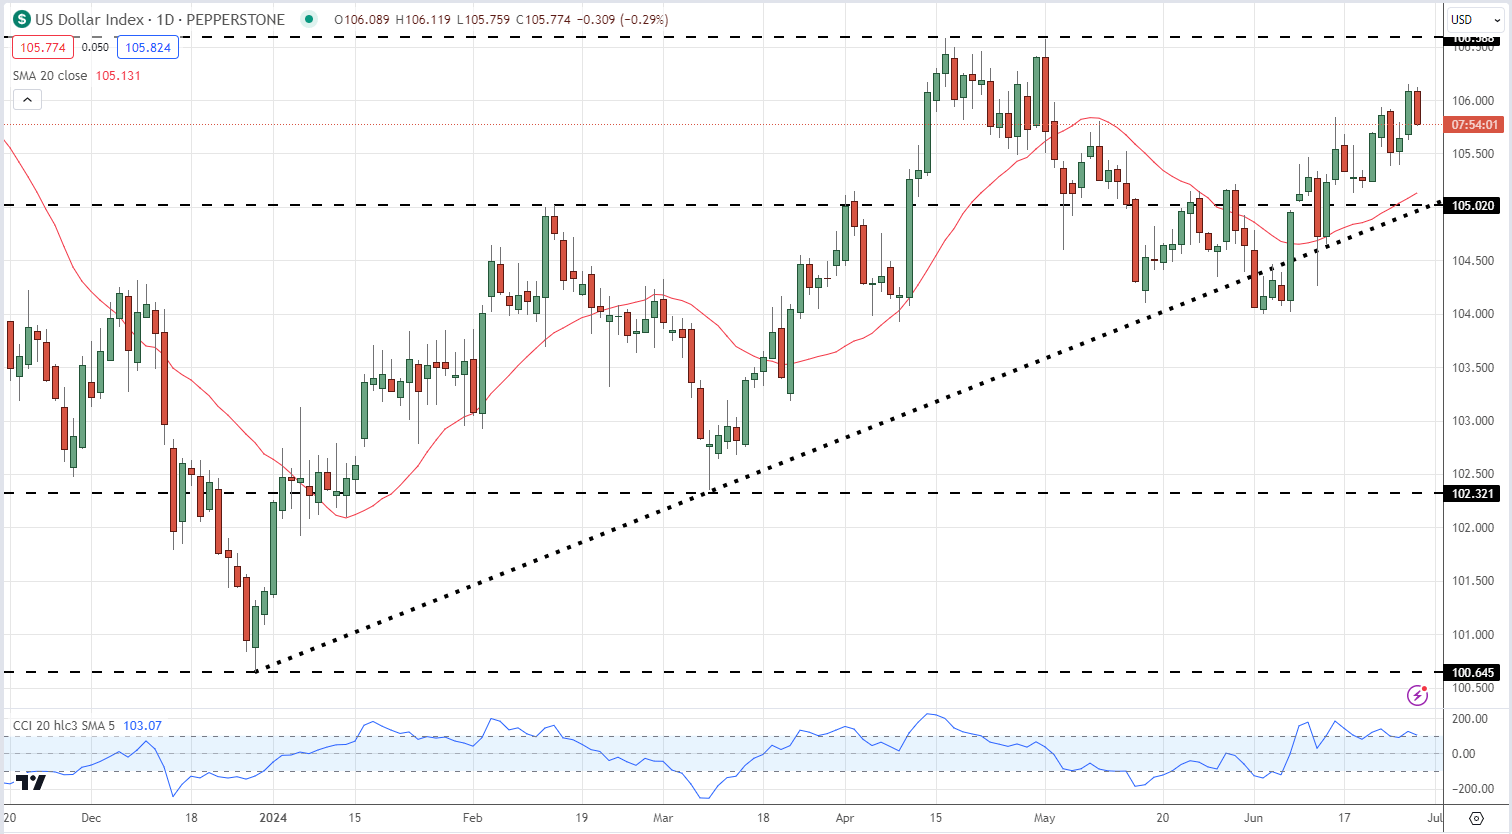
…while the US Dollar Index gave back 30 pips and is currently trading at the low of the day.

US Dollar Index Daily Chart

image4.png


Euro (EUR/USD) Latest – Renewed Volatility Ahead, US PCE and French Elections

Euro (EUR/USD) Latest – Renewed Volatility Ahead, US PCE and French Elections

The first round of the French elections takes place this coming Sunday with the right-wing National Rally party (RN) seen heading the polls but without enough seats to form a government. The RN is predicted to receive anywhere between 31.5% to 35% of the vote, according to three recent polls, with the People’s Front, a left coalition is placed second with between 28% and 29.5% of the vote. President Macron’s alliance is forecast to get between 19.5% and 22% of the vote. With the current ruling party polling in third place, the fractured nature of the forecast vote will see French politics weigh on not just French assets but also the Euro in the coming days. The second, and final, French vote will occur on Sunday, July 7th.

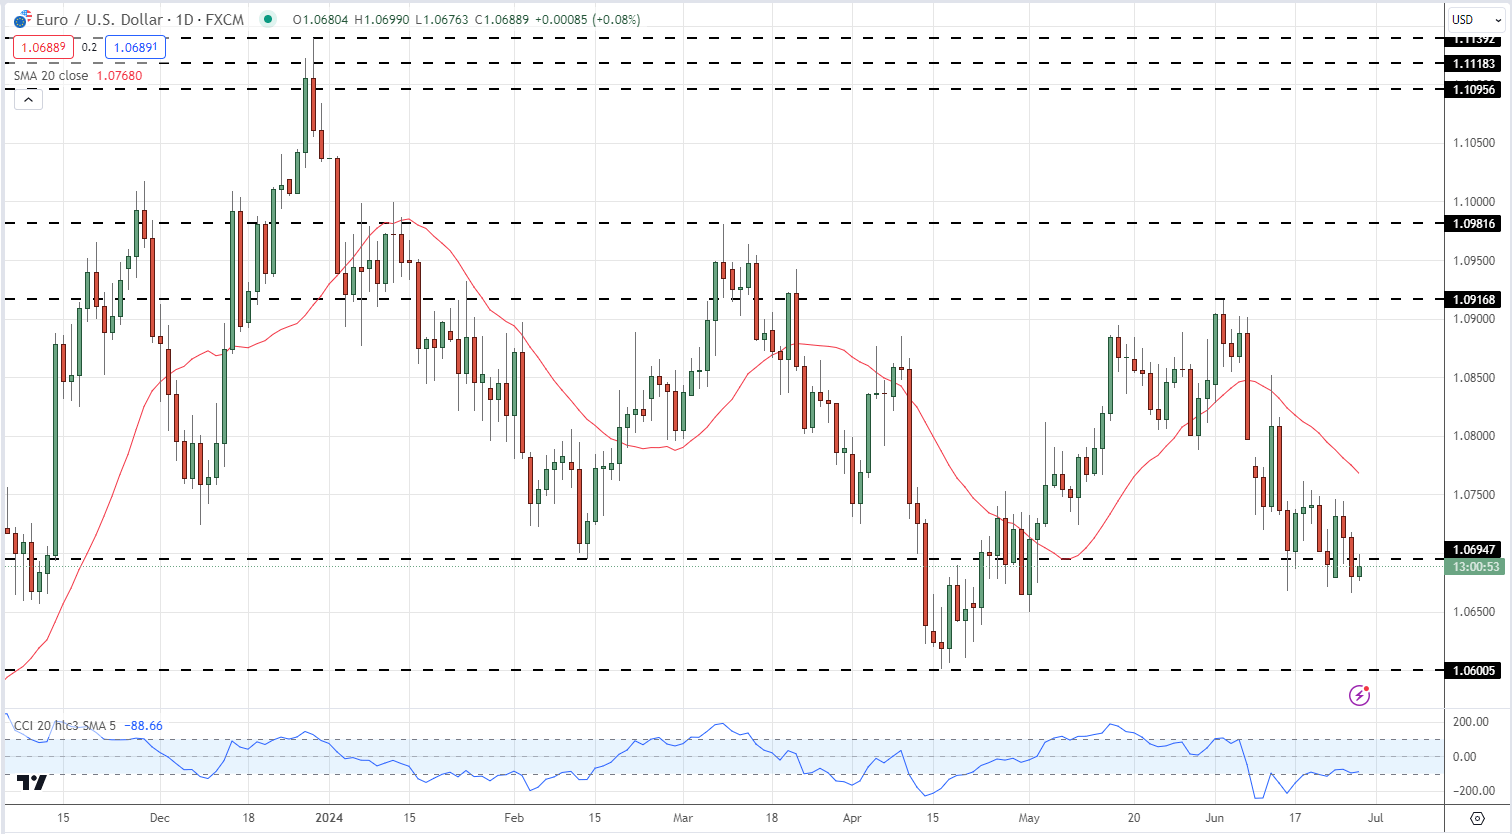
The most widely traded FX-pair, EUR/USD, has recently been driven lower by a combination of US dollar strength and Euro weakness. Later today the latest US durable goods data and the final reading of US Q1 GDP will be released today. While both of these releases can move the US dollar, traders will be looking forward to Friday’s US core PCE report for guidance ahead of the weekend. High-importance US data and this weekend’s French elections will pave the way for a volatile backdrop for EUR/USD traders.

EUR/USD is back below 1.0700 and struggling to move higher. The series of lower highs and lower lows started in late December remains in place, and this will continue if the April 16 multi-month low is breached. Below here, a double low around 1.0516 made in late October 2023 becomes the next downside target. Initial resistance is seen around the 1.0750 area.

EUR/USD Daily Price Chart

image1.png

Retail trader data shows 66.18% of traders are net-long with the ratio of traders long to short at 1.96 to 1.The number of traders net-long is 14.14% higher than yesterday and 25.04% higher from last week, while the number of traders net-short is 14.48% lower than yesterday and 22.26% lower from last week.

We typically take a contrarian view to crowd sentiment, and the fact traders are net-long suggests EUR/USD prices may continue to fall.

Traders are further net-long than yesterday and last week, and the combination of current sentiment and recent changes gives us a stronger EUR/USD-bearish contrarian trading bias.

Economic Growth: What is GDP Growth?

Economic Growth: What is GDP Growth?

What is Economic Growth and Why is it So Important?

Top news headlines are often dominated by the release of gross domestic product (GDP) figures and for good reason. The GDP release attracts a lot of attention from traders and market participants because of its signaling effect and ability to move financial markets.

This article explores the concept of ‘growth’ from an economic perspective and why it is beneficial for traders to have a solid understanding of the subject.

What is GDP Growth and How is it Reported?

When news outlets or financial publications refer to ‘growth’ they generally mean gross domestic product or GDP.

GDP measures the value of goods and services produced by a country in a given year and serves as an indication of economic health of that country. Essentially, it’s an objective measure of improving or worsening economic conditions in a particular country over time.

How is GDP Reported?

GDP has four main readings, one per quarter, often denoted as Q1, Q2, Q3 and Q4; but you may notice that GDP figures are reported every month. This is because GDP is a lagging economic indicator, meaning that there is a lag period before the data is collected, analyzed and adjusted to account for seasonal influences. Lagging economic indicators are not to be confused with lagging technical indicators.

GDP figures are mainly reported as a quarter on quarter figure (QoQ) or year on year (YoY). The below image shows the percentage change in real GDP* (QoQ):

Real GDP: Percent Change from Preceding Quarter

*Real GDP provides a more accurate indication of production/output as it removes the influence of higher prices on the value of aggregated goods and services in the economy

There are three reported figures for each quarter:

  1. The preliminary/advance figure
  2. The second estimate and
  3. The final GDP figure.

The preliminary/advance figure tends to have the biggest impact from a trading point of view as the other two figures generally involve small refinements to the initial figure. The component factors that make up GDP can often be observed and aggregated ahead of the released figure, meaning GDP is less likely to provide a shock to the market than other data releases such as Non-farm Payrolls (NFP).

However, do keep in mind that for major economies an estimated GDP growth figure that differs from the actual by 0.3 or 0.2 percentage points can translate into billions of dollars -which may attract varying opinions of the state of the economy and result in elevated volatility after the release.

For more information on these releases, click the drop down arrow next to the event on the DailyFX economic calendar

DailyFX Economic Calendar

GDP Growth and the Signaling Effect

The state of the economy is watched very closely by governments and central banks. When the economic growth (GDP) is stagnant or the economy is technically in a recession, central bank policy shifts and becomes more ‘accommodative,’ providing liquidity and lowering interest rates; while increased government spending often follows suit. In economic booms central bankers look to reign in overheating economies and monetary policy becomes more ‘contractionary’ in nature – raising interest rates, while governments often reduce spending.

Longer-term macro traders are able to analyze whether an economy is in a boom, recession or transitionary phase when planning trade set ups. Currencies linked to central banks that are ‘hawkish’ tend to appreciate at the start of an interest rate hiking cycle; while currencies linked to central banks that are ‘dovish’ tend to depreciate at the start of an interest rate cutting cycle.

For equities, lower future interest rates will make it easier for individuals and institutions to access credit at low rates which can be used to invest in the stock market. Additionally, lower interest rates translate into lower discount rates applied to future company cash flows to arrive at a higher valuation for shares in general.

For an in-depth understanding of the stock market, read through our comprehensive Understanding the Stock Market education section

Furthermore, traders are often able to pick up on clues on the direction of future monetary policy from the tone and language used by the heads of various central banks in their press conferences. Press conferences follow after an interest rate decision has been released.

GDP: Components of Growth

From an economic point of view, the main components of growth can be listed under the following broad categories:

  • Consumption
  • Investment
  • Government spending
  • Net exports

Output (GDP) = Consumption + Investment + Government spending + Net Exports

Consumption is the everyday exchange of money for goods and services such as buying groceries or paying your internet service provider. Investment refers to private local investment or capital expenditure, for example businesses will reinvest in the business to increase productivity and boost employment levels.

Governments spend money on infrastructure, equipment and salaries of government employees and this expenditure can look significant in times when general spending and business investment decline. Net exports is the result of taking total value of exports and subtracting the total value of imports and is the result of international trade.

Leading Economic Indicators of Growth

GDP growth is not the only indication of the state of an economy. While GDP is inherently lagging in nature traders can consider a whole host of leading economic indicators that can provide insight into the condition of different sectors of the economy before the GDP data is even released.

The data releases provided below also shed some light on underlying economic environment before GDP data is released:

  • New building permits – This measures the change in the number of new building permits issued by the government. Building permits are a key indicator of demand in the housing market and the housing market/construction tend to move closely with the underlying state of the economy.
  • Consumer credit – This figure has strong ties to consumer spending and confidence. Rising debt levels are usually indicative of economic strength as banks feel comfortable issuing approving lines of credit. On the other hand consumers feel financially stable enough to make the monthly repayments.
  • Retail sales – Considered a primary gauge of consumer spending, which accounts for a sizeable portion of overall economic activity
  • Consumer confidence – This measures the level of consumer confidence with respect to economic activity. It is a leading indicator as it can predict consumer spending, which plays a major role in overall economic activity. Higher readings point to higher consumer optimism.
  • ISM Manufacturing/services PMI – Purchasing managers in any company hold the most current and relevant insight into their company’s view of the economy and therefore their sentiment of current economic conditions are of great value. A value above 50 indicates optimism while values below 50 are viewed as pessimistic.

Big Mistake Leads Technical Trader to Top Three Tools

Big Mistake Leads Technical Trader to Top Three Tools

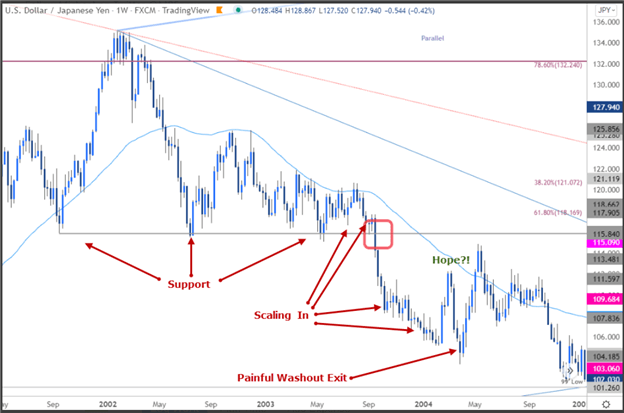
The 116 Death Trap

Developing your strategy comes at a cost –often a lot of time, money and frustration. I came to this realization in 2003 as USD/JPY was pulling back from multi-year highs. The ‘116 death trap,’ as I’ve dubbed it, was a seemingly rock solid zone of support. It had caught the lows since 2001 with numerous defenses suggesting a perfect opportunity for me to ‘catch the lows’ and cost average in. Even when price broke, my hope was that every rebound was the low. Not quite. In September of 2003, the death trap began with a drop of more than 12% over the next year, taking USD/JPY to lows not seen since the late-90s. Even a glimmer of hope offered by a multi-week rally in early 2004 reversed. With the pain finally too hard to tolerate, I exited at the lows. So much for cost averaging into a loser. That was my hard lesson learned.

USD/JPY Daily Price Chart

Where did I go wrong?

Well, there was a lot, but for starters, emotions are not your friend. Most of all, my error was not having a plan and not recognizing market conditions. Knowing the style of trading that works best for your personality, risk tolerance and goals is critical and without a plan you are on a ship without a rudder.

Everyone comes to this realization differently. I learned through years of managing market flow for one of the first brokers to offer online retail FX trading. It was through close observations of retail market flow and tracking near-term price-action that I developed three basic principles for my technical trading strategy. It boils down to assigning a value for price, time and momentum.

Price Value – Key reversals, Fibonacci, High/Low-day Closes

It’s all about the levels – identifying support / resistance is a critical part of being able to create actionable trade ideas targeting or countering key levels in price. These lateral levels can be identified using various methods. The three I rely on most are key reversals (outside-day reversals), high and low-day closes and Fibonacci.

The word “Fibonacci” often appears in trading and it is likely that you have already seen or heard of it — for good reason. It is a simple measurement based on the golden ratio of 61.8%. This ratio can be observed everywhere in nature from trees to galaxy formations and is also very relevant to buying and selling behavior in markets. It is a tool you can implement in both trending and range-bound markets to help identify areas of possible support / resistance.

Time value indicator – Slope and Trend lines

One discipline I rely heavily on is pitchfork and median-line analysis. The goal of this style of analysis is to identify the slope or gradient of a given market in an attempt to highlight when a price level may be significant. It is this time value that adds another dimension to the lateral levels identified earlier – these “confluence zones” are often points in price and time that can offer major pivots in near-term price-action. Trading into / off these inflection points today form the basis of my favored technical trade setups.

Momentum value – RSI

The speed of a market can tell The Relative Strength Index (RSI). The RSI is an oscillator that is used as a measure of momentum — the speed of the recent price movement in either direction. While all oscillators are inherently backward looking, they can still be of value when you are trying to asses when the market maybe overextended in either the overbought or oversold conditions. The ability to assess the inertia of a given market is critical for near-term swing and trend trading as it offers a window into the possible longevity and strength of a given move as well as ideas on when it may expire.

Bottom line

Having a multi-faceted approach that takes into account price value, momentum value and time value could help steer you not only to possible opportunities, but also help you avoid failure. Knowing the condition of the market using price, time and momentum has been a major philosophy of my trading.

What is OPEC and What is Their Role in Global Markets?

What is OPEC and What is Their Role in Global Markets?

What is OPEC?

OPEC + is a group of oil-producing countries that controls a significant portion of the world’s oil supply. OPEC, or the Organization of Petroleum Exporting Countries, was founded in 1960 and initially consisted of just five countries: Iran, Iraq, Kuwait, Saudi Arabia, and Venezuela. Since then, the group has expanded to include 14 member countries, including Qatar, Nigeria, and Angola. In 2016, OPEC formed an alliance with 10 non-OPEC oil-producing countries, including Russia, Mexico, and Kazakhstan, to form what is now known as OPEC +. The alliance aims to manage global oil supplies to support oil prices and maintain a stable oil market.

image1.JPG

OPEC+ and Why it Was Formed?

OPEC + was formed in response to the dramatic drop in oil prices in 2014. At the time, oil prices had fallen from over $100 per barrel to below $30 per barrel. The drop in prices was due to a combination of factors, including oversupply, weak demand, and the rise of shale oil production in the United States. OPEC + was formed as a way to address the oversupply problem and stabilize prices.

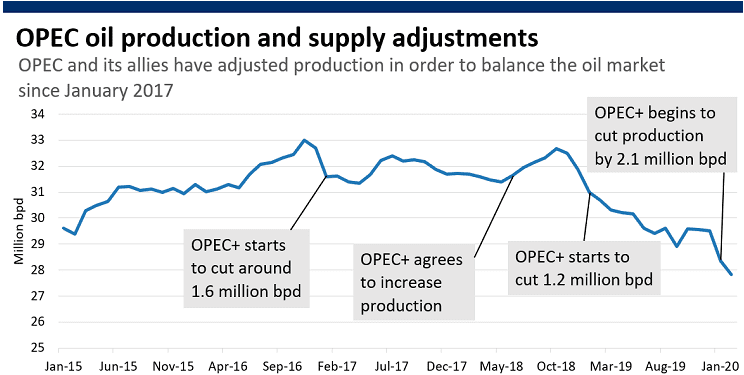
The alliance has been successful in managing global oil supplies and supporting prices. Since its formation, OPEC + has implemented production cuts to reduce global oil supplies and increase prices. For example, in 2016, OPEC + agreed to cut production by 1.8 million barrels per day. The production cuts have helped to rebalance the global oil market and support prices.

The Impact of OPEC and OPEC+ on the Global Oil Market

The impact of OPEC + on global oil markets is significant. The group controls a large portion of the world’s oil supply and has the ability to influence oil prices through its production decisions. When OPEC + reduces production, oil prices tend to increase. When the group increases production, oil prices tend to decrease.

In addition to its production decisions, OPEC + also influences oil prices through its market sentiment. The group has a strong influence on how the market perceives the state of the oil industry. When OPEC + members express confidence in the oil market, prices tend to increase. When members express concern about oversupply or weak demand, prices tend to decrease.

image2.png

*NOTE: The 2.1million bpd reduction in December 2019 includes voluntary reductions.

The influence of OPEC + on global oil markets has not been without controversy. Some critics argue that the group’s production decisions are aimed at benefiting its member countries at the expense of other countries. For example, when OPEC + reduces production, it can lead to higher oil prices, which can benefit member countries but hurt oil-importing countries.

There have also been concerns about the impact of OPEC + on the global transition to renewable energy. Some critics argue that the group’s efforts to support oil prices could delay the transition to renewable energy by making it more difficult for alternative energy sources to compete with oil.

Despite these concerns, OPEC + remains a significant player in the global oil industry. The group’s ability to manage global oil supplies and influence oil prices is likely to continue for the foreseeable future. However, the group may need to adapt to the changing energy landscape, including the growing demand for renewable energy, in order to maintain its relevance in the long term.

The Effects of Production Cuts and Increases by OPEC+

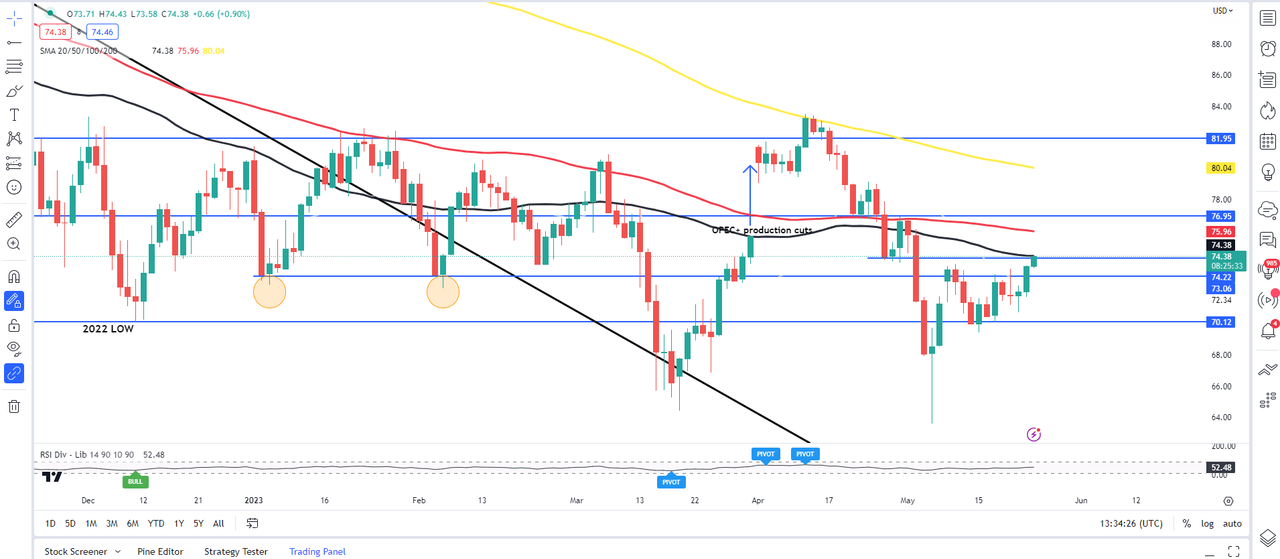
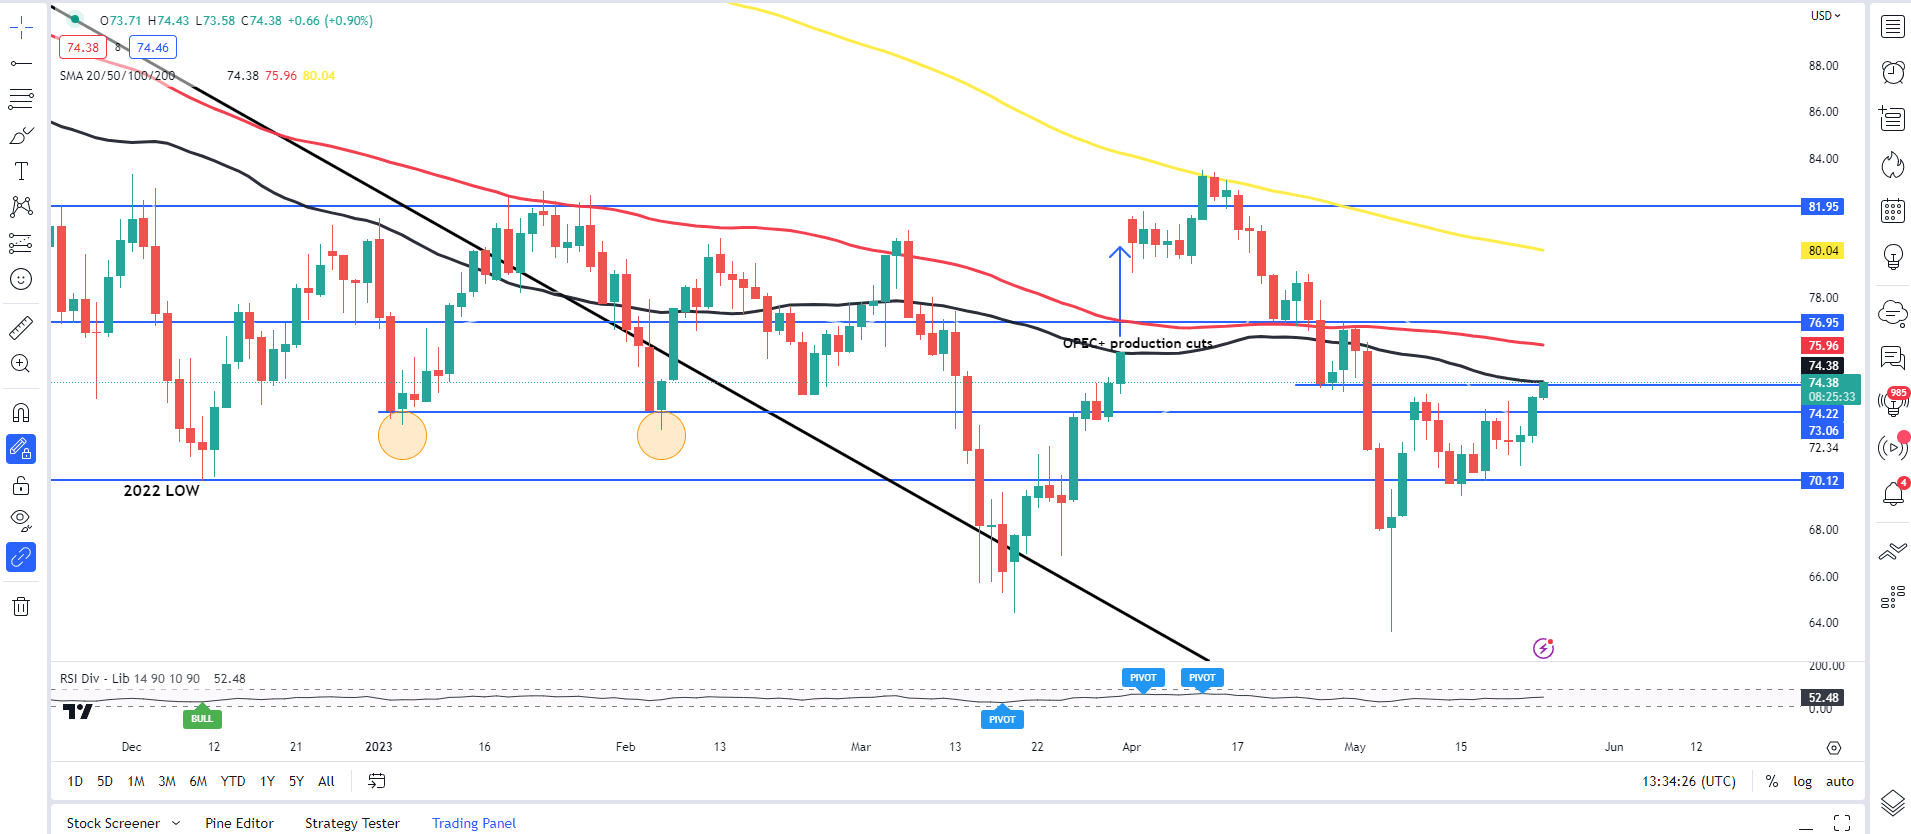
To gauge the effect OPEC + has on the oil market I have a chart below showing WTI oil on a daily chart. OPEC + announced a production cut over the weekend of March 31 to April 2, 2023. The impact saw oil prices gap higher following a Friday close around $75.60 a barrel and open around the $81.38 a barrel mark, a gain of around 7.6%.

image3.png

Summary

In conclusion, OPEC + is a group of oil-producing countries that has a significant impact on global oil markets. The group’s production decisions and market sentiment can influence oil prices, and its efforts to manage global oil supplies have helped to support prices and maintain a stable oil market. While there have been concerns about the group’s influence on the global transition to renewable energy, OPEC + remains a significant player in the global oil industry. As the energy landscape continues to evolve, the group will need to adapt to maintain its relevance in the long term.

EUR/USD Latest: Polling Data Places Marine Le Pen’s Party in Top Spot

EUR/USD Latest: Polling Data Places Marine Le Pen’s Party in Top Spot

Polling Data has Marine Le Pen’s Party Leading the Three Horse Race

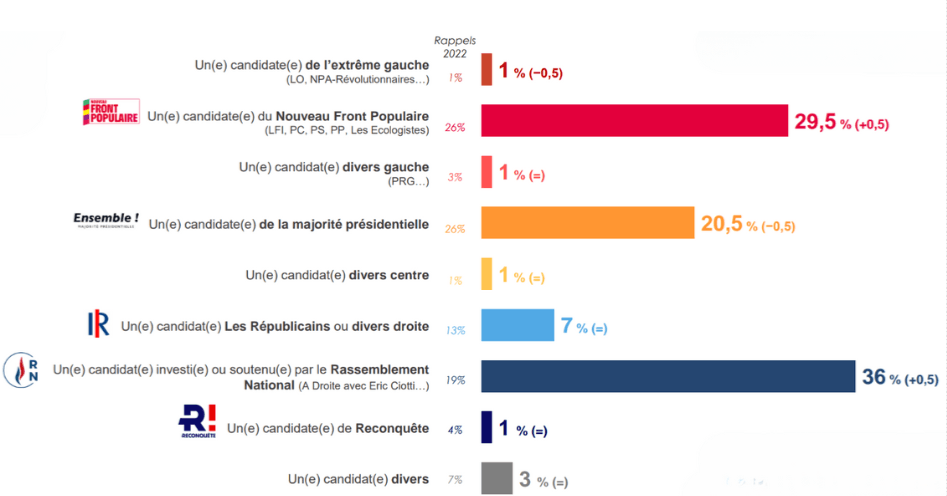
According to a recent Toluna Harris Interactive opinion poll, Marine Le Pen’s National Rally party (RN) is leading in France’s legislative election, with an estimated 33% of the vote in the first round. This figure remains unchanged from the previous survey. The pollwas published on Monday and surveyed 2,325 adults online between June 21-24.

The left-wing coalition NFP has seen a slight increase, rising one point to 27%, while President Emmanuel Macron’s party has dropped one point to 20%. Based on these projections, the National Rally could potentially secure between 215 and 245 seats in the National Assembly, with their allies led by Eric Ciotti potentially gaining an additional 15 to 30 seats.

The NFP is expected to obtain 150 to 180 seats, while Macron’s party may end up with 85 to 130 seats. The Republicans are projected to finish with a total of 30 to 50 seats in the National Assembly.

This poll confirms a significant shift seen recently in the French political landscape, with Le Pen’s far-right party gaining considerable ground in the legislative elections.

In another poll, the Ifop-Fiducial poll of voting intentions, Marine Le Pen’s party is seen as having a 36% share of the vote which would see the (RN) collect between 220-260 seats out of 577. The poll surveyed 1,843 people registered to vote from a sample of 2000 citizens between the 20th and 24th of June.

Ifop Poll of 1,834 People Registered to Vote in France shows the Three-Horse Race

image1.png

EUR/USD: Softer Dollar May Limit Downside Risks for Now

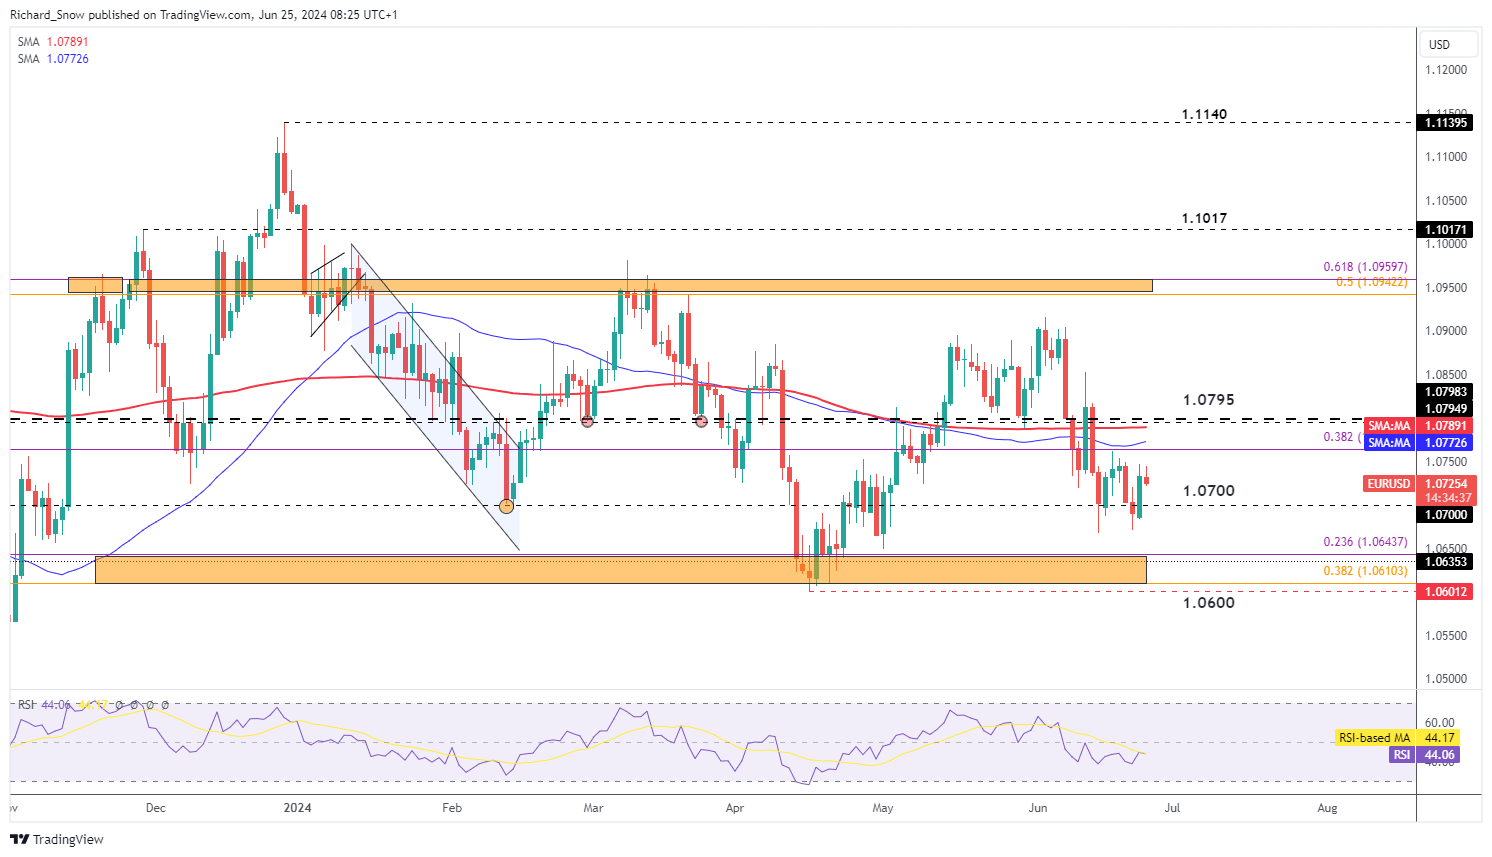
EUR/USD appears to have stabilised above the 1.0700 mark for the time being. Markets have a tendency to get nervous when political uncertainty presents itself, but polls have all been pointing to the same result for some time now – a fractured parliament with Marine Le Pen’s party likely to receive the majority of the vote but falling short of attaining a majority in parliament.

Despite the recent consolidation, EUR/USD trades below the 200 SMA with the lower bound of the pair’s broad range coming in at 1.0643 and the April swing low at 1.0600 flat. US GDP data and PCE on Friday are notable events on the calendar, with PCE carrying considerable more weight as it could validate the encouraging CPI data seen recently in the US (potentially bearish for the dollar).

EUR/USD Daily Chart

image2.png

Bond Spreads in View Ahead of Sundays First Round of Elections

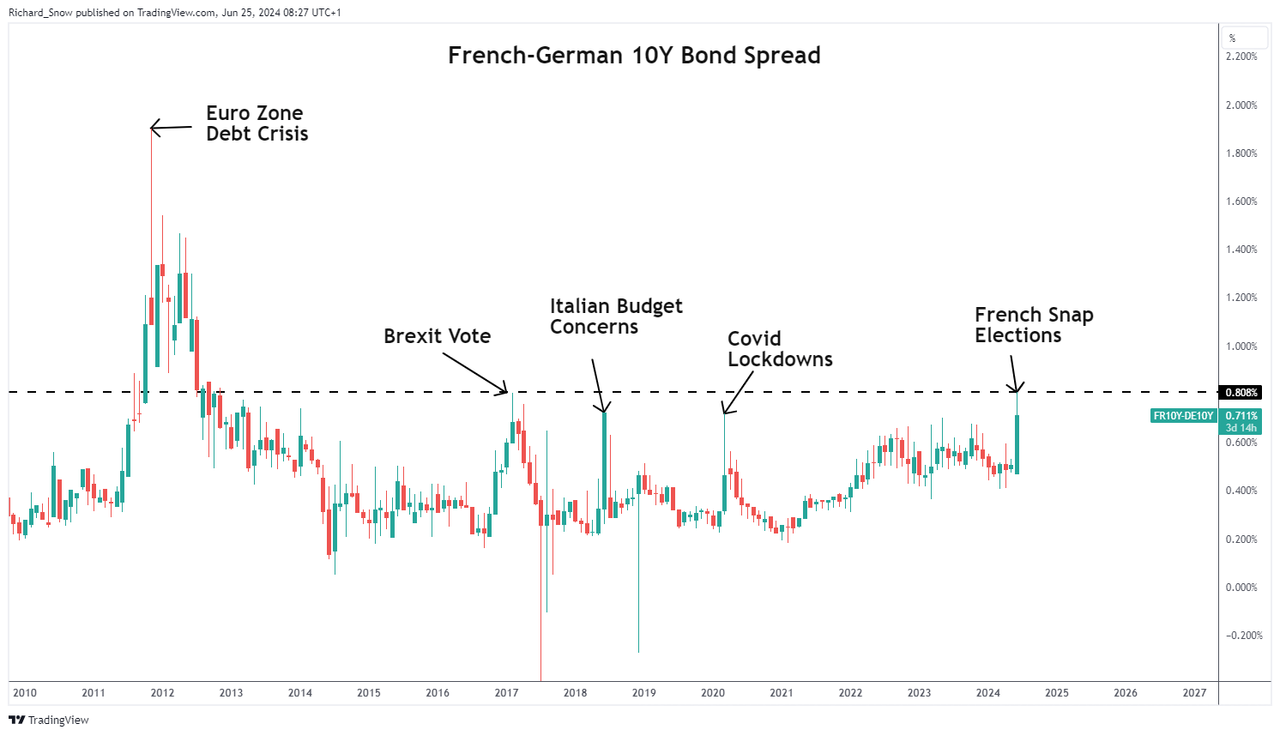
European bond yields will gain attention ahead of Sunday’s first round of votes in France. Riskier, more debt laden nations tend to see their borrowing costs surge higher in times of uncertainty – as has been witnessed in the French-German 10-year spread which rose substantially to around 80 basis points after the snap election was announced. If contagion effects resurface, the euro may come under renewed pressure as the single currency has a tendency of selling off when EU bond spreads widen significantly.

French-German 10 Year Spread

image3.png