DAX Index, FTSE 100, STOXX 600: Steady Trade after BP’s Missed Earnings Ahead of Euro Zone CPI, GDP Data

DAX Index, FTSE 100, STOXX 600: Steady Trade after BP’s Missed Earnings Ahead of Euro Zone CPI, GDP Data

European Markets React to Data and Earnings

European markets exhibited a mixed response at the opening, swaying cautiously upwards after a subdued beginning, particularly influenced by a series of economic data releases and corporate earnings announcements. The Stoxx 600, after beginning the day on a flat note, found itself trading 0.24% higher. Meanwhile, Germany’s DAX Index is up 0.37%.

However, there’s a shadow looming over its monthly performance, with a forecasted decline of 4.24% for October. This paints a gloomier picture as it’s touted to be its worst drop since September 2022.

Trading Derivatives carries a high level of risk to your capital and you should only trade with money you can afford to lose. Trading Derivatives may not be suitable for all investors, so please ensure that you fully understand the risks involved, and seek independent advice if necessary. A Product Disclosure Statement (PDS) can be obtained either from this website or on request from our offices and should be considered before entering into a transaction with us. Raw Spread accounts offer spreads from 0.0 pips with a commission charge of USD $3.50 per 100k traded. Standard account offer spreads from 1 pips with no additional commission charges. Spreads on CFD indices start at 0.4 points. The information on this site is not directed at residents in any country or jurisdiction where such distribution or use would be contrary to local law or regulation.

Two significant reports are keenly anticipated – Euro Zone Core CPI Flash Estimate, hinting at a softening from 4.5% to 4.2%, and Euro Zone flash GDP, projected at a stagnant 0.0%, a slide from the previous 0.1%.

Sectoral Dynamics and Stock Highlights

The energy sector, specifically oil and gas stocks, painted a red portrait, registering a dip of 1.26%, with BP’s third-quarter performance falling short of profit estimates as a significant factor.

French economic indicators revealed an inflation of 4% YoY for October, and the country’s GDP exhibited a modest growth of 0.1% for Q3.

Contrastingly, Germany’s inflation for October was recorded at 3.8%, the lowest since August 2021.

On the brighter side, European shares, fueled by the real estate and chemical sectors, saw an upward curve, despite BP’s lackluster profit figures exerting pressure on the energy domain.

Key Corporate Moves and Forecasts

BP’s shares took a blow, plunging by 4.6%, largely due to a dip in energy prices YoY, which led to a missed Q3 earnings estimate.

In the midst of these market dynamics, engineering giant Wartsila emerged as the top performer on the STOXX 600 post its Q3 revelations.

Another significant move observed was Siemens Energy contemplating a partial stake sale in Siemens Ltd, with an aim to reinforce its balance sheet.

FTSE’s Resilience Amid Energy Sector Woes

Across the English Channel, the FTSE 100 showcased resilience, maneuvering its trajectory upwards despite BP’s subpar performance casting shadows on the energy sector. This decline was counteracted by surges in the aerospace and defense sectors, particularly buoyed by an upgraded rating for Rolls Royce by Barclays. While BP’s shares faced the brunt, Rolls Royce saw its shares soaring by nearly 4%. On the economic front, British retail chains signaled a slowdown in price hikes for October.

Short-term Market Outlook

Given the volatility induced by economic data releases and corporate earnings reports, the European markets, especially DAX and STOXX, might sail on choppy waters in the short term.

However, the underlying strength in sectors outside energy, like real estate and chemicals, suggests a slightly bullish tilt.

On the other hand, FTSE’s ability to offset declines in one sector with gains in another highlights its robustness, projecting a bullish sentiment for the near future.

DAX Index Technical Analysis
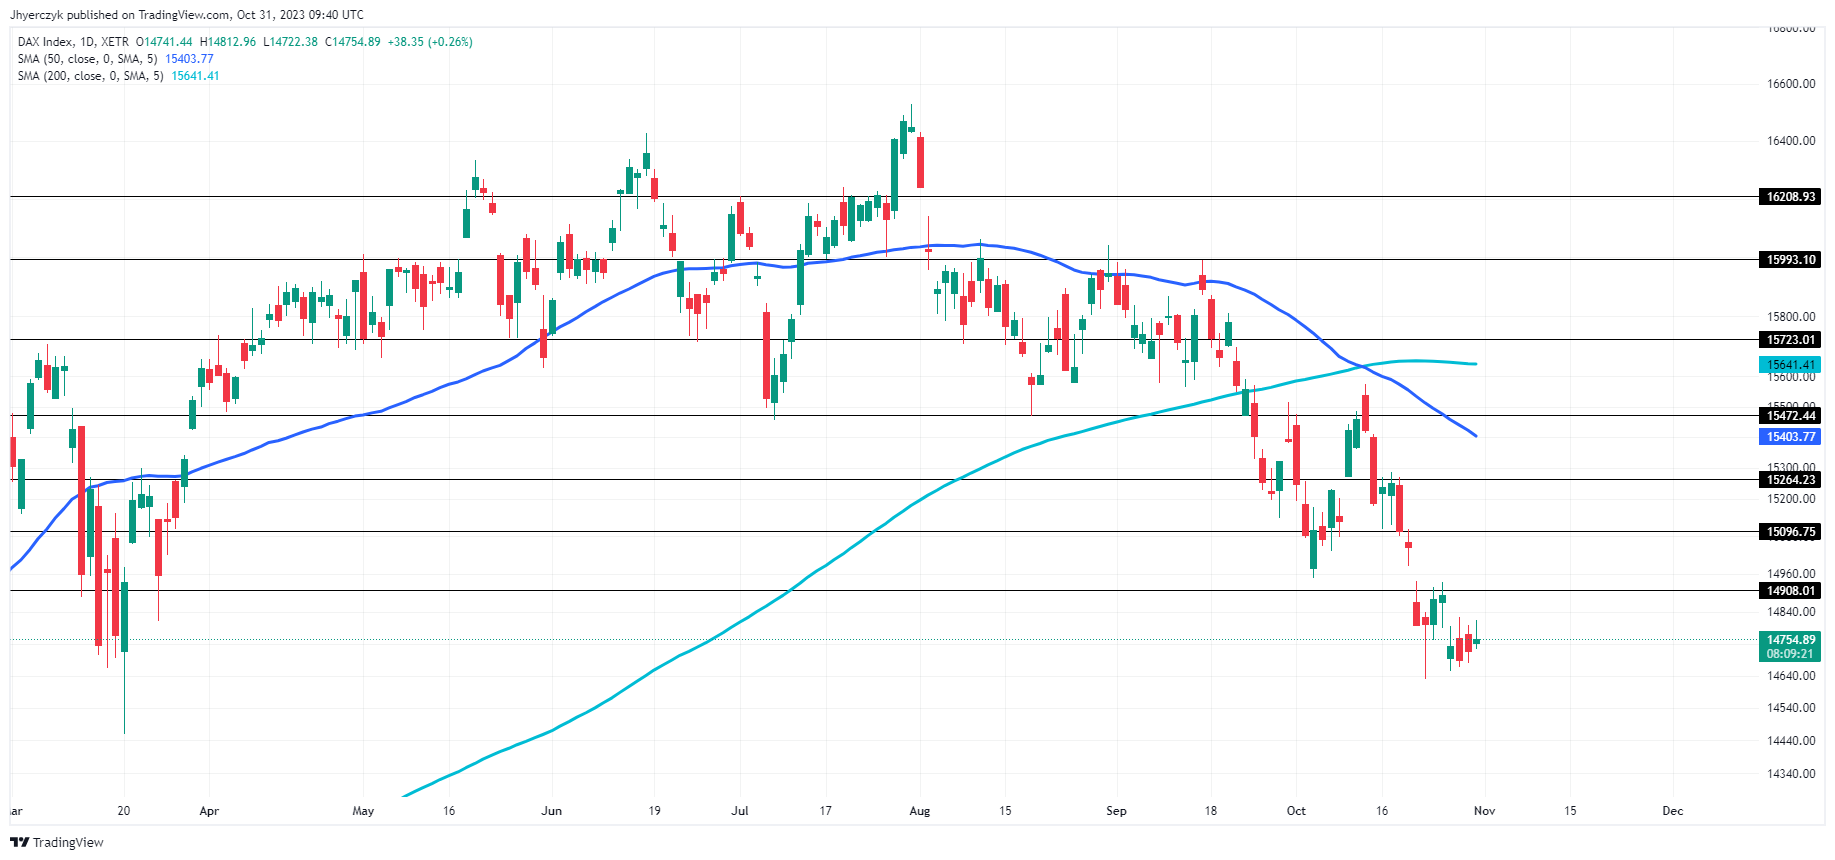
Daily DAX IndexThe DAX Index’s current daily price of 14749.07 stands slightly above its previous close, indicating a modest intraday gain. While this price resides below both the 200-day moving average (15641.39) and the 50-day moving average (15403.70), suggesting a broader bearish sentiment, the proximity of the daily price to the minor resistance level at 14908.01 hints at potential upside momentum.

However, surpassing the main resistance at 15096.75 is crucial for a bullish reversal. Given its current position relative to key moving averages and resistance levels, the DAX Index exhibits a bearish market sentiment in the short term. This condition will continue until it starts to show strength by overcoming resistance.

FTSE 100 Technical Analysis
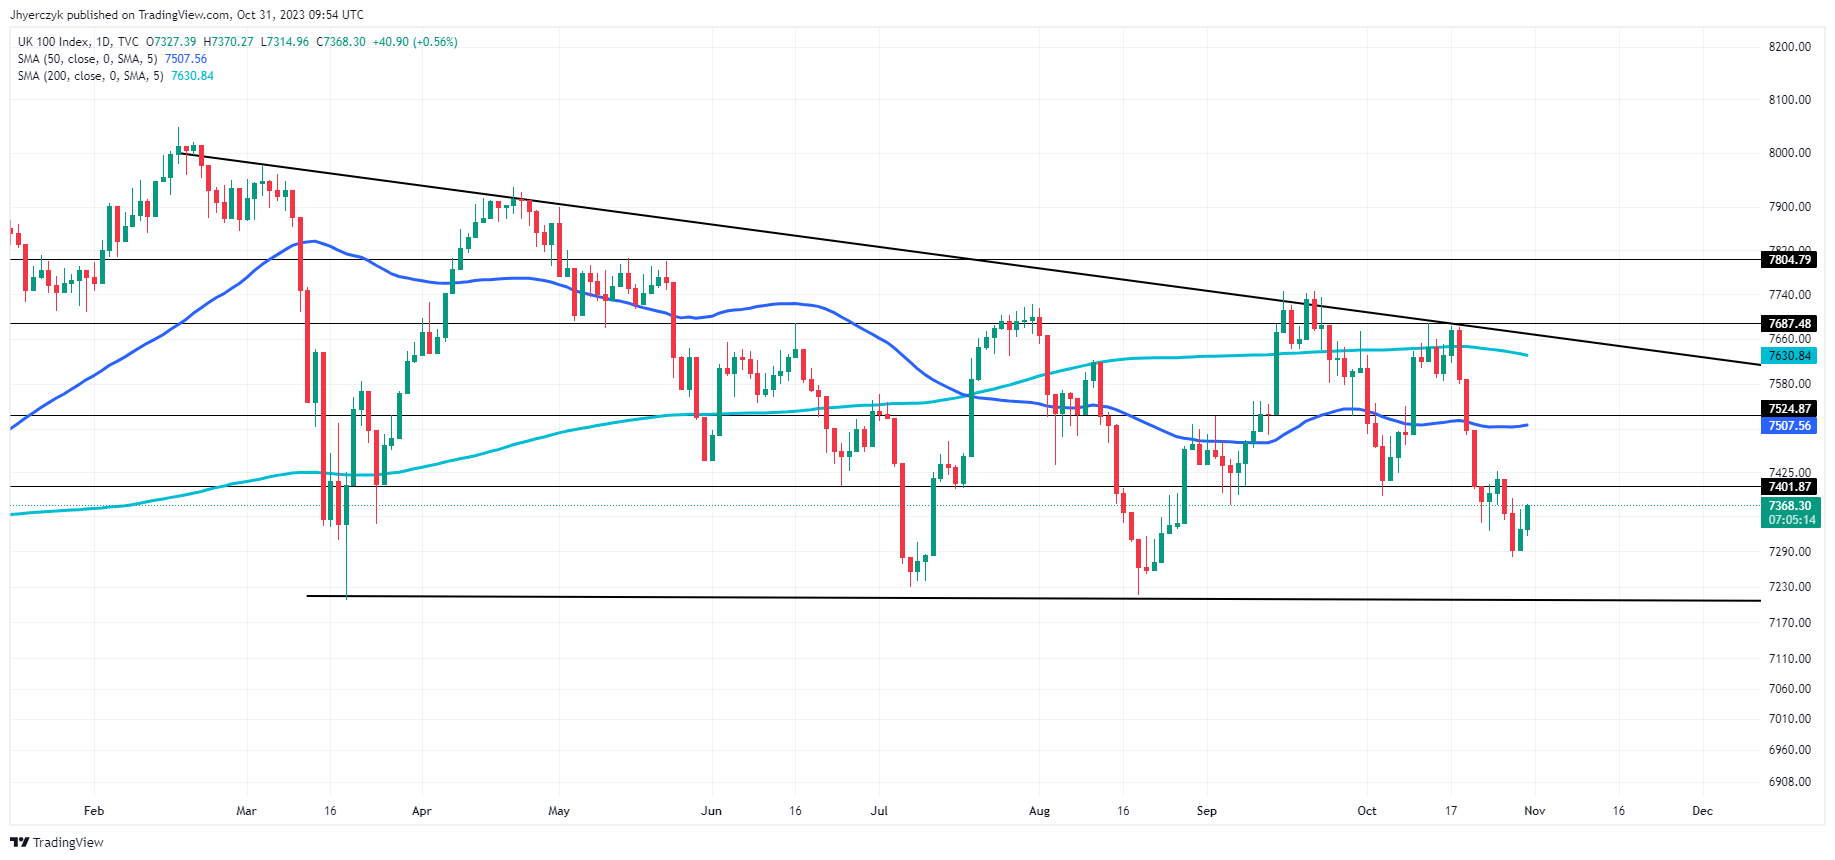
Daily FTSE 100The FTSE 100 Index’s current daily price of 7370.81 is positioned below both the 200-day moving average (7630.84) and the 50-day moving average (7507.58), suggesting bearish sentiment.

However, the index is trading above the trend line support at 7200.00, indicating some underlying strength.

he near-term challenge for the index is to overcome the minor resistance at 7401.87, with a more formidable barrier awaiting at the main resistance level of 7524.87.

The proximity to the trend line resistance at 7668.16 further signifies potential upside hurdles. Overall, the FTSE 100 demonstrates a bearish bias but with potential for bullish reversals if key resistance levels are breached.

Euro Area Inflation Dips, GDP Shows Contrasting Moves in October

Euro Area Inflation Dips, GDP Shows Contrasting Moves in October

Euro Area CPI Slows in October 2023

In today’s flash estimate by Eurostat, the Euro area annual inflation rate for October 2023 is projected to be 2.9%, marking a decline from September’s 4.3%. This slowdown in inflation comes as multiple components within the CPI exhibit differing trends.

Breaking Down the Components

Food, alcohol, and tobacco lead the main components of Euro area inflation, albeit at a slightly reduced rate. The estimate for October stands at 7.5%, down from 8.8% in September. Services, another significant segment, is also expected to see a marginal dip at 4.6% in October from 4.7% the previous month. Non-energy industrial goods show a similar trend, projected at 3.5% for October compared to 4.1% in September.

Energy Prices Pulling Back

Interestingly, energy prices demonstrate the most significant shift. Energy is expected to have an annual rate of -11.1% in October, a drastic change from -4.6% in September. This sharp decline reflects the broader challenges facing energy markets and the subsequent impact on inflation figures.

Euro Area GDP Shows Mixed Signals

The GDP dynamics for the third quarter of 2023 present a mixed picture for the Euro area and the EU. Eurostat’s preliminary flash estimate provides insights into the economic performance of these regions compared to previous quarters.

GDP Movement Across Regions

In the third quarter of 2023, the Euro area saw a seasonally adjusted GDP contraction by 0.1%. In contrast, the EU experienced a growth of 0.1%. This is a modest increase in the EU compared to the third quarter of 2022, where there was a 0.1% rise in both areas.

Comparison to Previous Quarters

The second quarter of 2023 had painted a slightly different picture. The GDP had grown by 0.2% in the Euro area during this period, while the EU’s GDP remained stable, showcasing no significant changes.

Outlook

The overall trend indicates a cooling off of economic activity in the Euro area while the EU maintains a steady, albeit slow, growth trajectory. Given the data at hand, the short-term forecast suggests a bearish outlook for the Euro area, while the EU might continue to tread water with slight positive inclines.

Gold Price’s Suspicious Daily Rally

Gold Price’s Suspicious Daily Rally

Cause for Celebration or Caution?

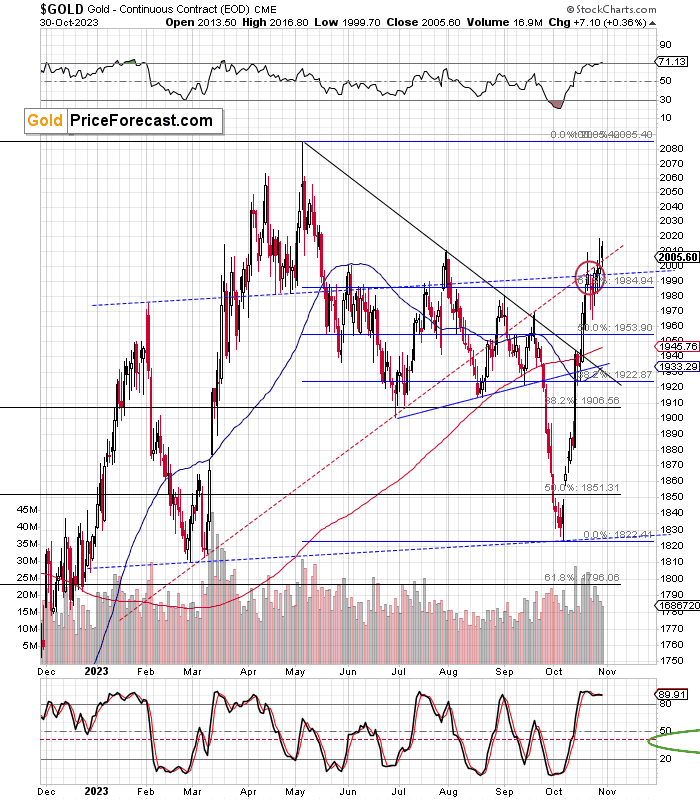
There are a few things about yesterday’s move higher that make it suspicious. Two of them are visible directly on gold’s chart.

Gold Price’s Suspicious Daily Rally - Image 1

The yellow precious metal moved above the late-July high and… It failed to hold this breakout. Since invalidations of breakouts are sell signals on their own – we just got one, which doesn’t fit the bullish narrative.

Trading Derivatives carries a high level of risk to your capital and you should only trade with money you can afford to lose. Trading Derivatives may not be suitable for all investors, so please ensure that you fully understand the risks involved, and seek independent advice if necessary. A Product Disclosure Statement (PDS) can be obtained either from this website or on request from our offices and should be considered before entering into a transaction with us. Raw Spread accounts offer spreads from 0.0 pips with a commission charge of USD $3.50 per 100k traded. Standard account offer spreads from 1 pips with no additional commission charges. Spreads on CFD indices start at 0.4 points. The information on this site is not directed at residents in any country or jurisdiction where such distribution or use would be contrary to local law or regulation.

The second problem with yesterday’s upswing is the position of the RSI indicator. It’s above 70, suggesting extremely overbought conditions. RSI at those levels marked shorting opportunities many times in the past, and this time doesn’t seem really different.

Silver’s Surge Outpaces Gold

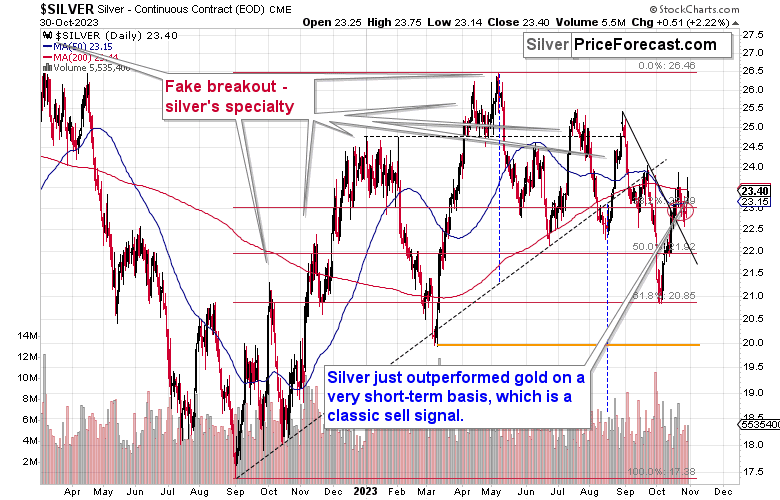
The two other confirmations come from outside of the gold price chart itself. The first one comes from the silver price.

Gold Price’s Suspicious Daily Rally - Image 2

The thing is that silver just rallied much more significantly than gold did. Yesterday’s sessions’ results were: gold ended the day 0.36% higher, and silver ended the day 2.22% higher. Silver’s outperformance was crystal clear.

Seems bullish? It’s not.

Silver price tends to outperform the one of gold close to – or right at – local tops. In fact, I’d say that it might be the most important of the silver trading tips that one can use (but that’s rarely covered by most analysts).

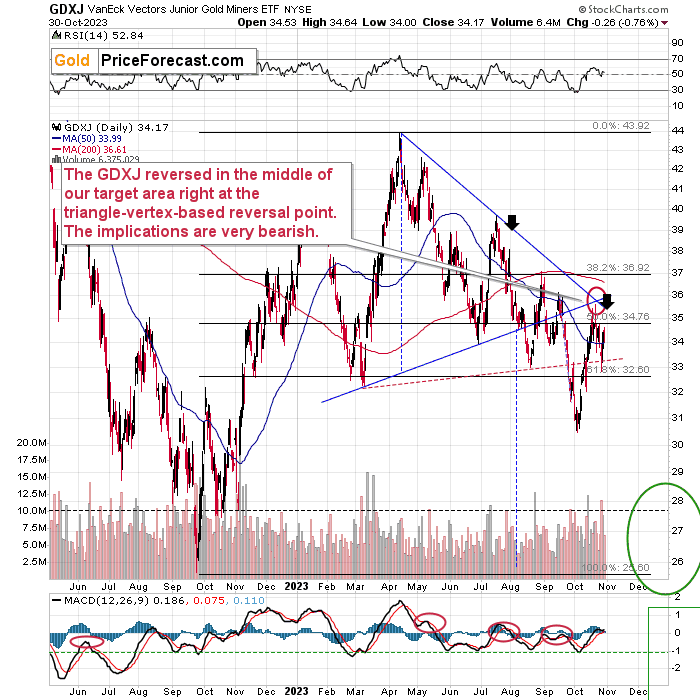
The relative performance works in the opposite way in the case of the mining stocks – gold link. In this case, miners’ underperformance is what has bearish implications. And guess what…

Gold Price’s Suspicious Daily Rally - Image 3

Mining stocks (the GDXJ ETF serves as a proxy for junior mining stocks) just declined by 0.76% yesterday. That’s not a lot, but given that gold ended the day in the green, it’s really significant.

If miners had a good reason to decline in the form of lower stock market prices (after all, mining stocks are… stocks too), this kind of performance would be understandable.

That was not the case.

Gold Price’s Suspicious Daily Rally - Image 4

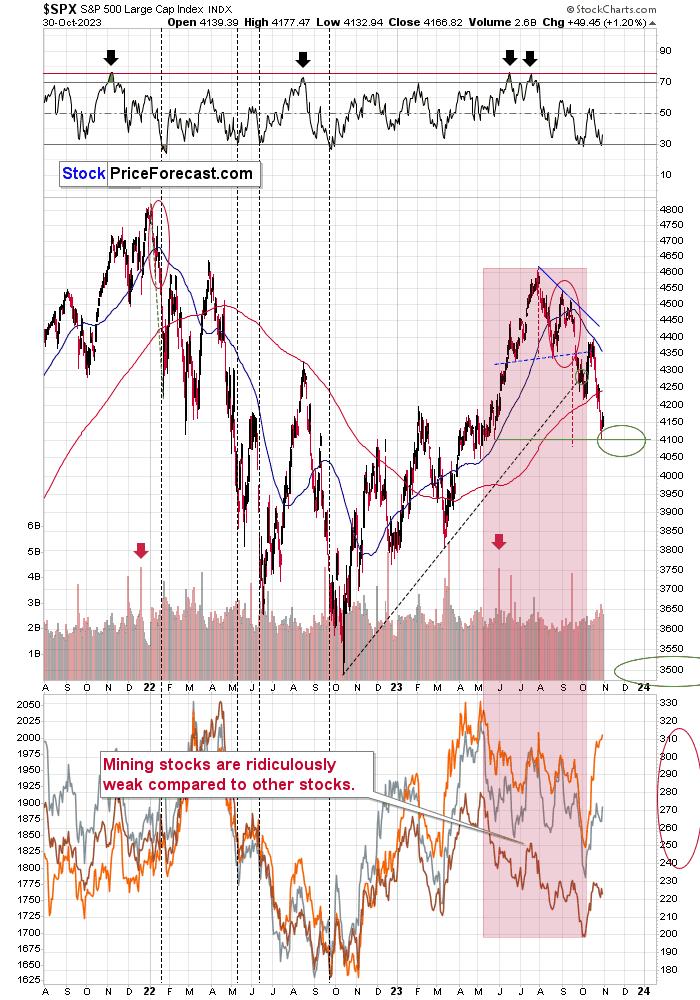
The S&P 500 Index moved slightly higher yesterday after reaching the previous target price that I based on the head-and-shoulders pattern.

So, since it wasn’t the weakness in stocks that caused miners to be weak yesterday, then it means that the precious metals sector really does want to decline from here, and gold’s move above $2,000 should not be trusted.

In other words, it seems that profits on our short positions, i.a. in junior mining stocks, will become even more profitable in the not-too-distant future.

Nasdaq 100, Dow Jones, S&P 500 News: Stock Futures Show Mixed Sentiment Ahead of Pfizer Earnings

Nasdaq 100, Dow Jones, S&P 500 News: Stock Futures Show Mixed Sentiment Ahead of Pfizer Earnings

Performance Overview

U.S. major stock index futures exhibited a mixed sentiment early Tuesday, coming after a relief rally witnessed in the previous session. At 08:02 GMT, the S&P 500 futures slightly dipped by 0.21%, with Nasdaq 100 futures shedding 0.43%. Meanwhile, futures of the Dow Jones Industrial Average decreased by a mere 3 points, or 0.01%.

Notably, Monday’s performance saw the S&P 500 climb 1.2%, exiting correction territory, marking its best day since late August. The Nasdaq Composite also increased by 1.2%, while the Dow experienced a jump of roughly 1.6%, its strongest since early June.

Trading Derivatives carries a high level of risk to your capital and you should only trade with money you can afford to lose. Trading Derivatives may not be suitable for all investors, so please ensure that you fully understand the risks involved, and seek independent advice if necessary. A Product Disclosure Statement (PDS) can be obtained either from this website or on request from our offices and should be considered before entering into a transaction with us. Raw Spread accounts offer spreads from 0.0 pips with a commission charge of USD $3.50 per 100k traded. Standard account offer spreads from 1 pips with no additional commission charges. Spreads on CFD indices start at 0.4 points. The information on this site is not directed at residents in any country or jurisdiction where such distribution or use would be contrary to local law or regulation.

Earnings Season and October Performance

Despite Monday’s positive performance, the major indexes remain set to conclude October with losses. The Dow and the S&P 500 are witnessing declines of 1.7% and 2.8% respectively, entering their third successive negative month – a trend unseen since March 2020.

Similarly, the tech-focused Nasdaq has experienced a decline of over 3% this month, also approaching its third consecutive negative close. In the midst of these market movements, investors are anticipating October’s payroll report due on Friday, seeking signs of a potential slowdown in the labor market.

Fed Decision and Rate Outlook

Investors remain watchful of the Federal Reserve’s impending interest rate decision this Wednesday. Current data from the CME FedWatch Tool indicates a 98% likelihood of the central bank maintaining the rates at their present levels. Some speculate this might translate to a bullish market sentiment, especially after Fed Chair Powell hinted that the rise in Treasury yields could imply a halt in tightening.

Earnings Highlights: Caterpillar, Pfizer

Attention turns to the upcoming earnings reports, with traders particularly interested in results from Caterpillar, Pfizer, Caesars Entertainment, and chipmaker Advanced Micro Devices.

Caterpillar, despite its consistent quarterly earnings beats, has a history of underwhelming investors post-earnings. Yet, analysts remain optimistic, expecting another strong report.

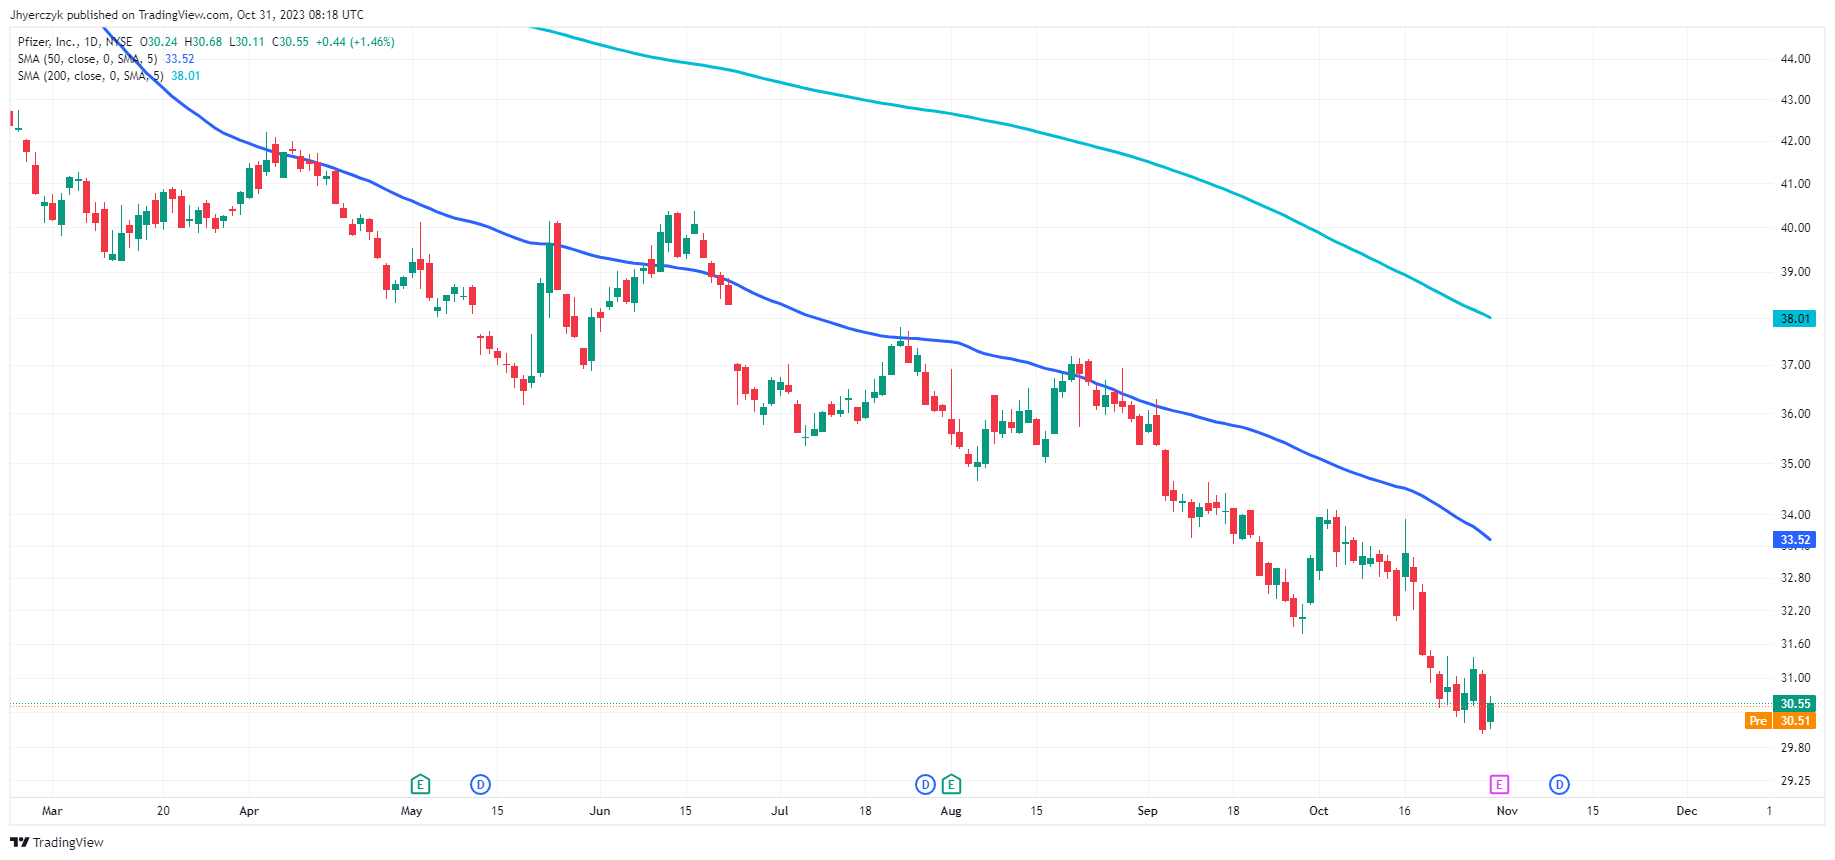
Daily Pfizer (PFE)Pfizer, on the other hand, recently lowered its 2023 outlook due to reduced vaccination rates and a lukewarm response to its Paxlovid COVID pill. Despite this, the company has maintained an unblemished track record in surpassing both EPS and revenue estimates over the past two years.

Short-term Forecast

Given the current market dynamics, earnings reports, and anticipated announcements from the Federal Reserve, the near-term outlook for the U.S. stock market appears mixed. However, with crucial earnings releases around the corner, especially from giants like Apple, the narrative could quickly shift either bullish or bearish.

Technical Analysis

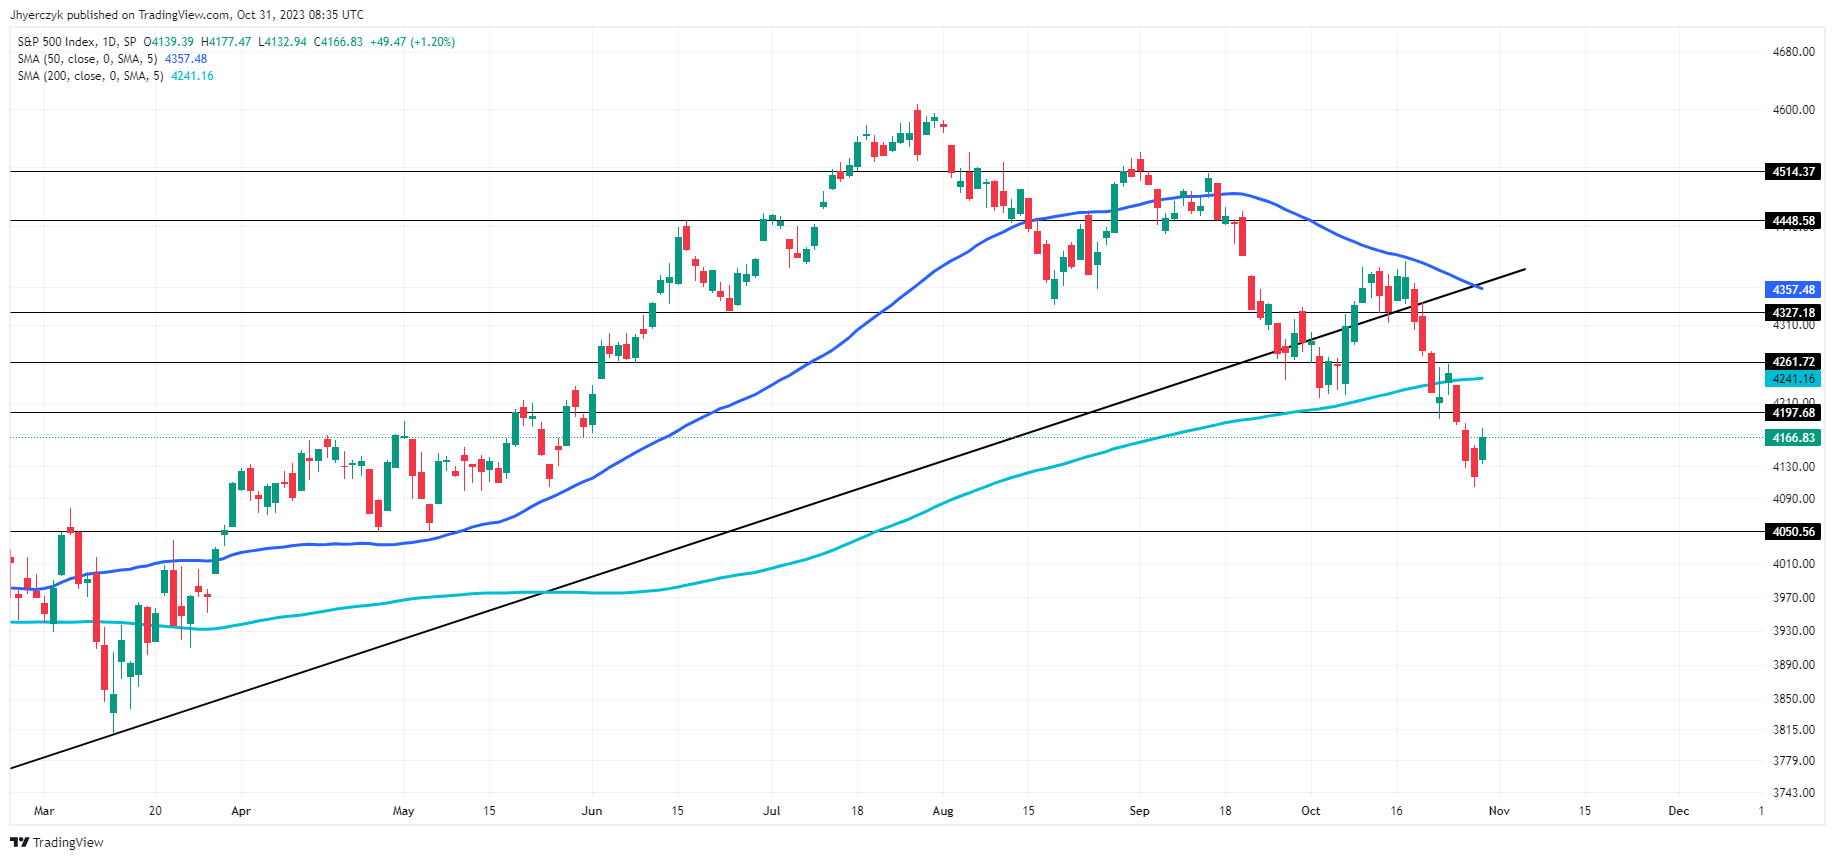
Daily S&P 500 Index (SPX)The S&P 500 (SPX) closed at 4166.83, above its previous close of 4117.36, indicating an uptrend for the day.

Despite this positive move, it remains positioned below both the 50-day and 200-day moving averages, at 4357.48 and 4241.16 respectively, hinting at an overall bearish momentum.

The index sits above the minor support level of 4050.56, yet is still beneath the minor resistance of 4197.68. With the main resistance level pegged at 4261.72, the SPX has considerable space to appreciate before encountering significant resistance.

Considering its standing in relation to key moving averages and support/resistance levels, the prevailing market sentiment for SPX appears to be bearish.

Bitcoin Triangle and Altcoin Growth

Bitcoin Triangle and Altcoin Growth

Bitcoin’s Steady Hold at $34.3K and the Altcoin Rally

The value of bitcoin has changed little over the past 24 hours, remaining at $34.3K – in the centre of the consolidation range of the past seven days. This ability to hold at new, much higher levels is inspiring altcoin buyers, and the market capitalisation of the entire market has increased by 0.6% over the past 24 hours.

Bitcoin is forming a triangle on the daily chart. It is generally believed that such consolidation formations end with an upward breakout. Confirmation, in this case, would be an exit above $35K.

Trading Derivatives carries a high level of risk to your capital and you should only trade with money you can afford to lose. Trading Derivatives may not be suitable for all investors, so please ensure that you fully understand the risks involved, and seek independent advice if necessary. A Product Disclosure Statement (PDS) can be obtained either from this website or on request from our offices and should be considered before entering into a transaction with us. Raw Spread accounts offer spreads from 0.0 pips with a commission charge of USD $3.50 per 100k traded. Standard account offer spreads from 1 pips with no additional commission charges. Spreads on CFD indices start at 0.4 points. The information on this site is not directed at residents in any country or jurisdiction where such distribution or use would be contrary to local law or regulation.

Ethereum followed Bitcoin’s lead and broke out above its 200-week MA after a few weeks below it, breaking the shorter-term downtrend. In other similar cases, we’ve seen some solid and sustained gains. The rebound from the drop below $1500 has confirmed a long-term broad uptrend, with the upper boundary now near $2400. The bulls are likely targeting this upper bound.

CoinShares said crypto fund investments rose by $326 million last week, the fifth consecutive week of inflows. Bitcoin investments rose by $296 million, while Ethereum investments fell by $6 million. Investment in Solana increased by $24 million.

Crypto News

The difficulty of mining Bitcoin has reached an all-time high. According to another recalculation, it has increased by 2.34%, up 76.6% YTD to a new record of 62.46T. The average Bitcoin network hash rate at the current difficulty level is expected to be 449.68 EH/s, also a record.

Investment firm VanEck has filed an updated application with the US Securities and Exchange Commission (SEC) to launch a spot bitcoin ETF. The regulator has previously rejected similar applications from VanEck three times.

VanEck admitted that the Solana blockchain will be the first network to reach 100 million users, and the value of its SOL coin will grow from $32 to a maximum of $3211 by 2030. A conservative growth estimate is $335.

JPMorgan expects the SEC to approve many applications for spot bitcoin ETFs within the next two months.

The UN highlighted the correlation between the Bitcoin price and the network’s energy consumption. The 400% increase in the price of the first cryptocurrency in 2020-2021 was accompanied by a 140% increase in the energy used to mine it.

Bitrace named popular ways to steal bitcoins. Cybercriminals use three main methods to steal digital assets: fake applications, clipboard address spoofing and liquidity fraud.

EUR/USD: Eurozone GDP and Inflation in Focus Before Key US Economic Indicators

EUR/USD: Eurozone GDP and Inflation in Focus Before Key US Economic Indicators

Monday Overview

The EUR/USD gained 0.47%. Reversing a 0.03% loss from Friday, the EUR/USD ended the day at $1.06151. The EUR/USD fell to a low of $1.05472 before rising to a high of $1.06252.

German Retail Sales and Eurozone Economic Indicators in Focus

On Tuesday, German retail sales will garner investor interest. German private consumption accounts for over 50% of the German economy. A surprise decrease in consumption could indicate signs of a prolonged recession. Economists forecast retail sales to rise by 0.5% in September vs. a 1.2% decline in August.

Trading Derivatives carries a high level of risk to your capital and you should only trade with money you can afford to lose. Trading Derivatives may not be suitable for all investors, so please ensure that you fully understand the risks involved, and seek independent advice if necessary. A Product Disclosure Statement (PDS) can be obtained either from this website or on request from our offices and should be considered before entering into a transaction with us. Raw Spread accounts offer spreads from 0.0 pips with a commission charge of USD $3.50 per 100k traded. Standard account offer spreads from 1 pips with no additional commission charges. Spreads on CFD indices start at 0.4 points. The information on this site is not directed at residents in any country or jurisdiction where such distribution or use would be contrary to local law or regulation.

However, Eurozone GDP and inflation figures may have more influence on the EUR/USD. Better-than-expected GDP numbers could ease fears of a prolonged euro area recession. Economists forecast the Eurozone economy to stall in Q3 vs. 0.1% growth in the previous quarter.

Inflation figures also need consideration. A significant drop in consumer prices could alleviate the pressure on the ECB to maintain higher interest rates for an extended period. Economists forecast the Eurozone annual inflation rate to soften from 4.3% to 3.2%. However, economists expect core inflation to remain sticky.

Sticky core inflation and better-than-expected GDP figures would enable the ECB to maintain a hawkish rate path. An elevated interest rate environment impacts borrowing costs and disposable income. A downward trend in disposable income could impact consumption, easing demand-driven inflationary pressure.

US Employment Costs and Consumer Confidence in the Spotlight

On Tuesday, US employment costs need consideration. A pickup in employment costs would signal higher wages and disposable income. An upward trend in disposable income could fuel consumption and demand-driven inflationary pressures, forcing a more hawkish Fed rate path. A more hawkish Fed rate path would increase borrowing costs, impacting disposable income and consumption.

Later in the session, investors will closely watch consumer confidence. A more marked decline in confidence would likely drive buyer appetite for the EUR/USD. Economists forecast the CB Consumer Confidence Index to decline from 103.0 to 100.0 in October.

A deteriorating consumer confidence backdrop would signal a pullback in consumer spending.

Short-Term Forecast:

Near-term EUR/USD trends hinge on the Fed and its economic, inflation, and interest rate outlook. A hawkish Fed (Wed) and a hotter-than-expected US Jobs Report (Fri) could send the EUR/USD to sub-$1.05.

EUR/USD Price Action

Daily Chart

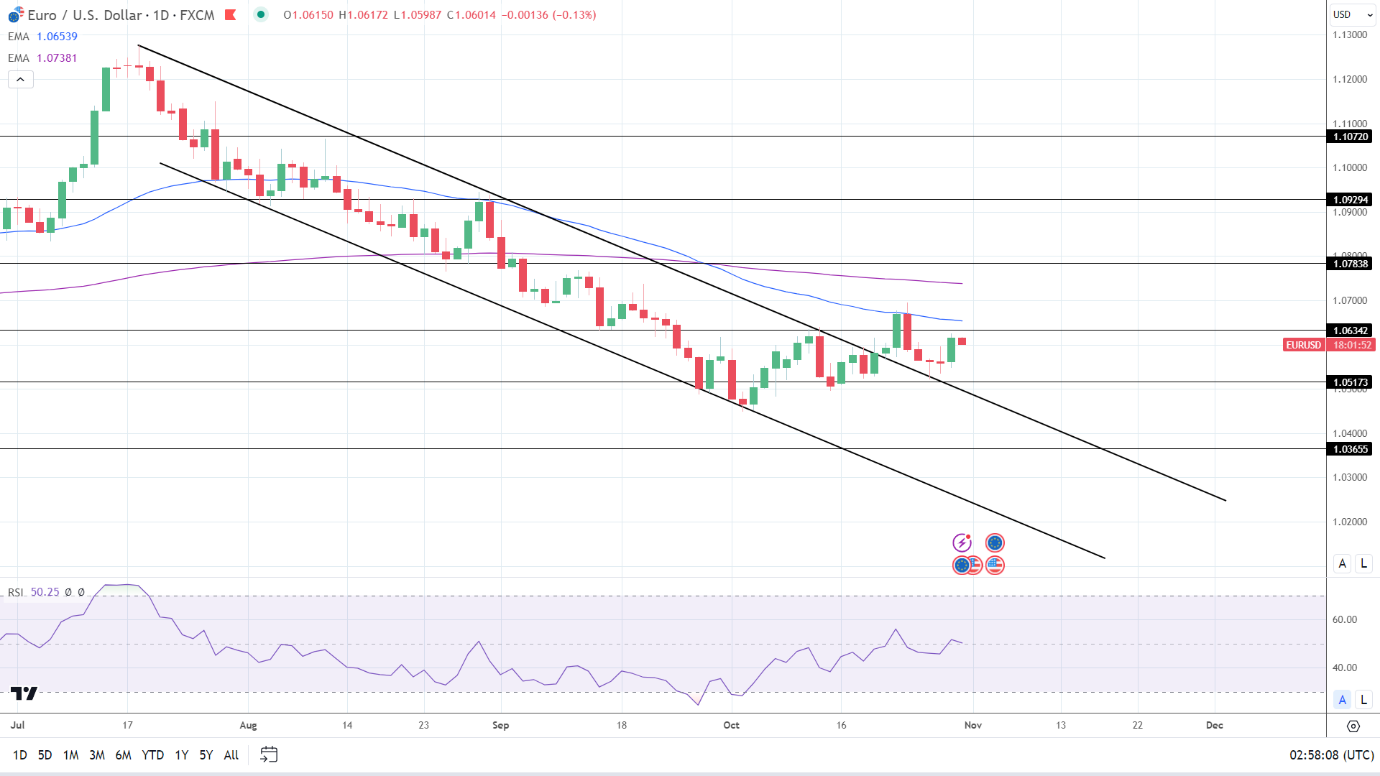
The EUR/USD remained below the 50-day and 200-day EMAs, sending bearish price signals.

A EUR/USD move through the $1.06342 resistance level would support a break above the 50-day EMA. Eurozone and US economic indicators will be focal points ahead of the Fed interest rate decision on Wednesday.

However, a EUR/USD fall through the $1.05173 support level would bring sub-$1.05 and the trend line into play.

The 14-period Daily RSI, 50.25, suggests a EUR/USD break above the 50-day EMA before entering overbought territory.

EUR/USD Daily Chart sends bearish price signals.
EURUSD 311023 Daily Chart

4-Hour Chart

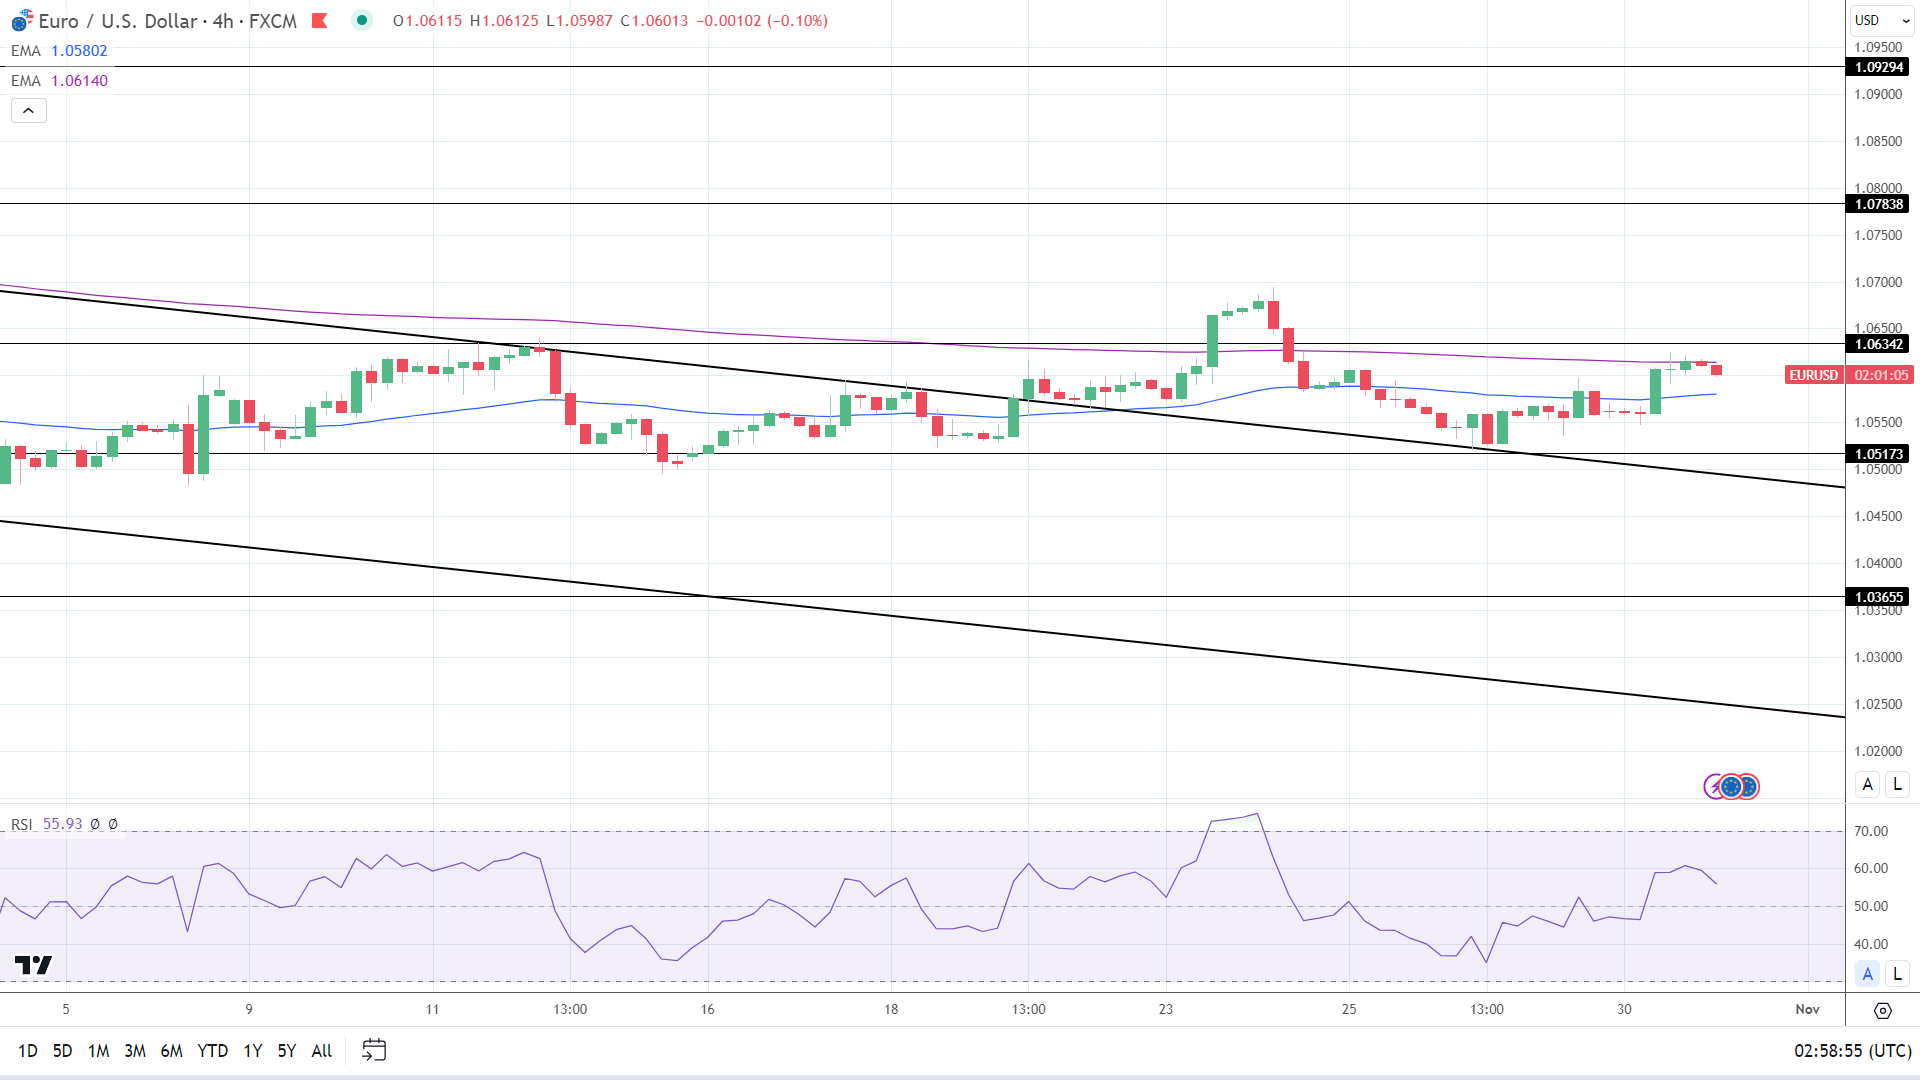
The EUR/USD sits above the 50-day EMA while sitting below the 200-day EMA, sending bullish near-term but bearish longer-term price signals.

A EUR/USD break above the 200-day EMA would support a move to the $1.06342 resistance level.

However, failure to move through the 200-day EMA would give the bears a run at the 50-day EMA and the $1.0550 handle.

The 14-period RSI on the 4-hour chart, 55.93, indicates a EUR/USD break above the $1.06342 resistance level before entering overbought territory.

4-Hourly Chart sends bullish near-term price signals.
EURUSD 311023 4 Hourly Chart
Oil Prices Forecast: Geopolitical Strains, China’s Slowing Economy Upend Markets

Oil Prices Forecast: Geopolitical Strains, China’s Slowing Economy Upend Markets

Geopolitical Factors at Play

After a slump of more than 3% in Monday’s session, oil prices regained some ground in Asian markets on Tuesday. December Brent crude futures rose 36 cents to $87.81 a barrel, while January contracts edged up 29 cents to $86.64. U.S. West Texas Intermediate (WTI) for December followed suit, increasing 34 cents to $82.65 a barrel. These gains were primarily driven by mounting concerns over supply, as the geopolitical unrest in the Middle East, particularly Israel’s escalated attacks on Gaza, stoked fears.

Federal Reserve and Market Sentiment

Investor caution prevails as the market awaits the outcome of Wednesday’s U.S. Federal Reserve meeting. Previous losses were largely influenced by investor sentiments leaning towards a bearish outlook before the central bank’s decisions. This is noteworthy as the oil market usually responds dramatically to Federal Reserve policy shifts, given their direct impact on domestic fuel demand.

Trading Derivatives carries a high level of risk to your capital and you should only trade with money you can afford to lose. Trading Derivatives may not be suitable for all investors, so please ensure that you fully understand the risks involved, and seek independent advice if necessary. A Product Disclosure Statement (PDS) can be obtained either from this website or on request from our offices and should be considered before entering into a transaction with us. Raw Spread accounts offer spreads from 0.0 pips with a commission charge of USD $3.50 per 100k traded. Standard account offer spreads from 1 pips with no additional commission charges. Spreads on CFD indices start at 0.4 points. The information on this site is not directed at residents in any country or jurisdiction where such distribution or use would be contrary to local law or regulation.

Supply Risks and Global Outlook

ING analysts have pointed out that disruptions to Iranian oil flows are a considerable risk, especially if tensions escalate into a full-scale invasion involving Iran. This could lead to a lost supply ranging between 500,000 and 1 million barrels per day if the U.S. decides to enforce sanctions rigorously. Similarly, uncertainty over Venezuela’s elections and the possibility of the U.S. revoking its recent sanctions relief contribute to the precariousness of the supply chain.

China’s Economic Slowdown

In contrast to geopolitical factors, weaker-than-expected economic indicators from China have ignited concerns over slowing demand from the world’s second-largest oil consumer. The official purchasing managers’ index fell below the 50-point threshold, indicating contraction rather than expansion. This could potentially impact oil prices negatively, as China is a significant player in global oil demand.

Short-Term Forecast: Mixed Outlook

Portfolio investors seem to have resumed offloading petroleum assets, according to John Kemp at Reuters, shifting from Middle East conflict fears to concerns over rising interest rates affecting the global economy. In summary, the outlook remains mixed. While supply constraints arising from geopolitical tensions provide bullish signals, slowdown signs from China and uncertainties surrounding Federal Reserve decisions contribute to a bearish undercurrent.

Technical Analysis

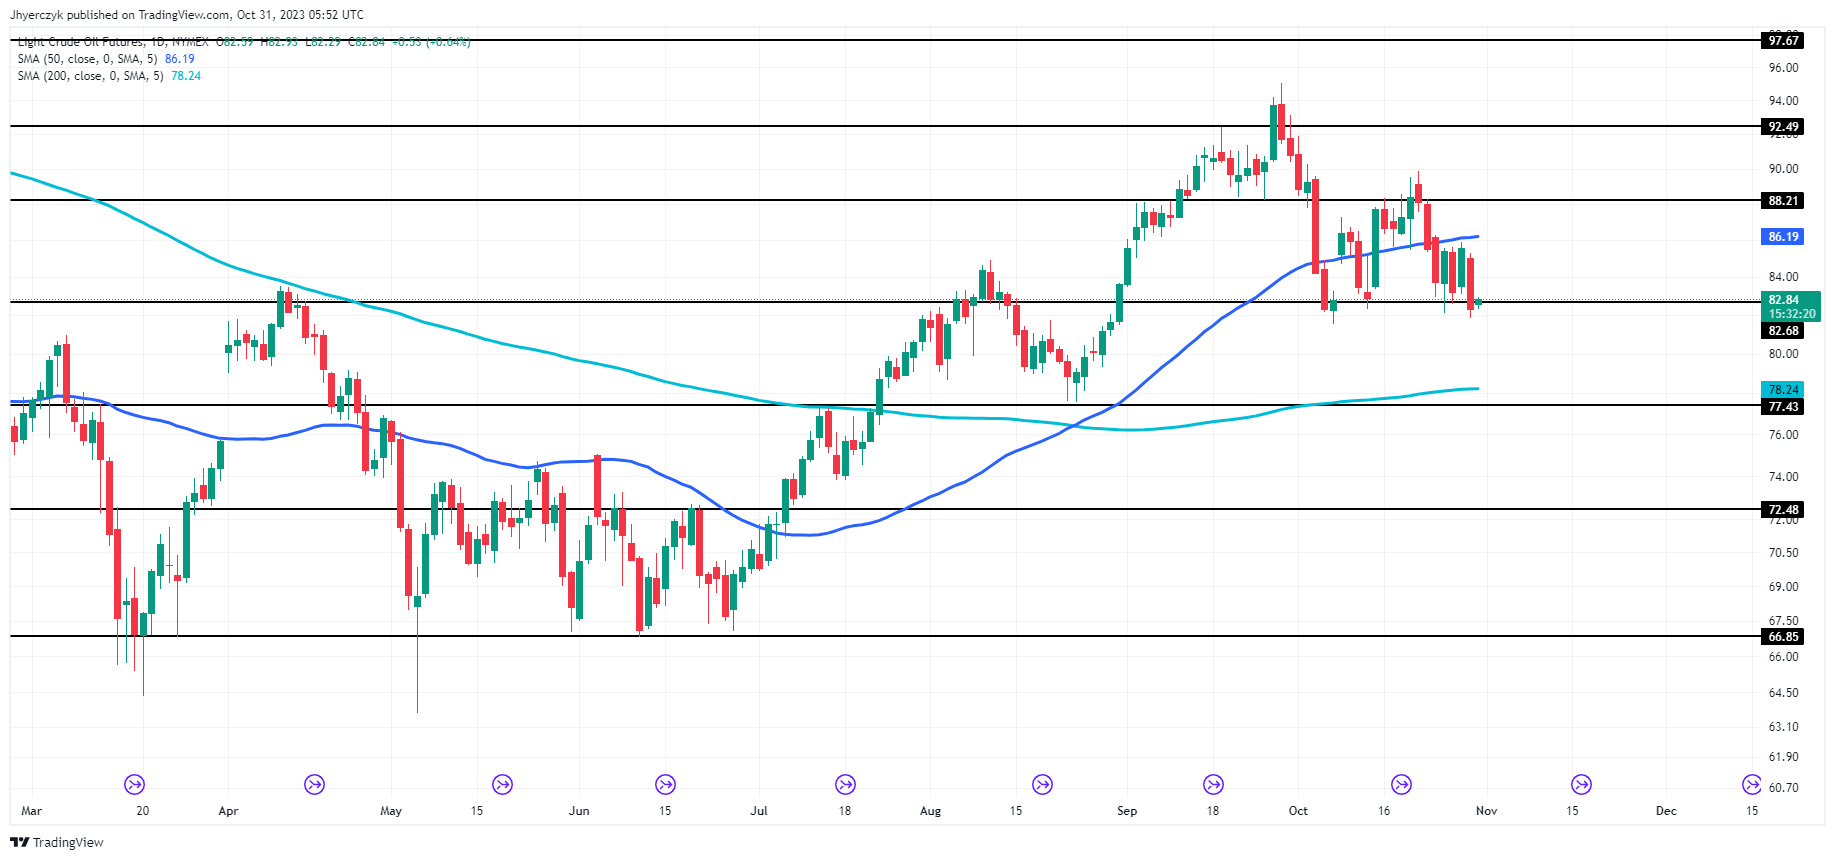
Daily Light Crude Oil FuturesThe current daily price of light crude oil futures at $82.78 sits above the main support level of $77.43 but below the minor resistance at $88.21. It’s also marginally higher than the minor support level of $82.68, suggesting some buying interest.

The asset is trading above its 200-day moving average of $78.24, indicating a longer-term bullish trend, but below the 50-day moving average of $86.19, which could signal short-term weakness.

Overall, the market sentiment appears cautiously bullish, with the asset finding some footing above key support levels but facing headwinds from the short-term moving average.

The latest price action suggests sellers are in control with the 200-day moving average at $78.24 the next likely target.

Gold Prices Forecast: XAU/USD Posts Strong Month Fueled by Middle East Crisis

Gold Prices Forecast: XAU/USD Posts Strong Month Fueled by Middle East Crisis

Gold Navigates Market Tensions Amid Central Bank Decisions

As gold (XAU/USD) traders brace for a tumultuous week filled with central bank meetings, the safe-haven asset marks the end of its strongest month since November 2022. The ongoing conflict between Israel and Hamas has pushed spot gold prices to $2,009.29 an ounce, its peak since mid-May. The surge represents an 8% monthly increase, instigated by geopolitical instability.

Middle East Crisis and Market Reaction

Despite Israel’s slightly moderated stance in Gaza, gold prices have only marginally fallen below the $2,000 mark. This reflects the market’s continued apprehension about escalating tensions in the Middle East. Meanwhile, the focus remains on the upcoming U.S. Federal Reserve meeting scheduled for Wednesday, which could impact gold prices depending on monetary policy decisions.

Trading Derivatives carries a high level of risk to your capital and you should only trade with money you can afford to lose. Trading Derivatives may not be suitable for all investors, so please ensure that you fully understand the risks involved, and seek independent advice if necessary. A Product Disclosure Statement (PDS) can be obtained either from this website or on request from our offices and should be considered before entering into a transaction with us. Raw Spread accounts offer spreads from 0.0 pips with a commission charge of USD $3.50 per 100k traded. Standard account offer spreads from 1 pips with no additional commission charges. Spreads on CFD indices start at 0.4 points. The information on this site is not directed at residents in any country or jurisdiction where such distribution or use would be contrary to local law or regulation.

US Treasury Yields and Fed Policy

U.S. Treasury yields have been on a roller coaster, hitting a high of 4.888% for the 10-year Treasury. Investor sentiment is aligned with the expectation that the Fed will likely keep interest rates unchanged. The past month has seen the 10-year Treasury yield soar above 5%, prompting several Fed officials to suggest that current elevated yields are already exerting economic moderation.

Economic Indicators and Dollar Strength

Further influencing the gold market are key economic reports due this week, including the ADP employment change figures and the September jobs report. The U.S. dollar has somewhat lost its momentum but remains buoyed by the U.S. economic resilience and the possibility of another rate hike by the Fed.

Short-Term Forecast: Cautiously Bullish

The market appears cautiously bullish on gold for the short term. Geopolitical tensions continue to drive demand for the metal, and while central bank meetings may induce volatility, the existing economic climate—marked by rising Treasury yields and a resilient U.S. dollar—lends some degree of stability to gold prices.

Technical Analysis

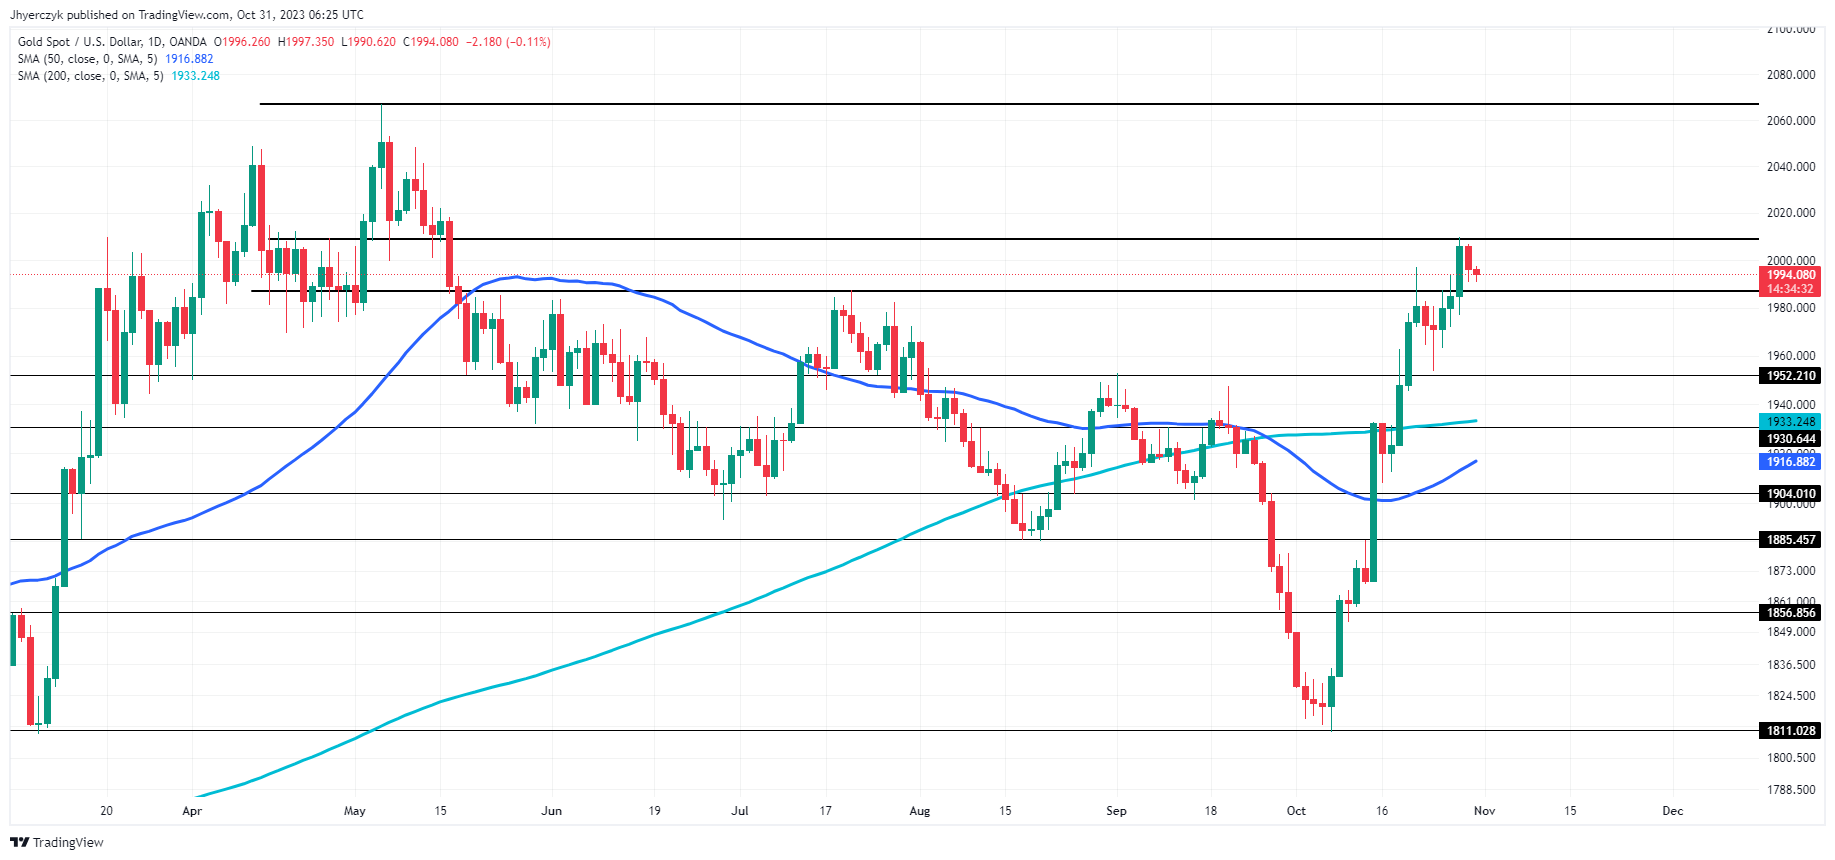
The current daily price of gold (XAU/USD) at 1993.340 is slightly below its previous close but remains above both the 200-day moving average of 1933.247 and the 50-day moving average of 1916.878. This suggests inherent strength in the gold market.The asset is nearing the minor resistance level at 2009.00, while comfortably staying above the main support level of 1952.210.

Given its performance relative to key moving averages and support and resistance levels, the market sentiment for gold appears to be cautiously bullish.

DAX Index: Eurozone GDP and Inflation in Focus Ahead of the US Session Numbers

DAX Index: Eurozone GDP and Inflation in Focus Ahead of the US Session Numbers

DAX Monday Overview

The DAX gained 0.20% on Monday. Following a 0.30% loss on Friday, the DAX ended the day at 14,717.

German GDP and Inflation Combination Supports the DAX

German GDP and inflation figures delivered a favorable combination for the DAX on Monday. Better-than-expected GDP numbers for Q3 delivered early support for DAX-listed stocks.

Trading Derivatives carries a high level of risk to your capital and you should only trade with money you can afford to lose. Trading Derivatives may not be suitable for all investors, so please ensure that you fully understand the risks involved, and seek independent advice if necessary. A Product Disclosure Statement (PDS) can be obtained either from this website or on request from our offices and should be considered before entering into a transaction with us. Raw Spread accounts offer spreads from 0.0 pips with a commission charge of USD $3.50 per 100k traded. Standard account offer spreads from 1 pips with no additional commission charges. Spreads on CFD indices start at 0.4 points. The information on this site is not directed at residents in any country or jurisdiction where such distribution or use would be contrary to local law or regulation.

The German economy contracted by 0.1% in Q3 vs. forecasts of a 0.3% contraction. Softer-than-expected German inflation figures supported the appetite for DAX-listed stocks. In October, the German annual inflation rate softened from 4.5% to 3.8%. Economists forecast an inflation rate of 4.0%.

US economic indicators tested the appetite for riskier assets. However, easing fears of a regional Middle East conflict and a pullback in Treasury yields supported a rebound across the US equity markets. WTI crude and Brent tumbled by 3.78% and 2.84%, respectively, on containment of the Middle East conflict. Containment would limit the impact of the conflict on supply.

On Monday, the Dow gained 1.58%. The Nasdaq Composite Index and the S&P 500 ended the session up 1.16% and 1.20%.

The Monday Market Movers

Siemens Energy AG rallied by 12.66%, on German government support. Bank stocks also made gains on better-than-expected GDP numbers. Deutsche Bank and Commerzbank saw gains of 0.02% and 0.95%, respectively.

However, Infineon Tech and Sartorius AG were a drag on the DAX, sliding by 6.35% and 5.43%.

The auto sector also struggled. Mercedes Benz Group saw more losses after disappointing earnings results. Mercedes Benz Group and BMW declined by 1.12% and 0.88%, respectively. Porsche and Daimler Truck Holding saw losses of 0.73% and 0.40%, with Volkswagen falling by 0.15%.

Eurozone GDP and Inflation in the Spotlight

On Tuesday, German retail sales need consideration before the European opening bell. An unexpected fall in retail sales may raise bets on a prolonged German recession.

However, the Eurozone economy will also be in focus. GDP numbers for Q3 and October inflation figures will draw investor interest.

After market-friendly numbers from Germany on Monday, similar trends would support the appetite for DAX-listed stocks. Economists forecast the Eurozone economy to expand by 0.1% in Q3 vs. a 0.4% contraction in Q2.

However, economists forecast the Eurozone’s core annual inflation rate to soften from 4.5% to 4.2%. Softer inflation and better-than-expected GDP numbers would support riskier assets.

Away from the economic calendar, corporate earnings also need consideration. BASF is among the big names to release earnings results.

Earlier in the day, PMI numbers from China could set the tone. The NBS Manufacturing PMI fell from 50.2 to 49.5, with the Non-Manufacturing PMI down from 51.7 to 50.6.

US Consumer Confidence and Employment Costs in Focus

On Tuesday, US consumer confidence will be in the spotlight. A marked decline in consumer confidence would fuel bets on a slump in consumption, raising the threat of a hard landing. Economists forecast the CB Consumer Confidence Index to fall from 103 to 100. A drop below 100 would impact the appetite for riskier assets.

Employment costs for the third quarter also need consideration. An unexpected spike in employment costs could fuel demand-driven inflation, supporting a more hawkish Fed rate path. A more hawkish Fed rate path would weigh on riskier assets.

Other stats include house price figures and the Chicago PMI, which will likely play second fiddle to the key stats.

Beyond the economic calendar, the US earnings calendar will also move the dial. Pfizer Inc. and Caterpillar Inc. are among the big names releasing earnings on Tuesday.

The futures markets point to a mixed start to the Tuesday session. The DAX was up 23 points while the Nasdaq mini was down 52 points.

Short-Term Forecast

Eurozone GDP and inflation figures will be pivotal for the DAX ahead of the Fed interest rate decision. Better-than-expected GDP numbers and softer inflation figures could provide market relief. However, any cracks in the US economy could test the appetite for DAX-listed stocks.

DAX Technical Indicators

Daily Chart

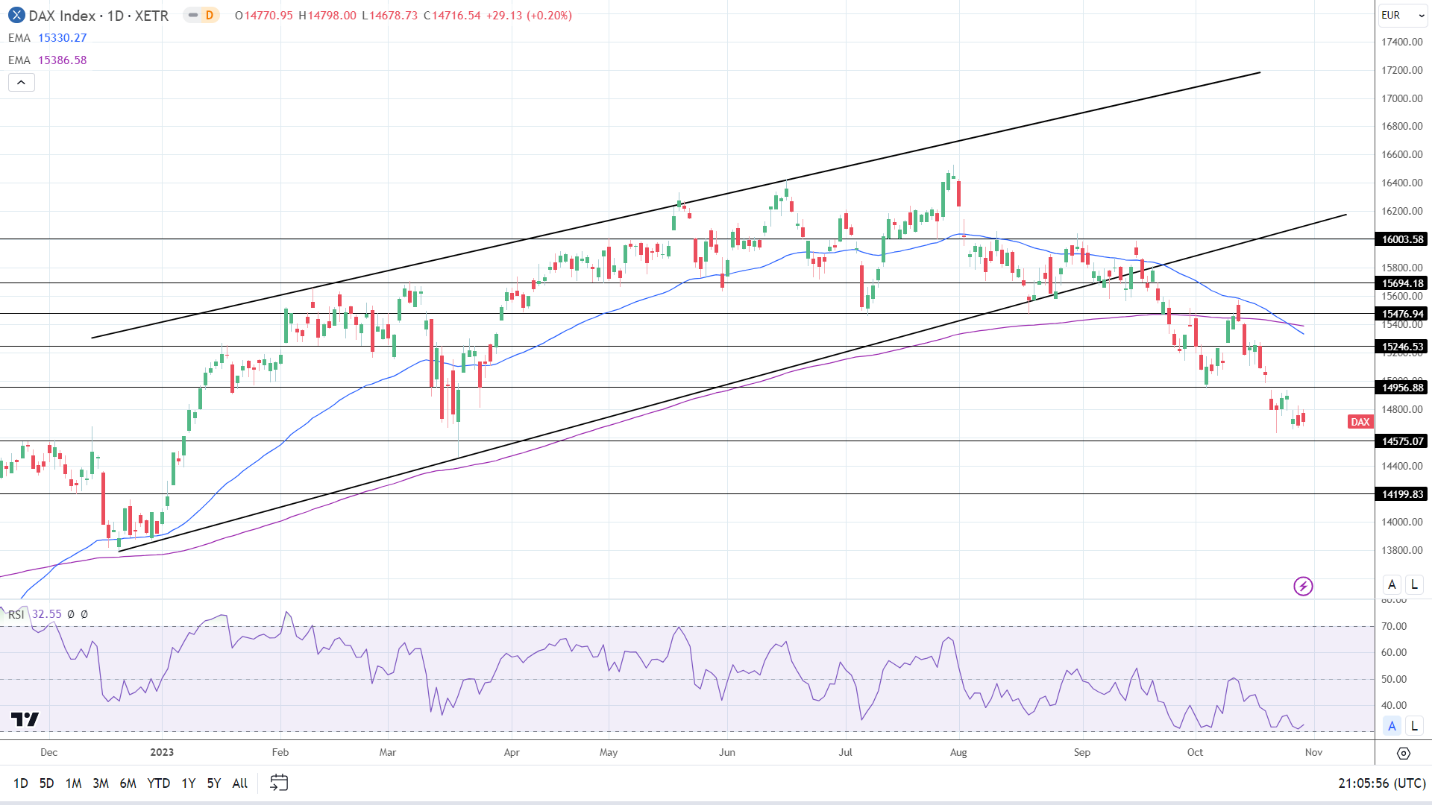
The DAX remained below the 50-day and 200-day EMAs, affirming bearish price signals.

A DAX move through 14,800 would support a move toward the 14,957 resistance level. Softer Eurozone inflation figures and better-than-expected GDP numbers would support a DAX break above the 14,957 resistance level.

Eurozone GDP and inflation figures and US consumer confidence will be focal points.

A drop below the 14,575 support level would support a fall toward the 14,200 support level.

The 14-day RSI reading of 32.55 shows DAX on the border of oversold territory, suggesting improving buyer demand.

DAX Daily Chart sends bearish price signals.
DAX 311023 Daily Chart

4-Hourly Chart

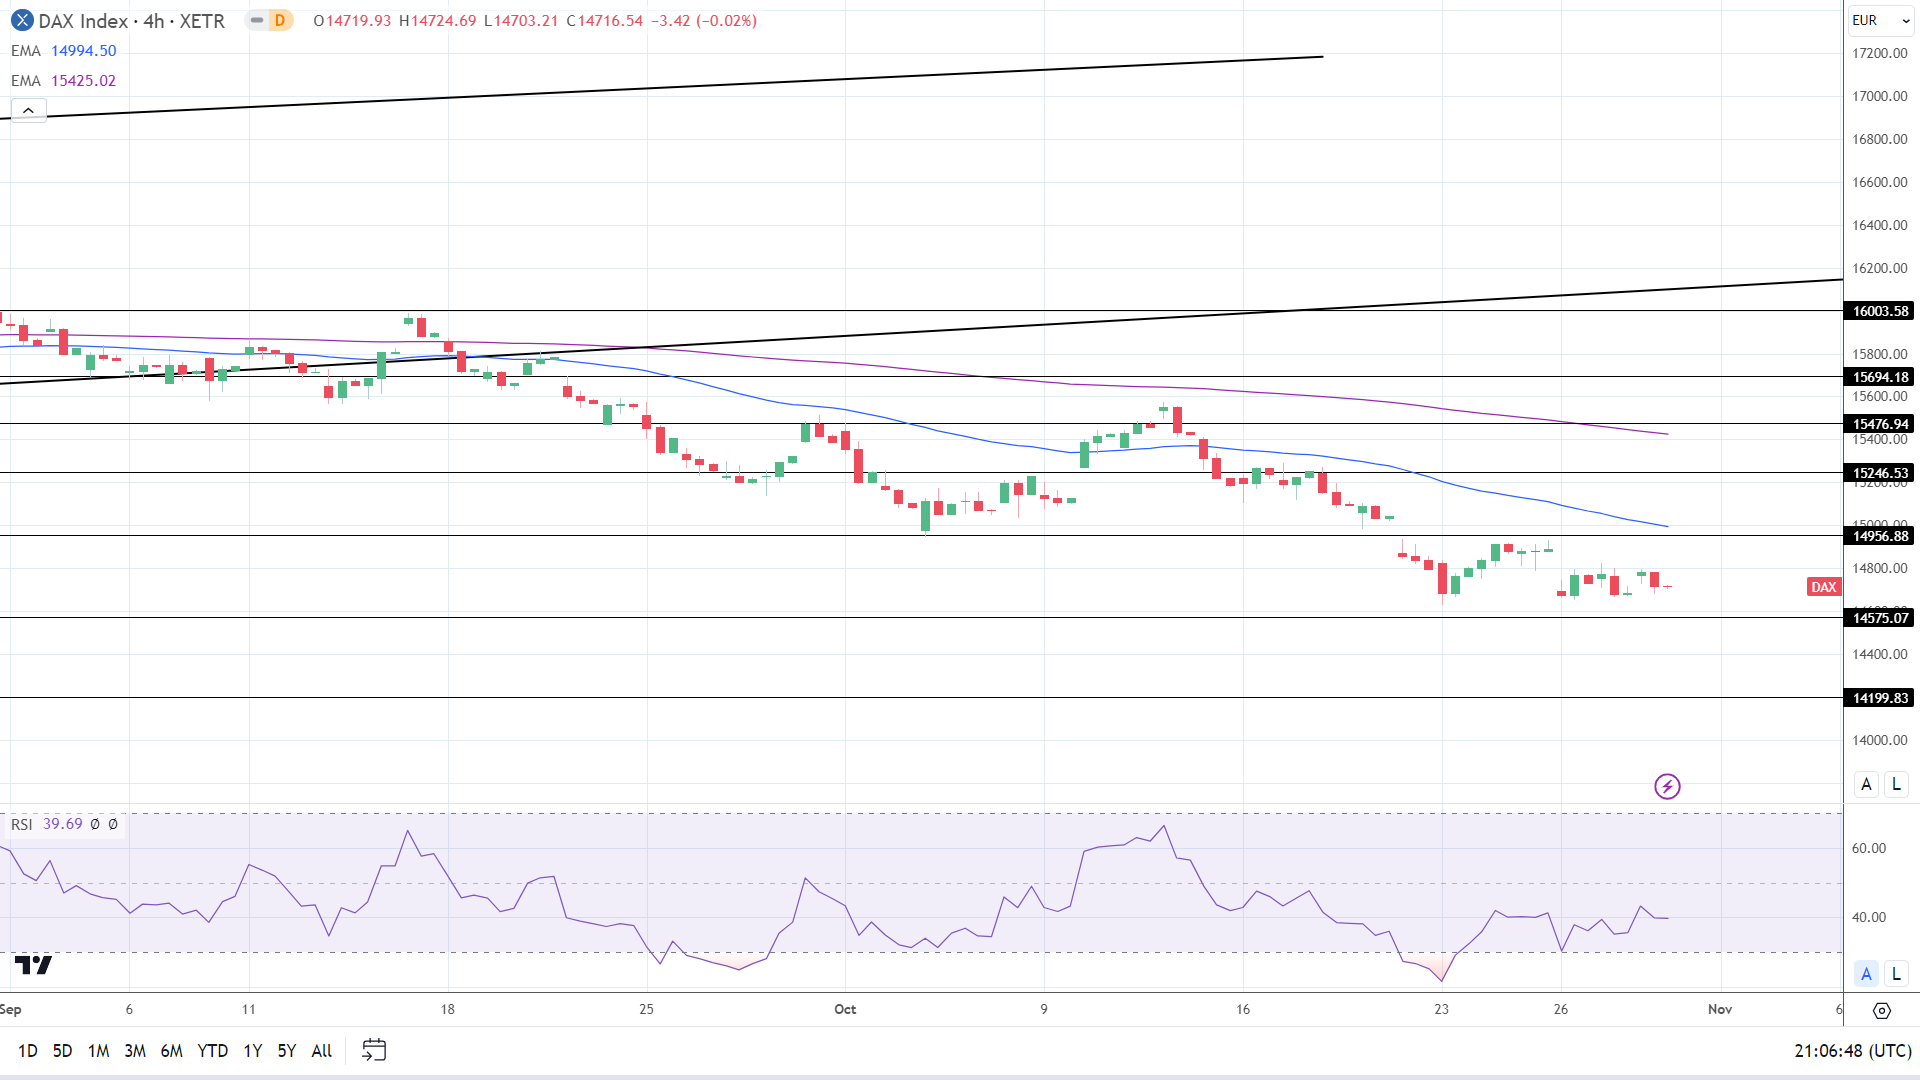
The DAX remains below the 50-day and 200-day EMAs, reaffirming bearish price signals. A DAX break above the 14,957 resistance level and 50-day EMA would support a return to 15,000.

However, a fall through the 14,575 support level would bring the 14,200 support level into view.

The 39.69 14-4 hour RSI reading indicates a DAX fall through the 14,575 support level before entering oversold territory.

4-Hourly Chart affirms bearish price signals.
DAX 311023 4-Hourly Chart
Silver Prices Forecast: XAG/USD Steady Amid Middle East Crisis, Fed Decisions

Silver Prices Forecast: XAG/USD Steady Amid Middle East Crisis, Fed Decisions

Silver Navigates Geopolitical Uncertainty and Central Bank Anticipation

As central bank meetings loom this week, silver (XAG/USD) prices have demonstrated both resilience and volatility. Earlier this month, the spot price climbed to $23.88 an ounce, propelled by geopolitical tensions following the conflict between Israel and Hamas. However, prices have plateaued as Israel moderates its approach to the situation, slightly diffusing investor fears.

Fed Meeting and Market Focus

The global investment community is focused on the upcoming U.S. Federal Reserve meeting on Wednesday and the monthly U.S. jobs report due Friday. With a 96% market expectation that the Fed will maintain current interest rates, according to CME’s FedWatch tool, investors are seeking cues on the future trajectory of monetary policy.

Trading Derivatives carries a high level of risk to your capital and you should only trade with money you can afford to lose. Trading Derivatives may not be suitable for all investors, so please ensure that you fully understand the risks involved, and seek independent advice if necessary. A Product Disclosure Statement (PDS) can be obtained either from this website or on request from our offices and should be considered before entering into a transaction with us. Raw Spread accounts offer spreads from 0.0 pips with a commission charge of USD $3.50 per 100k traded. Standard account offer spreads from 1 pips with no additional commission charges. Spreads on CFD indices start at 0.4 points. The information on this site is not directed at residents in any country or jurisdiction where such distribution or use would be contrary to local law or regulation.

U.S. Treasury Yields and Economic Indicators

U.S. Treasury yields are another influential factor. The 10-year Treasury yield recently touched 4.888%, contributing to elevated investor attention. After the U.S. Treasury’s announcement to borrow $776 billion in Q4, yields slightly retracted. This coincides with expectations set by JPMorgan Chase strategists, who had predicted a borrowing figure close to $800 billion.

Jobs Reports and the U.S. Dollar

Investors are also eyeing upcoming employment reports, including the ADP’s employment change figures and the September jobs report. These data points could potentially alter market sentiment. Concurrently, the U.S. dollar is holding steady, backed by a robust U.S. economy and the prospect of another Fed rate hike.

Short-Term Forecast: Cautiously Bullish

While uncertainty pervades, the market sentiment appears cautiously bullish for silver. Geopolitical factors and central bank decisions could induce fluctuations, but the underlying economic indicators suggest a degree of stability in the silver market. Higher yields and a strong dollar may put a cap on silver prices, but the current landscape suggests more resilience than vulnerability.

Technical Analysis

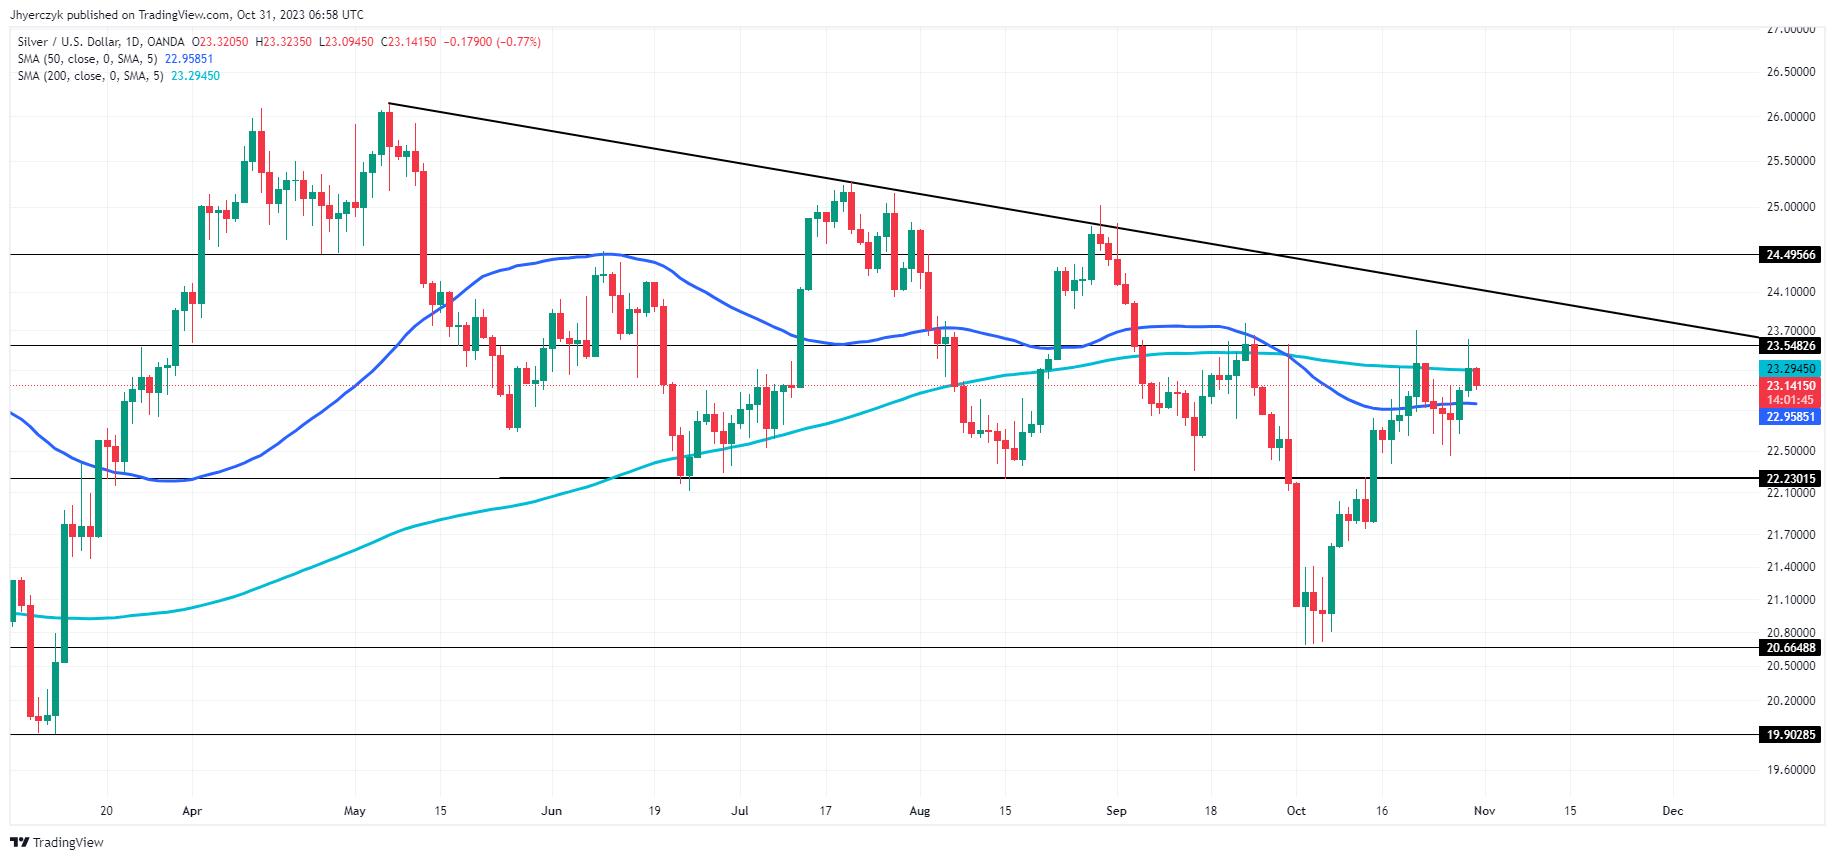
Daily Silver (XAG/USD)

The current daily price of XAG/USD at 23.15 is positioned between its 200-day moving average of 23.29 and its 50-day moving average of 22.96, suggesting the market is in a neutral zone.

While it’s slightly below the 200-day MA, indicating mild bearish sentiment, it remains above the 50-day MA, offering a counter bullish signal.

The asset is currently facing minor resistance at 23.55 and major resistance at 24.50, with trend line resistance pegged at 24.13.

On the downside, minor and main support levels are at 22.23 and 20.66 respectively.

The data suggests that the market is in a wait-and-see mode, cautiously poised between key technical levels. Overall, market sentiment leans toward neutral with a slight bullish inclination.

This type of formation tends to fuel a volatile breakout.