asx

Asian stocks tumble as AI-driven chip selloff rattles markets

Asian stock markets suffered a severe selloff on Tuesday as growing doubts surrounding artificial intelligence investment triggered heavy selling across the region’s semiconductor industry.

As of approximately 7:35 AM GMT time, South Korea was at the center of the turmoil. The benchmark Kospi had fallen by around 10%, after briefly extending its losses beyond 11%, forcing the Korea Exchange to halt trading for 20 minutes after the index remained more than 8% below Monday’s close.

Japan’s Nikkei 225 dropped more than 4%, while Taiwan’s Taiex lost close to 5% as investors aggressively reduced their exposure to chipmakers and other companies associated with the global AI boom.

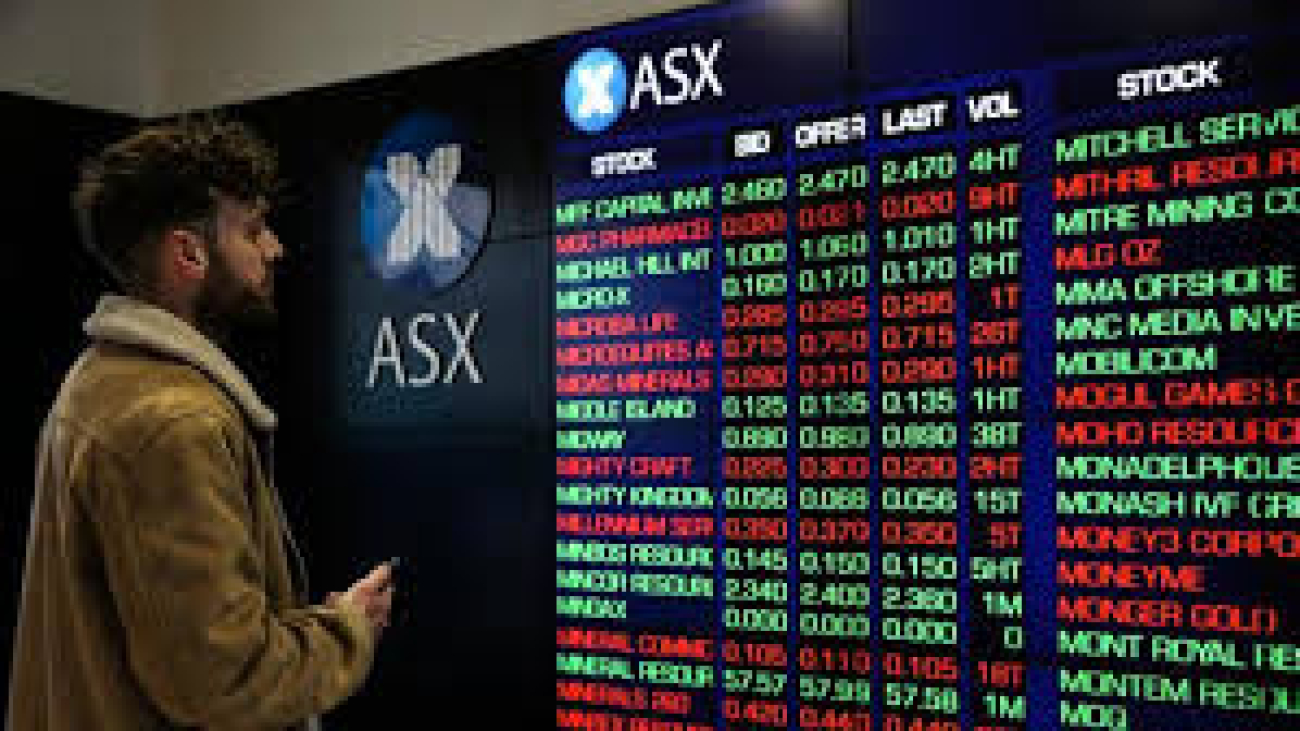
China’s Shanghai Composite also traded lower, although its decline was considerably smaller. Hong Kong showed greater resilience, while Australia’s ASX 200 managed to post modest gains, highlighting how heavily the regional selloff was concentrated in technology-driven markets.

South Korea faces a historic rout

South Korea experienced the most dramatic losses because of the unusually large influence that semiconductor companies have over its stock market.

Samsung Electronics and SK Hynix, which together represent a substantial share of the Kospi, both plunged by approximately 13% as investors rushed to unwind positions accumulated during the powerful semiconductor rally earlier this year.

The intensity of the decline first prompted the exchange to activate “sidecar” restrictions that temporarily suspended program trading. As losses deepened, a broader circuit breaker was triggered, halting trading across the entire market.

The measures were designed to slow panic selling and give investors time to reassess conditions. However, the need to activate them demonstrated the scale of the pressure facing one of Asia’s best-performing markets of the past year.

AI optimism turns into valuation anxiety

The immediate trigger was another sharp decline in semiconductor stocks on Wall Street.

Nvidia fell around 5% during Monday’s U.S. session, while other major chipmakers also suffered heavy losses. The selling quickly spread to Asia, where many of the companies most closely linked to memory chips, semiconductor equipment and AI infrastructure are listed.

Investors are increasingly questioning whether the vast sums being committed to artificial intelligence data centers can generate profits quickly enough to justify current market valuations.

Those concerns have intensified as technology companies continue to announce enormous capital spending plans involving advanced processors, memory chips, electricity infrastructure and data-center construction.

Demand for AI hardware remains strong, but the market is no longer treating investment growth alone as sufficient justification for higher share prices. Investors increasingly want evidence that the spending will produce sustainable revenue and meaningful returns.

Chinese competition adds another layer of fear

The selloff was amplified by signs that China is accelerating its efforts to develop a more independent semiconductor industry.

Reports that Chinese manufacturers are beginning domestic production of advanced chipmaking equipment raised concerns about the future competitive position of established suppliers in Japan, South Korea, Taiwan and Europe.

Investors were also digesting the extraordinary stock-market debut of Chinese memory-chip producer ChangXin Memory Technologies, commonly known as CXMT. Its shares surged more than 400% during Monday’s debut, reflecting enormous investor enthusiasm for China’s domestic semiconductor ambitions.

The company’s rapid rise raised concerns that Chinese producers could eventually challenge the dominance of Samsung and SK Hynix in the global memory-chip market.

For investors, the threat is not simply that China could produce more chips. Increased manufacturing capacity could eventually create excess supply, place downward pressure on prices and reduce the exceptional profit margins currently enjoyed by the industry’s largest producers.

Japan and Taiwan caught in the chip rout

Japan’s stock market was dragged lower by companies closely connected to semiconductor manufacturing.

Memory-chip producer Kioxia suffered particularly steep losses, while equipment manufacturers and technology investment companies also declined sharply. Because semiconductor-related companies have played an important role in the Nikkei’s previous rally, their retreat placed heavy pressure on the broader index.

Taiwan faced a similar problem. The island’s stock market is dominated by the semiconductor industry, led by Taiwan Semiconductor Manufacturing Company.

Even relatively moderate declines in TSMC can have an outsized effect on the Taiex because of the company’s enormous index weighting. As the global chip selloff intensified, Taiwan’s broader market therefore suffered one of the largest declines in the region.

Not every Asian market collapsed

The session was not a uniform regional crash.

Australian shares traded modestly higher, benefiting from the country’s smaller exposure to semiconductor companies and the continued decline in oil prices. Lower energy costs can support businesses and consumers in countries that depend heavily on imported fuel.

Hong Kong also performed better than Japan, South Korea and Taiwan, while mainland Chinese losses remained comparatively contained.

That divergence shows that Tuesday’s turmoil was not primarily driven by a sudden collapse in the global economic outlook. Instead, it represented an aggressive reassessment of the AI and semiconductor trade after months of extraordinary gains and increasingly demanding valuations.

 Is the AI bubble beginning to crack?

One day of severe losses does not prove that the AI boom has ended.

Demand for advanced chips remains strong, major technology companies continue to expand their data-center networks and semiconductor manufacturers are still expected to report substantial earnings.

However, the character of the market has clearly changed.

Earlier in the rally, announcements of higher AI spending were generally interpreted as evidence of stronger future demand. Investors are now beginning to view the same spending plans as potential financial risks, particularly when the connection between capital expenditure and eventual profits remains uncertain.

That shift in perception can be extremely important. Markets do not require an actual collapse in AI demand to produce a major correction. They only require investors to become less willing to pay exceptionally high valuations for future growth.

What investors are watching next

Attention will now turn toward upcoming earnings from major U.S. technology companies and the Federal Reserve’s latest monetary-policy decision.

Corporate results will be examined for evidence that artificial intelligence is generating enough revenue to support the industry’s enormous investment plans. Weak guidance, slower cloud growth or further increases in capital expenditure without corresponding profits could deepen the selloff.

The Federal Reserve will also influence sentiment. Any indication that U.S. interest rates could remain elevated—or rise further—would increase the pressure on highly valued technology stocks by reducing the present value investors assign to future earnings.

Tuesday’s collapse therefore represents more than a difficult trading session for Asian equities. It is an early test of whether the semiconductor industry’s exceptional rally can survive a period in which investors are demanding profits, financial discipline and proof that the AI revolution can produce returns matching the extraordinary amounts being invested in it.

[1]: https://www.reuters.com/world/china/global-markets-global-markets-2026-07-28/?utm_source=chatgpt.com “AI anxiety sparks tech rout, broad selloff in Asian markets”



xauusd-daily-main-min

Euro maintains gains before Christine Lagarde’s remarks

The euro advanced against a basket of major and minor currencies during European trading on Friday, extending its gains against the US dollar for a second consecutive session and moving closer to posting a weekly gain.

The single currency has been supported by renewed weakness in the US dollar following softer-than-expected US employment data, which reduced expectations that the Federal Reserve will raise interest rates later this year.

Investors are also closely watching remarks from European Central Bank President Christine Lagarde later today for fresh clues about inflation trends and the outlook for monetary policy in the eurozone.

The Price

• EUR/USD rose 0.1% to $1.1445 from an opening level of $1.1432, after touching an intraday low of $1.1421.

• The euro gained 0.5% against the dollar on Thursday, recording its first daily advance in three sessions and its strongest one-day gain since May, following the release of weaker-than-expected US employment figures.

Weekly Performance

As of Friday’s trading, the euro is up approximately 0.55% against the US dollar for the week and is on track to record its first weekly gain in the past three weeks.

US Dollar

The US Dollar Index fell 0.1% on Friday, extending losses for a second straight session and trading near a two-week low of 100.56 points, reflecting continued weakness in the greenback against a basket of major currencies.

June’s disappointing US employment report prompted markets to scale back expectations for additional Federal Reserve tightening, although investors continue to await further economic data for confirmation.

US job growth slowed sharply in June, with nonfarm payrolls increasing by just 57,000 jobs, well below market expectations for a gain of 110,000. Meanwhile, the labor force participation rate fell to 61.5%, its lowest level in more than five years.

Following the report, CME FedWatch pricing showed that the probability of the Federal Reserve leaving interest rates unchanged at its July meeting increased from 71% to 82%, while the probability of a 25-basis-point rate hike fell from 29% to 18%.

Market expectations for unchanged rates at the December meeting also rose from 15% to 22%, while the probability of a quarter-point hike declined from 85% to 78%.

European Interest Rates

• ECB President Christine Lagarde said on Wednesday in Sintra, Portugal, that risks surrounding inflation and economic growth in the eurozone had become more balanced than they were a few weeks ago, helped by the recent decline in oil prices.

• Official eurozone inflation data showed a larger-than-expected slowdown in consumer price growth during June, supported by lower fuel prices following the end of the Iran conflict.

• Following those comments and inflation figures, money markets reduced the probability of a 25-basis-point ECB rate hike in July from 30% to just 5%.

• Investors are now awaiting additional eurozone data on inflation, unemployment, and wage growth to reassess the outlook for monetary policy.

Christine Lagarde

At 08:00 GMT, ECB President Christine Lagarde is scheduled to deliver a speech at the Aix-en-Provence Economic Meetings in France.

Her remarks may provide further insight into inflation developments across the eurozone and the ECB’s outlook for interest rates during the remainder of the year.

euro

Euro continues its recovery on hopes of peace in the Middle East

The euro rose in European trading on Tuesday against a basket of global currencies, extending its recovery for a second consecutive session from a three-month low against the US dollar. The move was supported by buying interest at lower levels and improved risk appetite after the halt in military escalation between Iran and Israel, strengthening speculation that a final peace agreement in the Middle East may be approaching.

Lower global oil prices are also helping to ease concerns about accelerating inflation, supporting expectations that the European Central Bank may keep its monetary policy tools unchanged for an extended period this year.

Price overview

• Euro exchange rate today: The euro rose by around 0.15% against the dollar to $1.1548, up from the opening level of $1.1533. The session low was recorded at $1.1527.

• The euro closed Monday’s session up 0.1% against the dollar after earlier touching its lowest level in nearly three months at $1.1500.

US dollar

The US Dollar Index fell by approximately 0.15% on Tuesday, extending losses for a second consecutive session and moving further away from its two-month high of 100.21 points, reflecting continued weakness in the US currency against a basket of major and minor currencies.

In addition to profit-taking activity, the dollar has come under pressure following Trump’s success in halting the exchange of military strikes between Iran and Israel, while reaffirming commitment to the diplomatic path aimed at ending the conflict and containing geopolitical tensions in the Middle East.

Oil prices

Oil prices declined by more than 1% on Tuesday as military tensions between Iran and Israel eased, boosting expectations that a peace agreement in the Middle East may be near. Such an agreement could help reopen the Strait of Hormuz to stranded oil tankers and restore supply flows to normal levels.

Developments in the Iran conflict

• Iran and Israel announced a temporary halt to military strikes.

• US President Donald Trump called on both sides to cease hostilities immediately.

• Israel believes the brief confrontation may strengthen its position in negotiations.

• Israel has largely been excluded from the ongoing US-Iran peace talks.

• Pakistani Prime Minister Shehbaz Sharif stated that the “ultimate objective” of peace negotiations between Washington and Tehran is close to being achieved.

• Trump and Vice President JD Vance said Washington expects to declare a “complete victory” and reach a long-term settlement of the Iranian nuclear issue within the next two weeks.

• Trump said: “We are in the final stages of reaching an agreement with Iran, and we want to get this resolved.”

• Trump added: “I do not believe there are any major sticking points with the Iranians, and we are very close to reaching an agreement.”

European interest rates

• As oil prices declined, money markets reduced the probability of a 25-basis-point interest rate increase by the European Central Bank in June from 95% to 85%.

• Investors are now awaiting additional economic data from the eurozone, particularly inflation, unemployment, and wage figures, to reassess interest rate expectations.

• Reuters sources indicated that the European Central Bank is still highly likely to raise interest rates in June, given inflation forecasts that continue to point toward an undesirable scenario.

usdjpy

EURUSD price is under the dominance of short-term bullish corrective trend

The (EURUSD) price rose in its recent trading on an intraday basis, taking advantage of its stability above EMA50, reinforcing the continuation of the bullish corrective trend that dominates its short-term trading, with its trading alongside supportive trendline for this track.


Noticing the emergence of the positive signals on the relative strength indicators, that indicate the continuation of the bullish momentum despite its approach from the overbought levels, which might limit the gains before resuming the bullish attempts, if it keeps its current technical stability.

eur6

EUR/USD hovers near 1.0400 as focus shifts to US data

EUR/USD trades listlessly near 1.0400 in the European session on Thursday. The pair stays defensive as US President Trump has threatened to impose tariffs on the Eurozone. Further, ECB rate cut expectations also weigh on the major alongside fresh US Dollar demand ahead of US data.

The Relative Strength Index (RSI) indicator retreated below 60 on Thursday, pointing to a loss of bullish momentum. Nevertheless, while EUR/USD holds above 1.0390, where the 200-period Simple Moving Average (SMA) meets the Fibonacci 50% retracement of the latest downtrend, technical sellers could refrain from betting on an extended slide.

On the upside, 1.0440 (Fibonacci 61.8% retracement, 50-day SMA) aligns as strong resistance before 1.0500 (round level, Fibonacci 78.6% retracement). In case 1.0390 level fails, 1.0350 (Fibonacci 38.2% retracement) and 1.0320 (100-period SMA) could be seen as next support levels

EUR/USD climbed to its highest level in over a month above 1.0450 in the early American session on Wednesday but struggled to preserve its bullish momentum. After closing the day marginally lower, the pair trades in a tight channel near 1.0400 in the European morning on Thursday.

In the absence of high-tier data releases, the upbeat market sentiment helped EUR/USD hold its ground midweek. Rising US Treasury bond yields, however, supported the US Dollar and capped the pair’s upside.

Later in the day, the US Department of Labor will release the weekly Initial Jobless Claims data. Markets expect the number of first-time applications for unemployment benefits to rise to 220,000 from 217,000 in the previous week. A reading below 210,000 could help the USD stay resilient against its rivals and cause EUR/USD to stretch lower. On the flip side, a print of 230,000 or higher could trigger a USD selloff and boost the pair in the second half of the day.

During the American trading hours, the European Commission will publish the preliminary Eurozone Consumer Confidence data for January, which is forecast to edge higher to -14.2 from -14.5 in December.

graf-3en

How to make money in a Financial market step by steps

Today, you will know how to make money on Forex using your trader profile of one of the world’s leading finance brokers, LiteFinance. You will learn how to enter and exit your trades in Forex to make profits.

The article covers the following subjects:

Prepare for trading

Well, to start trading and making real money, you will need to register a trader profile and open a trading account with a broker that will provide access to the global foreign exchange market. This must be a real account, on demo accounts you just check your trading plan but you can’t take part in real currency trading or stock trading.

LiteFinance: Prepare for trading

The main page of your profile looks like the one in the figure above. Now, let us see what each section means:

1. Of course, we can’t speak about any profit if do not have a real account or any money on the account. In the LiteFinance trader space, your first real trading account is automatically created when you register your personal (client) profile. So, to earn any money, you first need to top up your account with your online broker. To top up your trading account, click on the “DEPOSIT” account. There will open a window where you are offered numerous ways of depositing your brokerage account, from a bank transfer or a credit card to various online wallets or payment systems. In general, everything is simple and easy.

2. After you put some deposit on your account, you will see a change in your funds in the trade panel in the bottom left corner. The tab is called ASSETS TOTAL.

Choose a trading instrument

LiteFinance: Choose a trading instrument

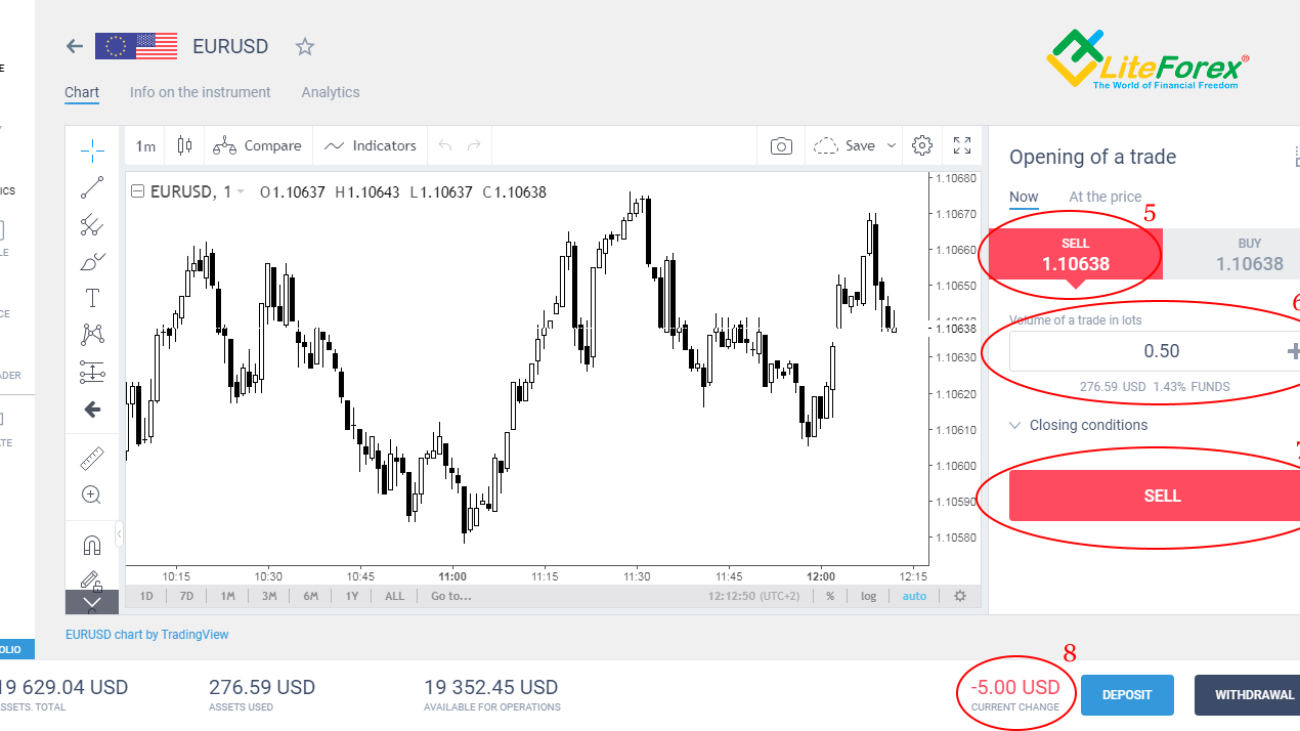
3. After your trading account is topped up, you can start making money. First, you need to select a trading instrument (an asset you are going to trade). We won’t be extravagant and choose the most traded currency pair EURUSD as an example(here, the euro is a base currency and the dollar is a quote currency or a counter currency, because you always trade a currency pair, not a single currency). Click on the EURUSD tab and there will open a terminal window with the currency pair we have chosen.

4. There is a price chart in the middle of the window. There are various types of price charts, but it displays a candlestick chart by default. The price chart depends on your trading style, indicator trading, price action strategies or robo advisors will use different types of trading charts. To determine the trade direction (whether we will buy or sell), we need to perform a technical analysis of the chart to see the current market conditions. As we can make profits form both the price rise and the price fall, we need to find out what will happen to the price later, if it will rise or decline. If we assume that the price will fall, then we need to sell the pair now, when the price is higher then it will be, then, when the price falls, we will buy it at a lower price and earn on the difference. If we assume that the price will continue rising, it is better to buy now, while the price is low. And when the price goes up, we can sell it at a higher price and benefit. Well, we should make a trading decision. It is basically quite easy if you know the basics of technical analysis. You can use the Analytics section in your profile. There is currently a sell signal for this currency pair. We shall follow it and enter a sell trade.

Enter a trade

LiteFinance: Enter a trade

5. To enter a sell trade, choose the Sell trade. There, by the way, will be the price, which you enter your trade at.

6. Next, we need to set the volume of our trade. This is the amount of money we want to invest in the trade. The more money you put in the trade, the more is your potential income. However, the more you invest, the more you risk. So, we choose the golden mean. The trade volume on the exchange is conventionally called the lot. One lot unit is 100,000 units of the base currency. We couldn’t enter a trade if the broker didn’t provide financial leverage. But fortunately, our broker helps us offering leverage, so 1 lot costs us just about 500 dollars. However, based on my own experience, it is rather risky to enter a trade with a whole lot. According to the basics of risk management, you’d better decrease the trade volume at least by half. So, we choose the volume of 0.5 lots, which will be roughly 280 dollars.

7. Well, we now need just to click on the “sell” button. Once we pushed this button, we give our broken an order. A new order is instantly placed in the global market. And when your order is put, there will be a confirming message specifying the price, at which your order has been executed by the broker.

8. You will see the trade entered by the changes in the information displayed on the trade panel at the bottom of your screen. The Current Change tab now displays the changes in the balance of our trading account in real-time. Differently put, we can now see the profit or the loss yielded by our trade. Although the price hasn’t changed since we entered the trade, the current change shows a loss of -5.00 USD. What has happened? It is not strange. We have paid the commission charged for opening a position and spread, the difference between the buy and the sell price. Now, we first need to gain and compensate for this commission, and then, we will make a profit. In real trading, this commission is not so high as it seems; it is just about 1%-2% of the position size. If you open long-term positions with the holding time of 1 week and longer, and with a profit of a few thousand dollars, you won’t even notice a commission fee of 5 USD.

Managing your trade and making a profit

LiteFinance: Managing your trade and making a profit

9. After a while, we can look at the price chart. We have been right, and the price is going down generating a profit from our sell trade.

10. Look at the Current Change line. The value is now positive, its color is green. This means that the order we put has already made a profit of +$18.

11. If we think this profit to be enough, we can safely click on the “close” button. This will signal that we are going to close our sell trade at the current price and take our profit to enroll it on our trade account. If you complete your trade (that is enter and exit) within the same day, this is a day trading and you are a day trader.

LiteFinance: Managing your trade and making a profit

12. After the trade is exited, no changes are registered on the balance account, it is now fixed at an amount that is more than it was before we entered a trade as we have made a profit.

13. To realize that our profit is real, physical money, we can withdraw it from the trading account. To do this, we need to click on the WITHDRAWAL button.

14. Now, try to make a few trades on your own, and you’ll see that it is quite easy. There is nothing to complicated in making money on the forex market.

Seven golden rules of a trader

Every trader is aimed at gaining profit, therefore wishing to know the best entry and exit points for the deal. We also know that trading is a kind of business, which always involves risk and therefore, requires risk management. These issues are determined by a trading strategy selected by a trader.

Rule №1

Your trading decisions shall be well deduced. A trader cannot just enter the terminal, look at the chart and open a position. It will be a waste of time and money. Your trading decisions shall be based on the signals of the indicators and oscillators and on the data of the fundamental analysis. This is the only way to conduct trade.

Rule №2

Use moderate margins in your trading. Do not try to use the largest leverage even for the trades, which seem lossless. A trader shall never forget that trading in the Forex market always involves risks. If you are a beginner we recommend you to use leverage size 1:100, but not higher.

Rule №3

Do not use all amount of your deposit for trading. Use just 20-30% of your capital for trading and leave the rest of the money as a deposit. Such risk diversification will serve you well and help to save your funds.

Rule №4

You must have an alternative access to the terminal and Internet. So that in the event of a power cut or  a line breakdown, you can close your trades. This is very important considering that non-trading problems cause a lot of losses in the market.

Rule №5

Exit a trade if the correction lasts longer than you expected. Do not be greedy as you can lose what you have already earned. Usually the beginners do it, as they continue to believe that the price will resume the trend. Just close your trade and get your profit.

Rule №6

Be patient and wait for the strong trend of price. Trading in trends is the most profitable and safe way of trading. First of all, market is more predictable during the strong trend, which encourages to trade even the beginners. Otherwise, during the flat market a trader needs to analyze market thoroughly and make quick trading decisions. The same refers to the weak trend. If trends change very often, market is instable. In this case it is better to wait till volatility reduces and a strong trend develops.

Rule №7

A trader shall always place stop-orders and take-profits. For a professional trader these two orders just a must. Stop-loss is a tool enabling you to leave the market maintaining the highest profit. This pending order is always appropriate due to its “guarding” functions. Just place this order. Take profit orders show what a trader expects from a trade. Take profit enables a trader to determine entry and exit points and the size of the possible profit.

Conclusion

There we are all! As you see, the process of making trades in the modern forex market has become much easier and simpler than it used to be just a decade ago. When you train and gain some experience, it will take just a few seconds to go through all these 14 steps and enter a trade. A trader spends most of the working time on the price chart analysis. You will learn how to analyze the price chart to make the most of your trade from the next training articles. I will explain the basics of the support and resistance levels, how to calculate your profit targets and protect your trade form a loss. I wish you profits and hope this article was helpful to you.


P.S. Did you like my article? Share it in social networks: it will be the best “thank you” 🙂

Ask me questions and comment below. I’ll be glad to answer your questions and give necessary explanations.

Price chart of EURUSD in real time mode

Periods

  • M1
  • M5
  • M15
  • M30
  • H1
  • H4
  • D1
  • W1

Zoom1D1W1M3M6M1YALL8. Jul5. Aug2. Sep30. Sep28. Oct25. Nov23. DecJan ’23Jul ’23Jan ’24Jul ‘241.021.041.061.081.11.121.14Tuesday, Oct 8, 2024

● #EURUSDOpen: 1.09726High: 1.09971Low: 1.09608Close: 1.09753

How to make a Forex trade?

The content of this article reflects the author’s opinion and does not necessarily reflect the official position of LiteFinance. The material published on this page is provided for informational purposes only and should not be considered as the provision of investment advice for the purposes of Directive 2004/39/EC.

EUR/USD: Likely to trade between 1.1130 and 1.1195

EUR/USD: Likely to trade between 1.1130 and 1.1195

The Euro (EUR) is expected to trade in a range, likely between 1.1130 and 1.1195. In the longer run, EUR has likely entered a range trading phase, probably between 1.1060 and 1.1215, UOB Group FX analysts Quek Ser Leang and Lee Sue Ann note.

Has to break above 1.1230 for a sustained rise towards 1.1275

24-HOUR VIEW: “We indicated last Friday, that the ‘slight increase in momentum is likely to result in a higher trading range of 1.1140/1.1205 instead of a sustained advance.’ EUR subsequently traded in a wider range than expected (1.1123/1.1202), closing slightly lower by 0.12% (1.1163). There has been no increase in either downward or upward momentum. In other words, we continue to expect EUR to trade in a range, likely between 1.1130 and 1.1195.”

1-3 WEEKS VIEW: “Our update from last Thursday (26 Sep, spot at 1.1130) is still valid. As highlighted, EUR ‘has likely entered a range trading phase, probably between 1.1060 and 1.1215.’ Looking ahead, EUR not only has to break above 1.1215 but also 1.1230 before a sustained rise towards 1.1275 can be expected.”

How to Read a Candlestick Chart

How to Read a Candlestick Chart

What is a candlestick chart?

A candlestick chart is simply a chart composed of individual candles, which traders use to understand price action. Candlestick price action involves pinpointing where the price opened for a period, where the price closed for a period, as well as the price highs and lows for a specific period.

Price action can give traders of all financial markets clues to trend and reversals. For example, groups of candlesticks can form patterns which occur throughout forex charts that could indicate reversals or continuation of trends. Candlesticks can also form individual formations which could indicate buy or sell entries in the market.

The period that each candle depicts depends on the time-frame chosen by the trader. A popular time-frame is the daily time-frame, so the candle will depict the open, close, and high and low for the day. The different components of a candle can help you forecast where the price might go, for instance if a candle closes far below its open it may indicate further price declines.

Boost your chart patterns expertise with our interactive quiz!

Our Forex Trading Patterns Quiz will test your knowledge of some of the most important trading patterns. Take the test today by clicking on the link and raise your technical analysis game!

Interpreting a candle on a candlestick chart

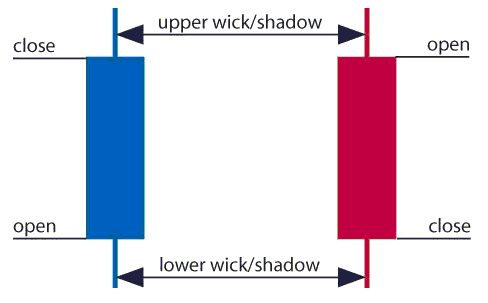
The image below represents the design of a typical candlestick. There are three specific points (open, close, wicks) used in the creation of a price candle. The first points to consider are the candles’ open and close prices. These points identify where the price of an asset begins and concludes for a selected period and will construct the body of a candle. Each candle depicts the price movement for a certain period that you choose when you look at the chart. If you are looking at a daily chart each individual candle will display the open, close, upper and lower wick of that day.

A red and a blue candlestick with open and close wicks

Open price:

The open price depicts the first price traded during the formation of the new candle. If the price starts to trend upwards the candle will turn green/blue (colors vary depending on chart settings). If the price declines the candle will turn red.

High Price:

The top of the upper wick/shadow indicates the highest price traded during the period. If there is no upper wick/shadow it means that the open price or the close price was the highest price traded.

Low Price:

The lowest price traded is the either the price at the bottom of the lower wick/shadow and if there is no lower wick/shadow then the lowest price traded is the same as the close price or open price in a bullish candle.

Close Price:

The close price is the last price traded during the period of the candle formation. If the close price is below the open price the candle will turn red as a default in most charting packages. If the close price is above the open price the candle will be green/blue (also depends on the chart settings).

The Wick:

The next important element of a candlestick is the wick, which is also referred to as a ‘shadow’. These points are vital as they show the extremes in price for a specific charting period. The wicks are quickly identifiable as they are visually thinner than the body of the candlestick. This is where the strength of candlesticks becomes apparent. Candlesticks can help traders keep our eye on market momentum and away from the static of price extremes.

Direction:

The direction of the price is indicated by the color of the candlestick. If the price of the candle is closing above the opening price of the candle, then the price is moving upwards and the candle would be green (the color of the candle depends on the chart settings). If the candle is red, then the price closed below the open.

Range:

The difference between the highest and lowest price of a candle is its range. You can calculate this by taking the price at the top of the upper wick and subtracting it from the price at the bottom of the lower wick. (Range = highest point – lowest point).

Having this knowledge of a candle, and what the points indicate, means traders using a candlestick chart have a clear advantage when it comes to distinguishing trendlines, price patterns and Elliot waves.

Bar Chart vs Candlestick Chart

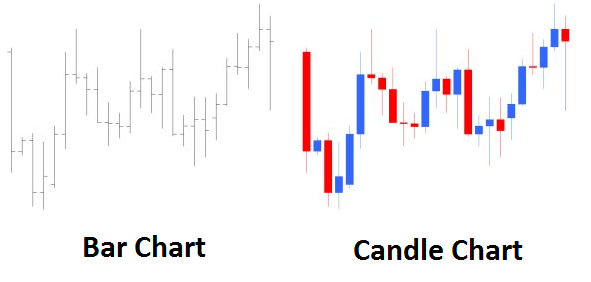
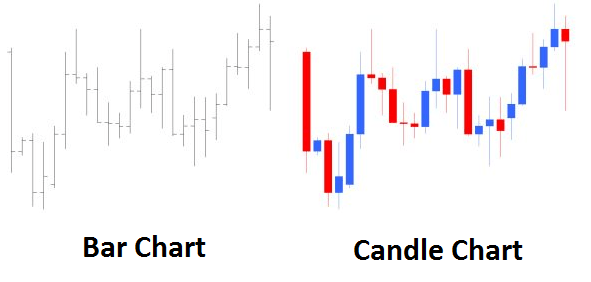
As you can see from the image below, candlestick charts offer a distinct advantage over bar charts. Bar charts are not as visual as candle charts and nor are the candle formations or price patterns. Also, the bars on the bar chart make it difficult to visualize which direction the price moved.

Difference between bar chart and candle chart

How to read a candlestick chart

There are various ways to use and read a candlestick chart. Candlestick chart analysis depends on your preferred trading strategy and time-frame. Some strategies attempt to take advantage of candle formations while others attempt to recognize price patterns.

Interpreting single candle formations

Individual candlesticks can offer a lot of insight into current market sentiment. Candlesticks like the Hammer, shooting star, and hanging man, offer clues as to changing momentum and potentially where the market prices maytrend.

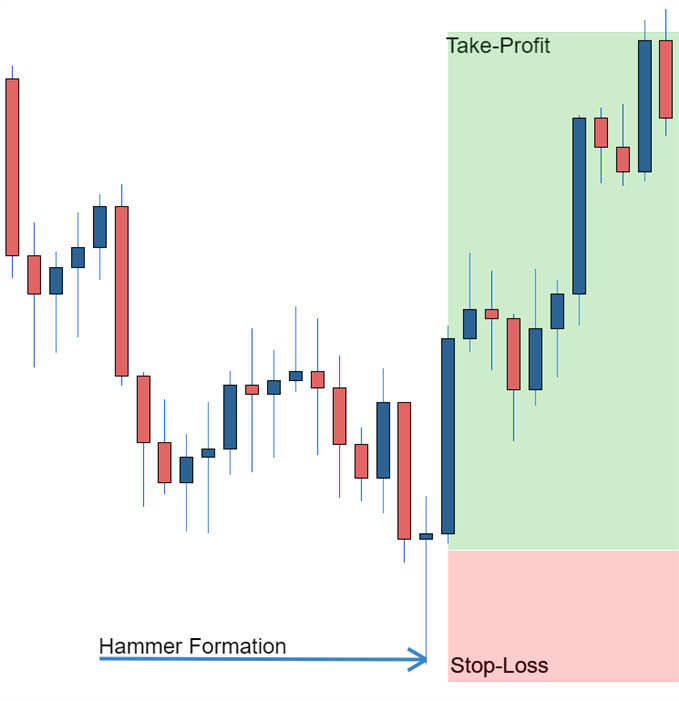
As you can see from the image below the Hammer candlestick formation sometimes indicates a reversal in trend. The hammer candle formation has a long lower wick with a small body. Its closing pricing is above its opening price. The intuition behind the hammer formation is simple, price tried to decline but buyers entered the market pushing the price up. It is a bullish signal to enter the market, tighten stop-losses or close out a short position.

Traders can take advantage of hammer formations by executing a long trade once the hammer candle has closed. Hammer candles are advantageous because traders can implement ‘tight’ stop-losses (stop-losses that risk a small amount of pips). Take-profits should be placed in such a way as to ensure a positive risk-reward ratio. So, the take-profit is larger than the stop-loss.

Hammer formation showing stop loss

Recognizing price patterns in multiple candles

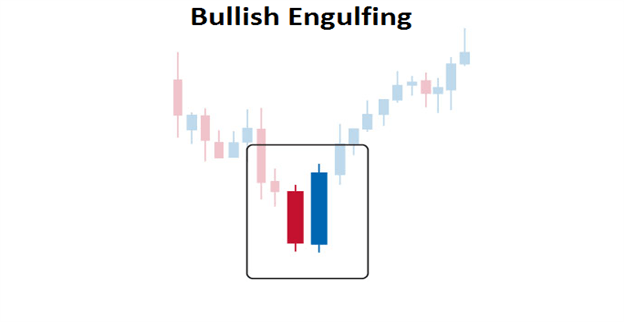
Candlestick charts help traders recognize price patterns that occur in the charts. By recognizing these price patterns, like the bullish engulfing pattern or triangle patterns you can take advantage of them by using them as entries into or exit signals out the market.

For example, in the image below we have the bullish engulfing price pattern. The bullish engulfing is a combination of a red candle and a blue candle that ‘engulfs’ the entire red candle. It is an indication that it could be the end of a currency pairs established weakness. A trader would take advantage of this by entering a long position after the blue candle closes. Remember, the price pattern only forms once the second candle closes.

As with the hammer formation, a trader would place a stop loss below the bullish engulfing pattern, ensuring a tight stop loss. The trader would then set a take-profit. For more forex candlestick charts check our forex candlesticks guide where we go in depth into the advantages of candlestick charts as well as the strategies that can be implemented using them.

Bullish engulfing pattern

British Pound Technical Update: GBP/USD, EUR/GBP Show that Sterling Remains Pressured

British Pound Technical Update: GBP/USD, EUR/GBP Show that Sterling Remains Pressured

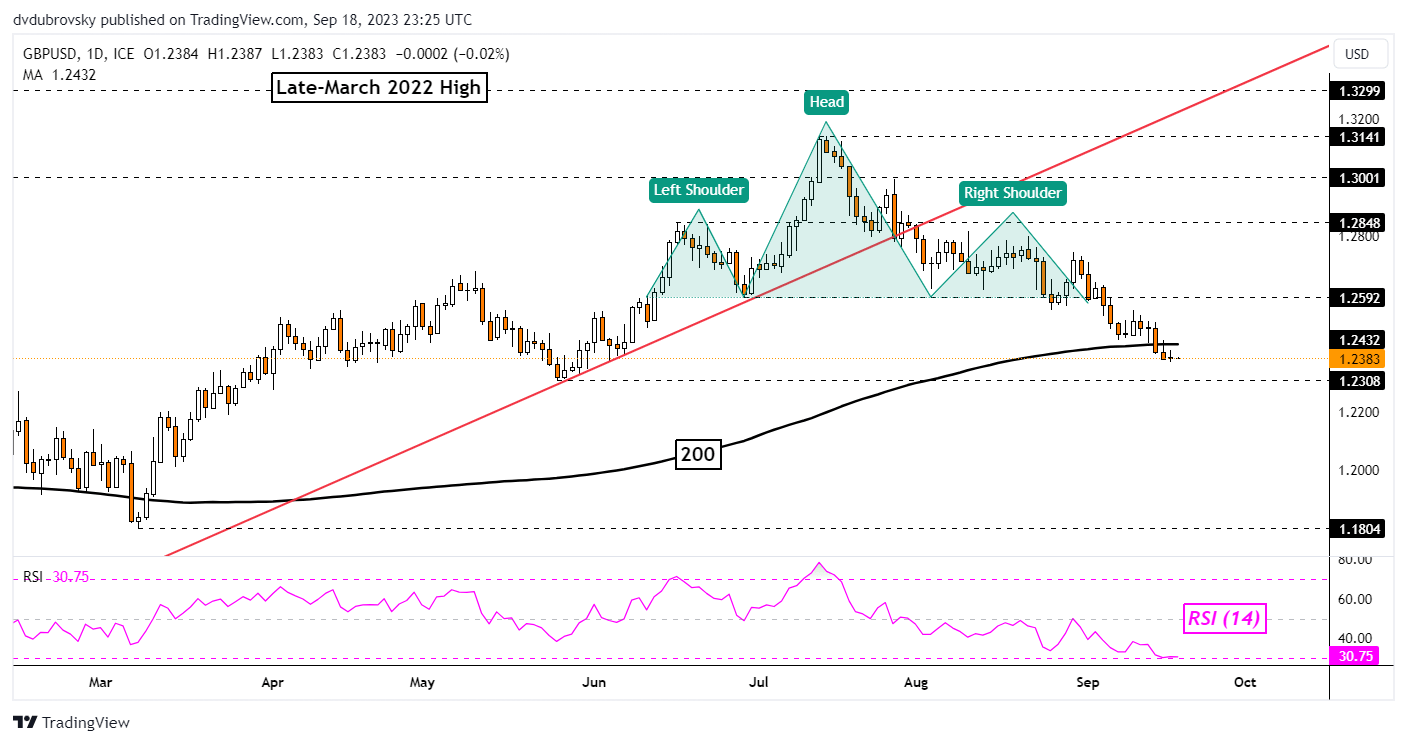
The British Pound may be readying to extend its losing streak against the US Dollar. For context, GBP/USD has been aiming lower since breaking under a bearish Head & Shoulders chart formation, opening the door to an increasingly downward technical bias. Now, prices have confirmed a breakout under the 200-day Moving Average.

That is further underscoring the bearish GBP/USD view, placing the focus on immediate support which is now the May low of 1.2308. This will likely be the next key test. Pushing lower underscores, the near-term bearish bias. Otherwise, a turn higher places the focus back on the neckline of the Head & Shoulders, which is around 1.2592.

image1.png

Chart Created in TradingView

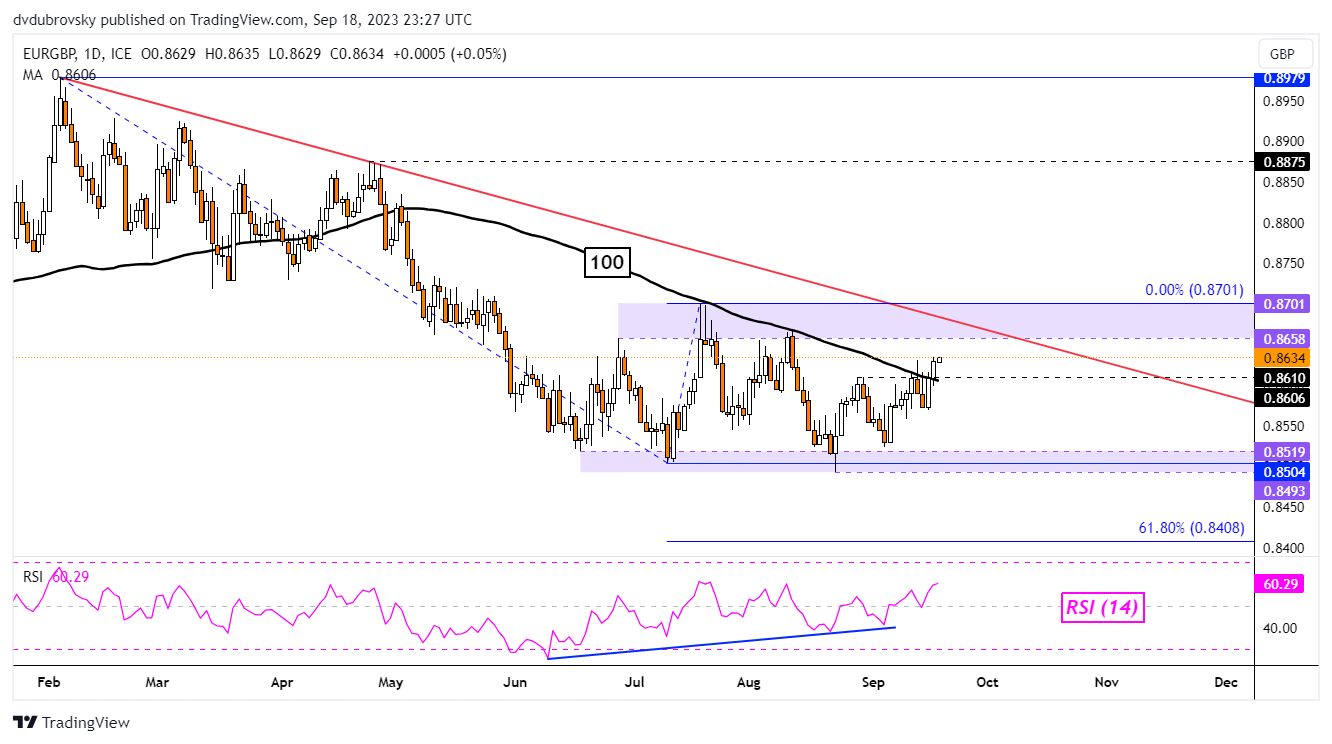
Meanwhile, the British Pound is also losing ground to the Euro. On the daily chart below, EUR/GBP is attempting to confirm a breakout above the 0.861 inflection point and the 100-day Moving Average. While this could open the door to a stronger bullish technical bias for the exchange rate, the broader horizon remains neutral.

EUR/GBP remains in a consolidative setting between resistance (0.8658 – 0.8701) and support (0.8493 – 0.8519). Recent progress does open the door to revisiting the former, as well as the broader falling trendline from February. These could hold as resistance. As such, there is more work for EUR/GBP to do before shifting to a stronger bullish technical bias.

The Fundamentals of Breakout Trading

The Fundamentals of Breakout Trading
Recommended by Daniel Dubrovsky
The Fundamentals of Breakout Trading
Get My Guide

image2.png

Chart Created in TradingView

EUR/USD Forecast: ECB Signals and Grim Economic Data Clash

EUR/USD Forecast: ECB Signals and Grim Economic Data Clash

Friday Overview

On Friday, the EUR/USD slipped by 0.15%. Following a 0.48% loss on Thursday, the EUR/USD ended the week down 0.68% to $1.07946. The EUR/USD struck a Friday high of $1.08417 before revisiting a session low of $1.07659.

Central Bank Guidance Offsets Grim Economic Indicators

It is a busy week for the EUR/USD, with marquee economic indicators from the euro area in focus. While ECB President Lagarde talked about maintaining restrictive policy for as long as required, euro area economic indicators could test the theory.

Trading Derivatives carries a high level of risk to your capital and you should only trade with money you can afford to lose. Trading Derivatives may not be suitable for all investors, so please ensure that you fully understand the risks involved, and seek independent advice if necessary. A Product Disclosure Statement (PDS) can be obtained either from this website or on request from our offices and should be considered before entering into a transaction with us. Raw Spread accounts offer spreads from 0.0 pips with a commission charge of USD $3.50 per 100k traded. Standard account offer spreads from 1 pips with no additional commission charges. Spreads on CFD indices start at 0.4 points. The information on this site is not directed at residents in any country or jurisdiction where such distribution or use would be contrary to local law or regulation.

Inflation figures for Germany and the Eurozone could prove pivotal this week. However, investors must wait until Wednesday and Thursday for German and Eurozone inflation figures. Softer inflation numbers would question the ECB interest rate outlook.

Until Wednesday, central bank commentary and market risk sentiment will remain the key drivers.

There are no euro area economic indicators to consider or ECB Executive Board members on the calendar to speak today. However, investors should monitor ECB commentary with the media.

Central Bank Forward Guidance Leaves Economic Divergence in Focus

Following the Jackson Hole Symposium, the jury is out on whether the Fed or the ECB will lift rates higher. The prospect of the Fed and the ECB leaving rates unchanged leaves economic divergence in focus.

US economic indicators signaled a hotter-than-expected US economy, supporting the recent EUR/USD losses. However, US economic indicators this week need to send a similar message to avoid a dollar sell-off.

Core PCE Price Index, personal spending, and the US Jobs Report are out on Thursday and Friday. The economic calendar sets the EUR/USD pair up for a volatile second half of the week.

For the Fed, sticky inflation, an uptrend in personal spending, a pickup in wage growth, and a steady unemployment rate would likely give the dollar the upper hand.

Tight labor market conditions continue to fuel wage growth and demand-driven inflationary pressures. Further interest rate hikes would hit disposable incomes and consumption. A pullback in consumption would ease demand-driven inflationary pressures.

Later today, we expect investors to brush aside the Dallas Fed Manufacturing Index numbers. The US manufacturing sector accounts for less than 30% of the US economy, leaving the investor focus on the services sector, labor market conditions, and inflation.

EUR/USD Price Action

Daily Chart

The Daily Chart showed the EUR/USD above the $1.0750 – $1.0700 support band. A bullish start to the week saw the EUR/USD move through the 200-day EMA. However, the EUR/USD remains below the 50-day EMA, sending bearish near-term but bullish longer-term price signals.

Looking at the 14-Daily RSI, the 35.27 reading reflects a bearish sentiment. The RSI and the 50-day EMA signal a fall through the 200-day EMA to bring the upper level of the $1.0750 – 1.0700 support band into view. However, a EUR/USD hold above the 200-day EMA would give the bulls a run at the $1.0850 – $1.0900 resistance band.

EUR/USD Daily Chart sends bearish near-term price signals.
EURUSD 280823 Daily Chart

4-Hourly Chart

The EUR/USD remains below the $1.0850 – $1.0900 resistance band. Despite the bullish morning, the EUR/USD sits below the 50-day and 200-day EMAs, sending bearish near and longer-term price signals.

The 14-4H RSI at 42.69 reflects a bearish sentiment, with selling pressure outweighing buying pressure. Significantly, the RSI and EMAs signal a fall through the upper level of the $1.0750 – $1.0700 support band. However, a EUR/USD move through the lower level of the $1.0850 – $1.0900 resistance band would give the bulls a run at the 50-day EMA.

4-Hourly Chart affirms bearish near-term price signals.
EURUSD 280823 4 Hourly Chart