Silver price today: Silver falls

Silver price today: Silver falls

Silver prices (XAG/USD) fell on Thursday, according to FXStreet data. Silver trades at $33.59 per troy ounce, down 0.55% from the $33.77 it cost on Wednesday.

Silver prices have increased by 41.14% since the beginning of the year.

Unit measure Silver Price Today in USD
Troy Ounce 33.59
1 Gram 1.08


The Gold/Silver ratio, which shows the number of ounces of Silver needed to equal the value of one ounce of Gold, stood at 82.70 on Thursday, up from 82.54 on Wednesday.

EUR/USD grips gains on robust Eurozone GDP growth, await US data

EUR/USD grips gains on robust Eurozone GDP growth, await US data

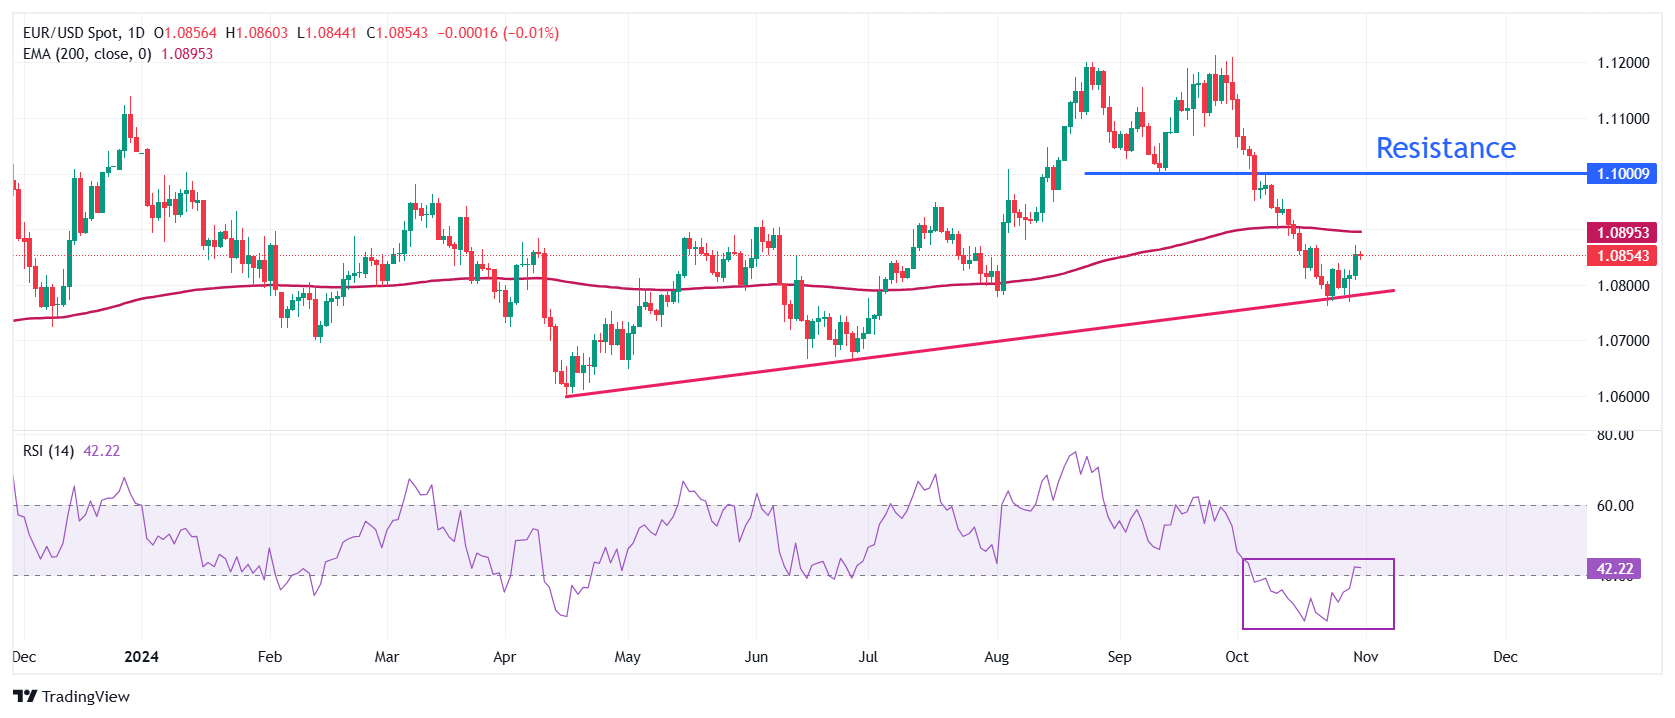
EUR/USD holds up near 1.0850 in Thursday’s European session following Wednesday’s sharp recovery. The major currency pair strengthened as traders have pared back bets of a large interest-rate cut from the European Central Bank (ECB) in the December monetary policy meeting after a faster-than-expected Eurozone Gross Domestic Product (GDP) growth and hotter-than-forecasted German inflation.

Eurostat reported on Wednesday that the Eurozone expanded at a faster pace of 0.9% in the third quarter of the year compared with the same period a year earlier. A major contribution to higher growth in the Eurozone came from its largest nation, Germany, which managed to dodge a technical recession. The German economy surprisingly rose by 0.2% compared with the previous quarter, beating expectations of a 0.1% contraction. Meanwhile, the growth rate in Spain was higher than expected, as forecasted in France, and slower than anticipated in Italy.

The German flash Harmonized Index of Consumer Prices (HICP) for October accelerated at a faster pace of 2.4% on year, higher than estimates of 2.1% and the prior release of 1.8%, suggesting that the battle against inflation is yet not over.

“The just-released flash estimate of German inflation in October could make some members of the ECB regret the latest rate cut and the European Central Bank’s new openness to more aggressive cuts,” said analysts at ING.

For more cues on the current status of inflation, investors will focus on the Eurozone flash HICP data for October, which will be published at 10:00 GMT.

Meanwhile, ECB President Christine Lagarde has shown confidence about taming price pressures in an interview with the French newspaper Le Monde published on Thursday. “The objective is in sight, but I am not going to tell you that inflation is under control,” Lagarde said. She reaffirmed her commitment to interest rate reduction, but refrained from committing to a specific rate cut path.

Technical Analysis: EUR/USD aims to extend upside above 1.0850

EUR/USD trades close to a fresh more than a week high around 1.0850 in European trading hours. The major currency pair holds onto its recent recovery after breaking above the round-level resistance of 1.0800. However, its broader outlook is still bearish as it trades below the 200-day Exponential Moving Average (EMA) at around 1.0900.

The 14-day Relative Strength Index (RSI) climbs to near 42.00 after staying in the 20.00-40.00 range for almost a month, suggesting that the bearish momentum has terminated.

Looking up, the shared currency pair could rise to near the 200-day EMA around 1.0900 and the September 11 low around 1.1000. On the downside, the upward-sloping trendline near 1.0750, which is plotted from the April 16  low at around 1.0600, will be the key support area for the Euro bulls.

Silver Price Forecast: XAG/USD tests nine-day EMA near $33.50

Silver Price Forecast: XAG/USD tests nine-day EMA near $33.50

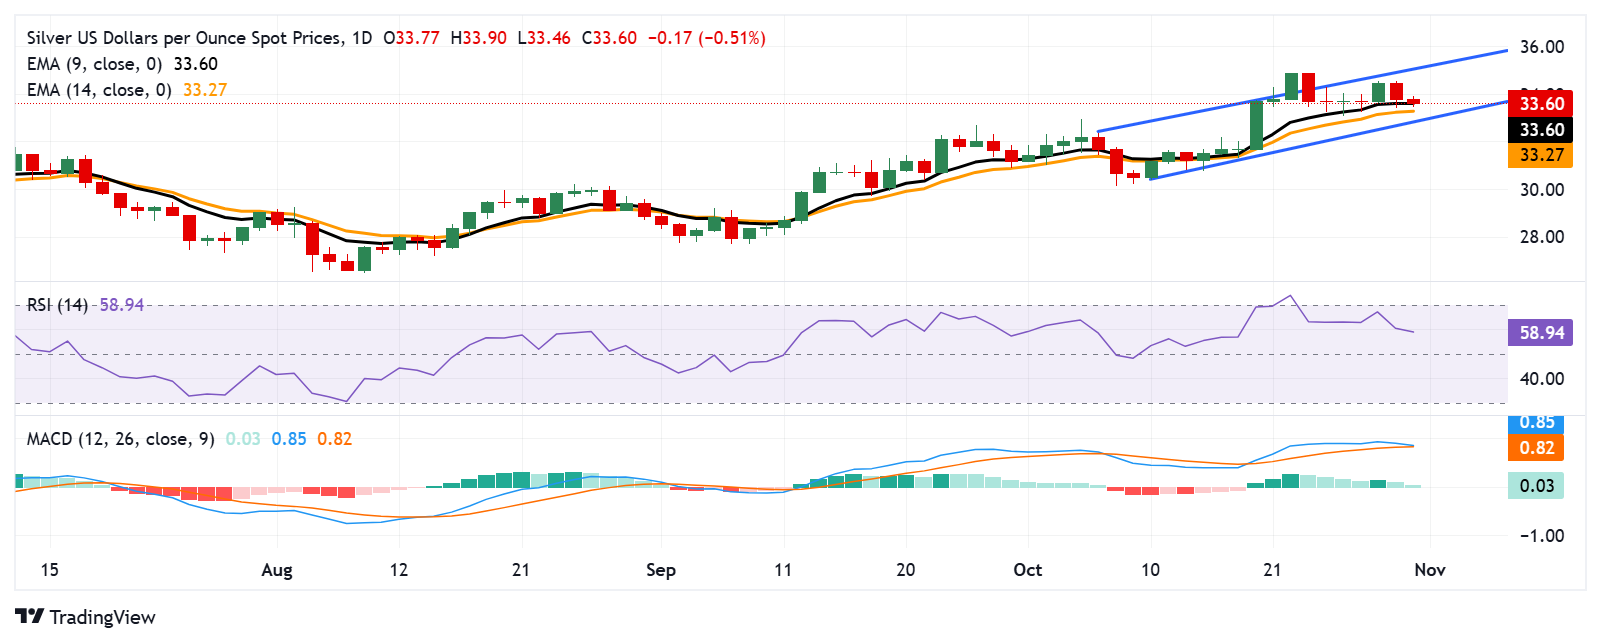
Silver price (XAG/USD) continues to decline, trading at around $33.60 during the European session on Thursday. Analysis of the daily chart indicates a bullish bias, as Silver price consolidates within an ascending channel.

Furthermore, the 14-day Relative Strength Index (RSI) remains above the 50 mark, supporting the prevailing bullish outlook. However, a decline below 50 could signal a shift toward bearish sentiment.

However, the Moving Average Convergence Divergence (MACD) line is positioned above the signal line, indicating a potential bearish signal. A bearish crossover could suggest a shift in momentum from bullish to bearish, signaling a possible sell opportunity. Nonetheless, since both lines remain above the centerline (zero line), this suggests that the overall trend remains bullish.

On the upside, the Silver price may target the psychological level of $35.00, followed by the upper boundary of the ascending channel at $35.10. A breakout above this level could propel the price of the grey metal toward the psychological level of $36.00.

Regarding support, Silver price is testing the nine-day Exponential Moving Average (EMA) at $33.60, with the 14-day EMA at $33.27 serving as the next support level. A drop below this latter level could increase selling pressure, potentially pushing XAG/USD down to the lower boundary of the ascending channel around the psychological level of $33.00.

XAG/USD: Daily Chart

USD/CAD sticks to modest gains above 1.3900 ahead of US PCE data, Canadian GDP

USD/CAD sticks to modest gains above 1.3900 ahead of US PCE data, Canadian GDP

The USD/CAD pair attracts fresh buying on Thursday and for now, seems to have stalled its corrective pullback from the 1.3940 area, or the highest level since August 5 touched the previous day. Spot prices trade above the 1.3900 mark through the first half of the European session as traders keenly await important macro data from the US and Canada.

The US Personal Consumption Expenditure (PCE) Price Index should provide cues about the Federal Reserve’s (Fed) interest rate outlook, which, in turn, will play a key role in influencing the US Dollar (USD) price dynamics. Apart from this, the monthly Canadian GDP print should provide some meaningful impetus to the USD/CAD pair. Heading into the key data risk, renewed selling around Crude Oil prices is seen undermining the commodity-linked Loonie and acting as a tailwind for the currency pair.

The USD, on the other hand, languishes near the weekly low amid the hawkish Bank of Japan (BoJ)-inspired buying around the Japanese Yen (JPY). That said, elevated US Treasury bond yields, bolstered by firming expectations for a less aggressive policy easing by the Fed and deficit-spending concerns after the US election, continue to offer some support to the Greenback. Apart from this, the risk-off impulse benefits the USD’s relative safe-haven status and contributes to the USD/CAD pair’s move up.

The incoming US economic data suggests that the economy remains on strong footing and supports prospects for smaller interest rate cuts by the Fed. Furthermore, investors remain concerned that the spending plans of Vice President Kamala Harris and the Republican nominee Donald Trump will further increase the US fiscal deficit. This, in turn, continues to push the US bond yields higher and favors the USD bulls, suggesting that the path of least resistance for the USD/CAD pair remains to the upside.

Mexican Peso rebounds slightly after four-day decline on Trump tariff fears

Mexican Peso rebounds slightly after four-day decline on Trump tariff fears

The Mexican Peso (MXN) trades mixed in its key pairs – USD/MXN, EUR/MXN and GBP/MXN – on Thursday after weakening for four days running. The continuation lower comes despite a slight improvement in Mexican fundamentals as technical traders ride the Peso’s downtrend.

Mexican Peso struggles as US presidential election draws to a close

The Mexican Peso’s broad weakness could be attributed to the continuing high odds of former President Donald Trump winning the US presidential election on November 5 given his promise to place high tariffs on Mexican imports. In addition, Trump’s preference for lowering taxes despite a rising US debt pile could also potentially lead to higher US Treasury yields and boost the US Dollar (USD), directly impacting USD/MXN.

The election model on polling website FiveThirtyEight gives Trump a 52% chance of winning versus Vice President Kamala Harris’ 48%. Betting website OddsChecker offers fractional odds of 11/18 (or 62.1%) for a Trump win against 28/17 (or 37.8%) for a Kamala Harris victory. The latest opinion polls, however, still place Harris marginally in the lead with 48.1% for the Democrat nominee versus 46.7% for the Republican.

The direct negative impact of a Trump victory on Mexico might be ameliorated, however, by the reality of modern trade between the countries. US, Mexican and Canadian supply chains and economic ecosystems are now intertwined due to three decades of free trade agreements, Mexican imported goods are actually often composed of an amalgam of the three country’s components so tariffs would harm the US as much as Mexico.

Mexican Growth in Q3 beats estimates

The latest macroeconomic figures, meanwhile, offered some relief to the Peso but not enough to push back the tide. Mexican Gross Domestic Product (GDP) growth came out at 1.5% YoY in Q3,  beating estimates of 1.2% but below the 2.1% registered in Q2, according to The Instituto Nacional de Estadistica Geografia e Informatica (INEGI). This follows 1.5% growth In Q1.

The Q3 result was exactly in line with the estimates of the International Monetary Fund (IMF), which downgraded its forecasts for Mexican economic growth by 1.5% for 2024.

On a quarterly basis, Mexican GDP rose by 1.0% QoQ, beating estimates of a 0.8% expansion and the previous quarter’s 0.2% increase.

The growth was broad-based and a positive development, however, it would not “preclude another rate cut in November” from the Bank of Mexico (Banxico), according to Kimberley Sperrfechter, Emerging Markets Economist at London-based advisory service Capital Economics. A cut to Mexico’s relatively attractive 10.50% base interest rate would attract less foreign capital inflows, pressuring the Peso lower.

“We still think the conditions are currently in place for Banxico to press ahead with another interest rate cut at its November meeting. But a lot will depend on the outcome of the US election. A Trump victory – and higher US Treasury yields and a stronger Dollar – would probably prompt Banxico to halt,” said Sperrfechter in a note.

Technical Analysis: USD/MXN extends C wave of bullish pattern

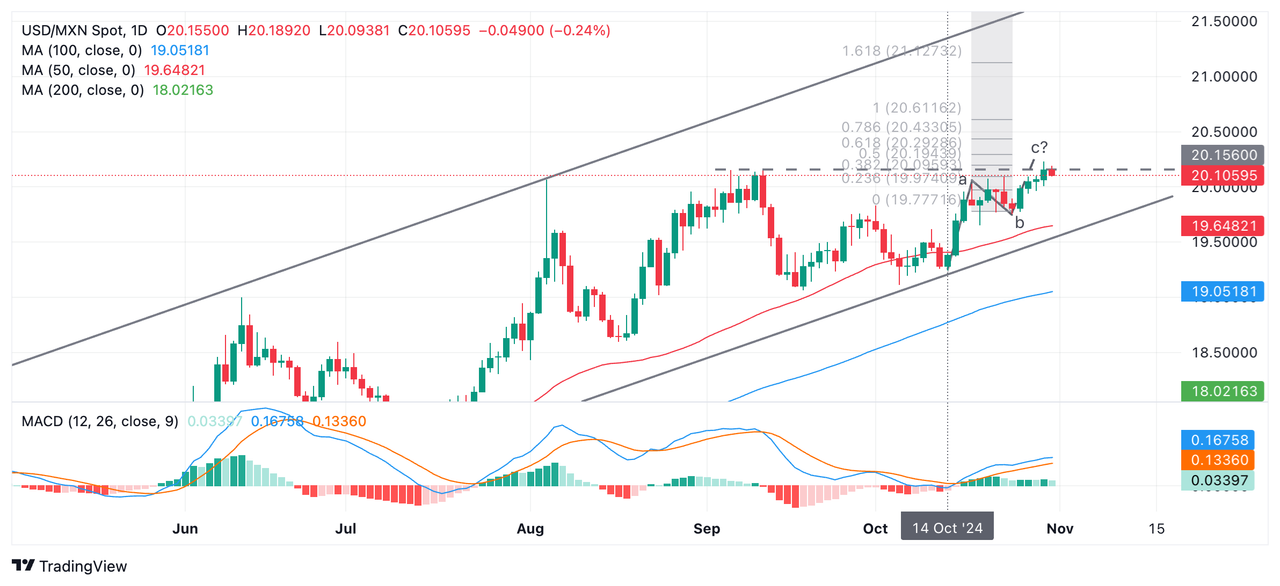
USD/MXN continues unfolding a leg higher, probably the “c wave” of a bullish “abc” pattern, which began at the October 14 swing low.

Wave c will probably reach the Fibonacci 61.8% of the length of wave “a”, giving an upside target of 20.29.

USD/MXN Daily Chart
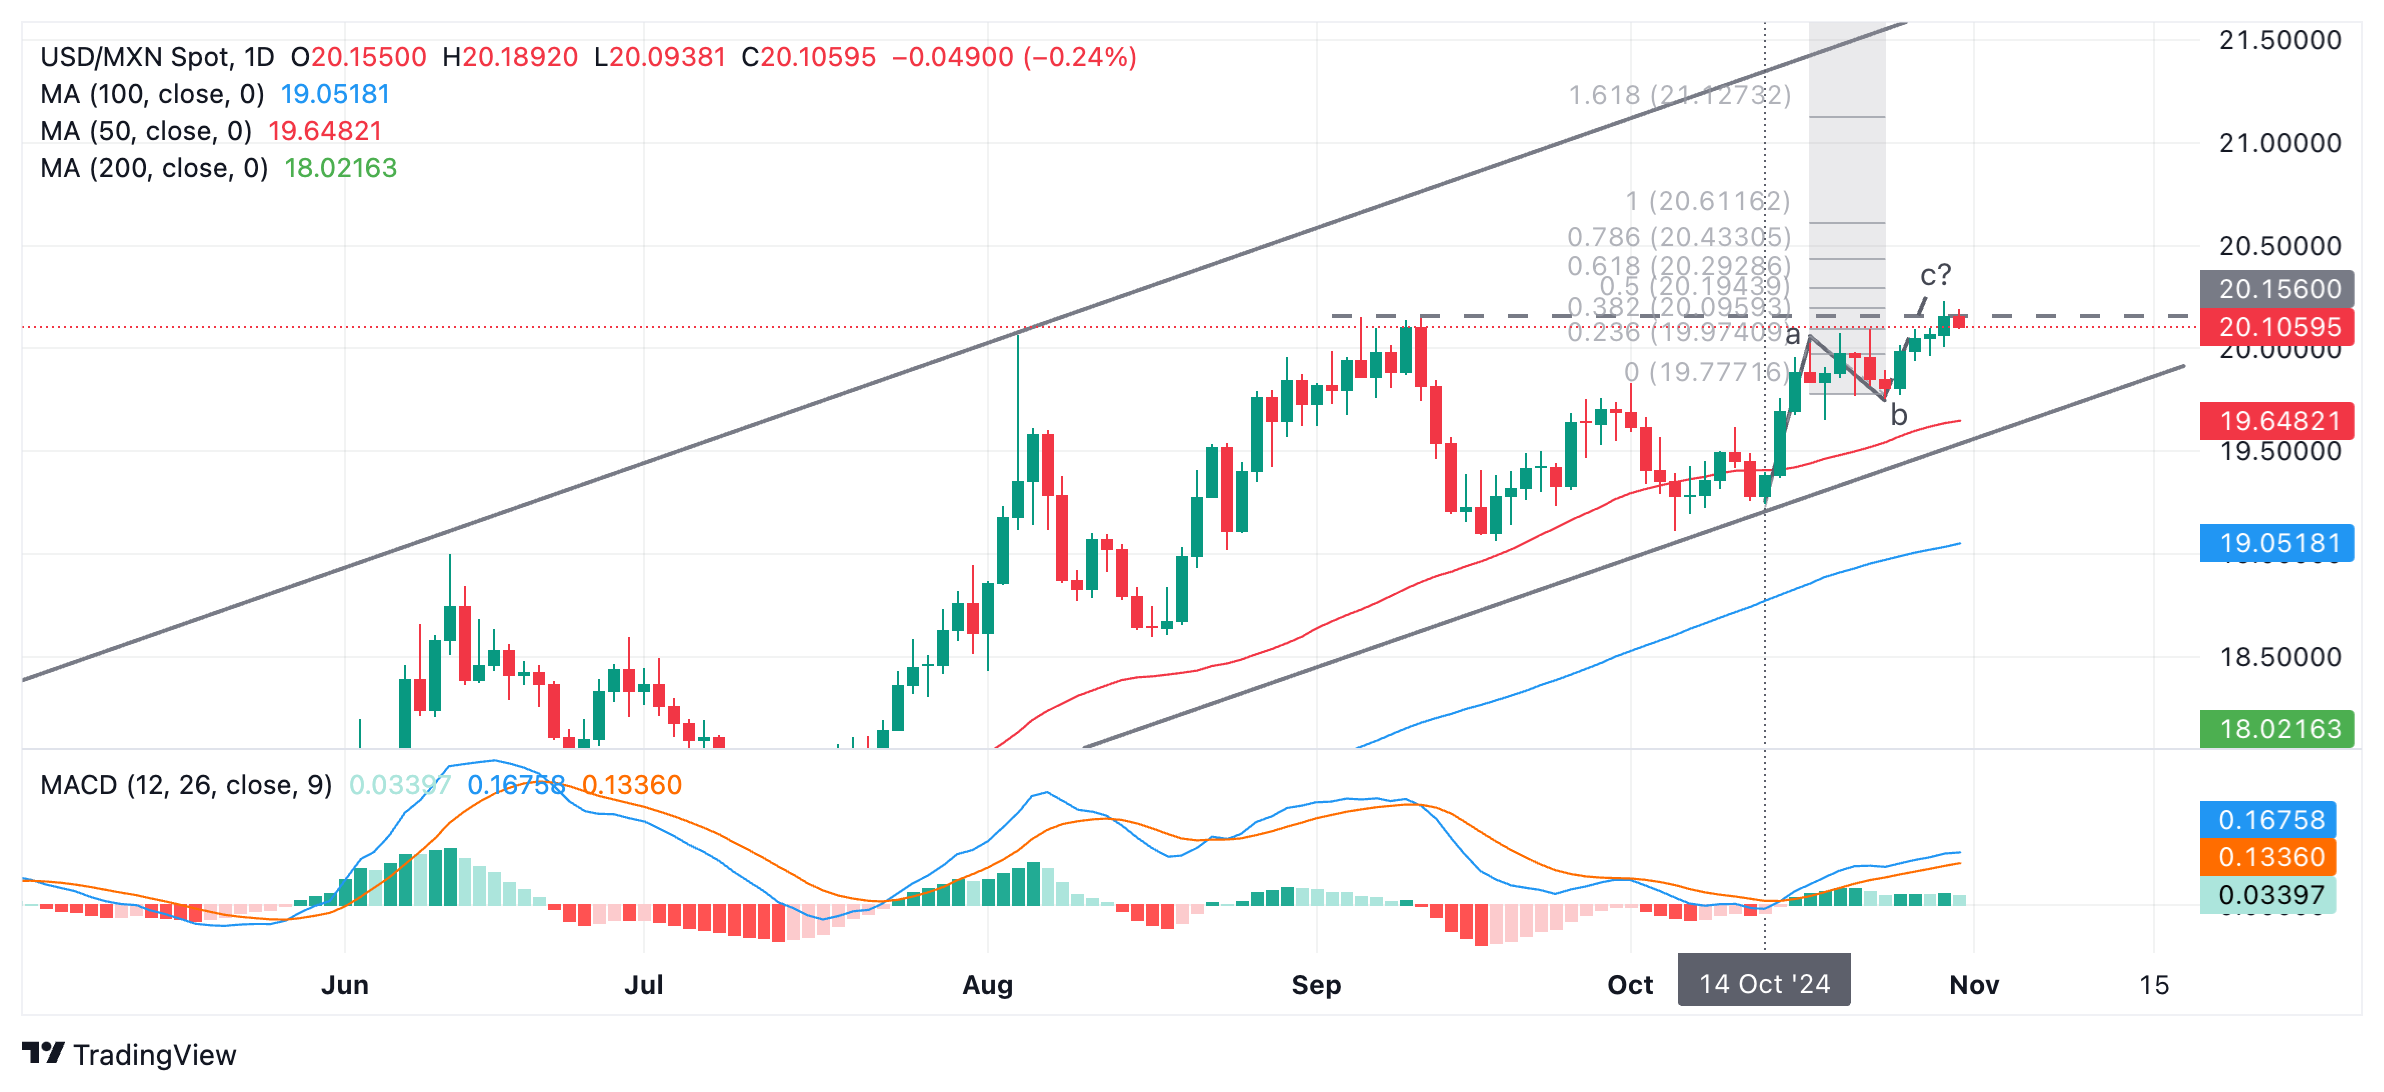
USD/MXN is probably in an uptrend on a short, medium and long-term basis and is trading in a rising channel. Given the technical dictum “the trend is your friend,” the odds favor a continuation higher.

The original break above 19.83 (October 1 high) already confirmed a move up, with a target in the vicinity of the September 10 high at 20.13, which has now been met.


China: PMI shows signs of improvement

China: PMI shows signs of improvement

China’s official PMIs improved in October, probably as a first sign that policy stimulus is having an impact on the economy. Recent measures may take time to filter through to the economy. Also, more details will likely be released during the upcoming meeting of top Chinese policymakers on November 4-8, Commerzbank’s Senior Economist Tommy Wu notes.

All eyes are on the upcoming government meeting

“The official manufacturing PMI rose to 50.1 in October, up from 49.8 in September and after it stayed below the 50-neutral mark for five consecutive months. Among the components, production was firmer inside the expansion territory. New orders rose to 50 after indicating a contraction for five months. This reflects an improvement in domestic demand, likely bolstered by the recent policy stimulus. There are also signs that producer prices may start to stabilize, in month-on-month terms. The subindex on factory gate prices rose to 49.9, just below the 50-neutral mark, while prices of raw material inputs rose above 50 to 53.4.”

“Meanwhile, the non-manufacturing PMI rose to 50.2 in October from 50 in September. This was supported by an improvement in services, in which the subindex rose to 50.1, up from 49.9 below the 50-neutral mark previously. This may be in part due to the seasonal effect of the one-week National Day holiday in early October. The government’s trade-in program that supports the sales of cars and big-ticket items may also have a role to play.”

“All eyes are on the upcoming government meeting on November 4-8, in which the Standing Committee of National People’s Congress will discuss and approve economic and financial policies. The meeting is expected to fill in the details of policy measures previously announced. These include stimulus and measures that support consumption, the property sector, and local government financing.”


US GDP in line with expectations

US GDP in line with expectations

In contrast to the ADP figure, the publication of the US GDP data (for Q3) did not come as any major surprise. The figure (+2.8% annualized) was close to the median of analyst estimates (2.9%), so it was not a big surprise, Commerzbank’s Head of FX and Commodity Research Ulrich Leuchtmann notes.

Further US growth impulses are needed for new USD strength

“Of course, with growth rates like these, the US continues to have a significant growth advantage over other major developed economies, which are virtually stagnating after the immediate post-corona recovery has ended: the eurozone, the UK, and Japan. And that justifies USD strength. But we have to be careful. This growth advantage is not new. After all, the dollar is already strong. See figure below. US growth strength is already priced into Fed expectations, asset prices and USD exchange rates, it seems to me.”

“Further US growth impulses would be needed for new USD strength. One or the other currency trader may expect a second Trump presidency to provide such impulses. That may well be. I would just like to remind you that other conditions are also needed for this. Among other things, a Fed monetary policy that continues to be guided by reason.”

“Be that as it may, I think it’s plausible that some market participants want to wait until the election and do not want to enter active positions based on current real economic data.”

NZD/USD Price Forecast: Remains below 0.6000, upper boundary of the descending channel

NZD/USD Price Forecast: Remains below 0.6000, upper boundary of the descending channel

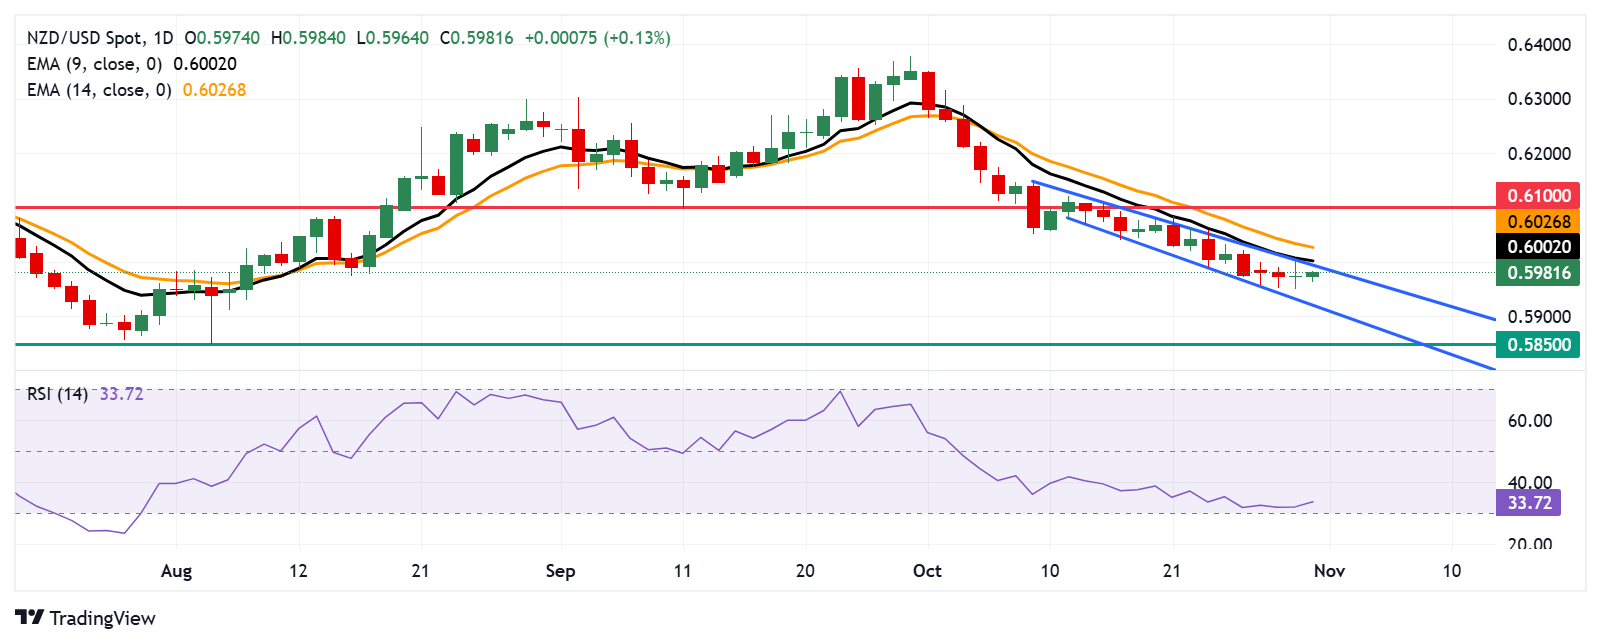
The NZD/USD pair extends gains for the second consecutive session, trading near 0.5980 during Thursday’s European session. Daily chart analysis shows a bearish bias, with the pair moving within a descending channel. A breakout above this descending channel could signal a potential shift in momentum.

Further supporting this outlook, the nine-day Exponential Moving Average (EMA) remains below the 14-day EMA, reinforcing the bearish sentiment for NZD/USD. Short-term momentum appears weak, indicating continued downward pressure.

The 14-day Relative Strength Index (RSI), a key momentum indicator, hovers just above 30. A dip below this threshold would signal an oversold condition, potentially hinting at an impending upward correction for the NZD/USD pair.

On the downside, NZD/USD may approach the lower boundary of the descending channel near 0.5920. A decisive break below this support could drive the pair toward the next “pullback support” around the 0.5850 level.

On the resistance side, the initial hurdle for NZD/USD lies at the upper boundary of the descending channel, aligning with the nine-day Exponential Moving Average (EMA) near 0.6001, followed by the 14-day EMA at 0.6026. A sustained move above these EMAs could shift the pair to a short-term bullish stance, potentially targeting the psychological level of 0.6100.

NZD/USD: Daily Chart

USD: Dollar takes a back seat to overseas events

USD: Dollar takes a back seat to overseas events

The Dollar Index (DXY) has softened a little this week – largely in response to overseas events. Here the third-quarter eurozone growth data and October German price data were stronger than expected and have prompted the market to scale back expectations of a 50bp ECB rate cut this December, ING’s FX analyst Chris Turner notes.

DXY is currently on support at 104.00

“And this morning we have just seen USD/JPY drop nearly 1% on Bank of Japan Governor Kazuo Ueda’s press conference outlining a plan to continue with rate hikes should the BoJ’s forecasts be realised. Most recently the market had felt the BoJ would be less likely to hike on the back of uncertain political developments and potentially a more dovish make-up of the Japanese government.”

“That brings us to the USD. Dollar strength this month has all been about a market positioning for a Donald Trump win and US rate spreads widening in favour of the dollar as the Rest of the World turns more dovish. Well, it seems that the ECB and BoJ may not be quite as dovish as some had feared – news that could potentially cap the dollar’s rally for the time being.”

“Given that background, a sticky core PCE deflator today – the Fed’s preferred price gauge – at 0.3% month-on-month may not need to send the dollar that much higher. DXY is currently on support at 104.00 and after one-way bullish traffic for over a month, may be due a modest correction to the 103.65 area.”

Gold price keeps the red below record high, downside seems limited ahead of US PCE data

Gold price keeps the red below record high, downside seems limited ahead of US PCE data

Gold price (XAU/USD) maintains its offered tone through the early European session on Thursday amid a further rise in the US Treasury bond yields. Apart from this, bets for a less aggressive policy easing by the Federal Reserve (Fed) turn out to be key factors exerting some downward pressure on the non-yielding yellow metal. Any meaningful corrective slide for the commodity, however, seems elusive in the wake of the uncertainty surrounding the US presidential election and Middle East tensions.

Adding to this, the risk-off impulse – as depicted by a generally weaker tone around the equity markets – continues to offer some support to the safe-haven precious metal. Traders also seem reluctant and might prefer to wait on the sidelines ahead of the release of the US Personal Consumption Expenditure (PCE) Price Index. This, along with the Nonfarm Payrolls (NFP) report on Friday, should provide cues about the Fed’s interest rate outlook and provide a fresh directional impetus to the XAU/USD.

Technical Outlook: Gold price needs to consolidate or retreat a bit before the next leg up amid overbought RSI

From a technical perspective, the recent move up along an upward-sloping channel from the August monthly swing low points to a well-established short-term bullish trend. That said, the Relative Strength Index (RSI) on the daily chart is already flashing overbought conditions. Hence, any subsequent move up is more likely to remain capped near the $2,800 mark. The said handle represents the top boundary of the channel, which if broken decisively will be seen as a fresh trigger for bulls and set the stage for an extension of the appreciating move.

On the flip side, any meaningful corrective decline now seems to find decent support near the $2,750-2,748 region or a trading range resistance breakpoint. Some follow-through selling could make the Gold price vulnerable to extend the fall further towards the $2,732-2,730 intermediate support en route to the $2,715 area. This is followed by the $2,700 mark, which if broken should pave the way for a decline towards the next relevant support near the $2,675 zone en route to the $2,657-2,655 region.