Become our regional representative

Become our regional representative

We are looking for a regional representative in your region!

Run your business with a high-tech and reliable broker that traders make money with!

Benefits of cooperation with LiteFinance:

  • an exclusive right to represent LiteFinance and manage its local office in your country;
  • freedom to choose a business model for your region;
  • marketing support: promotional material, online marketing, advertising, SEO promotion in your country;
  • unique bonuses and contests developed especially for your country;
  • description of successful business cases from similar regions;
  • training for your employees and full informational support;
  • high reward and individual approach to your IB conditions;
  • special trading conditions for the traders from your region;
  • advanced statistics with the access to the CRM system and the opportunity to develop the existing lead database;        follow this site and fill the form below: https://www.litefinance.org/partners/programs/regional/
Gold Weekly Forecast: XAU/USD Bullish Drivers Dissipate

Gold Weekly Forecast: XAU/USD Bullish Drivers Dissipate

Gold Volatility Subsides Ahead of High Importance US Data

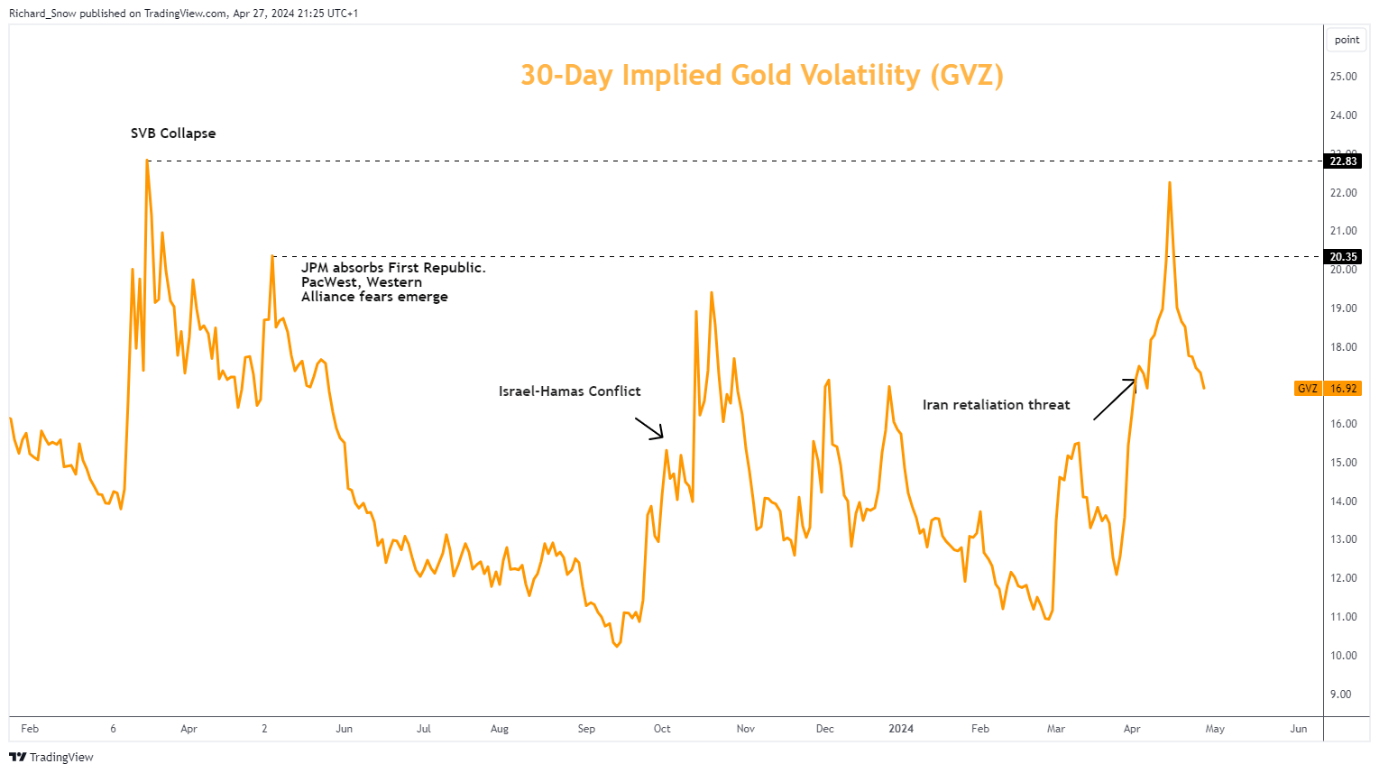
Gold volatility has subsided drastically now that the risk of a broader conflict between Israel and Iran have been greatly reduced. Riskier assets like the S&P 500 and high-beta currencies like the Aussie dollar and British pound managed to claw back prior losses as risk sentiment improved. As a result, gold’s former safe haven bid has had the wind taken out of its sails.

In the coming week, the US Treasury is set to update the public on details of its funding needs and will provide specifics around whether bond issuance is likely to favour shorter or longer duration – which is likely to affect the shorter and longer dated yields and potentially, gold.

Gold Volatility Index (GVZ)

image1.png

Gold Nudges Higher Despite Lack of Major Bullish Drivers

The precious metal may soon have to face the reality of the Fed funds rate remaining higher for longer after inflation data proved worrisome on Friday. A string of hotter-than-expected price data culminated in Friday’s PCE print where both headline and core inflation beat expectations.

Increasing attention has been placed on shorter-term measures of price trends like the month-on-month comparisons, which has been rising – which hasn’t gone unnoticed at the Fed. Jerome Powell acknowledged the undesirable uptick in inflation but reiterated that policy is poised to react to any outcome and the Vice Chairman of the Fed, John Williams even made mention of another hike is needed.

The prospect of higher inflation has forced markets to backtrack on ambitious rate cuts initially eyed for 2024, extending the dollars longer-term strength. A stronger dollar and rising yields have had little effect on the precious metal when geopolitical uncertainty was at its peak, but with the recent de-escalation and in the absence of any further catalysts, gold bulls may soon run out of momentum.

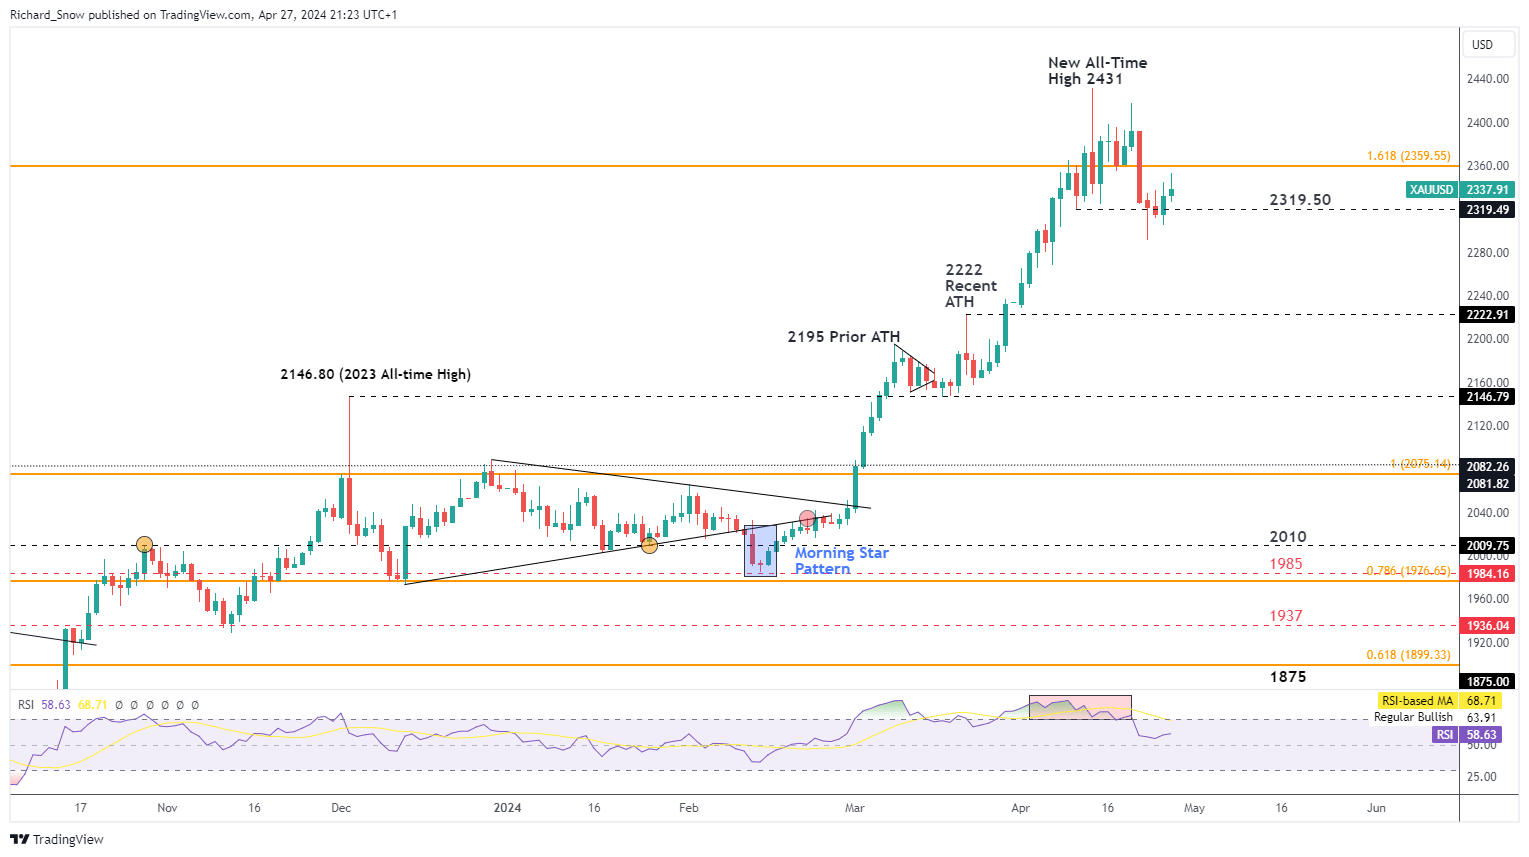
Gold bounced off of support at $2320 – a prior swing low. If prices remain above this level, the bullish continuation remains constructive. However, in the absence of a catalyst, the upside potential may be greatly reduced.

Gold Daily Chart

image2.png

Gold market trading involves a thorough understanding of the fundamental factors that determine gold prices like demand and supply, as well as the effect of geopolitical tensions and war. Find out how to trade the safe haven metal by reading our comprehensive guide:

US Dollar Forecast: Focus Shifts from Risk Rally to the Fed, NFP

US Dollar Forecast: Focus Shifts from Risk Rally to the Fed, NFP

Late US Dollar Surge to be Tested this Week

The coming week brings with it plenty of US-centered event risk. The week starts with the Treasury’s quarterly refunding announcement – detailing how the US government will fund itself. Then on Wednesday US growth concerns could build momentum if ISM manufacturing PMI data follows the S&P Global version by dipping into a contraction.

On Wednesday, the FOMC statement is due, with the committee unlikely to alter the fed funds rate but there will be a strong focus on growth and inflation and how the group perceive these risks. Friday brings the week to a close with the NFP report with further resilience expected.

A bull flag appears to be in the works, with Friday’s late push hinting at a bullish continuation into next week but the recent risk rally has pushed the greenback aside.

US Dollar Basket (DXY) Daily Chart

image1.png

Source: TradingView, prepared by Richard Snow

Risk Rally Helps Aussie Claw Back Recent Losses

The Aussie dollar used this opportunity to regain its positioning against the dollar after a series of sharp declines. AUD gained favour after the risk of a broader conflict in the Middle East appeared to subside and big tech stocks reported earnings. The high-beta currency has a historical link to the S&P 500 and has moved in close correlation to the US index. The S&P 500 has posted a rocky recovery this week after mega-cap stocks reported their quarterly earnings and AUD rose alongside it.

Aussie inflation also rose worryingly, helping to extend AUD gains, effectively removing rate cuts for the Reserve Bank of Australia for 2024 (according to market expectations). With Apple and Amazon next up this week, there is scope for further risk seeking behaviour. 0.6590 becomes the next level of resistance but the more immediate challenge at the start of the new week will be to trade above the 50 and 200-day simple moving averages.

AUD/USD Daily Chart

image2.png

Looking for actionable trading ideas? Download our top trading opportunities guide packed with insightful tips for the second quarter!

GBP/USD: Sterling Recovers but Upside Challenge Emerges

GBP/USD benefitted from the recent risk rally, recovering lost ground against the dollar. The psychological level of 1.2500, however, poses an immediate challenge for bulls at the start of the week as price action has already shown a reluctance to push higher. In addition, the 200-day SMA appears at 1.2557 should the initial hurdle prove ineffective.

With the Bank of England issuing a rather dovish message before the media blackout period, sterling may find gains hard to come by. The BoE anticipates inflation will drop sharply into the summer and early indications suggest it may stay there, according to Dave Ramsden.

GBP/USD Daily Chart

image3.png

USD/JPY: Markets Propel the Pair Towards 160.00 After BoJ Meeting

USD/JPY continues to power ahead, regardless of hollow threats (thus far) from Japanese authorities. The Bank of Japan (BoJ) meeting held the potential to issue a hawkish message regarding the yen’s weakness, but opted to stick to similar messaging regarding a calculated hiking cycle that is largely data dependent and contingent upon hitting the 2% inflation target.

The weekly chart below shows just how quickly markets piled into the long side of USD/JPY, particularly after US PCE data beat expectations. Japan enters its Golden Week holiday period with authorities undoubtedly in a state of unease. Lower liquidity conditions that typically accompany the bank holidays present an opportunity for maximum effectiveness should authorities decide to dump large amounts of USD for yen. FX intervention becomes a more imminent threat the higher the pair rises. The 155.00 level was the prior line in the sand and now 160.00 is fast approaching with the pair immediately testing channel resistance.

USD/JPY Weekly Chart

image4.png

The daily chart reveals the massive move higher on Friday with the RSI heading further into overbought territory. With the USD-JPY interest rate differential still significantly wide, markets realise that any FX intervention is likely to provide better entry levels for bullish continuation plays until such time as the BoJ can meaningfully close the gap. Therefore, a co-ordinated effort between Japan, South Korea and the US to strengthen the Asian currencies may be needed now more than ever.

USD/JPY Daily Chart

image5.png


Gold (XAU) Daily Forecast: XAU Nears $2,335; More Upside Ahead?

Gold (XAU) Daily Forecast: XAU Nears $2,335; More Upside Ahead?

Market Overview

Gold prices experienced a modest increase in Asian trading on Friday, with spot gold rising to $2,335 an ounce. This uptick comes amid signs of a cooling U.S. economy, which has revived some demand for gold, although gains were tempered by the market’s anticipation of crucial inflation data.

Gold Prices Constrained by Inflation Data Anticipation 

Despite this slight increase, gold is on track for a significant weekly loss, projected at 2%. The decline extends from the record highs near $2,430 per ounce seen earlier in April. Investors are particularly focused on the upcoming Personal Consumption Expenditures (PCE) Price Index data, a key indicator for the Federal Reserve’s rate decisions, which is expected to show a steady rate at 0.3% month-over-month.

Experts Trade Gold with IC Markets

Trading Derivatives carries a high level of risk to your capital and you should only trade with money you can afford to lose. Trading Derivatives may not be suitable for all investors, so please ensure that you fully understand the risks involved, and seek independent advice if necessary. A Product Disclosure Statement (PDS) can be obtained either from this website or on request from our offices and should be considered before entering into a transaction with us. Raw Spread accounts offer spread

Economic Indicators Impacting Gold 

The initial rise in gold prices was influenced by a drop in the U.S. dollar, which followed softer-than-expected U.S. GDP growth data showing an increase of just 1.1% annually in the first quarter.

However, a higher GDP price index, indicating stronger inflation pressures at 2.6% annually, led traders to adjust their expectations for the Federal Reserve’s interest rate policies, tempering gains in gold prices.

Geopolitical and Economic Pressures 

The lack of escalation in Middle Eastern conflicts, particularly the anticipated Iran-Israel conflict, also reduced the risk premium traditionally associated with gold.

Furthermore, market sentiment about the Federal Reserve’s interest rate path has significantly impacted gold’s outlook. The CME Fedwatch tool now indicates that traders expect the Fed to begin cutting rates only by September or later in the fourth quarter of 2023.

Investors are now bracing for more immediate data points such as the core PCE Price Index, alongside personal income and spending figures. Personal income is anticipated to rise by 0.5% month-over-month, up from 0.3%, and personal spending is expected to show a decrease to 0.6% from 0.8%.

Additionally, the revised University of Michigan Consumer Sentiment and Inflation Expectations are set for release, with sentiment holding steady at 77.9 and inflation expectations at 3.1%.

Gold Prices Forecast

Gold - Chart
Gold – ChartOn April 26, gold saw a slight increase in its value, reaching $2,335.79, marking a 0.22% rise. Currently, gold is trading just above its pivot point at $2,325.66, suggesting a tentative bullish stance in the short term. Immediate resistance for gold is found at $2,370.56, with further barriers at $2,418.45 and $2,463.94. If the price can breach these levels, it could indicate a strong upward momentum.

Conversely, support levels are set at $2,290.40, followed by $2,248.71 and $2,212.49. A drop below these could trigger a significant downturn in prices. Technical indicators reinforce this outlook, with the 50-Day Exponential Moving Average (EMA) at $2,340.08 slightly above the current price, suggesting mild resistance, while the 200-Day EMA at $2,273.08 offers robust support.

The market’s current configuration points towards a bullish scenario as long as prices remain above the pivot point of $2,325.66.

Bank of Japan Monetary Policy Decision Sends the USD/JPY to 156

Bank of Japan Monetary Policy Decision Sends the USD/JPY to 156

The Bank of Japan Left Monetary Policy Unchanged

On Friday (April 26), the Bank of Japan delivered its first monetary policy decision since exiting negative rates in March.

Experts Trade USD/JPY with IC Markets

Trading Derivatives carries a high level of risk to your capital and you should only trade with money you can afford to lose. Trading Derivatives may not be suitable for all investors, so please ensure that you fully understand the risks involved, and seek independent advice if necessary. A Product Disclosure Statement (PDS) can be obtained either from this website or on request from our offices and should be considered before entering into a transaction with us. Raw Spread accounts offer spread
  • The BoJ will support the uncollateralized overnight call rate between 0-0.1%.
  • The BoJ will continue conducting bond purchases per the March 2024 decisions.

According to the BoJ Outlook Report,

  • The economy will likely continue growing above its potential growth rate.
  • Year-on-year, the BoJ expects the annual inflation rate to be in the 2.5-3.0% range for 2024 and 2% for 2025 and 2026.
  • The BoJ projections for growth in 2023 and 2024 were lower than in the previous Outlook Reports due to weaker private consumption.
  • However, 2024 projections for core inflation were higher.
  • Risks to the outlook included uncertainties about economic activity and prices.
  • Several factors could fuel the uncertainties, including domestic wage and price-setting trends.

USD/JPY Reaction to the BoJ Monetary Policy Decision

Before the BoJ monetary policy decision and Outlook Report, the USD/JPY fell to a low of 155.510 before rising to a high of 155.659.

In response to the BoJ monetary policy decision and Outlook Report, the USD/JPY fell to a low of 155.408 before surging to 156.136.

On Friday (April 26), the USD/JPY was up 0.31% to 156.135.

USD/JPY surges on BoJ policy decision.

260424 USDJPY 3 Minute Chart

Up Next

The Bank of Japan press conference will be the focal point for investors. Views on the Japanese Yen, inflation, the economic outlook, and the timeline for interest rate hikes need investor consideration.

Recently, the BoJ sent mixed signals about the interest rate trajectory. The BoJ warned against expectations of multiple rate hikes. However, the BoJ also stated that a continued acceleration of inflation toward the 2% target would warrant a BoJ response.

Later in the session, the US economic calendar will be in the spotlight. The US Personal Income and Expenditures Report will warrant investor attention.

Economists forecast personal income and spending to increase by 0.5% and 0.6% in March, respectively. In February, personal income and spending advanced by 0.3% and 0.8%, respectively.

Moreover, economists expect the Core PCE Price Index to increase 2.6% year-on-year in March. The Core PCE Price Index rose by 2.8% year-on-year in February.

A hotter-than-expected Personal Income and Expenditures Report could sink bets on multiple 2024 Fed rate cuts.

Japanese Yen Slumps to Fresh Multi-Decade Lows, USD/JPY Eyes US PCE Report

Japanese Yen Slumps to Fresh Multi-Decade Lows, USD/JPY Eyes US PCE Report

The Japanese Yen has touched new multi-decade lows against a basket of currencies following the Bank of Japan’s expected decision to keep its monetary policy unchanged. The latest catalyst for the Yen’s decline was weaker-than-expected inflation data from Tokyo, which has further solidified the central bank’s accommodative stance. Tokyo CPI is seen as an important leading indicator for national inflation. As the BoJ diverges from other major central banks in policy tightening, the Yen remains vulnerable to further volatility and depreciation.

image1.png

For all market-moving global economic data releases and events, see the DailyFX Economic Calendar

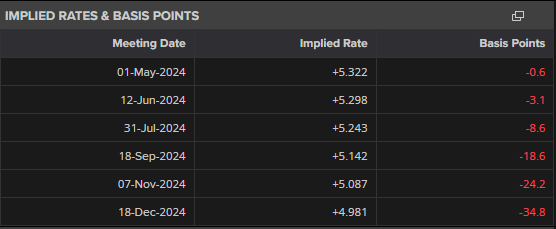
The next data release for traders to follow is US Core PCE at 13:30. Yesterday’s BEA inflation readings showed inflation remaining elevated and at levels that will prevent the Federal Reserve from cutting rates in Q3. Market probabilities now show one 25 basis point rate cut, most likely at the November 7th FOMC meeting, with a total of 34 basis points of cuts now predicted in 2024. On the back of reduced rate cut expectations, the dollar’s ongoing strength is also acting as a tailwind for USD/JPY.

image2.png

USD/JPY is now above 155.00, seen by the market as the level at which the BoJ will start seriously considering FX intervention to prop up the Yen. This line in the sand has now been breached and brings into question if coordinated FX intervention is being talked about by the BoJ with other major central banks. The weakness of the Yen makes Japanese exports more competitive globally, and may soon spark calls from other central bankers and finance ministers for this advantage to be reined in.

The charts below show the relentless weakening of the Yen and bring official intervention ever closer. The longer the BoJ remains on the sidelines, the more markets will force them into action. The longer the BoJ waits, the more violent the subsequent Yen appreciation will be. The Japanese Yen used to be seen as a safe currency to trade, aided by the carry trade. That is no longer the case and strict risk management is a must when trading any Japanese Yen crosses.

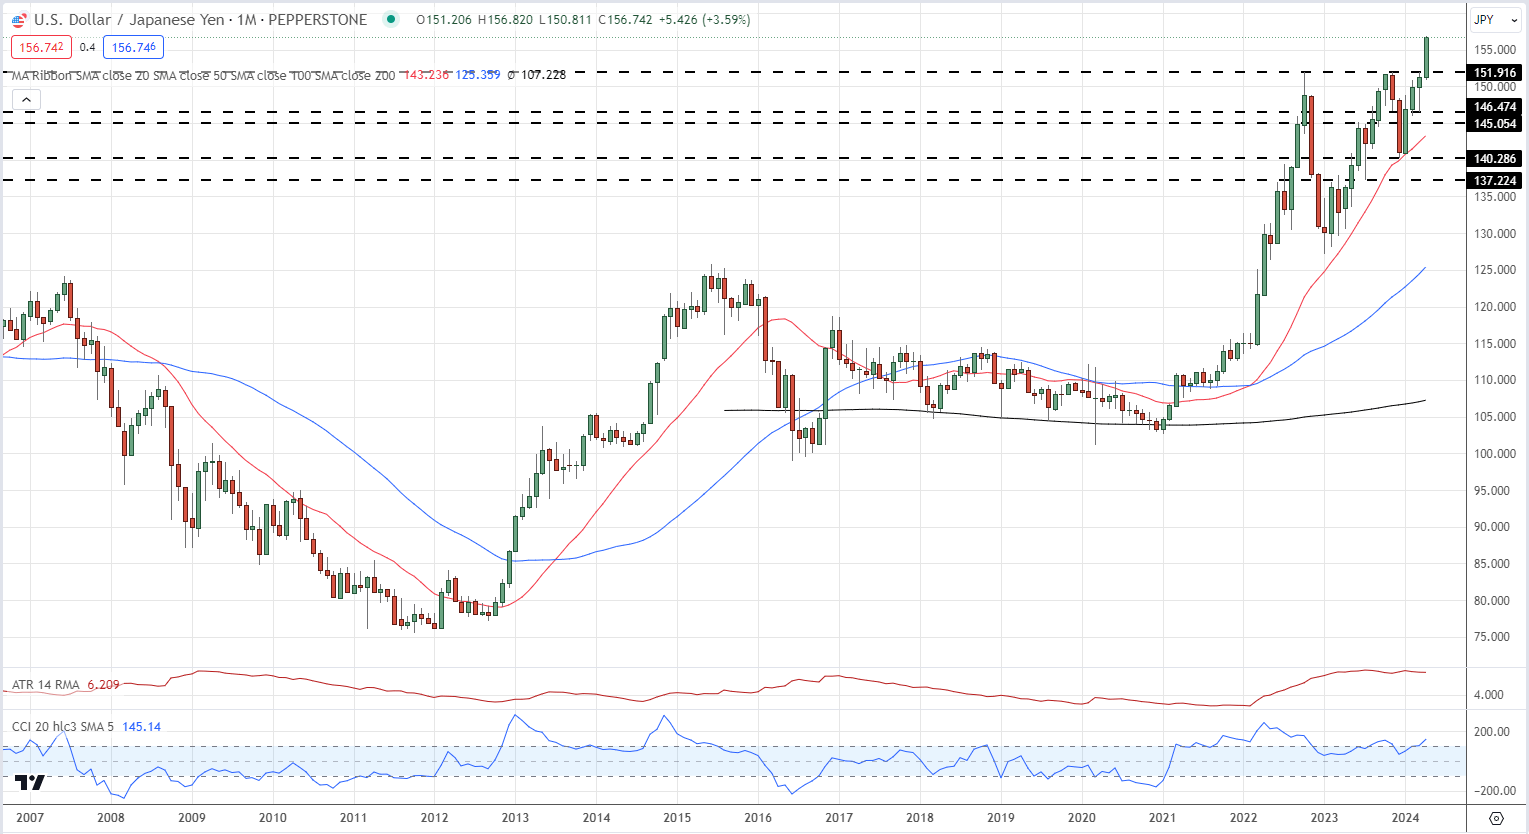
Looking at three monthly Yen charts highlights the weakness in the Japanese currency. USD/JPY now trades around 156.75, a 34-year high….

USD/JPY Monthly Price Chart
Retail trader data shows 15.39% of traders are net-long with the ratio of traders short to long at 5.50 to 1.The number of traders net-long is 2.82% higher than yesterday and 8.10% higher than last week, while the number of traders net-short is 2.56% higher than yesterday and 7.20% higher than last week.

We typically take a contrarian view to crowd sentiment, and the fact traders are net-short suggests USD/JPY prices may continue to rise.

Download the Latest IG Sentiment Report and discover how daily and weekly shifts in market sentiment can impact the price outlook:

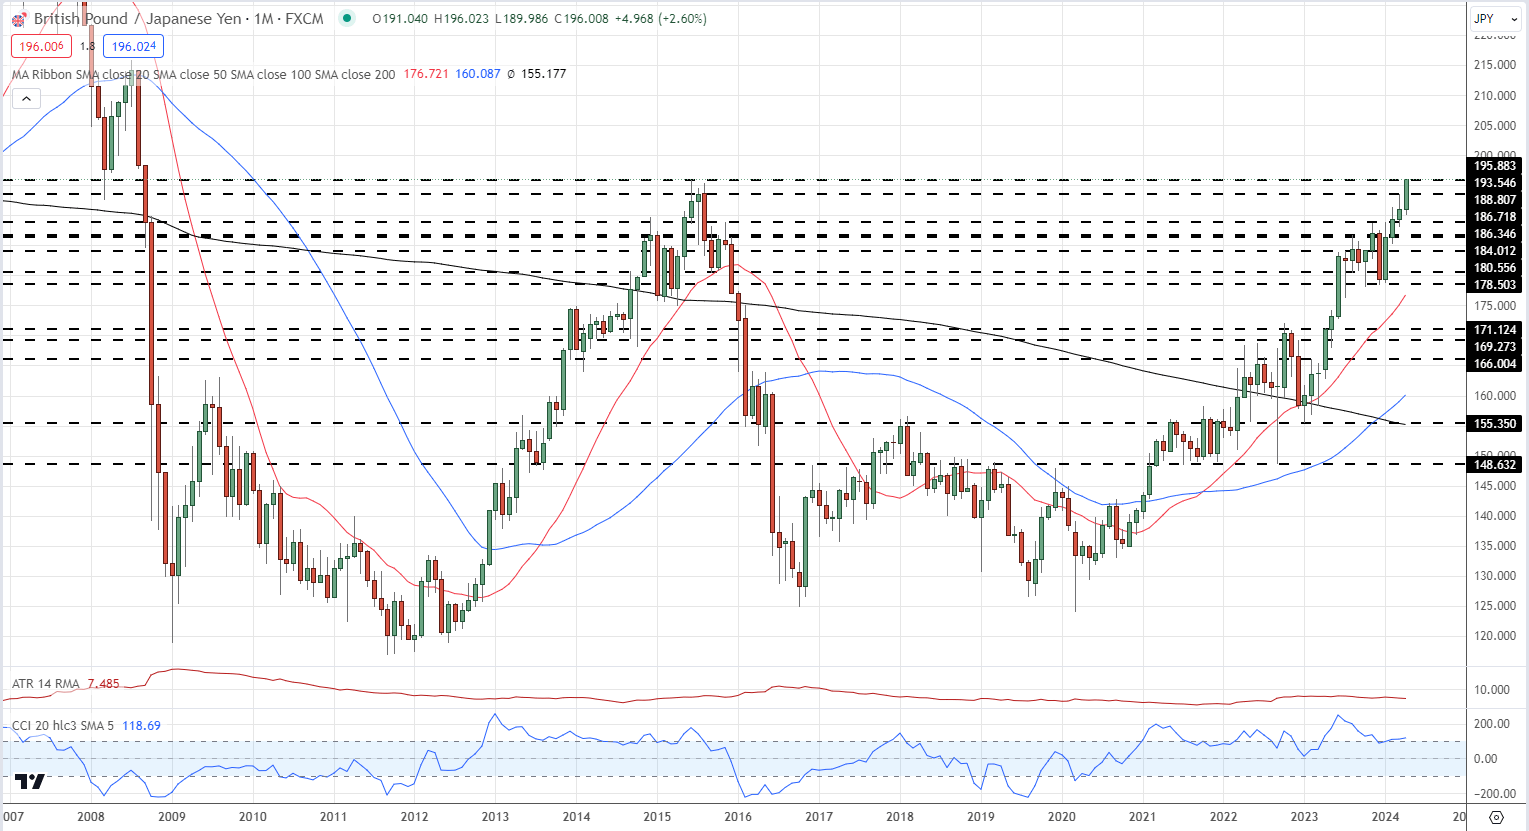
GBP/JPY is at levels last seen in September 2008 and is within touching distance of 200…

GBP/JPY Monthly Price Chart

image4.png

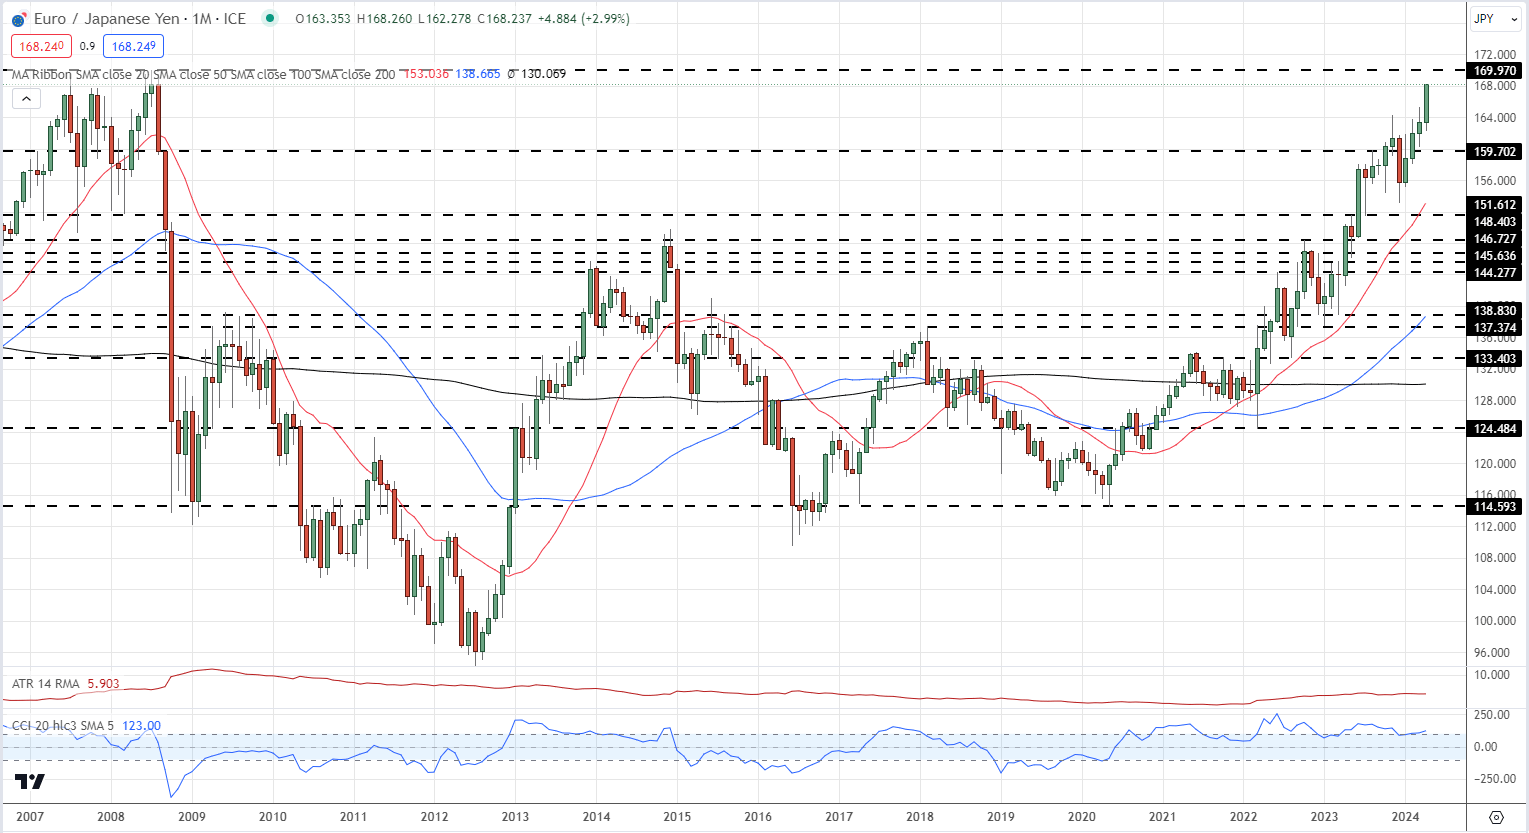
EUR/JPY is at levels last seen in August 2008.

EUR/JPY Monthly Price Chart

image5.png

What is your view on the Japanese Yen – bullish or bearish

How to Manage Fear and Greed in Trading

How to Manage Fear and Greed in Trading

Managing fear and greed while Trading: Main talking points

  • Fear and greed are two drivers that influence our everyday lives
  • These influences carry over to trading and can be detrimental
  • Traders can remove these drivers by looking at the big picture and planning ahead

Fear and greed are often identified as the main drivers of financial markets. This is clearly an oversimplification, however fear and greed do play an important role in the psychology of trading. Understanding when to embrace or tame these emotions could prove to be the difference between a successful trade and a short-lived trading career.

Keep reading to learn more about fear and greed in trading, including when these emotions are likely to surface and how best to manage them.

The truth about fear and greed while trading

‘Fear and greed’ can be commonplace among traders and can be rather damaging if not managed properly. Fear is often observed as the reluctance to enter a trade or the closing of a winning trade prematurely. Greed on the other hand manifests when traders add more capital to winning trades or over-leverage with the aim to profit from small moves in the market.

There are numerous traces of the origins of these two drivers, but when analyzed logically greed and fear both stem from the innate human instinct of survival.

What is fear?

We know that fear is somewhat related to the fight-or-flight instinct that exists in each and every one of us. It is what we feel when we recognize a threat. Traders experience fear when positions move against them as this poses a threat to the trading account.

Watching a position move against you invokes the fear of realizing that loss and so traders tend to hold on to losing positions for much longer than they should. In fact, this was discovered as the number one mistake traders make when DailyFX researched over 30 million live trades to unearth the Traits of Successful Traders.

fear in trading

A second scenario where fear tends to get the better of traders is right before entering the market. Despite the analysis pointing towards a strong entry, traders may find themselves bogged down by the fear of loss and end up walking away from a well thought out trade.

Fear is often present when markets have crashed and traders are reluctant to buy at the bottom. In this scenario traders often decide not to enter a trade out of fear that the market will drop further and miss out on the rise higher.

What is greed?

Greed is very different to fear but can easily land traders in as much hardship if not managed appropriately. It tends to arise when a trader decides to take advantage of a winning trade by devoting more money to the same trade, in the hope that the market will continue to move in the trader’s favor.

Greed can also surface when traders experience a losing trade and decide to ‘double down’, in the hope that throwing more money at the problem will help the position turn positive. From a risk management point of view this is very risky if the market continues to move against the trader and can quickly turn into a margin call.

greed in trading

Greed has appeared many times in the financial markets. one such time was during the dot-com bubble where individuals bought more and more internet stocks and inflated their value tremendously before it all came crashing down. A more recent example is bitcoin; investors piled into the cryptocurrency thinking it could only increase in value before it too came crashing down.

Learn more about major financial bubbles, crises and flash crashes.

How to manage greed and fear to be a successful trader

There are several ways to take control of your emotions and make sure fear and greed do not influence your trading decisions or overall success.

1) Have a Trading Plan

Traders should have a trading plan in place to avoid any emotional impulses that deviate from the plan. Some examples of this include: overleveraging, removing stops on losing positions, doubling down on losing positions.

Using the Rising Wedge Pattern in Forex Trading

Using the Rising Wedge Pattern in Forex Trading

What is a rising wedge pattern?

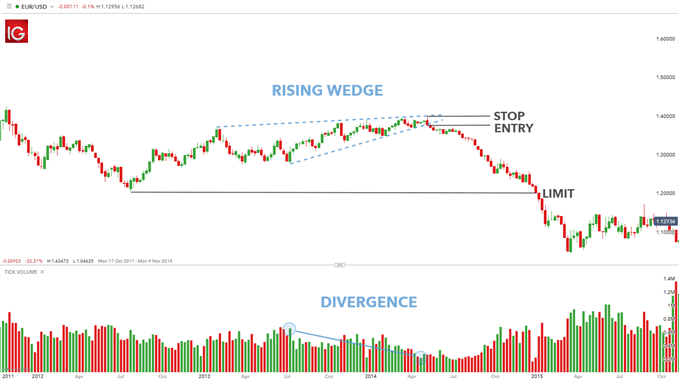
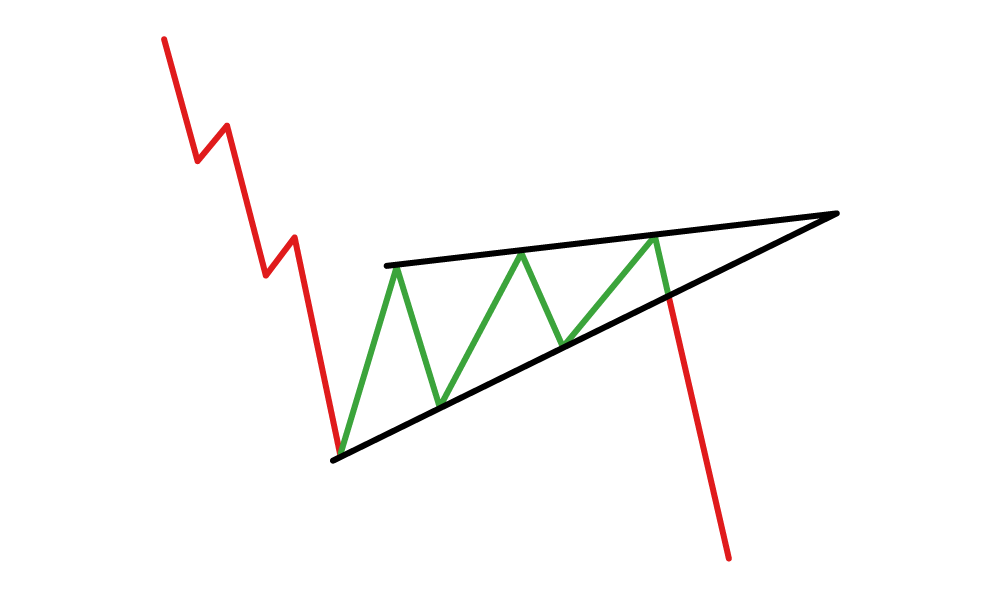
The forex rising wedge (also known as the ascending wedge) pattern is a powerful consolidation price pattern formed when price is bound between two rising trend lines. It is considered a bearish chart formation which can indicate both reversal and continuation patterns – depending on location and trend bias. Regardless of where the rising wedge appears, traders should always maintain the guideline that this pattern is inherently bearish in nature (see image below).

rising wedge chart pattern

Falling wedge pattern

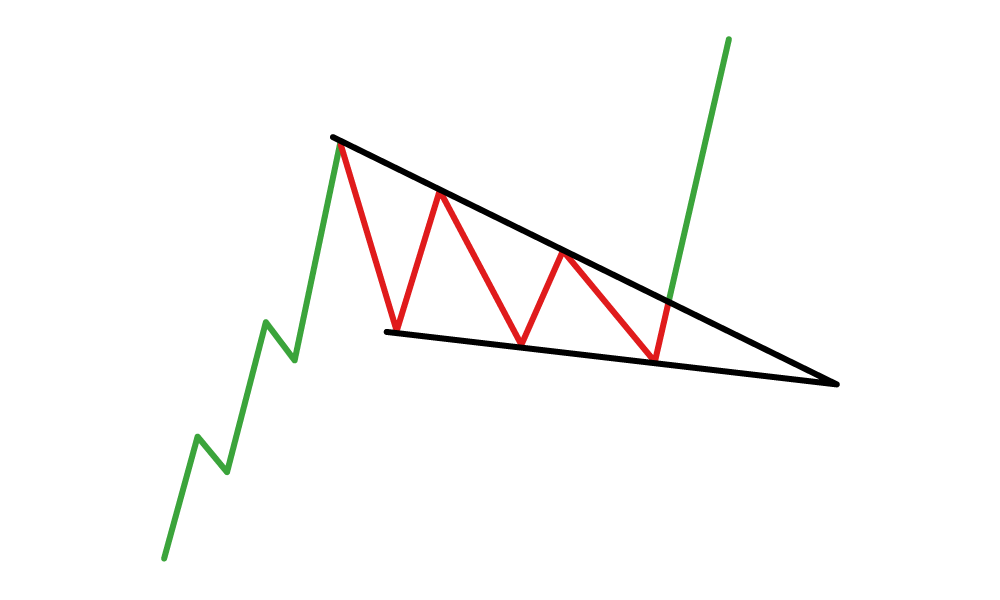
The falling (descending) wedge differentiates itself from the rising wedge by the slant of the triangle. The falling wedge declines downwards between two converging trend lines to reach an apex point which is respected as a bullish pattern (see image below).

falling wedge chart pattern

How to identify a Rising Wedge Pattern on Forex Charts

The rising wedge pattern is interpreted as both a bearish continuation and bearish reversal pattern which gives rise to some confusion in the identification of the pattern. Both scenarios contain a different set of observation dynamics which must be taken into consideration.

Continuation Pattern:

  1. Established downtrend
  2. Rising wedge consolidation formation
  3. Linking higher highs and lower lows using a trend line assembling towards a narrowing point
  4. Confirm divergence between price and volume using volume function – MACD may also be used
  5. Overbought signal can be confirmed by other technical tools like oscillators
  6. Look for break below support for short entry

Reversal Pattern:

  1. Established uptrend
  2. Rising wedge consolidation formation
  3. Linking higher highs and lower lows using a trend line assembling towards a narrowing point
  4. Confirm divergence between price and volume using volume function – MACD may also be used
  5. Overbought signal can be confirmed by other technical tools like oscillators
  6. Look for break below support for short entry

How to Trade the Rising Wedge Pattern

The rising wedge forex pattern is linked with both continuation and reversal patterns as mentioned above. The example below shows the formation of a rising wedge on a forex pair depicting a continuation.

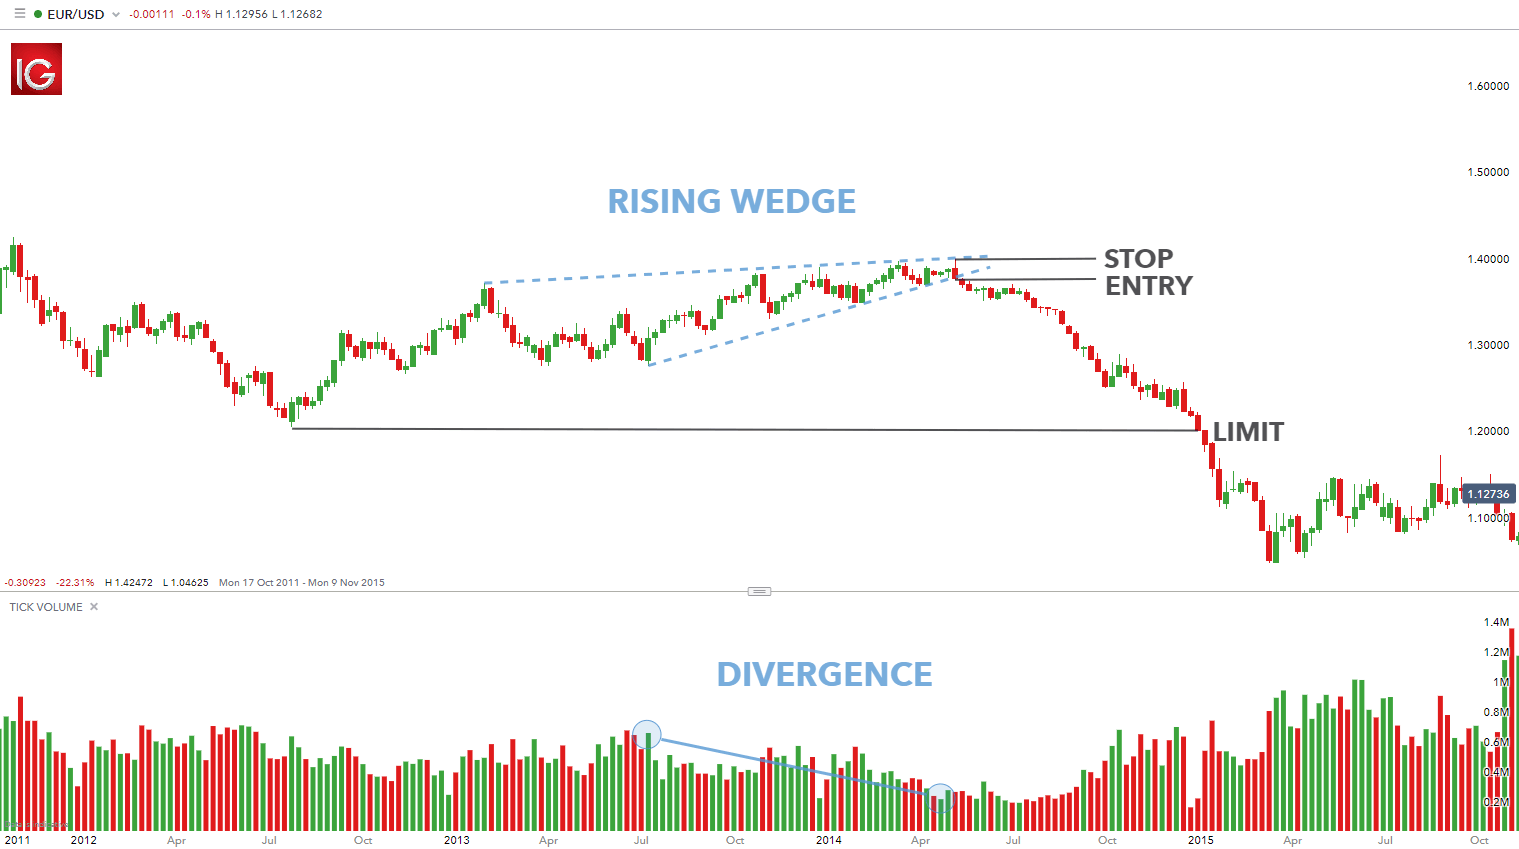
EUR/USD rising wedge forex chart pattern:

EUR/USD rising wedge chart pattern

The chart above shows a rising wedge ‘continuation’ pattern after a determined downtrend. The rising wedge is outlined by the blue dashed lines showing diminishing bull strength in the uptrend. Confirmation of the uptrend waning in strength can be seen using the volume tool on the chart which depicts fading volume in concurrence with the ascending price in the market. This is known as divergence, showing that the upward movement is coming to an end.

The entry point (labelled) occurs once the trend support line of the rising wedge has been breached. There are two common methods of entry:


  1. Wait for a candle close below the support trend line before entry
  2. Enter into the short position as soon as the price breaks the support line, regardless of the candle close

The stop level as highlighted on the chart is elected from the high point of the rising wedge located on the resistance trend line. This identification point makes it relatively simple to locate the stop level for novice traders. The limit in this example was taken from the previous swing low giving this trade an extremely positive risk-reward ratio.

Top 5 Types of Doji Candlesticks

Top 5 Types of Doji Candlesticks

Types of Doji: The Patterns All Traders Should Know

A Doji candlestick signals market indecision and the potential for a change in direction. Doji candlesticks are popular and widely used in trading as they are one of the easier candles to identify and their wicks provide excellent guidelines regarding where a trader can place their stop.

In this article we explain how Doji patterns are formed and how to identify five of the most powerful and commonly traded types of Doji:

  1. Standard Doji
  2. Long legged Doji
  3. Dragonfly Doji
  4. Gravestone Doji
  5. 4-Price Doji

types of doji candlesticks

How are Doji candlestick patterns formed?

Dojis are formed when the price of a currency pair opens and closes at virtually the same level within the timeframe of the chart on which the Doji occurs. Even though prices may have moved between the open and the close of the candle; the fact that the open and the close takes place at almost the same price is what indicates that the market has not been able to decide which way to take the pair (to the upside or the downside).

Keep in mind that the higher probability trades will be those that are taken in the direction of the longer-term trends. When a Doji occurs at the bottom of a retracement in an uptrend, or the top of a retracement in a downtrend, the higher probability way to trade the Doji is in the direction of the trend. In case of an uptrend, the stop would go below the lower wick of the Doji and in a downtrend the stop would go above the upper wick.

doji formation

Top 5 Types of Doji Candlestick Patterns

1. Standard Doji pattern

A Standard Doji is a single candlestick that does not signify much on its own. To understand what this candlestick means, traders observe the prior price action building up to the Doji.

standard doji

Trades based on Doji candlestick patterns need to be taken into context. For example, a Standard Doji within an uptrend may prove to form part of a continuation of the existing uptrend. However, the chart below depicts a reversal of an uptrend which shows the importance of confirmation post the occurrence of the Doji.

standard doji

2. Long-legged Doji

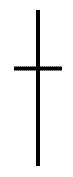
The Long-Legged Doji simply has a greater extension of the vertical lines above and below the horizontal line. This indicates that, during the timeframe of the candle price action dramatically moved up and down but closed at virtually the same level that it opened. This shows the indecision between the buyers and the sellers.

long-legged doji

At the point where the Long-Legged Doji occurs (see chart below), it is evident that the price has retraced a bit after a fairly strong move to the downside. If the Doji represents the top of the retracement (which we do not know at the time of its forming) a trader could then interpret the indecision and potential change of direction. Subsequently looking to short the pair at the open of the next candle after the Doji. The stop loss would be placed at the top of the upper wick on the Long-Legged Doji.

long legged doji

3. Dragonfly Doji

The Dragonfly Doji can appear at either the top of an uptrend or the bottom of a downtrend and signals the potential for a change in direction. There is no line above the horizontal bar which creates a ‘T’ shape and signifies that prices did not move above the opening price. A very extended lower wick on this Doji at the bottom of a bearish move is a very bullish signal.

dragonfly dojidragonfly doji

4. Gravestone Doji

The Gravestone Doji is the opposite of the Dragonfly Doji. It appears when price action opens and closes at the lower end of the trading range. After the candle open, buyers were able to push the price up but by the close they were not able to sustain the bullish momentum. At the top of a move to the upside, this is a bearish signal.

gravestone dojigravestone doji

5. 4 Price Doji:

The 4 Price Doji is simply a horizontal line with no vertical line above or below the horizontal. This Doji pattern signifies the ultimate in indecision since the high, low, open and close (all four prices represented) by the candle are the same. The 4 Price Doji is a unique pattern signifying once again indecision or an extremely quiet market.

4 price dojiprice doji

Learn more about trading with candlesticks

  • Reading a candlestick chart is an important foundation to have before analyzing more complex techniques such as Doji candlesticks.
  • When reading candlestick charts, be mindful of:

1. The time frames of trading

2. Classic price patterns

3. Price action

German GfK Consumer Climate Indicator Climbs to -24.2 for May

German GfK Consumer Climate Indicator Climbs to -24.2 for May

German GfK Consumer Climate Indicator Advances to -24.2

The German GfK Consumer Climate Indicator advanced from -27.3 to -24.2 for May. Economists predicted an increase to -25.9.

Experts Trade EUR/USD with IC Markets

Trading Derivatives carries a high level of risk to your capital and you should only trade with money you can afford to lose. Trading Derivatives may not be suitable for all investors, so please ensure that you fully understand the risks involved, and seek independent advice if necessary. A Product Disclosure Statement (PDS) can be obtained either from this website or on request from our offices and should be considered before entering into a transaction with us. Raw Spread accounts offer spread

According to the April survey,

  • The willingness to save limited the upside in the headline indicator, rising by 2.5 points to 14.9 points. In April 2023, the willingness to save stood at 1.8 points.
  • Income expectations advanced by 12.2 points to 10.7 points, the highest level since January 2022 (16.9 points).
  • The willingness to buy increased by 2.7 points to -12.6. Nevertheless, the willingness to buy remained low, highlighting ongoing uncertainty about the labor market and the economy.
  • Economic expectations rose by 3.8 points to 0.7 points. Year-on-year, economic expectations were down 13.6 points.

Consumer Confidence and June ECB Rate Cut Puts

The sub-components of the survey supported investor expectations of a June ECB rate cut. Despite the jump in income expectations, consumer plans to save signaled a lackluster demand environment. Downward trends in consumer spending could dampen demand-driven inflation and support multiple ECB rate cuts.

EUR/USD Reaction to German GfK Consumer Climate Survey

Before the release of the German GfK Consumer Climate survey, the EUR/USD fell to a low of $1.06916 before rising to a high of $1.07130.

In response to the GfK Consumer Confidence numbers, the EUR/USD fell to a low of $1.07114 before rising to a high of $1.07131.

On Thursday, April 25, the EUR/USD was up 0.13% to $1.07122.

EUR/USD reacts to the GfK Consumer Climate Indicator for May 2024.
250424 EURUSD 3 Minute Chart

Up Next

ECB Executive Board member Isabel Schnabel is on the calendar to speak. Views on inflation and post-June interest rate plans need consideration.

Investors should also consider the US economic calendar. Q1 2024 GDP and weekly jobless claims figures warrant investor attention. Barring an unexpected spike in US jobless claims, the GDP numbers will likely impact Fed interest rate cut bets more.

Economists forecast the US economy to grow by 2.5% in Q1 2024 after expanding by 3.4% in Q4 2023.