How to Set Up Effective Trading Goals

How to Set Up Effective Trading Goals

Trading Goals – Main Talking Points:

  • Why set trading goals?
  • What your trading goals shouldn’t be
  • The effectiveness of process-oriented goals
  • Goal tracking and measuring your progress
  • Trading goals: A summary

Setting trading goals can be a useful endeavor to help you navigate the markets, but some goals are more useful to set than others. In this piece, we’ll look at the right and wrong type of forex trading goals to aim for, why the right goals make sense in context with your trading plan, and how to track the progress of your goals.

Watch the video above for our analyst Paul Robinson’s account on best practice for goal setting. He discusses why making money may not be the be all-end all, the danger of meaningless goals in a cyclical market, and how to use goals to refine discipline and consistency.

Why Set Trading Goals?

It is important to set trading goals for two main reasons – to help you stick to your trading plan and to allow you to trade more consistently. For those new to trading, this will mean setting a process-orientated goal rather than one focused on outcomes. For example, goals based on following strict risk management and sound technical analysis, and even a daily routine involving exercise and a balanced diet, will encourage more consistent trading.

What Your Trading Goals Shouldn’t Be

By contrast, setting a monetary goal is not a useful trading goal. This is because markets are dynamic and don’t provide opportunities in linear fashion; some periods of trading are good and will suit your trading style while other periods won’t. Protecting the trading capital you have is more valuable than setting arbitrary financial targets, since traders have no control over the timing of favorable market conditions.

Other common goals which are hollow are those that are not specific enough or cannot be easily measured. Examples include ‘be more disciplined’, ‘be more consistent’, ‘trade this or that strategy better’, and so on. How exactly do you achieve or measure those? Overarching goals such as these are better broken down into smaller, more process oriented goals that are more achievable.

The Effectiveness of Process-Oriented Goals

As opposed to outcome-oriented goals, process-oriented goals can be useful to help you follow your trading plan. Creating goals that support your plan can help keep you focus on the details that lead to good trades.

One way to do this is to think of following the process as ‘If, then…’ statements – ‘If this [event] happens, then I will do this.’ For example – ‘If EUR/USD pulls back to a certain price level and posts a key-reversal bar, then I will enter long’. It could be any number of criteria depending on your trading style, but the point is to bring attention to doing the right thing according to your plan.

If you follow your rules, then regardless of the outcome – win or lose – it was a successful trade. If you have an edge with proper risk management rules (another set of rules/goals), then you give yourself a chance at profitability over time.

One shouldn’t think about profitable trade as ‘good’ trades, and unprofitable as ‘bad’ trades. You can take a ‘good’ trade and it still be a loser (as many will be), and a ‘bad’ trade and make money. Keep in mind, poor behavior which leads to a profitable outcome is negative reinforcement, and conversely the same can be said about good behavior being positive reinforcement. You want to make sure you are focused on the latter.

Goal Tracking and Measuring Your Progress

Goal tracking and measuring your progress are key to ensure your strategy is working and to keep you accountable. One powerful way to make sure you are trading in accordance with your plan, is to use a trading checklist and a trading journal. This not only keeps you focused on making proper trades, but also highlights your weakness, areas you need to work on. Those areas you need to be worked on can become new goals on which to focus.

For example, maybe you are having difficulty with sticking to your stop-loss or target objectives. This often stems from too aggressive of a position size. The simple fix here is to reduce the risk-per-trade so that you aren’t making emotional decisions because your P&L swings are too big.

One idea is to create a scorecard for each trade, where you allot a certain number of points per facet of the trade and run a tally to see how effectively you are sticking to the plan. This will highlight areas of weakness and provide clarity on what you need to work on.

All-in-all, by emphasizing goals geared towards ‘doing the right thing’ you will best set yourself up towards achieving long-term profitability. There are certainly no guarantees, but if you are just ‘slinging it around’ without structure and proper goals, any short-term success achieved isn’t going to be sustainable.

Trading Goals: A Summary

In summary, process-oriented goals will be more effective than outcome-oriented goals. Setting such goals can help put you in the right mindset to trade to the best of your ability, rather than setting a monetary goal for example, which would only serve to pressure you into trading too often, or trading recklessly. Highlighting process over outcome gives you the best chance for financial success in the long-term.

You should always have a trading plan that covers how you will enter and exit trades, how your money will be managed, the markets traded, and your risk parameters.

And keep it simple. For example, selecting a few effective trading indicators rather than trying to apply all of them will result in better focus. Simplifying your technical analysis approach can cut out a lot of noise and contribute to becoming a better trader.

Having trading goals that compliment a solid strategy will help you build confidence in your trading. Download our free guide for more information about how to build confidence in your trading, and be sure to check out our range of additional guides to help you in your trading journey, whatever your skill level.

Currency Carry Trade: What is it and How Does It Work?

Currency Carry Trade: What is it and How Does It Work?

What is a currency carry trade and how does it work?

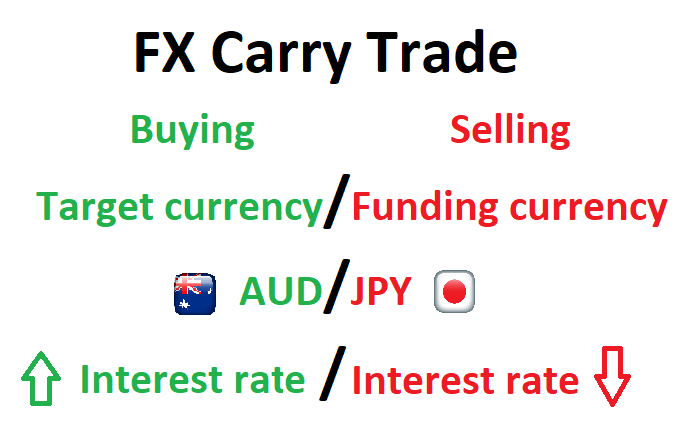
An FX carry trade involves borrowing a currency in a country that has a low interest rate (low yield) to fund the purchase of a currency in a country that has a high interest rate (high yield). Holding this position overnight will result in an interest payment being made to the trader based on the “positive carry” of the trade.

The lower yielding currency is referred to as the “funding currency” while the currency with the higher yield is referred to as the “target currency”.

Currency carry trade infographic

Rollover

“Rollover” is the process whereby brokers extend the settlement date of open forex positions held past the daily cut-off time. The broker either debits or credits the account, based on the direction of the trade (long or short) and whether the interest rate differential is positive or negative. Since interest is quoted as an annual figure, these adjustments will be the daily adjusted rate.

Interest rates

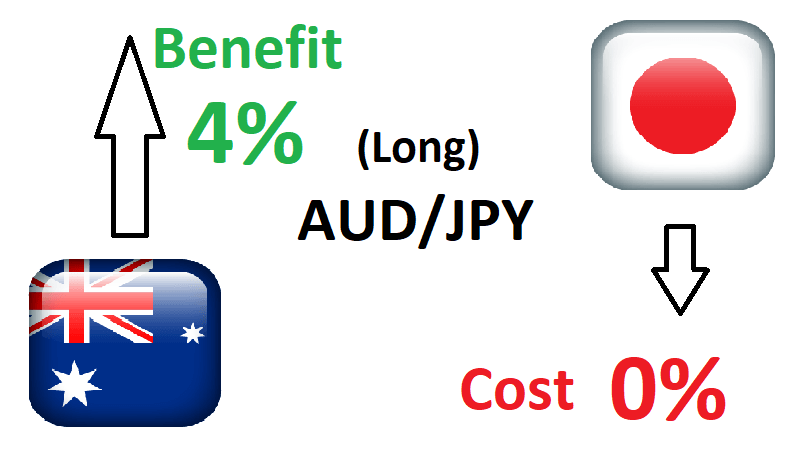
Interest rates are set by a country’s central bank in accordance with the mandate of that country’s monetary policy – this will differ from country to country. A trader then earns interest on a position when they are long the currency in the pair with the higher interest rate. For example, if the Australian dollar offers 4% and the Japanese Yen has interest rates set at 0%, traders could look to buy (long) AUD/JPY to take advantage of the 4% net interest rate differential.

There are two main components to the FX carry trade:

1) Changes in interest rates

The main component of the carry trade is centered around the interest rate differential between the two traded currencies. Even if the exchange rate between the two currencies remains unchanged, the trader will profit from the overnight interest payment. However, over time, central banks deem it necessary to alter interest rates and this poses a potential risk to the carry trade strategy.

2) Exchange rate appreciation/depreciation

The other component of the carry trade strategy focuses on the exchange rate of the two currencies. A trader looks for the target currency to appreciate (increase in value) when long. When this happens the payoff to the trader includes the daily interest payment and any unrealised profit from the currency. However, the profit the trader sees, as a result of the target currency appreciating, will only be realised when the trader closes the trade.

It is possible for a trader to lose money when the target currency depreciates against the funding currency so that the capital depreciation wipes out the positive interest payments.

Currency carry trade example

Continuing with the example used above, if the Australian Official Cash Rate is currently at 4% and the Japanese Yen yields 0%, a trader may decide to take a long trade on AUD/JPY if the pair is likely to rise.

FX carry trade example using AUD/JPY

Traders looking to capitalise on the interest rate differential will essentially be borrowing Yen at the much lower rate and receiving the higher interest rate associated with the Australian dollar. In reality, retail traders will receive less than 4% as forex brokers usually apply a spread.

For a detailed example of how to calculate the approximate overnight interest charge/gain, read our article on understanding foreign exchange rollover.

The risks involved with carry trades

A currency carry trade, like most trading strategies, carries a degree of risk and therefore, requires the adoption of sound risk management. Risk management has become even more important since the 2008/09 global financial crisis which resulted in lower interest rates for developed nations, forcing carry traders to look to riskier, high yielding emerging markets currencies until interest rates normalize.

  • Exchange rate risk: Should the target currency weaken against the funding currency, traders that are long the pair will see the trade move against them but will still receive the daily interest.
  • Interest rate risk: If the country of the target currency reduces interest rates and the country behind the funding currency increases interest rates, this will reduce the positive net interest rate and is likely to reduce the profitability of the FX carry trade.

FX Carry trade strategy

Filtering FX carry trades in the direction of the trend is one such strategy employed by top traders. This is because the carry trade is a long term trade, and therefore, it’s useful to analyse markets that exhibit strong trends.

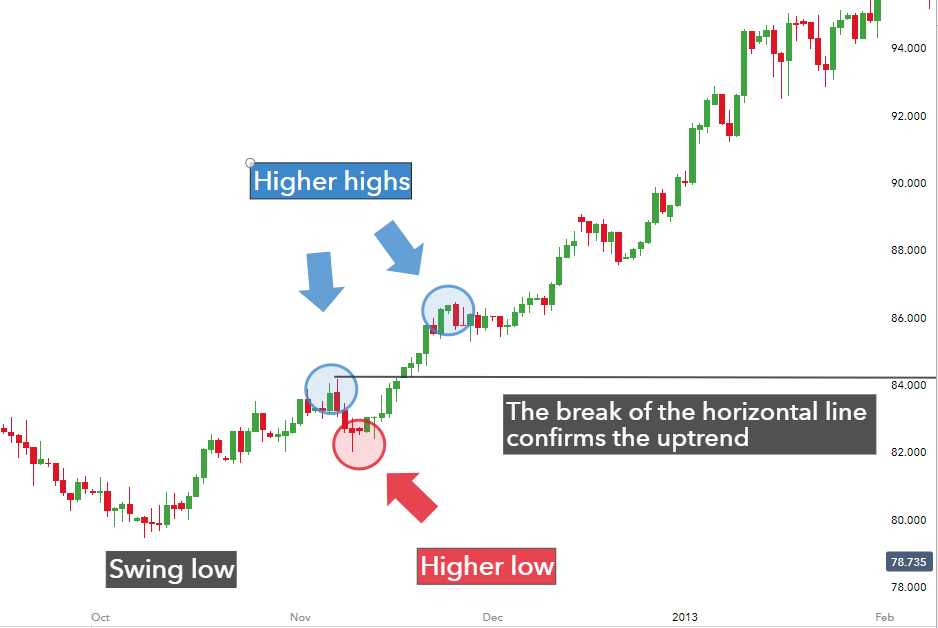
In an attempt to get into higher probability trades, traders should first look to confirm the uptrend which, in the below chart, is confirmed after the higher high and higher low.

Trend bias in positive carry trade strategy

The figure depicts higher highs and higher lows whereby a break of the horizontal line (drawn at the first higher high) confirms the uptrend. Thereafter, traders can make use of multiple time frame analysis and indicators to spot ideal entry points to enter a long trade.

Conclusion

Currency carry trades present traders with two avenues to profit (exchange rate and interest rate differential) but it is essential to manage risk as losses are can arise when the pair moves against traders or the interest rate differential narrows.

For higher probability trades, traders should look for entry points in the direction of an uptrend and should protect downside risk by utilizing prudent risk management techniques.

How to Research Stocks: A Step by Step Guide

How to Research Stocks: A Step by Step Guide

How to get started with your stock research

Prudent investors do not often make investments without prior research or substantiation as to why the stock is attractive for purchase. Stock research in a general sense begins with an understanding of three key details about a company:

  1. Present financial health
  2. Current management
  3. Future vision and roadmap

Crucially, one thing many investors fail to do is align a company’s values with their own, which is important for finding the best investment that meets their specific goals. Therefore, being mindful of your investment strategy, and why you are looking to invest in stocks can help to guide your decision-making processes.

A Step by Step Guide to Researching Stocks

As well as understanding the current and future position of a company, effective stock research needs to consider the following factors to help investors reach a decision in the effort of meeting their goals and desired strategy:

  1. Time horizon for investment
  2. Risk levels
  3. Type of stock industry/sector
  4. Understanding the company product/service
  5. Financial reporting
  6. Competitor and industry analysis
  7. Following industry experts
  8. Using research platforms and terminals
  9. Stock order types
  10. Broker fees

1. Investment time horizon

Time horizon is important as it allows investors to identify which types of stocks may align with their goals. For example, many young investors with long time horizons are willing to take on more risk when it comes to an investment portfolio. These types of individuals will often prefer more aggressive portfolios which may include growth stocks that carry more expensive valuations.

Because of the longer time horizon, these investors can usually tolerate larger swings in the market. The opposite would be true for shorter time horizons (under five years) as these investors have less tolerance for large drawdowns in the portfolio, as larger adverse market movements can create a long-lasting effect for someone nearing retirement that may need to soon begin drawing income from the portfolio.

2. Risk levels

Risk ties in with time horizon as investors use these two components together to help identify which types of stocks to invest in. Higher risk-seeking individuals will often prefer growth stocks such an Amazon or Tesla; whilst risk-averse investors usually head towards value stocks which often carry lower P/E ratios. These value stocks might be considered as undervalued and potentially attractive for long-term investing.

Regardless of investment style, it’s important to practice good risk management so that the investor can aim to benefit from upside movement while attempting to minimize downside risk.

3. Type of stock industry/sector

Many investors are familiar with a certain stock sector which can potentially make researching stocks in that sector easier. Understanding an industry allows for more in-depth research in terms of variable inputs and nuances that cannot often be retrieved from financial statements.

The stock market is often divided into eleven sectors, uncover stock sectors for a more structured method to stock research

4. Understand the company product/service

Familiarising oneself with the company’s product/service will assist in the later step of competitor analysis. Knowing what makes the company’s product/service unique, which includes the cost factor, is crucial for future forecasts.

Many companies have a diverse product/service offering which then makes this step more central to stock research. For example, with multiple products/services, investors need to understand how each offering affects the company with regards to cost, revenue and the future potential of each.

5. Financial reporting

Publicly traded companies publish financial reports which give a quantitative overview of the company. These include Earnings Announcements, which provide vast amounts of information about a company’s financial health and performance. From the company’s publicly filed reports, investors can identify potential red flags/risks within the company, management capability, debt management and income sources.

Explore the foundations of earnings season and how it fits into stock research

Current financials are not the only important documents to review. Past data can offer investors deeper knowledge and appreciation of where a company comes from as well as how it reacted under previous market conditions. This being said, fundamental analysis involves complex techniques and a thorough understanding of financial statements, mathematical formulas and a solid overall grasp of financial markets.

Uncover some basic tools to help you value a stock !

6. Competitor and industry analysis

There are regular instances whereby companies have direct competitors with the same/similar business models. Therefore, it is a good idea for investors to compare and analyse stocks between these competitors to find discrepancies which could further uncover potential investment opportunities.

The same applies to the industry as a whole. Often there are times where a company within an industry outperforms the industry and its competitors, or vice versa. Delving into why these seemingly perplexing patterns may occur can broaden understanding of how a stock or industry behaves under certain conditions.

Competitor and industry analysis are seen as obvious comparisons to make when researching stocks but, it may be prudent to analyse other markets as well. For example, Royal Dutch Shell Plc may do direct competitor analysis against a company such as BP Plc, but another comparison may be to overlay these companies with that of the underlying oil price. This major commodity (oil) is heavily correlated to the business model, therefore looking outside the scope of the equity markets may uncover some valuable insight.

7. Follow industry experts

A great way to further stock research is by following industry experts, such as highly regarded equity analysts. These experts often publish in-depth stock research which can be a good way to draw comparisons between individual and expert analysis. This is also a good way for investors to broaden equity analysis techniques by studying the analyst’s approach and what they look for in making investment decisions.

8. Research platforms and terminals

The use of research platforms and terminals such as Bloomberg can give investors/analysts a plethora of additional analytical tools and techniques. These can help investors with efficiency and access to many other financial markets and stocks for comparative purposes.

Quantitative tools are also available on such platforms for more complex types of analysis. These platforms can be costly, so before investing in one, the investor should make sure to consider the expense factor relative to their expected benefit.

9. Stock order types

After the research has been completed, investors will need to place the order to buy the stock. Knowing how order types work in the stock market can help investors to better focus the execution of their strategies.

Liquidity is another concept that can result in varying spreads and pricing. Stock market liquidity refers to the ease at which the company shares can be bought and solid without experiencing large price fluctuations. Large companies with high liquidity such as Apple Inc will often have tighter spreads with a larger volume of shares available to buy/sell at a given price.

10. Broker fees

An important but often overlooked portion of the stock investment process is that of broker fees or commissions. Brokers have differing fees so investors should become familiar with fees in order to avoid any unwanted surprises. These should be available on the broker website and should be transparent.

How to do research on stocks: Key Takeaways

Investors can purchase stocks after doing thorough research; and taking into account as many variables as possible can help the investor to arrive at a more adequate investment decision. This can take many hours of work but sacrificing the time will enable investors to make more informed decisions. Keep in mind the steps outlined above to help streamline the stock research process and employ suitable portfolio management practices.


Economic Growth: What is GDP Growth?

Economic Growth: What is GDP Growth?

What is Economic Growth and Why is it So Important?

Top news headlines are often dominated by the release of gross domestic product (GDP) figures and for good reason. The GDP release attracts a lot of attention from traders and market participants because of its signaling effect and ability to move financial markets.

This article explores the concept of ‘growth’ from an economic perspective and why it is beneficial for traders to have a solid understanding of the subject.

What is GDP Growth and How is it Reported?

When news outlets or financial publications refer to ‘growth’ they generally mean gross domestic product or GDP.

GDP measures the value of goods and services produced by a country in a given year and serves as an indication of economic health of that country. Essentially, it’s an objective measure of improving or worsening economic conditions in a particular country over time.

How is GDP Reported?

GDP has four main readings, one per quarter, often denoted as Q1, Q2, Q3 and Q4; but you may notice that GDP figures are reported every month. This is because GDP is a lagging economic indicator, meaning that there is a lag period before the data is collected, analyzed and adjusted to account for seasonal influences. Lagging economic indicators are not to be confused with lagging technical indicators.

GDP figures are mainly reported as a quarter on quarter figure (QoQ) or year on year (YoY). The below image shows the percentage change in real GDP* (QoQ):

Real GDP: Percent Change from Preceding Quarter

*Real GDP provides a more accurate indication of production/output as it removes the influence of higher prices on the value of aggregated goods and services in the economy

There are three reported figures for each quarter:

  1. The preliminary/advance figure
  2. The second estimate and
  3. The final GDP figure.

The preliminary/advance figure tends to have the biggest impact from a trading point of view as the other two figures generally involve small refinements to the initial figure. The component factors that make up GDP can often be observed and aggregated ahead of the released figure, meaning GDP is less likely to provide a shock to the market than other data releases such as Non-farm Payrolls (NFP).

However, do keep in mind that for major economies an estimated GDP growth figure that differs from the actual by 0.3 or 0.2 percentage points can translate into billions of dollars -which may attract varying opinions of the state of the economy and result in elevated volatility after the release.

For more information on these releases, click the drop down arrow next to the event on the DailyFX economic calendar

DailyFX Economic Calendar

GDP Growth and the Signaling Effect

The state of the economy is watched very closely by governments and central banks. When the economic growth (GDP) is stagnant or the economy is technically in a recession, central bank policy shifts and becomes more ‘accommodative,’ providing liquidity and lowering interest rates; while increased government spending often follows suit. In economic booms central bankers look to reign in overheating economies and monetary policy becomes more ‘contractionary’ in nature – raising interest rates, while governments often reduce spending.

Longer-term macro traders are able to analyze whether an economy is in a boom, recession or transitionary phase when planning trade set ups. Currencies linked to central banks that are ‘hawkish’ tend to appreciate at the start of an interest rate hiking cycle; while currencies linked to central banks that are ‘dovish’ tend to depreciate at the start of an interest rate cutting cycle.

For equities, lower future interest rates will make it easier for individuals and institutions to access credit at low rates which can be used to invest in the stock market. Additionally, lower interest rates translate into lower discount rates applied to future company cash flows to arrive at a higher valuation for shares in general.

For an in-depth understanding of the stock market, read through our comprehensive Understanding the Stock Market education section

 Furthermore, traders are often able to pick up on clues on the direction of future monetary policy from the tone and language used by the heads of various central banks in their press conferences. Press conferences follow after an interest rate decision has been released.

Follow important dates for major central banks via our central bank calendar

GDP: Components of Growth

From an economic point of view, the main components of growth can be listed under the following broad categories:

  • Consumption
  • Investment
  • Government spending
  • Net exports

Output (GDP) = Consumption + Investment + Government spending + Net Exports

Consumption is the everyday exchange of money for goods and services such as buying groceries or paying your internet service provider. Investment refers to private local investment or capital expenditure, for example businesses will reinvest in the business to increase productivity and boost employment levels.

Governments spend money on infrastructure, equipment and salaries of government employees and this expenditure can look significant in times when general spending and business investment decline. Net exports is the result of taking total value of exports and subtracting the total value of imports and is the result of international trade.

Leading Economic Indicators of Growth

GDP growth is not the only indication of the state of an economy. While GDP is inherently lagging in nature traders can consider a whole host of leading economic indicators that can provide insight into the condition of different sectors of the economy before the GDP data is even released.

The data releases provided below also shed some light on underlying economic environment before GDP data is released:

  • New building permits – This measures the change in the number of new building permits issued by the government. Building permits are a key indicator of demand in the housing market and the housing market/construction tend to move closely with the underlying state of the economy.
  • Consumer credit – This figure has strong ties to consumer spending and confidence. Rising debt levels are usually indicative of economic strength as banks feel comfortable issuing approving lines of credit. On the other hand consumers feel financially stable enough to make the monthly repayments.
  • Retail sales – Considered a primary gauge of consumer spending, which accounts for a sizeable portion of overall economic activity
  • Consumer confidence – This measures the level of consumer confidence with respect to economic activity. It is a leading indicator as it can predict consumer spending, which plays a major role in overall economic activity. Higher readings point to higher consumer optimism.
  • ISM Manufacturing/services PMI – Purchasing managers in any company hold the most current and relevant insight into their company’s view of the economy and therefore their sentiment of current economic conditions are of great value. A value above 50 indicates optimism while values below 50 are viewed as pessimistic
Bitcoin (BTC) News Today: Robust Demand After Halving Spurs BTC Price Outlook

Bitcoin (BTC) News Today: Robust Demand After Halving Spurs BTC Price Outlook

Post-Halving BTC-Spot ETF Market Flow Data Signaled Robust Demand

Bitcoin (BTC) advanced by 2.78% on Monday (April 22). Reversing a 0.15% loss from Sunday (April 21), BTC ended the session at $66,876.

Investors returned from the sidelines after hitting the pause button on Sunday (April 21). BTC-spot ETF market flow data for Monday, April 22, signaled robust buyer demand after the Bitcoin Halving event.

Experts Trade Ethereum with IC Markets

Trading Derivatives carries a high level of risk to your capital and you should only trade with money you can afford to lose. Trading Derivatives may not be suitable for all investors, so please ensure that you fully understand the risks involved, and seek independent advice if necessary. A Product Disclosure Statement (PDS) can be obtained either from this website or on request from our offices and should be considered before entering into a transaction with us. Raw Spread accounts offer spread

According to Farside Investors, the BTC-spot ETF market saw net inflows of $42.5 million, excluding flow data for iShares Bitcoin Trust (IBIT). Highlights of the Monday (April 22) session included:

  • Grayscale Bitcoin Trust (GBTC) saw net outflows of $35.0 million, down from $45.8 million on April 19.
  • Fidelity Wise Origin Bitcoin Fund (FBTC) saw net inflows of $34.8 million, down from $54.8 million on April 19.
  • ARK 21Shares Bitcoin ETF (ARKB) recorded net inflows of $22.6 million, up from $12.5 million on April 19.
  • If IBIT registers net inflows for Monday, April 22, seven of the ten newly launched ETFs would report net inflows, the most since the January 11 launch.

There were several takeaways for investors to consider.

  • GBTC outflows trended lower.
  • The BTC-spot ETF market reflected uptrend demand after the Bitcoin Halving event.
  • Robust demand amidst a lower supply environment is a bullish price signal.
  • If IBIT extends its streak of net inflows to 70 days, it would move into the top ten for the longest daily inflows streaks.

ETH Inflow Streaks – The Leaders

Bloomberg Intelligence Senior ETF Analyst Eric Balchunas shared a chart with the longest daily inflow streak, saying,

“IBIT inflow streak currently at 69 DAYS. one more day and it moves into Top 10 and ties JETS (a streak I was equally as fascinated by) altho streak ending today would be pretty hilarious, show financial gods have sense of humor via thetrinianalyst (Sebastien Cabral).”

IBIT eyes 70 day inflow streak.

The BTC gains came despite further chatter regarding elevated Bitcoin fees.Responding to a post on X (formerly Twitter), BitMEX Research had this to say about the high Bitcoin fee,

“The high $128 cost to send Bitcoin is an indicator of success, not failure. On the other hand, this high fee is a negative as it deters usage and future adoption. In the same way, a restaurant that is too crowded is both an indication of success AND contributes to a negative customer experience.”

The US Economic Calendar

As investors consider the demand side of the supply-demand equation, US economic indicators could impact buyer appetite for BTC.

On Tuesday (April 23), the US Services PMI will draw investor interest. Economists expect the S&P Global Services PMI to increase from 51.7 to 52.0 in April. Better-than-expected numbers could further reduce investor bets on a September Fed rate cut. A more hawkish Fed rate path may pressure buyer appetite for riskier assets.

Technical Analysis

Bitcoin Analysis

BTC remained comfortably above the 50-day and 200-day EMAs, confirming the bullish price trends.

A BTC break above the $69,000 resistance level would support a move toward the March 14 all-time high of $73,808.

On Tuesday, investors should consider US economic indicators, the Fed rate path, and BTC-spot ETF market flow data.

Conversely, a BTC drop below the 50-day EMA and the $64,000 support level could give the bears a run at the $60,365 support level.

With a 14-Daily RSI reading of 52.12, BTC may return to $70,000 before entering overbought territory.


A graph of stock market Description automatically generated

Ethereum Analysis

ETH sat below the 50-day EMA while remaining above the 200-day EMA. The EMAs confirmed the bearish near-term but bullish longer-term price trends.

An ETH breakout from the $3,244 resistance level and the 50-day EMA would support a move to the $3,480 resistance level.

Conversely, an ETH drop below the $3,100 handle would bring the $3,033 support level into play.

The 14-period Daily RSI reading of 47.44 suggests an ETH fall through the $3,033 support level before entering oversold territory.

ETH Daily Chart sends bearish near-term price signals.
German Services PMI Rises to a 10-Month High 53.3 in April

German Services PMI Rises to a 10-Month High 53.3 in April

On Tuesday, April 23, the German economy was in the spotlight. Preliminary private sector PMIs for April drew investor interest amidst rising bets on a June ECB rate cut.

German Private Sector PMIs and the ECB

In April, the German HCOB Services PMI increased from 50.1 to a 10-month high of 53.3. Moreover, the German HCOB Manufacturing PMI rose from 41.9 to 42.2. Economists forecast PMIs of 50.6 and 42.8, respectively.

Experts Trade EUR/USD with IC Markets

Trading Derivatives carries a high level of risk to your capital and you should only trade with money you can afford to lose. Trading Derivatives may not be suitable for all investors, so please ensure that you fully understand the risks involved, and seek independent advice if necessary. A Product Disclosure Statement (PDS) can be obtained either from this website or on request from our offices and should be considered before entering into a transaction with us. Raw Spread accounts offer spread

As a result, the German HCOB Composite PMI advanced from 47.7 to a 10-month high of 50.5 versus a forecasted 48.6.

The Services PMI had more impact, accounting for over 70% of the German economy.

According to the preliminary survey,

  • New business across the services sector increased for the first time in ten months.
  • Workforce numbers increased at a more marked pace across the services sector.
  • Wage increases drove operating expenses higher across the services sector.
  • Output prices were also higher for the services sector as firms passed on increasing costs to their customers.
  • Optimism across the services sector pulled back from a 25-month high in March.

ECB Monetary Policy: Impact Analysis

The HCOB Services PMI will likely impact the ECB interest rate trajectory more. The ECB remains focused on the services sector, the main contributor to inflation. Employment and price trends for April could test investor bets on a June ECB interest rate cut. The survey singled out wage growth as a driving force behind input cost pressures.

EUR/USD Reaction to German Private Sector PMIs

Before the preliminary private sector PMI numbers from Germany, the EUR/USD fell to a low of $1.06385 before rising to a high of $1.06682.

In response to the German private sector PMI, the EUR/USD surged from $1.06650 to a session high of $1.06949.

On Tuesday, April 23, the EUR/USD was up 0.28% to $1.06832.


A graph with a line graph Description automatically generated with medium confidence

Up Next

Later this morning, preliminary private sector PMIs for the Eurozone will also warrant investor attention. Service sector activity, input and output price trends, and job creation rates will be likely focal points. Economists forecast the HCOB Services PMI to increase from 51.5 to 51.8 and the HCOB Manufacturing PMI to rise from 46.1 to 46.5 in April.

From the US, private sector PMIs will also need consideration. Economists expect the S&P Global Services PMI to increase from 51.7 to 52.0. Moreover, economists predict the S&P Global Manufacturing PMI to rise from 51.9 to 52.0.

Once more, the focus will likely be on the services sector, accounting for over 70% of the US economy. The services sector is a focal point for the Fed, with housing services an area of concern vis-à-vis returning inflation to the 2% target.

Yen Alert: Suzuki Stresses Trilateral Support Ahead of Golden Week

Yen Alert: Suzuki Stresses Trilateral Support Ahead of Golden Week

Ueda, Suzuki Address Parliament on Rates and the State of the Yen

On Tuesday, the Bank of Japan (BoJ) Governor Kazuo Ueda and the Minister of Finance Shunichi Suzuki updated parliament on inflation, interest rates and measures to combat the continued yen weakness.

Ueda, mentioned that rates will need to rise if trend inflation accelerates towards its 2% target as it expects. Friday’s meeting comes with the updated quarterly outlook and was initially eyed as the most likely opportunity for the Bank to raise rates out of negative territory. Having already hiked in March, the BoJ has had to take into account rising price pressures due, in part, to record wage growth, elevated oil prices, and a weaker yen – resulting in imported inflation. The market currently prices in a 10% chance the BoJ hike on Friday.

The Japanese Finance Minister Shunichi Suzuki stressed that the recent trilateral meeting between Japan, South Korea and the US laid the groundwork for Japan to take ‘appropriate action’ in the currency market. At a post-cabinet meeting news conference Suzuki said that authorities are not ruling out any options when it comes to recent volatile JPY moves that are not representative of fundamentals.

Next week’s Golden Week holidays in Japan could represent a low liquidity environment if authorities were to directly intervene in the FX market but the potential outcome remains uncertain.

USD/JPY Respects 155.00 But the Playbook Suggests Possible Breach

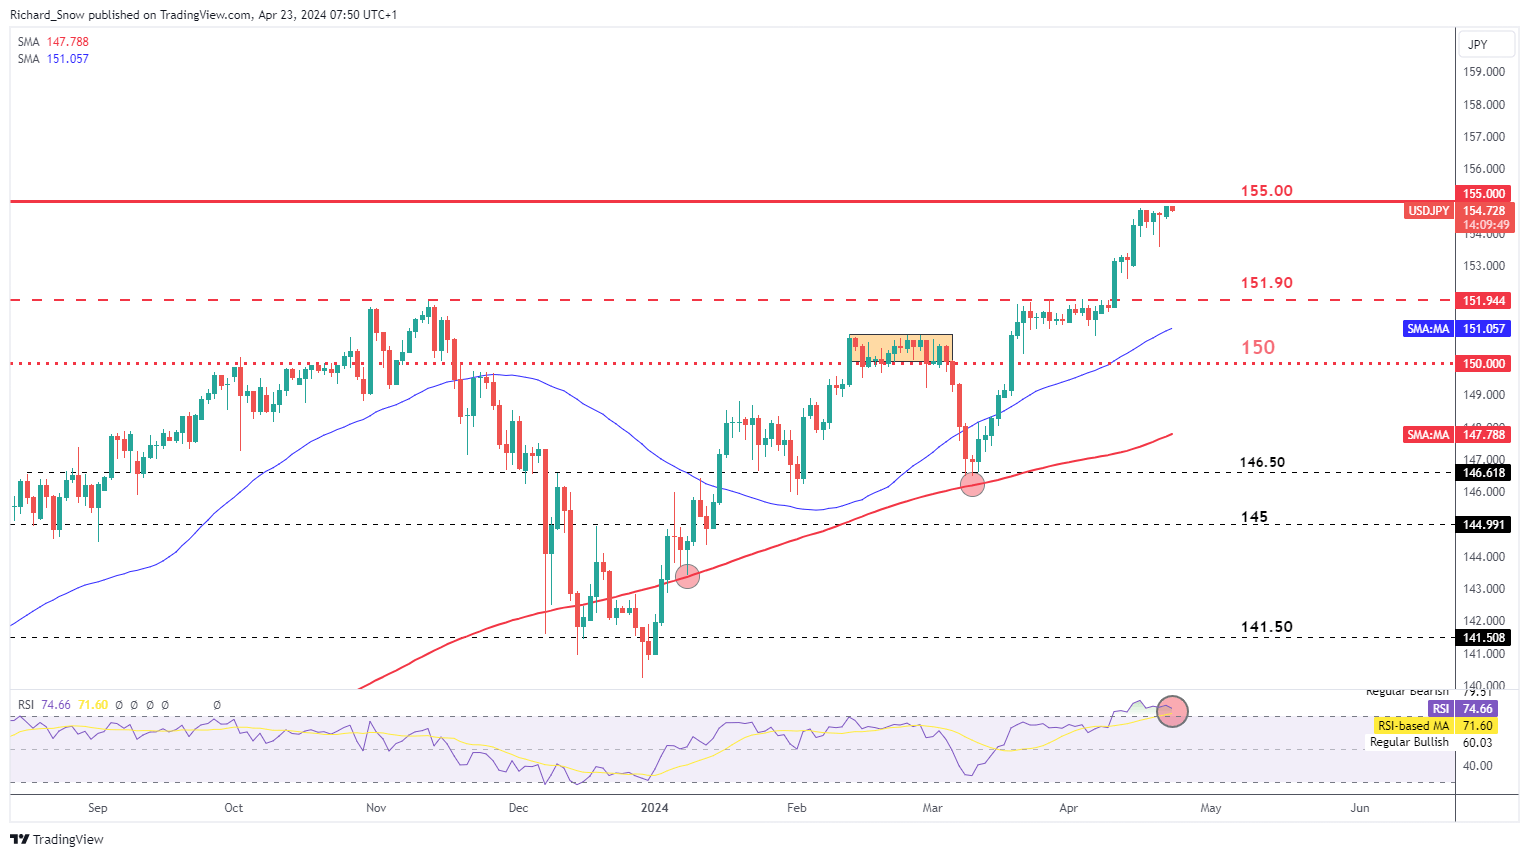
USD/JPY continue to respect the level of resistance at 155.00 – the level referred to by former vice finance minister Watanabe as a level that is likely to see a direct response from finance officials. However, markets respected the 152.00 level in a similar way before US CPI provided the catalyst to power through the psychological barrier.

This week, we have another inflation print in the form of PCE data that may act as a bullish catalyst again, potentially sending the pair higher. The RSI remains in overbought territory but a strong dollar and lackluster yen suggests this may extend for some time to come. The interest rate differential between the two keeps the carry trade alive and well -adding to the recent yen pressure as markets delay the first Fed cut even further down the line.

USD/JPY Daily Chart

image1.png

Learn the ins and outs of trading USD/JPY – a pair crucial to international trade and a well-known facilitator of the carry trade

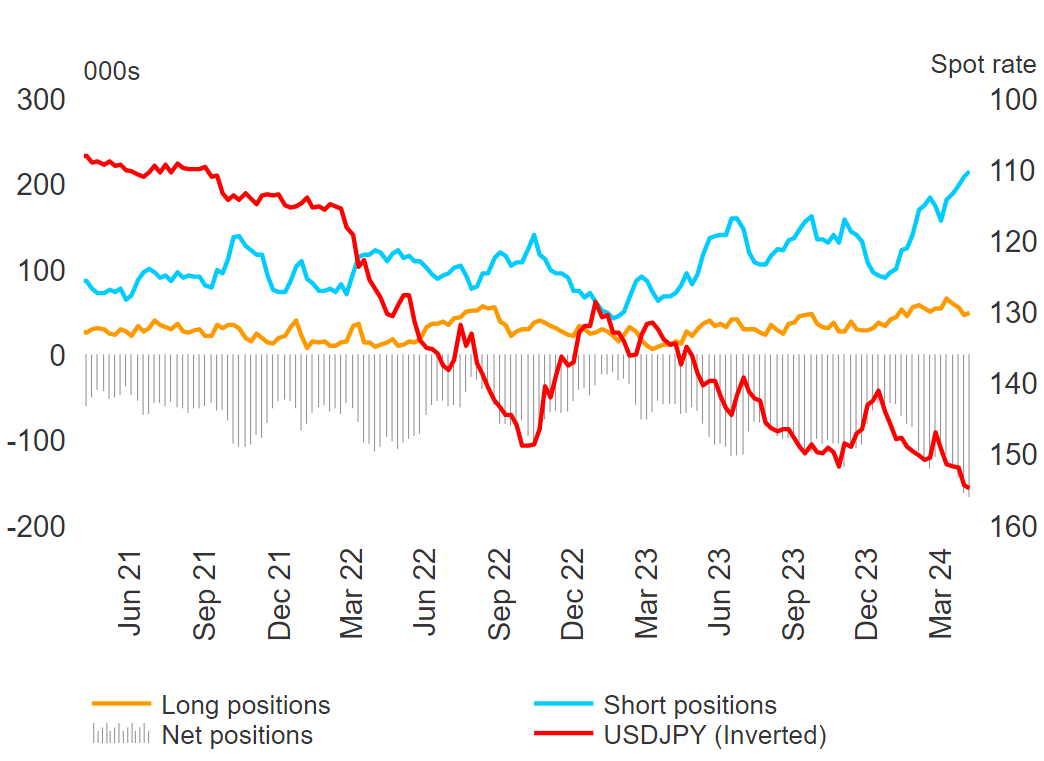
Short Yen Positioning Adds to Risks of a Sharp Reversal

Large speculative institutions like hedge funds and other money managers collectively hold a massive amount of short yen positions that could be unwound very quickly. The ‘smart money’ as they’re often referred to are clearly positioned to benefit from the positive carry but any FX intervention from Tokyo carries the potential for massive volatility and a sharp move lower in USD/JPY. Previous cases if intervention saw around 500 pip moves in the immediate aftermath.

Commitment of Traders (CoT) Report Showing Yen longs, shorts and USD/JPY (inverted)

image2.png

Major Risk Events for the Remainder of the Week

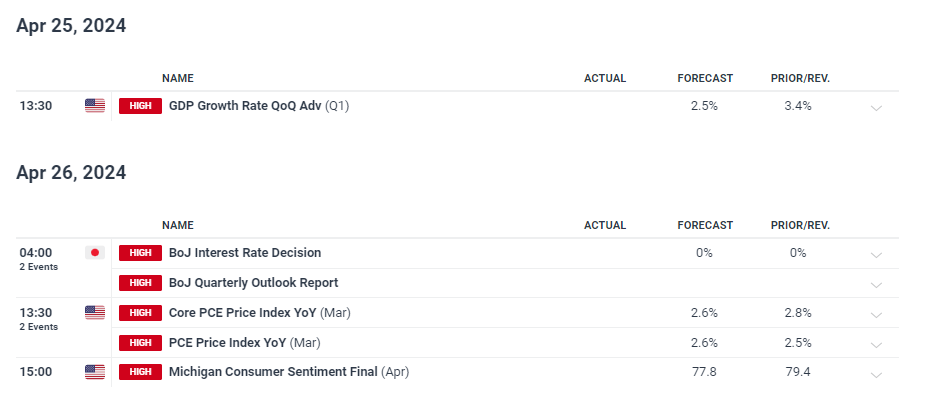
US data welcomes a return to prominence this week with the first look at US first quarter GDP on Thursday before Friday’s busy end to the week with US PCE inflation data and the Bank of Japan rate announcement.

The Atlanta Fed’s GDPNow forecast puts US GDP at 2.9% in Q1 versus the estimate of 2.5%. Either way, the data would represent moderating growth in the US but the economy remains strong on a relative basis – compared to the UK and EU, for example.

The Bank of Japan is set to release its updated quarterly outlook report at Friday’s meeting with a focus on the banks medium term inflation outlook taking into account record wage growth, elevated oil prices (Japan is a net-importer of oil) and a weaker yen all potentially adding to the data point – supporting further BoJ hikes to come.

PCE inflation data is the next data point in what has proven to be a series of hotter prints since the start of the new year. The expectation of 2.6% suggests hotter inflation is expected to continue and a large focus will be directed towards the month-on-month figure for a better idea of recent price pressures.

image3.png

What is Earnings Season & What to Look for in Earnings Reports?

What is Earnings Season & What to Look for in Earnings Reports?

What is Earnings Season & Why Is It Important?

Earnings season is a period each fiscal quarter, usually lasting several weeks, where many of the largest listed companies announce their latest financial accounts. An earnings report consists of revenue, net income, earnings per share (EPS) and forward outlook, amongst a bevy of other data points, which can help to provide investors with insight relating to the current health and outlook for the company. This information can be found on sec.gov, various financial publications, and individual companies’ websites.

Earnings season is important because it helps market participants glean information from the companies that they are monitoring along with the broader index. For example, a strong Apple (AAPL) earnings report may see investors bullish on Nasdaq 100 futures, a concept discussed further below when looking at bellwether stocks.

Something else that can accompany an earnings release is an earnings call. This is a conference between the company and analysts, press and investors which discusses the outcome of an earnings report and, in many cases, opens the floor for questions to company management. Such scrutiny of the reports can enable traders to access more information to further inform their decisions, although not all companies hold earnings calls.

When is Earnings Season & When Do Reports Come Out?

Earnings season takes place typically a few weeks after each quarter ends (December, March, June, September). In other words, earnings seasons begins around January-February (Q4 results), April-May (Q1 results), July-August (Q2 results) and October-November (Q3 results), with the unofficial start of earnings season usually marked by when the major US banks report results.

This typically coincides with an increase in the number of earnings being released, while the unofficial end of earnings season is usually around the time that Walmart (WMT) announces its earnings report.

3 Things to Look for in Company Earnings Reports

There are a number of factors to look for in company earnings reports. Traders should be most mindful of the performance of the largest ‘bellwether’ stocks, understand the significance of an earnings recession in a given stock, and grasp how a stock’s earnings announcement might impact a relevant index, depending on the weighting of the given security.

1) Performance of bellwether stocks

When analyzing company earnings, it is important to look out for ‘bellwether’ stocks which can be seen as a gauge for the performance of the macro-economy. While the status of a bellwether stock can change over time, the largest and most-established companies are typically considered a bellwether stock.

Examples of Bellwether stocks are:

  • FedEx (FDX): Ships goods for consumers and businesses across the globe
  • Caterpillar (CAT): World’s largest heavy-duty machinery maker has been viewed as a bellwether given its large exposure to construction, manufacturing and agricultural industries, particularly in China
  • 3M (MMM): Gauge for the health of the manufacturing sector
  • Apple (AAPL): Among the world’s largest companies. Important for key suppliers, in particular, chipmakers.

2) Earnings recession

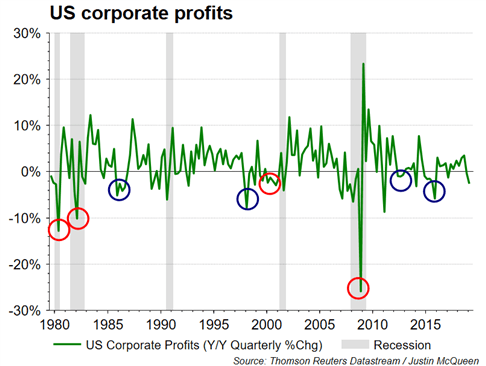
An earnings recession is characterized as two consecutive quarters of year-on-year declines in company profits. However, while earnings are an important factor in stock market returns over the long term, an earnings recession does not necessarily coincide with an economic recession.

The chart below shows that in the past six earnings recessions witnessed in the US, only two had coincided with an economic recession. The blue circles show where there was an earnings recession without an economic recession, while the red circles represent where both an earnings and economic recession occurred.

How earnings recession relates to economic recession

3) Earnings and stock index weighting

Traders should understand that when trading earnings, certain stocks will have a greater impact on the wider index according to their index weighting. For example, when trading the Dow Jones, Boeing releasing its earnings will be highly influential on the index, while Visa likely won’t be as influential, due to the former’s 9.49% weighting compared to the latter’s 4.41%, as shown in the table below. This highlights the importance of paying close attention to bellwether stocks and how they may impact a broader equity index.

Table of index weighting of stocks to help trade earnings

Trading during earnings season: Top tips

We have an in-depth guide on how to trade earnings season, but the important things to remember are:

1) Know the ‘expected’ results

Being cognizant of what is ‘expected’ with regards to the revenue/sales and earnings per share (EPS) figures are important because a company’s share price reaction can often be determined by the amount by which they beat/miss an aggregate of analysts’ expectations.

2) Stay alert to surprise announcements

Any surprise announcements that coincide with an earnings report can also impact the share price of a company. These may include stock buybacks/share repurchase programs as well as company guidance.

3) Be aware of spillover effects between stocks

An example of spillover impact could be if an investor has a chipmaker stock within their portfolio (EG Dialog Semiconductor), earnings from Apple could have a sizeable impact on the stock. Consequently, it is important to assess related stocks, given that they may reveal the outlook for a sector, thus sparking a possible sector rotation.

4) Consider volatility over the bearing of an expected move

Working out the ‘expected move’ on a directional basis for a stock in reaction to the binary earnings event can be a fraught endeavor. Alternatively, a view taken with volatility in mind instead can prepare investors for significant movement without positioning on the wrong side of the eventual outcome.

Risk Management Techniques for Trading

Risk Management Techniques for Trading

Why is trading risk management important?

Many traders see trading as an opportunity to make money but the potential for loss is often overlooked. By implementing a risk management strategy, a trader will be able to limit the negative effects of a losing trade when the market moves in the opposite direction.

A trader who incorporates risk management into the trading strategy will be able to benefit from upside movement while minimizing downside risk. This is achieved through the use of risk management tools like stops and limits and by trading a diversified portfolio.

Traders that opt to forgo the use of trading stops run the risk of holding onto positions for too long in the hope that the market will turn around. This has been identified as the number one mistake traders make, and can be avoided by adopting the traits of successful traders to all trades.

How to Manage Risk in Trading: Top Tips and Strategies

Below are six risk management techniques that traders of all levels should consider:

  1. Determine the risk/exposure upfront
  2. Optimal stop loss level
  3. Diversify your portfolio: the lower the correlation, the better the diversification
  4. Keep your risk consistent and manage your emotions
  5. Maintaining a positive risk to reward ratio

1) Determine the risk/exposure upfront:

Risk is inherent in every trade which is why it is essential to determine your risk before entering the trade. A general rule would be to risk 1% of the account equity on a single position and no more than 5% across all open positions, at any time. For example, the 1% rule applied to $10,000 account would mean no more than $100 should be risked on a single position. Traders will then need to calculate their trade size based on how far away the stop is placed in order to risk $100 or less.

The benefit of this approach is that it helps to preserve the account equity after a run of unsuccessful trades. An additional benefit of this approach is that traders are more likely to have free margin available to take advantage of new opportunities in the market. This avoids having to forgo such opportunities due to margin being tied up in existing trades.

2) Optimal stop loss level

There are many different approaches that traders can utilize when deciding where to place a stop.

Traders can set stops in accordance with:

  • Moving averages – set stops above (below) the specified MA for long (short) positions. The chart below shows how traders can use the moving average as a dynamic stop loss.

using moving average as a risk management tool

  • Support and resistance – set stops below (above) support (resistance) for long (short) positions. The chart below shows the stop being placed below support in a ranging market , allowing the trade enough room to breathe while protecting against a large downward move.

stops near support and resistance as a risk management strategy

  • Using the Average True Range (ATR) – ATR measures the average pip/point movement in any security over a specified period and provides traders with a minimum distance away to set their stops. The chart below adopts a cautious approach to the ATR by setting the stop distance in accordance with the maximum ATR reading from recent price action.

using average true range in a risk management strategy

*Advanced Tip : Instead of using a normal stop loss, traders can use a trailing stop to mitigate risk when the market is moving in your favor. The trailing stop, as the name suggests, moves the stop loss up on winning positions while maintaining the stop distance, at all times.

3) Diversify your portfolio: The lower the correlation, the better the diversification

Even if the 1% rule is adhered to, it is crucial to know how positions may be correlated. For example, the EUR/USD and GBP/USD currency pairs have a high correlation, meaning they tend to move closely together and in the same direction. Trading highly correlated markets is great when trades move in your favour but becomes an issue on losing trades as the loss on the one trade now applies to the correlated trade too.

The chart below depicts the high correlation observed between EUR/USD and GBP/USD. Notice how closely the two price lines track each other.

correlation between eur/usd and gbp/usd

Having a good understanding of the markets you are trading and avoiding highly correlated currencies, helps to achieve a more diversified portfolio with reduced risk.

4) Keep your risk consistent and manage your emotions

Once traders make a few winning trades, greed can easily set in and entice traders to increase trading sizes. This is the easiest way to burn through capital and place the trading account in jeopardy. For more established traders however, it is alright to add to existing winning positions but maintaining a consistent framework when it comes to risk should be the general rule.

Fear and greed rear their ugly head many times when trading. Learn how to manage fear and greed in trading .

5) Maintaining a positive risk to reward ratio

Maintaining a positive risk to reward ratio is crucially important to managing risk over time. There may be losses early on but maintaining a positive risk to reward ratio and keeping to the 1% rule on each trade, greatly enhances the consistency of your trading account over time.

The risk to reward ratio calculates how many pips a trader is prepared to risk, compared with the number pips a trader will receive if the target/limit is hit. A 1:2 risk to reward ratio means that the trader is risking one pip to make two pips, if the trade works out.

The magic within the risk to reward ratio lies in its repeated use. We discovered in our Traits of Successful Traders research that the percentage of traders who used a positive risk to reward ratio tended to show profitable results versus those with a negative risk to reward ratio (page 7 of the guide). Traders can still be successful, even if they only win 50% of their trades, as long as a positive risk to reward ratio is maintained.

*Advanced Tip : Traders often get frustrated when the trade moves in the right direction only for the market to turn right around and trigger the stop. One way to avoid this happening is to make use of a two-lot system. This strategy looks to close out half of the position when it is midway to the target and then bring the stop on the remaining position to break-even. This way the traders gets to bank the profit on the one position while essentially being left with a risk-free trade in the remaining position (if using a guaranteed stop).

Trading risk management tools

1) Normal Stop Loss : These stops are the standard stops offered by most forex brokers. They tend to work best in non-volatile markets as they are prone to slippage . Slippage is a phenomenon where the market doesn’t actually trade at the specified price, either because there is no liquidity at that price or due to a gap in the market. As a result, the trader has to take the next best price, which may be significantly worse, as shown in the USD/BRL chart below:

usd/brl market gapping risk management

2) Guaranteed Stop Loss : A guaranteed stop eliminates the issue of slippage entirely. Even in volatile markets where price can gap, the broker will honor the exact stop level. However, this feature comes with a cost as brokers will charge a small percentage of the trade to guarantee the stop level.

3) Trailing Stop Loss : A trailing stop moves the stop closer to the current price on winning positions while maintaining the same stop distance at inception of the trade. For example, the GBP/USD chart below shows a short entry that moves favorably. Every time the market moves 200 pips the stop will automatically move along with it, while maintaining the initial stop distance of 160 pips.

Trailing stop as a form of risk management

How Forex Traders Use ISM Data

How Forex Traders Use ISM Data

The ISM manufacturing index plays an important role in forex trading, with ISM data influencing currency prices globally. As a result, the ISM manufacturing, construction and services indicators can provide unique opportunities for forex traders, which makes understanding this data (and how to prepare for its monthly release) essential.

Talking points:

  • What is ISM?
  • How ISM impacts currencies
  • How forex traders use ISM data

What is ISM?

The Institute for Supply Management (ISM) measures the economic activity from both the manufacturing side as well as the service side. Monthly ISM data releases include key information such as changes in production levels.

ISM was formed in 1915 and is the first management institute in the world with members in 300 countries. The data gleaned from its large membership of purchasing managers means ISM is a reliable guide to global economic activity, and as a result, currency prices. A country’s economy is often determined by its supply chain, as a result, the monthly ISM manufacturing and non-manufacturing PMI economic news releases are carefully watched by forex traders around the world.

ISM Surveys

ISM publishes three surveys – manufacturing, construction, and services – on the first business day of every month. The ISM Purchasing Managers Index (PMI) is compiled from surveys of 400 manufacturing purchasing managers. These purchasing managers from different sectors represent five different fields:

  1. Inventories
  2. Employment
  3. Speed of supplier deliveries
  4. Production level
  5. New orders from customers.

In addition, ISM construction PMI is released on the second business day of the month, followed by services on the third business day. Forex traders will look to these releases to determine the risks at any given time in the market.

How does ISM Impact currencies?

The Manufacturing and Non-manufacturing PMIs are big market movers. When these reports are released at 10:30am ET, currencies can become very volatile. Since these economic releases are based on the previous month’s historical data gathered directly from industry professionals, forex traders can determine if the US economy is expanding or contracting – much like non-farm payrolls (NFP) data.

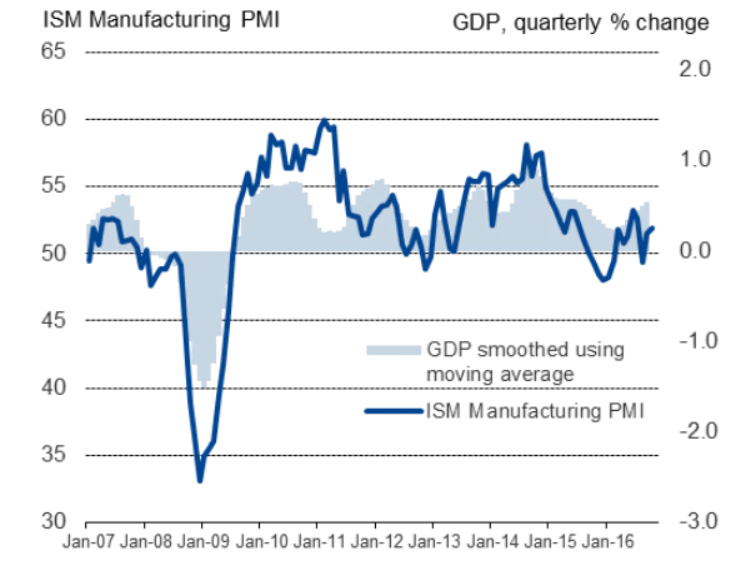
Currencies react with this information as it represents a gauge of US economic health (see image below).

ISM manufacturing PMI vs GDP

Source: Institute for Supply Management

How forex traders use ISM data

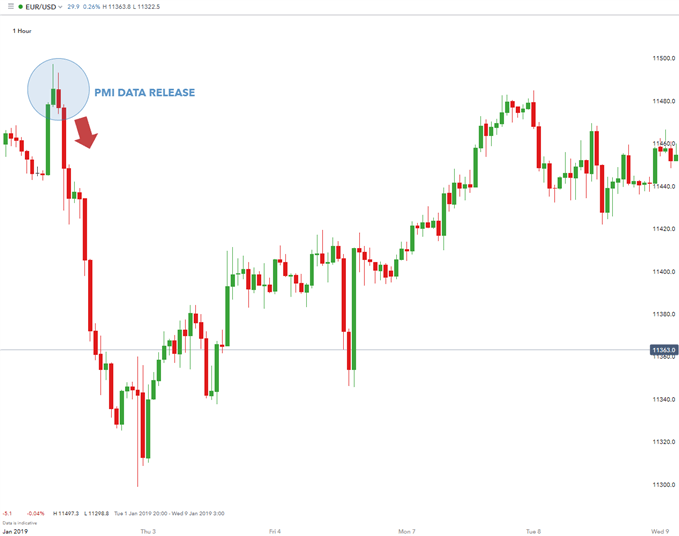
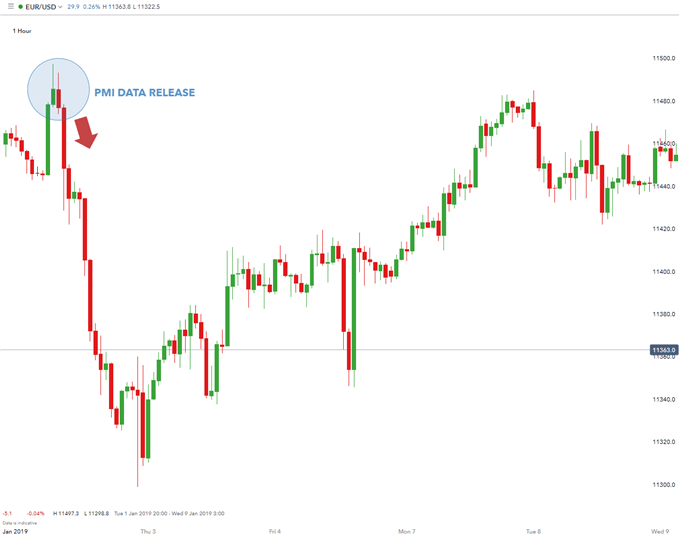
Forex traders will compare the previous month’s ISM data figure with the forecasted number that economists have published. If the released PMI number is better than the previous number and higher than the forecasted number, the US dollar tends to rally. This is where fundamental and technical analysis comes together to create a trade setup.

EUR/USD drops as a result of better than expected data

ism manufacturing index

In the example above, notice how the better than expected PMI number triggered a US dollar rally against the Euro. As seen in the chart (EUR/USD – one hour), the ISM Manufacturing PMI came in higher than the previous month at 54.9.

When an economic releases beats expectation, sharp fast moves can ensue. In this case, EUR/USD dropped 150 pips in a few hours. Traders often choose the Euro as the “anti-dollar” to take advantage of capital flows between two of the largest economies.

Read more on using pips in forex trading.

The Eurozone has large liquid capital markets which can absorb the huge waves of capital seeking refuge from the US. A weak US ISM Non-Manufacturing number usually leads to a dollar sell-off and a rise in the Euro. Another scenario is when the number released is in line with forecasts and/or unchanged from the previous month, then the US dollar may not react at all to the number.

Overall, an ISM PMI number above 50 indicates that the economy is expanding and is healthy. However, a number below 50 indicates that the economy is weak and contracting. This number is so important that if the PMI is below 50 for two consecutive months, an economy is considered in recession.

PMIs are also compiled for Euro zone countries by the Markit Group while US regional and national PMIs are compiled by ISM. As you can see, traders have good reason to pay special attention to the important releases from the ISM manufacturing index.