What is the VIX in the stock market?
The VIX was created by the Chicago Board Options Exchange (CBOE) in 1990 to act as a benchmark for measuring expectations about future stock market volatility. It’s a real-time index which reflects market participants’ expectations of volatility over the next 30 days.
At the most basic level the VIX index is constructed using weekly and traditional SPX index options and their levels of implied volatility. One can think of implied volatility as expected volatility derived from market participants’ activity in the options market. Understanding why the VIX behaves inversely to the S&P 500 is important because the volatility index acts as a measure of market sentiment, hence the reason it is called a “fear barometer”.
What is the relationship between vix and S&P 500 (SPX)?
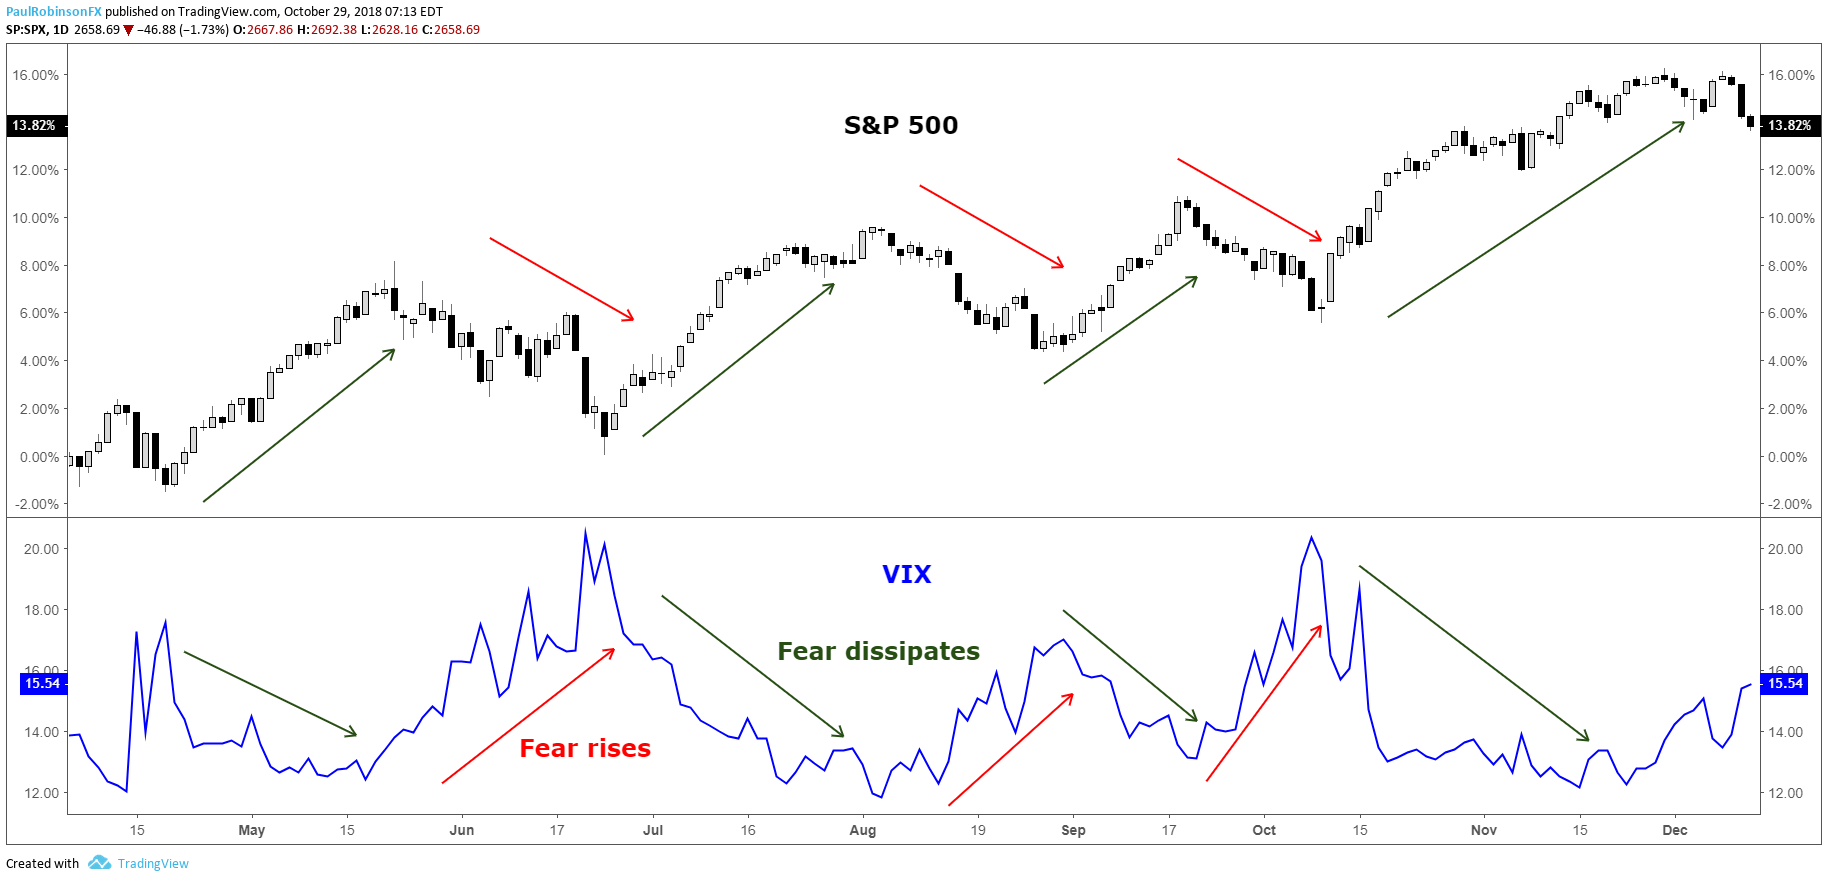
The S&P 500 VIX has a propensity to rise in bearish stock market environments and fall or remain steady during bullish environments. This happens because of the long-term bullish bias of the stock market and the fact that the VIX is calculated using implied volatility.
Implied volatility goes up when there is strong demand for options, and this typically happens during declines in the price of the S&P 500 as market participants (who are collectively bullish) are quick to buy protection (put options) for their portfolios.
When the S&P 500 rallies we see demand for protection dissipate and as a result a decline in the VIX. This process in recent years has become exasperated, in all likelihood, because the VIX has gone from just a market gauge of volatility to a tradable asset class through product offerings on various futures, equities, and options exchanges.
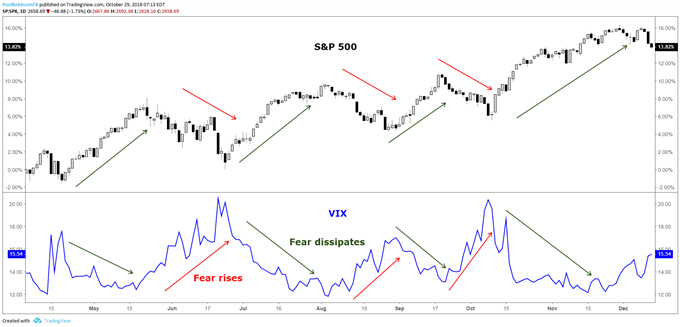
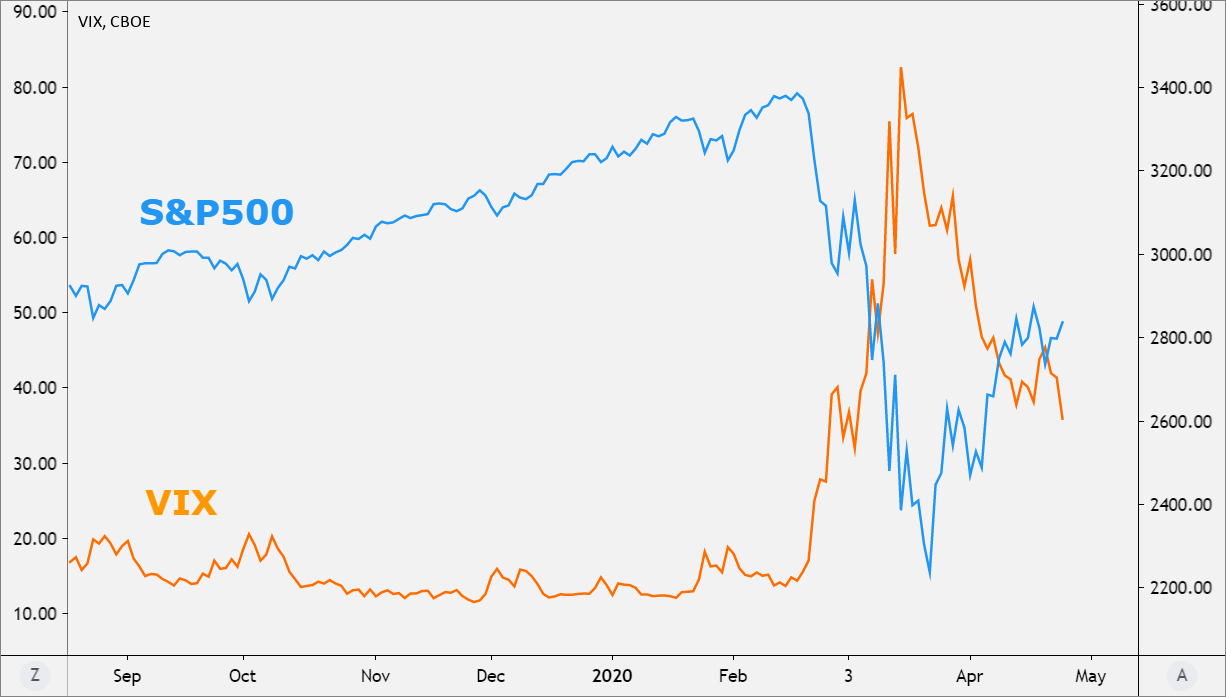
Created with Tradingview
S&P 500 VIX correlation
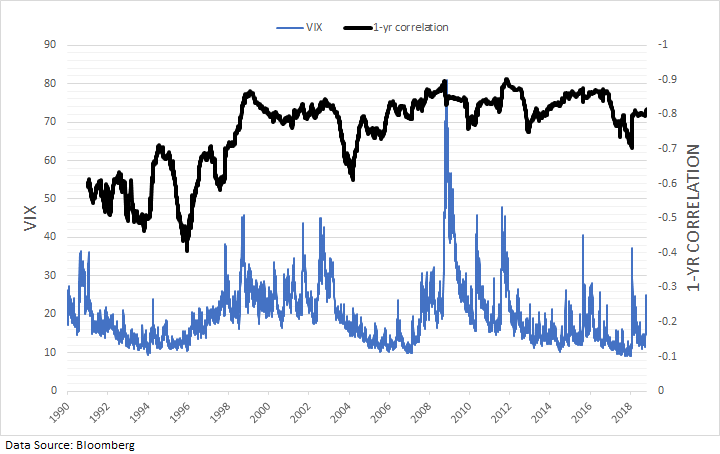
The S&P 500 VIX correlation is simply how the S&P 500 and the VIX move relative to one another. From the chart above it’s easy to see the strongly negative correlation between the stock market and the VIX. Stock market slumps lead to spikes in the index. Dating back the beginning of the VIX in 1990, the correlation between daily changes in the S&P 500 and VIX is -77%. Over the past 10 years the inverse correlation has become even stronger at -81%, while prior to October 2008 it was -74%.
The tighter relationship could very well be attributed to the various products introduced over the past 10-15 years which allow market participants to trade the VIX. As said earlier, this would also make sense as to why we are also seeing larger spikes in the VIX when the market weakens, as trading of the VIX itself is causing exaggerated moves in implied volatility.
The relationship between the S&P 500 and the VIX has largely been consistent and reliable over the years, though. The rolling 1-year correlation between daily changes has on average been around -83% over the past 10 years, staying within a relatively tight range of -70% to -90%.
S&P 500 VIX chart: One-year rolling correlation

Using VIX to predict S&P 500 Volatility
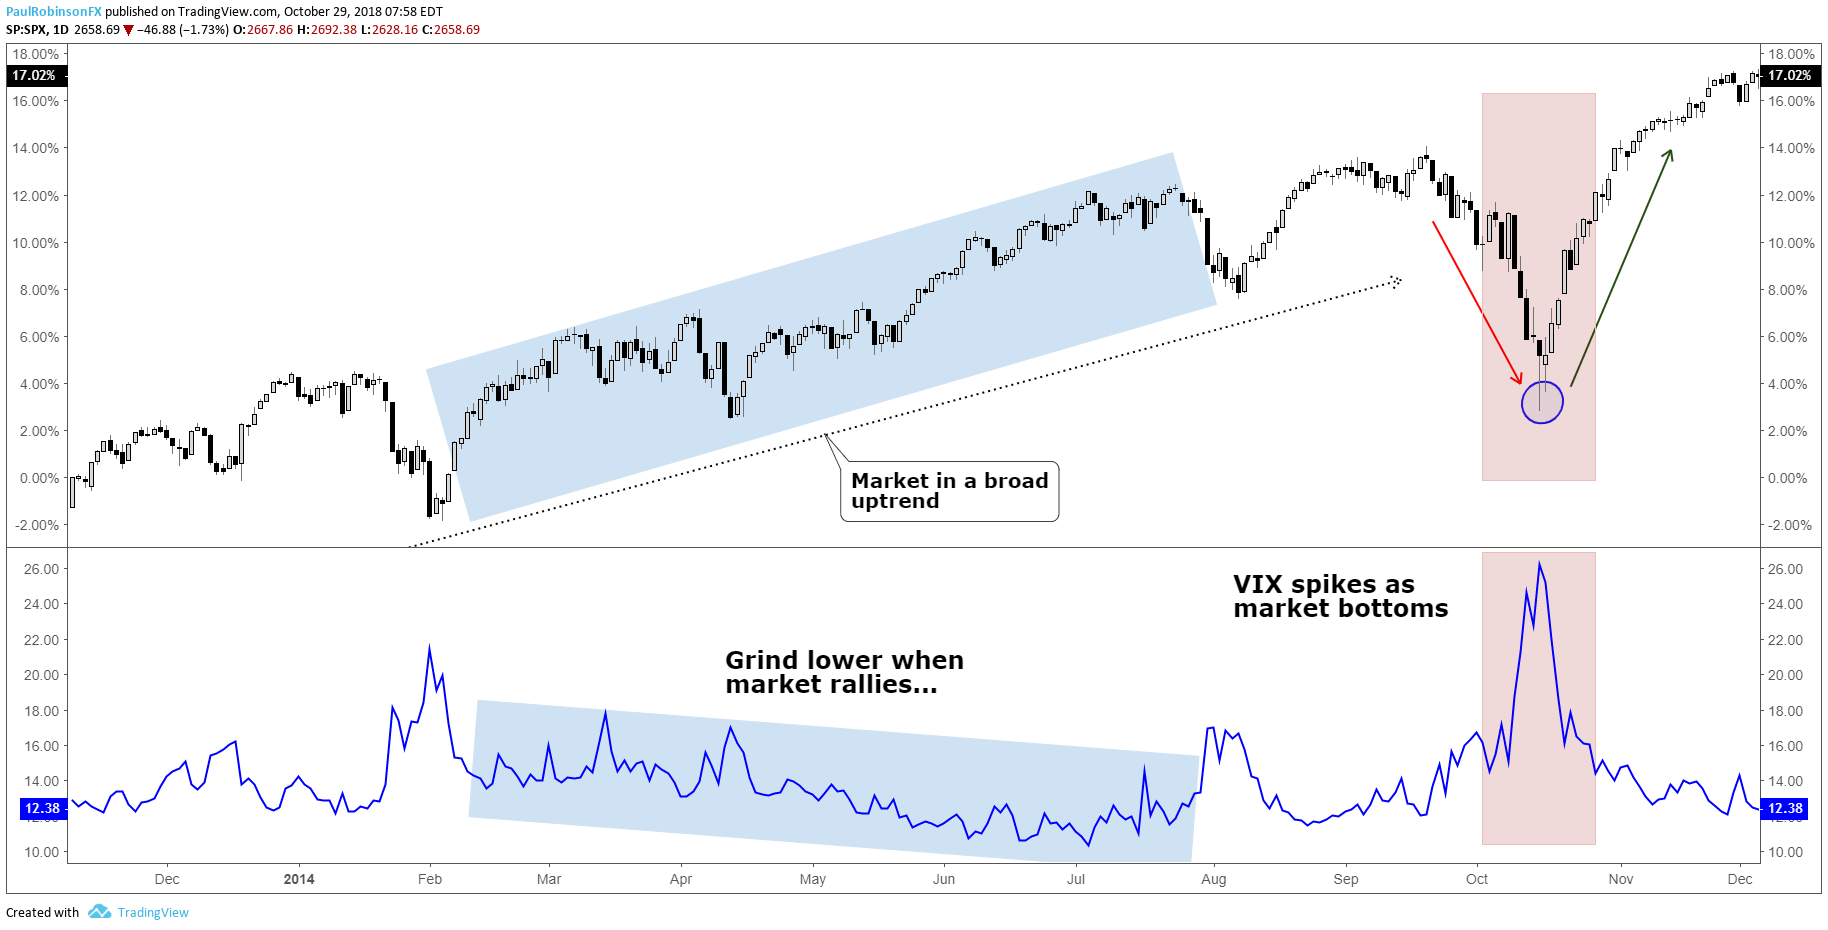
The S&P500 VIX can be used to identify market turns, more specifically bottoms. Because the stock market tends to rise in a gradual fashion the VIX too will decline in a gradual to sideways fashion. This can lead to very low levels which warn of complacency as investors feel no need for protection, but these periods can last long enough that using the VIX as a sell signal can be rendered largely ineffective.
However, because the S&P 500 is long-biased by nature, when there are declines investors buy protection (put options) quickly, driving up the VIX. Often there is an overreaction by market participants when the market declines, hence the reason why the VIX is called a “fear barometer”.
The spike-like behavior which the VIX exhibits during times of market stress can be a timely signal for determining when selling has become overdone and the market is due to bounce or even bottom for a longer-term move higher. This strategy is typically best employed when the VIX ‘signal’ arrives within the context of a generally bullish trend in the S&P 500.
S&P500 VIX chart: Spikes can be used to indicate trading bottoms

factor seen when the VIX is at very low levels, there is a nuance to this which can help identify when the stock market may be nearing a turning point to the downside, but they don’t happen frequently. When the VIX and S&P 500 both rise together over a period of time it can indicate growing instability in the trend which sets the market up for a sell-off.
Using S&P 500 volatility for risk management
When trading the S&P 500 there should be an inverse relationship between trading size and market volatility, or the VIX. One common mistake traders make is that they will simply trade a fixed lot size regardless of the distance their stop-loss is away from the entry price. This means the at-risk amount of capital will be highly variable (likely due to levels of volatility) and thus lead to inconsistent results. Additionally, a trader is putting themselves at greater risk when they should be doing the opposite.
A prudent approach to risk management is to determine how much of your capital you are willing to risk per trade and then adjust the trading size accordingly. For example, if you are willing to risk 1% on an S&P 500 trade and have a 10-point stop-loss, and have another trade where you are willing to risk 1%, but with a 5-point stop-loss, for both trades to equal 1% in risk the second trade would need to be twice as large as the first trade given the distance to the stop-loss. This provides a dynamic approach to position-sizing when trading the S&P 500 for more consistent results.
Average True Range (ATR) and the VIX
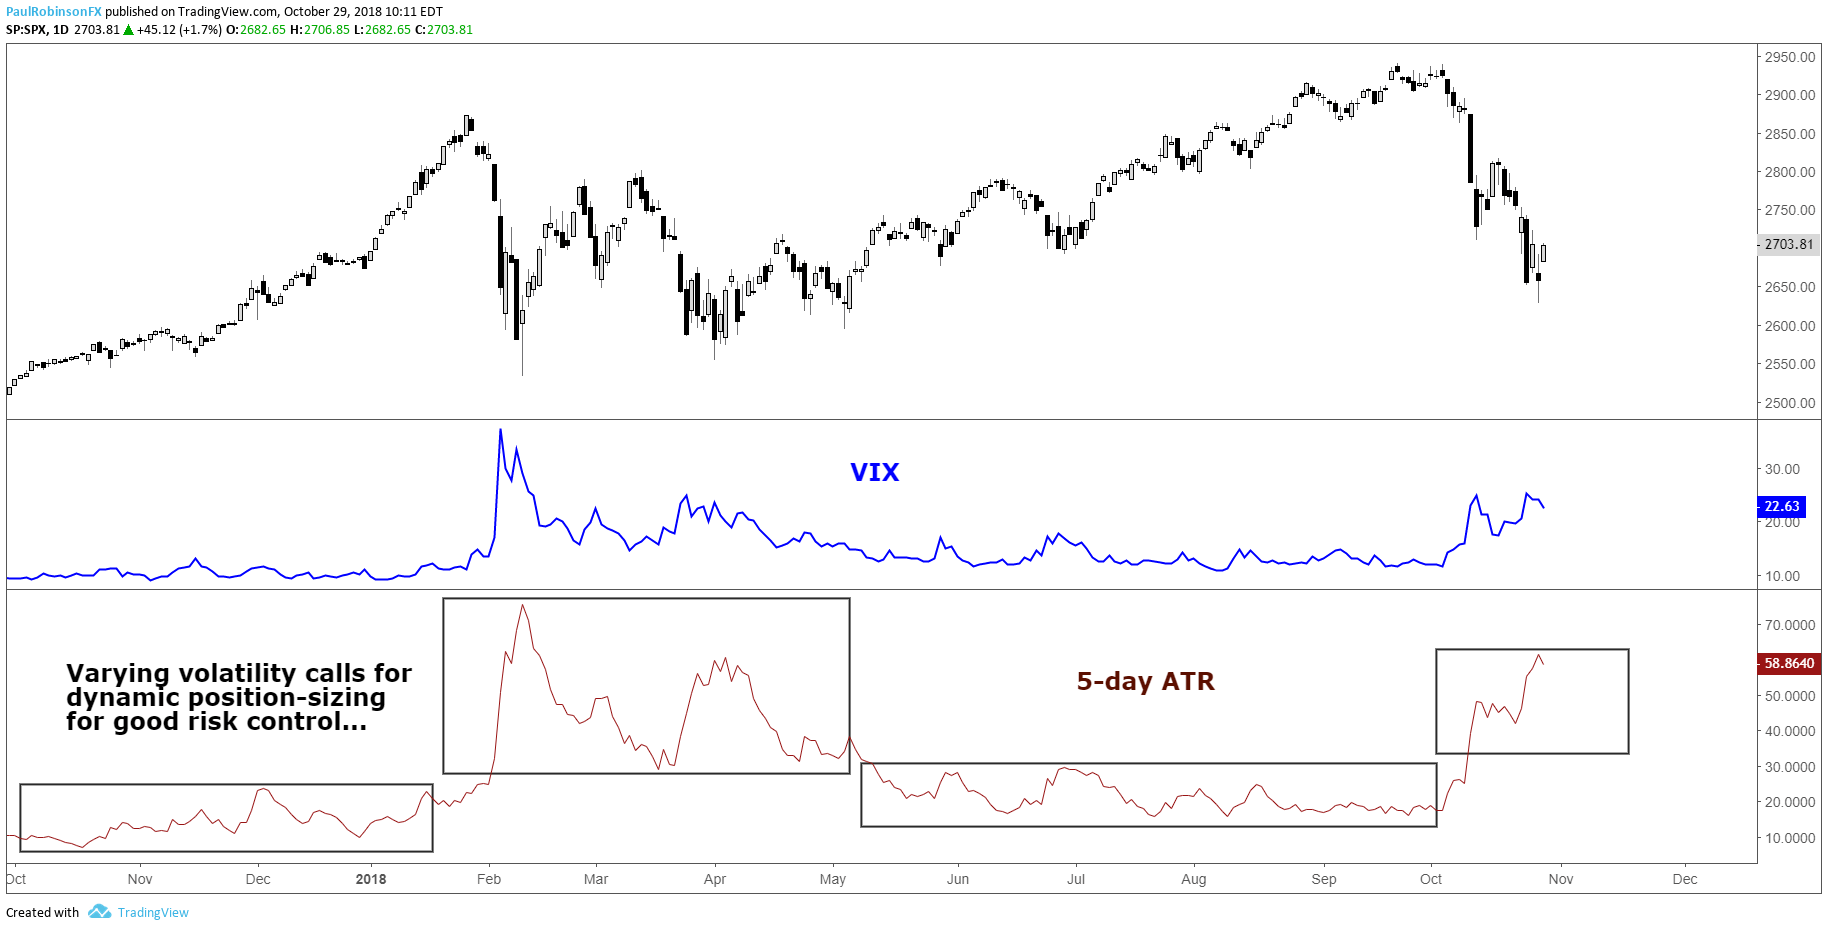
On average, the distance to your stop-loss will largely depend on the level of the VIX. Another way to measure volatility is with ATR (Average True Range). From the chart below, you can see that ATR and VIX look very similar, despite ATR using historical data and the VIX calculation relying on an options pricing model. When the VIX spiked so did the trading ranges of the S&P 500, which means a trader using a dynamic position-sizing strategy would adjust their trading size down to account for the new level of volatility. Simply put, if you are risking specific amounts of capital like in the example above, versus trading fixed lots, then you will be adjusting dynamically with S&P 500 volatility. For more on the topic of risk management, check out this article and video on sound risk management techniques.
S&P 500 VIX & ATR (Changing volatility requires changes to trading size)
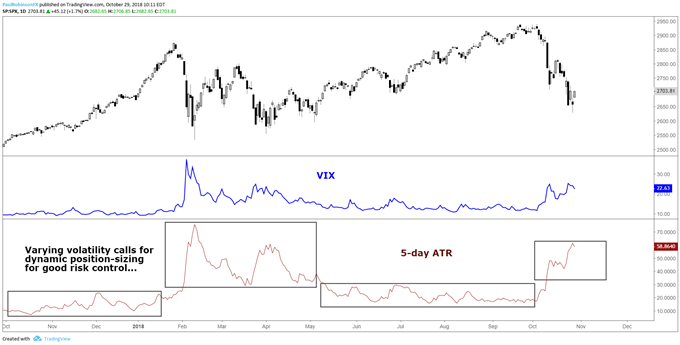
Created with Tradingview
S&P 500 and VIX Key takeaways
To summarize, understanding stock market volatility and the CBOE Volatility Index (VIX) is important for trading equity indices. There are benefits to understanding the nature of volatility from both an analytical and risk management standpoint. Like all things, getting a feel for the relationship between the VIX and the S&P 500 will take a little experience to get a handle on, but well worth the time.
For more information on the S&P 500 Index, read our guide to trading S&P 500. Or for an in-depth review of the major stock indices, we have rounded up the top differences between the Dow, Nasdaq and S&P 500.