Price Action: The Power of the Wick

Price Action: The Power of the Wick

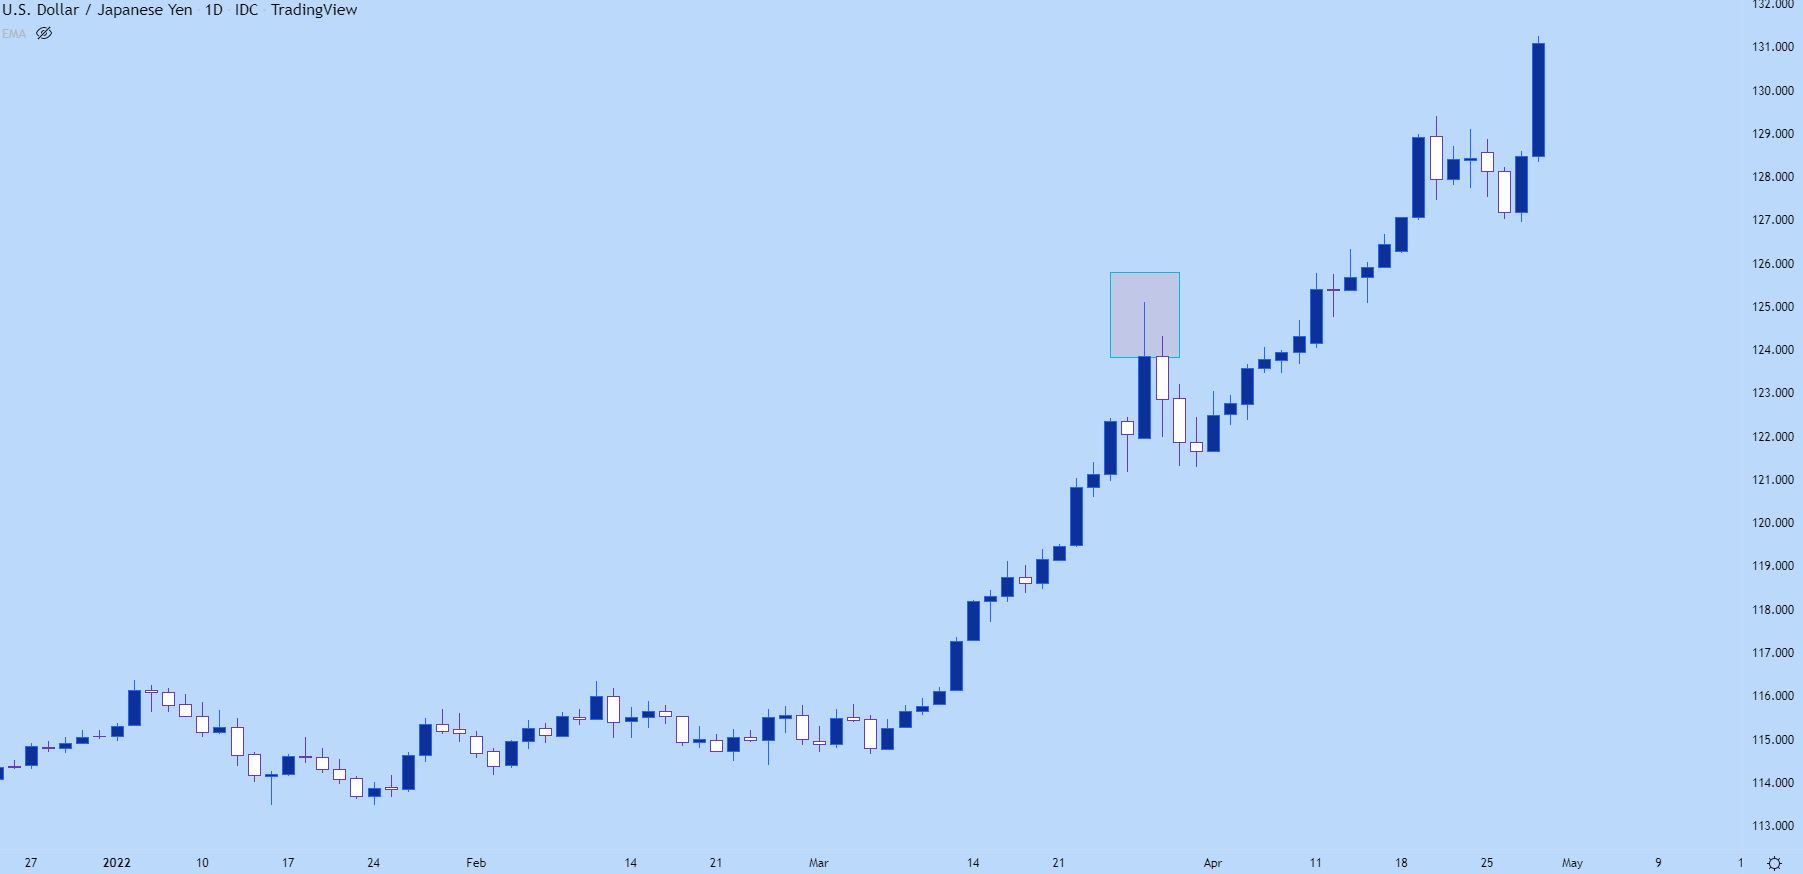
If you’re following prices on an hourly chart and price suddenly reverses from a bullish trend, erasing the entirety of the move – how would that show on a daily chart?

Likely, this will illustrate as a wick sitting atop that daily bar indicating the reversal that had taken place. On the below daily chart of USD/JPY, I’ve identified such an extended wick, and notice that the three days that followed continued to see prices pull back despite a very strong trend that led into the move.

USD/JPY Daily Price Chart

Chart prepared by James Stanley; USD/JPY daily chart, late Dec 2021 – April 2022

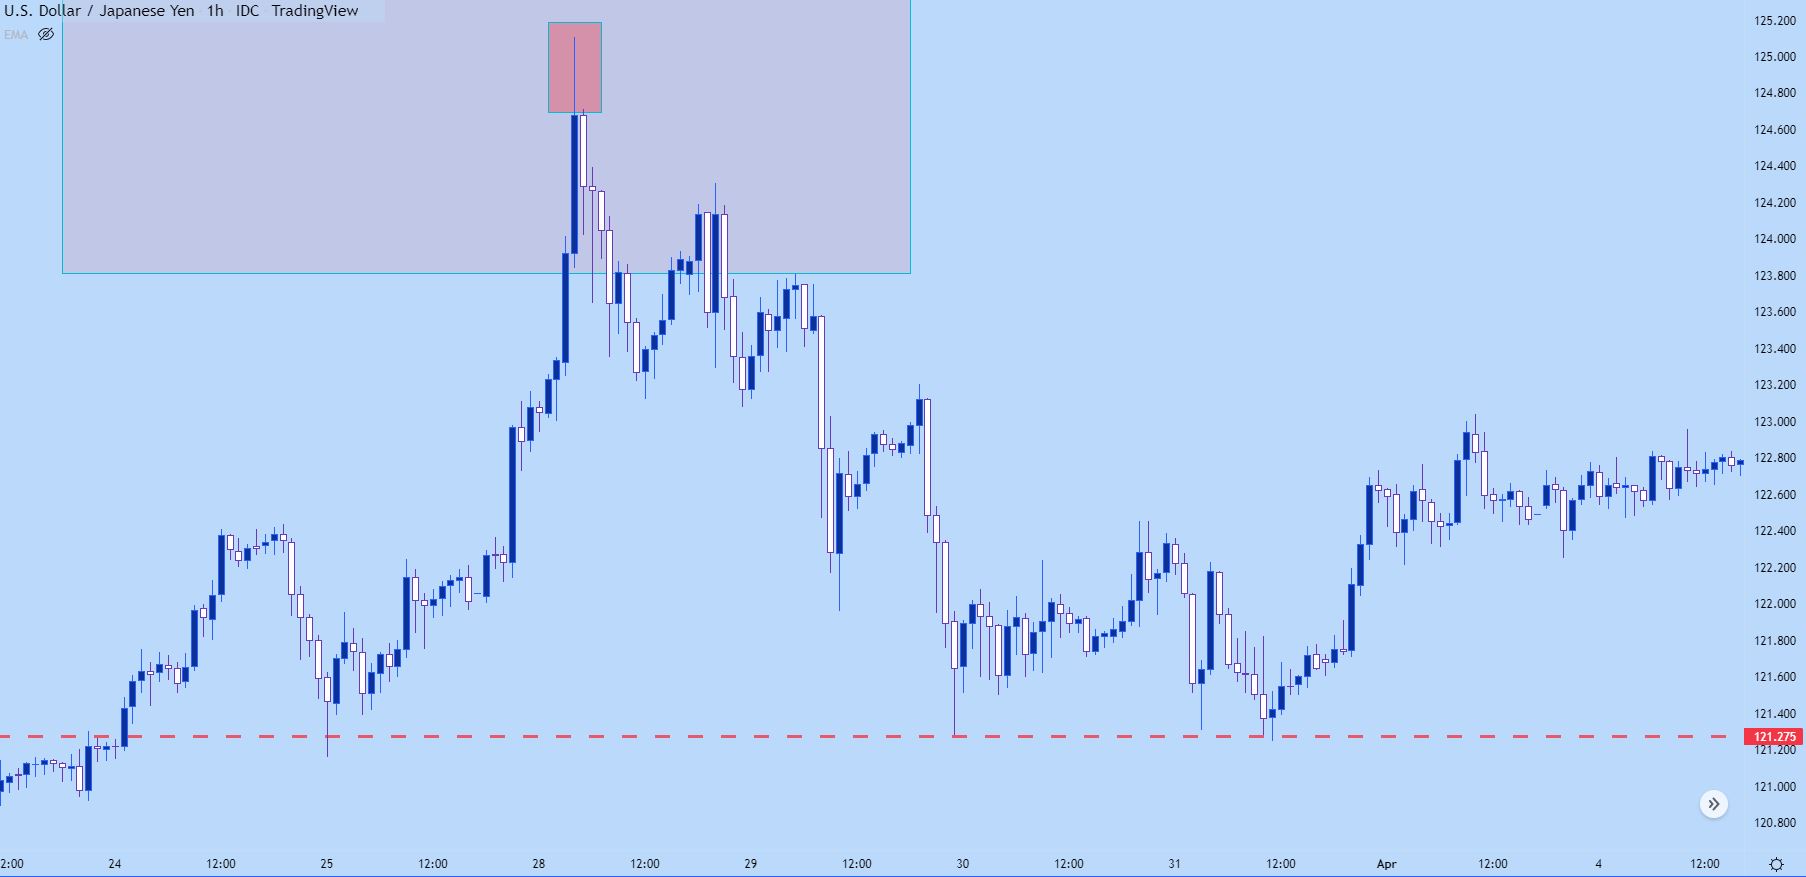
On the below hourly chart, we’re taking a closer look at that same iteration and we can see that there was an extended upper wick there, as well, albeit much smaller than the wick that showed on the daily.

That three day sell-off started from a fairly clear reversal that had even showed on the hourly chart.

What’s going on here: Likely there was a catalyst of some type that started a fast reversal and this is simply the playing out of that new ‘bearish’ factor getting priced-in. And, as we looked price action trends, trends do not move in a linear manner, its often a sequencing of ‘two steps forward, one step back,’ and that’s showing in the below example after the reversal began as ‘two steps down, one step up.’

USD/JPY Hourly Price Chart

Chart prepared by James Stanley; USD/JPY hourly chart, late March – early April 2022

You might notice on the above chart, the red line along the bottom. Well that’s pretty key for support and resistance identification when using price action, and we’ll dig into that in our next article on the topic.

US Dollar on Breakdown Watch After Fed Pivot, Setups on EUR/USD, USD/JPY, GBP/USD

US Dollar on Breakdown Watch After Fed Pivot, Setups on EUR/USD, USD/JPY, GBP/USD

The U.S. dollar, as measured by the DXY index, was a touch softer on Tuesday, down about 0.35% to 102.13, undermined by the pullback in Treasury yields, which has continued this week following the Federal Reserve’s pivot last Wednesday.

For context, the Fed took a more optimistic view of the inflation outlook at the conclusion of its December monetary policy meeting, admitting that discussions of cutting rates have begun and signaling that it will deliver 75 basis points of easing in the coming year, a big shift from its previous stance.

With traders increasingly confident that the U.S. central bank will prioritize economic growth over price stability and will slash borrowing costs numerous times in 2024, bond yields are likely to head lower in the near term, creating a hostile environment for the greenback.

Positive sentiment and market exuberance triggered by the FOMC’s dovish posture will also act as a headwind for the greenback, boosting riskier and high-beta currencies for the time being. Against this backdrop, we could see new lows for the DXY index before the end of 2023.

EUR/USD TECHNICAL ANALYSIS

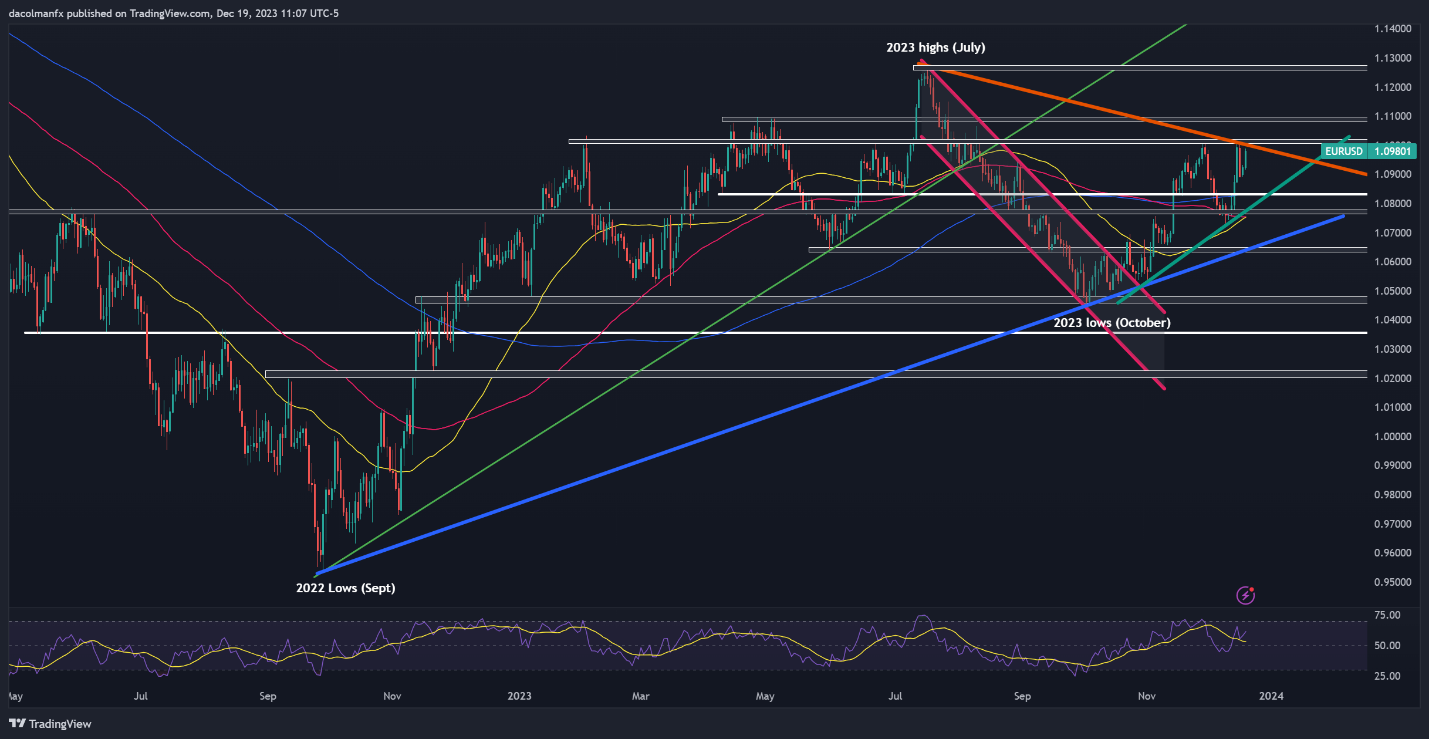
EUR/USD extended its advance and rose for the second straight day on Tuesday, pushing closer toward cluster resistance stretching from 1.1000 to 1.1015. Breaching this barrier may prove challenging for bulls, but a breakout could pave the way for a rally towards the 1.1100 handle.

Conversely, if bullish momentum fades and prices turn lower, the 200-day SMA near 1.0830 will be the first line of defense against a bearish assault. The pair is likely to establish a base in this region before staging a comeback, but if a breakdown occurs, a drop toward trendline support at 1.0770 could ensue.

EUR/USD TECHNICAL CHART

A screen shot of a graph  Description automatically generated

EUR/USD Chart Created Using TradingView

Interested in learning how retail positioning can offer clues about USD/JPY’s near-term path? Our sentiment guide has valuable insights about this topic. Download it now!

USD/JPY TECHNICAL ANALYSIS

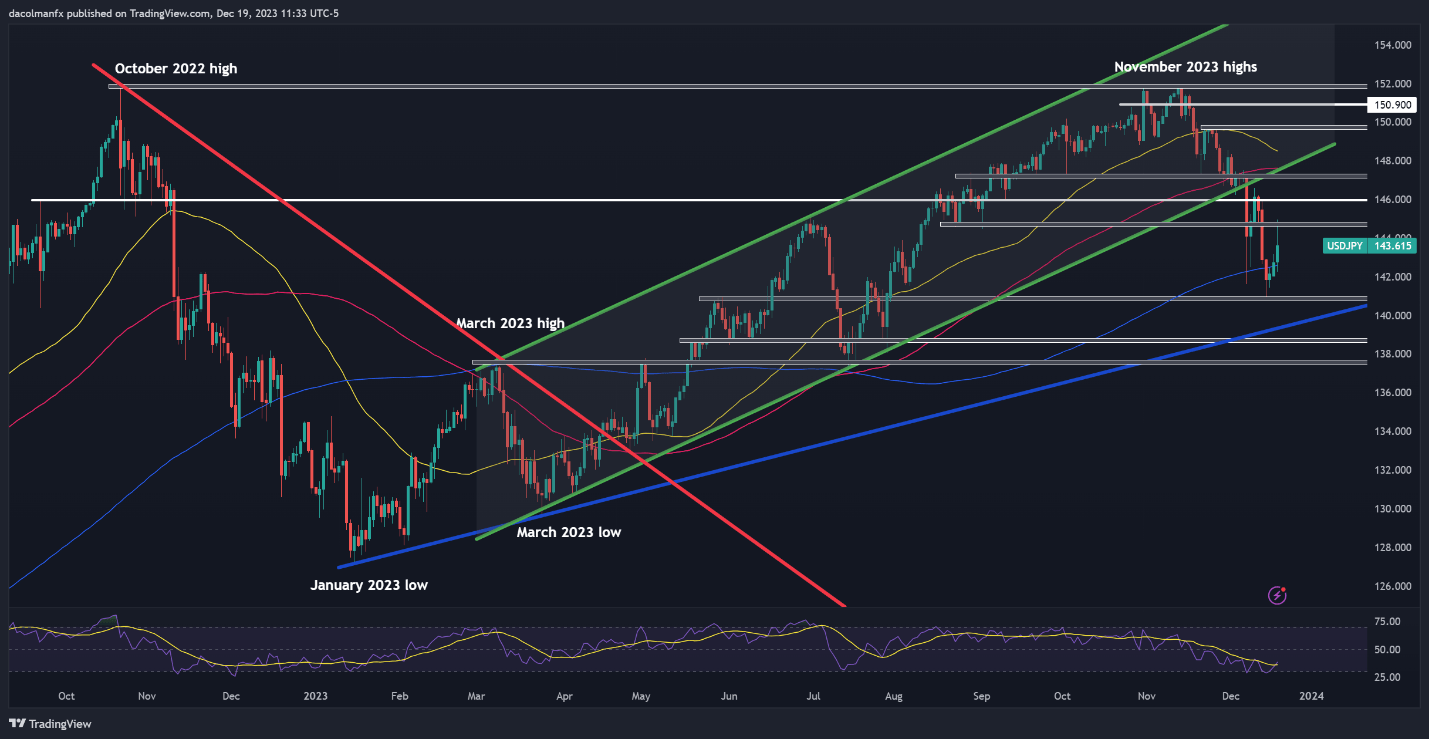
USD/JPY bucked the broader trend and rallied strongly, soaring more than 1% at one point after the Bank of Japan maintained its ultra-accommodative stance, indicating that it will be difficult to exit negative rates and that uncertainty about the outlook is extremely high. Despite this solid advance, the pair failed to push past resistance at 144.75, with sellers staunchly defending this barrier, as seen in the daily chart below.

Looking ahead, it is crucial to monitor price behavior around the 144.75 level, bearing in mind that a breakout could open the door for a move towards 146.00, followed by 147.30. Conversely, a firm rejection from 144.75 may trigger a retracement towards the 200-day simple moving average. On continued weakness, a retest of the December swing lows should not be dismissed.

USD/JPY TECHNICAL CHART

A screenshot of a graph  Description automatically generated

GBP/USD TECHNICAL ANALYSIS

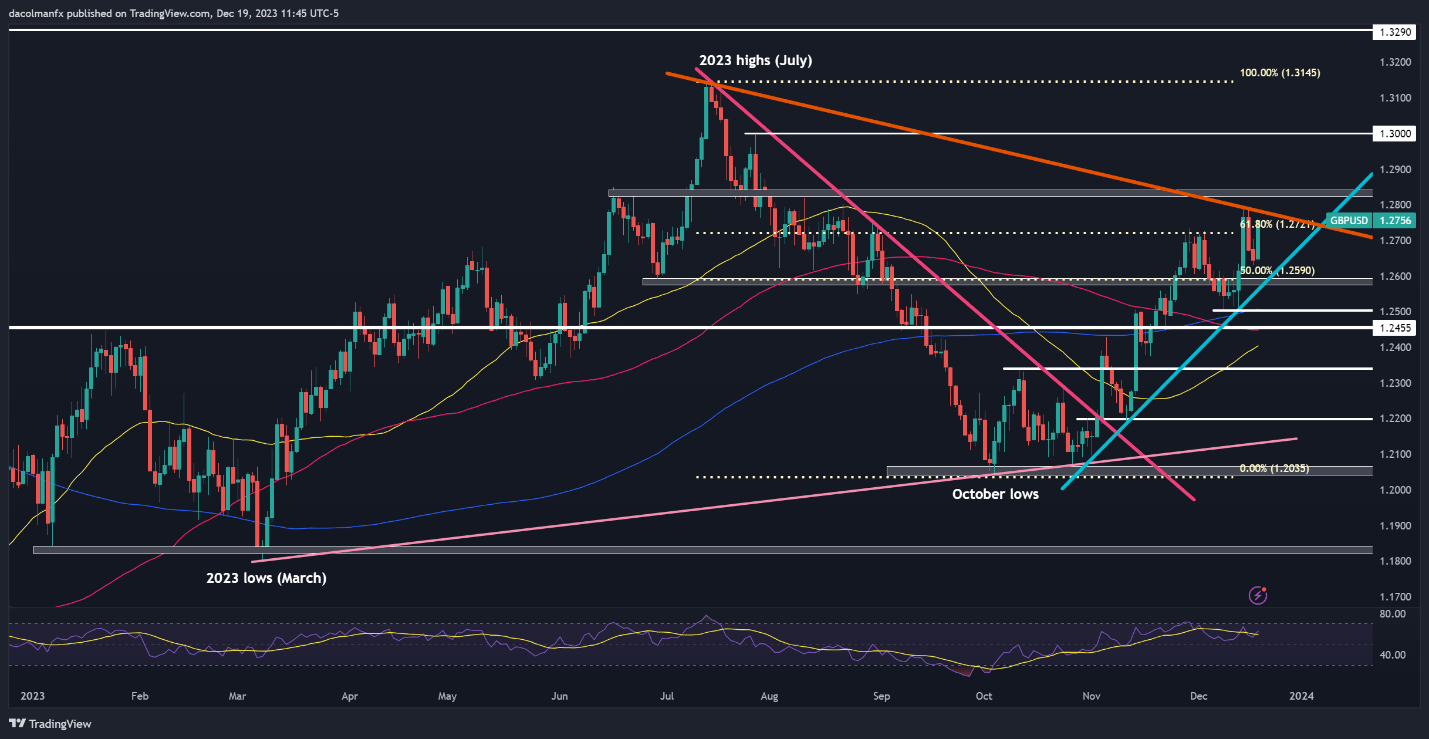
GBP/USD accelerated higher on Tuesday, breaching a key Fibonacci level at 1.2720 and pushing towards trendline resistance at 1.2780. This technical barrier must hold at all costs, failure to do so could propel prices above the 1.2800 handle. Should strength persist, the bulls may set their sights on the psychological 1.3000 threshold.

On the other hand, if sellers regain the upper hand and spark a bearish reversal, dynamic support is located at 1.2590, which corresponds to a short-term rising trendline extended off the November lows. This trendline should provide stability on a pullback, but in the event of a breakdown, a decline toward the 200-day simple moving average would emerge as the baseline scenario.

GBP/USD TECHNICAL CHART

A screen shot of a graph  Description automatically generated


Gold Price Forecast: Bulls Seize Control on Growing Safe Haven Appeal, $2050 Up Next

Gold Price Forecast: Bulls Seize Control on Growing Safe Haven Appeal, $2050 Up Next

SAFE HAVEN APPEAL AND US DOLLAR WEAKNESS

Geopolitical tensions have become a key driver this week following developments in the Middle East. The Red Sea has become breeding ground of uncertainty, and this seems as if it is only going to intensify. This leaves Gold in the driver’s seat with more gains in store if no solution is found to the ongoing strife and tension in the Middle East.

The renewed US Dollar weakness has also assisted Gold hold the high ground and continue its advance. Federal Reserve policymakers have this week struck a dovish tone with most speaking about the amount of rate cuts needed in 2024 with very little push back besides the odd comment about monitoring data moving forward. The only push back in terms of comments came from Policymaker Barkin saying that he thinks inflation is more stubborn than the average Fed official.

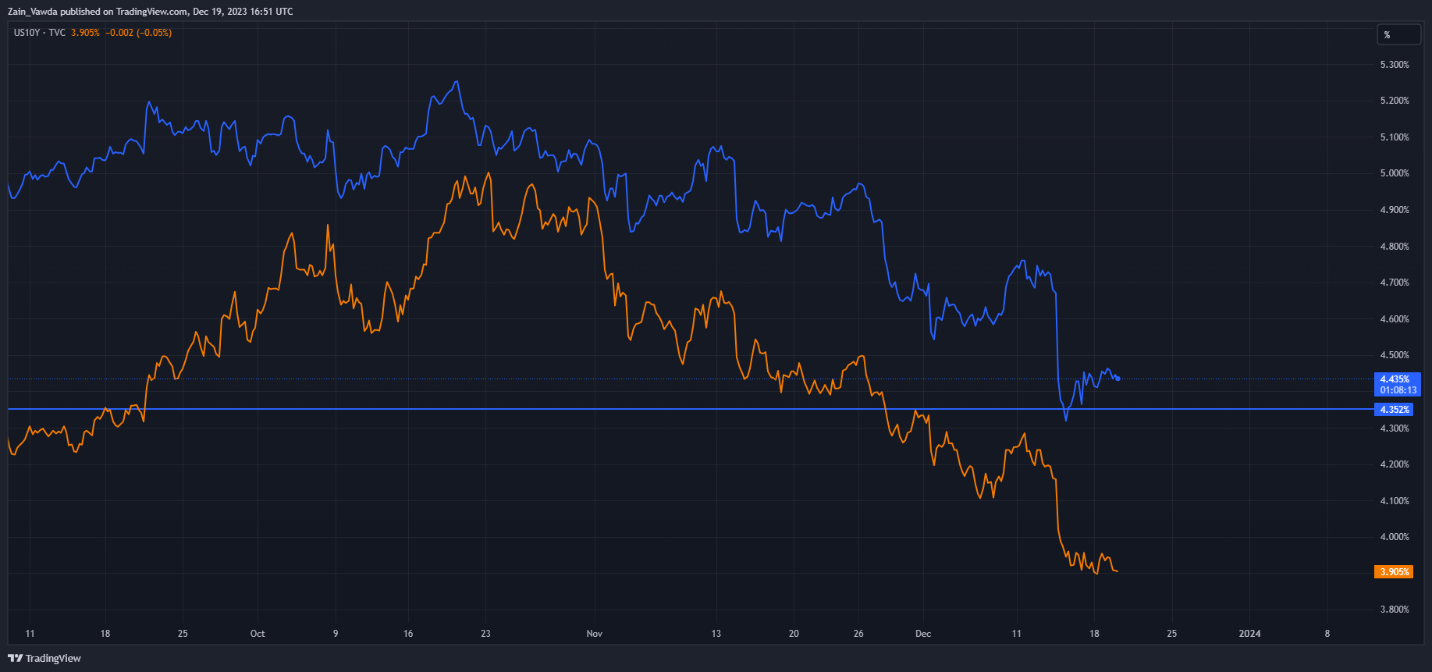
US Treasury Yields also continued their struggles today with both the 2Y and 10Y yield which is also benefitting Gold.

US2Y and 10Y Daily Chart

image1.png

US DATA AHEAD

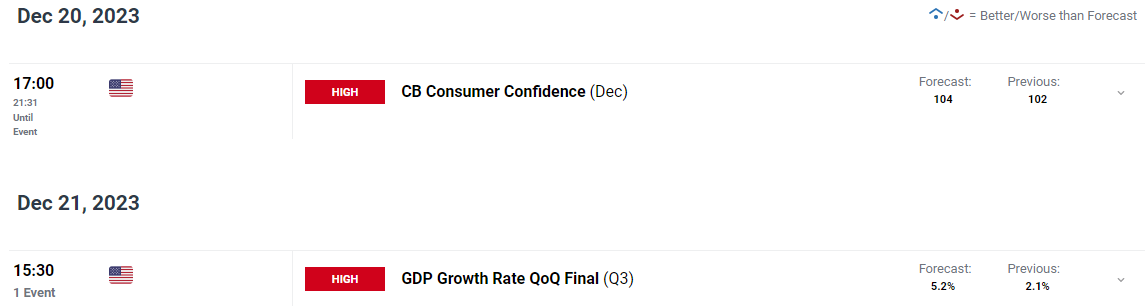
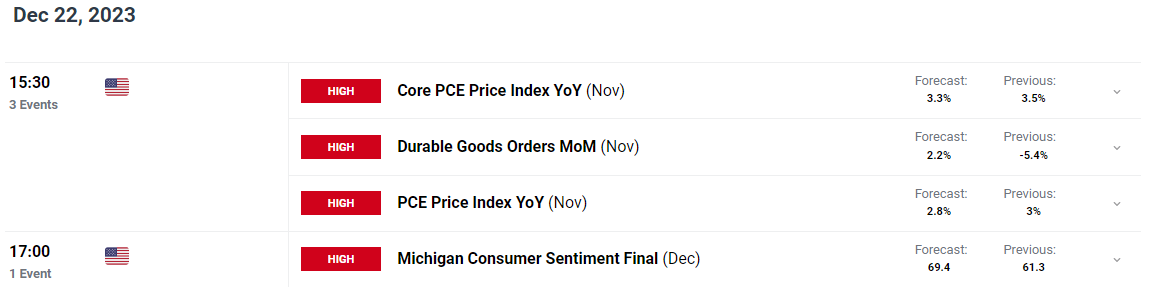
US data lies ahead with a key print being the US PCE data which is due on Friday. This may have a significant impact on US rate expectations before the year is out while we also have the final Q3 GDP number.

There is other “high impact” US Data due with CB consumer confidence and the final Michigan Consumer Sentiment number which should not have a material impact but rather short-term moves that could be erased toward the end of the trading session.

TECHNICAL OUTLOOK

GOLD

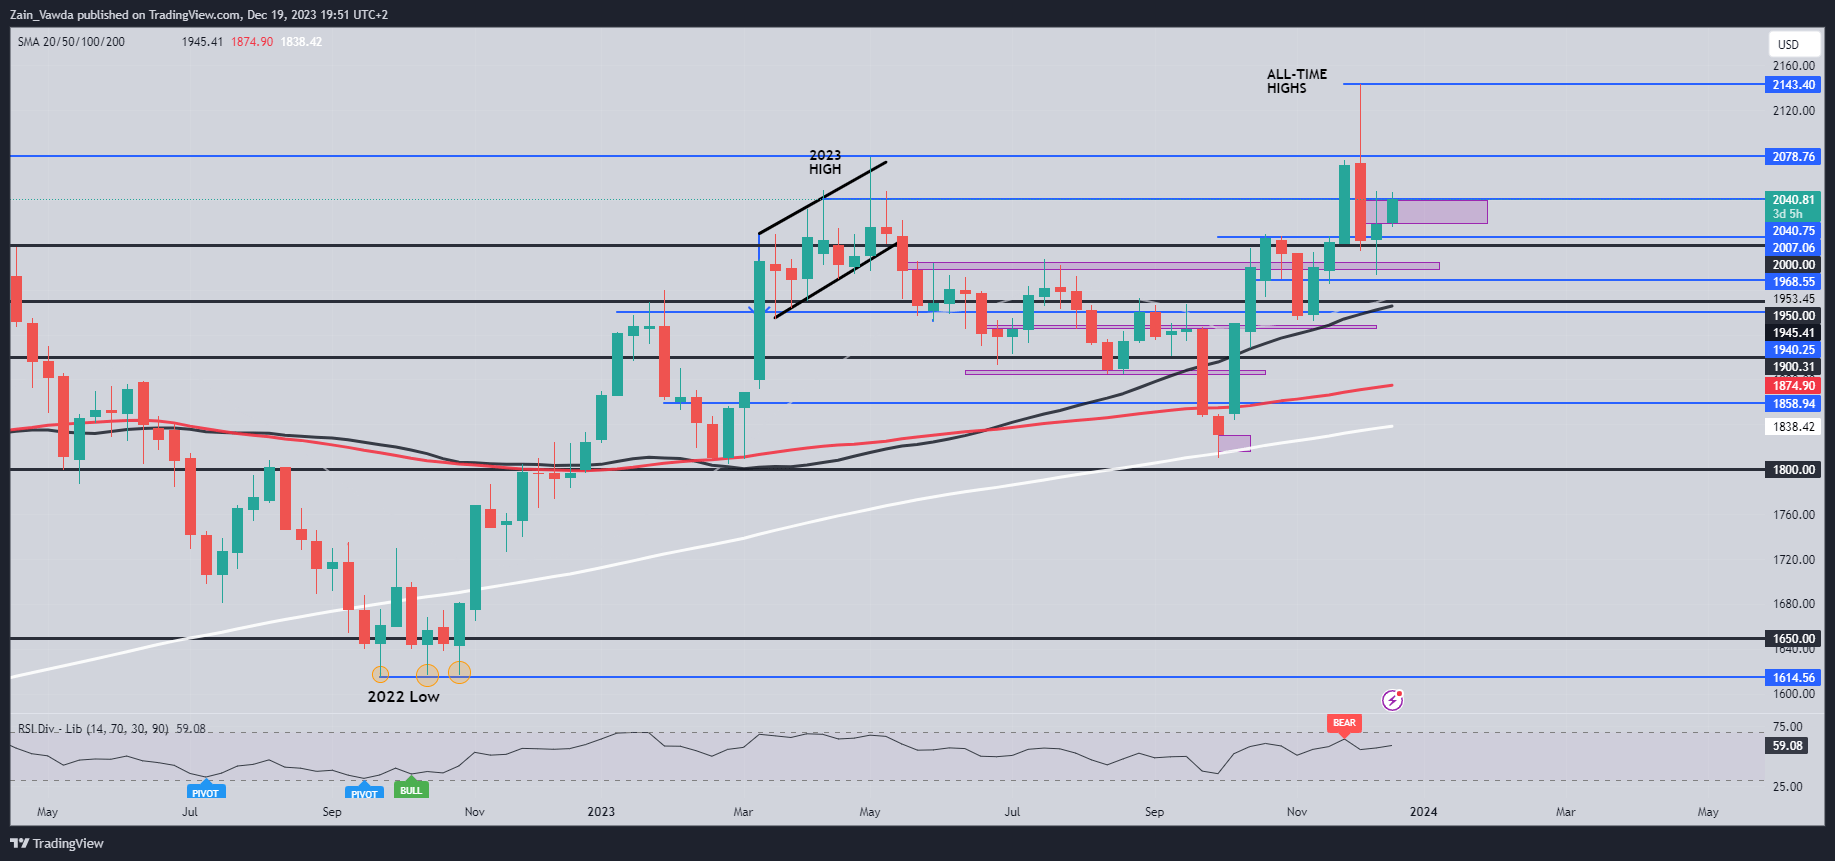
Form a technical perspective, Gold is interesting following the recent selloff which stopped last week as Gold printed an indecisive candle close. This should have given us a sign that we may get further upside this week which has come to fruition but further upside in my opinion appears limited.

As things stand a daily candle close above the $2040 mark this could facilitate a run toward resistance at the $2050 mark and beyond with the fundamental picture supporting this narrative. However, I have a feeling that a retracement may come into play soon with a host of resistance area between the $2050 and $2078 handles which may prove to be a hurdle to far.

Key Levels to Keep an Eye On:

Resistance levels:

  • 2047.00
  • 2058.00
  • 2078.00

Support levels:

  • 2030.00
  • 2012.00
  • 2000.00

Gold (XAU/USD) Daily Chart – December 19, 2023

IG CLIENT SENTIMENT

Taking a quick look at the IG Client Sentiment, Retail Traders are Overwhelmingly Long on GOLD with 60% of retail traders holding Long positions. Given the Contrarian View to Crowd Sentiment Adopted Here at DailyFX, is this a sign that Gold may struggle to put in more gains going forward.

GBP Breaking News: CPI Miss Aligns UK With Other Economies

GBP Breaking News: CPI Miss Aligns UK With Other Economies

GBPUSD FUNDAMENTAL BACKDROP

The British pound fell sharply this morning after the UK CPI report showed a significant decline in inflationary pressures on both headline and core metrics respectively (see economic calendar below). The impact of restrictive monetary policy measures is now showing as consumers are reluctant to spend thus decreasing demand for goods and services. Retail sales figures confirm this and should this trend continue, pound upside may be limited.

GBP/USD ECONOMIC CALENDAR (GMT +02:00)

image1.png

Headline inflation is now comparable with levels last seen in September 2021 and has pushed back against recent messaging that UK inflation is more willful than that of its developed counterparts including the euro area and US. According to the Office for National Statistics report, the largest downward contributions stemmed from transport, recreation and culture, and food and non-alcoholic beverages. The UK’s Chancellor Hunt went on to comment that “there is still further to go on inflation, it never declines in a straight line.” The comment was made most likely in an attempt to limit market reaction although many will dismiss his statement and focus on the actual data.

If we turn to markets expectations for Bank of England (BoE) rate path, the dovish repricing has been notable with cumulative interest rate cuts anticipated around 116bps by December 2024. The first cut could take place as soon as May 2024 with the possibility of a February cut very much on the cards should this disinflationary trend continue.

BANK OF ENGLAND INTEREST RATE PROBABILITIES

image2.png

TECHNICAL ANALYSIS

GBP/USD DAILY CHART

image3.png

Daily GBP/USD price action has been threatening bearish/negative divergence as the Relative Strength Index (RSI) prints lower highs. Cable bears may look to retest the 1.2500 psychological handle/200-day moving average (blue) once more considering recent news.

Key resistance levels:

  • 1.2900
  • 1.2848
  • 1.2746

Key support levels:

  • 1.2500/200-day MA
  • 1.2400/50-day MA
Top 10 Candlestick Patterns To Trade the Markets

Top 10 Candlestick Patterns To Trade the Markets

What are candlestick patterns?

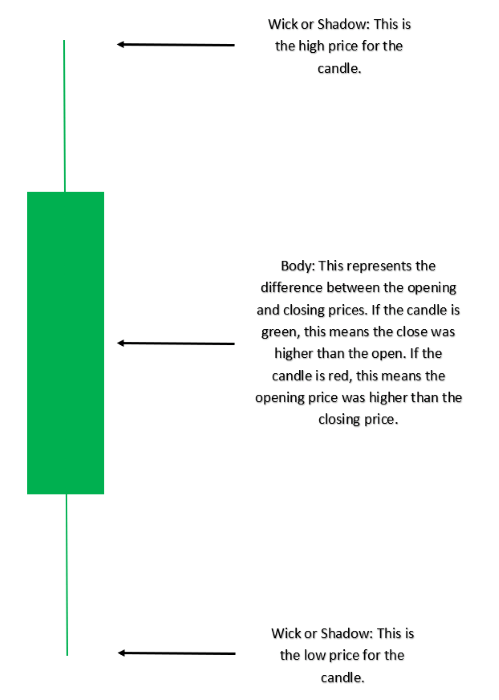
A candlestick is a single bar which represents the price movement of a particular asset for a specific time period. The information it displays includes the open, high, low and close for that time period.

candlestick pattern

Candlestick patterns take into account one or more candlesticks to assist technical traders in developing inferences about future movements and price patterns of the underlying asset. These are displayed graphically on a chart, which is utilized for market analysis. Our guide to reading candlestick charts is a great place to start to learn how to interpret candlesticks for trading.

Candlestick Patterns can be Bullish or Bearish

In order to recognize and apply the most commonly used candlestick patterns to a trading strategy, traders need to understand how the inclination of these patterns can affect the market direction (trend). The tables below summarize the two main categories of price movement that candlesticks can indicate. Many of these patterns are featured in our top 10 list below.

Bullish Candlestick Patterns:

Candlestick Pattern Direction
Morning Star Bullish (Reversal)
Bullish Engulfing Bullish (Reversal)
Doji Bullish/Bearish (Indecision)
Hammer Bullish (Reversal)
Bullish Harami Bullish (Reversal)
Piercing Pattern Bullish (Reversal)
Inside Bars Bullish (Continuation)
Long Wicks Bullish/Bearish (Reversal)

Bearish Candlestick Patterns:

Candlestick Pattern Direction
Evening Star Bearish (Reversal)
Bearish Engulfing Bearish (Reversal)
Doji Bearish/Bullish (Indecision)
Bearish Harami Bearish (Reversal)
Dark Cloud Cover Bearish (Reversal)
Inside Bars Bearish/Bullish (Continuation)
Long Wicks Bearish/Bullish (Reversal)
Shooting Star Bearish (Reversal)

Top 10 Candlestick Patterns Traders Should Know

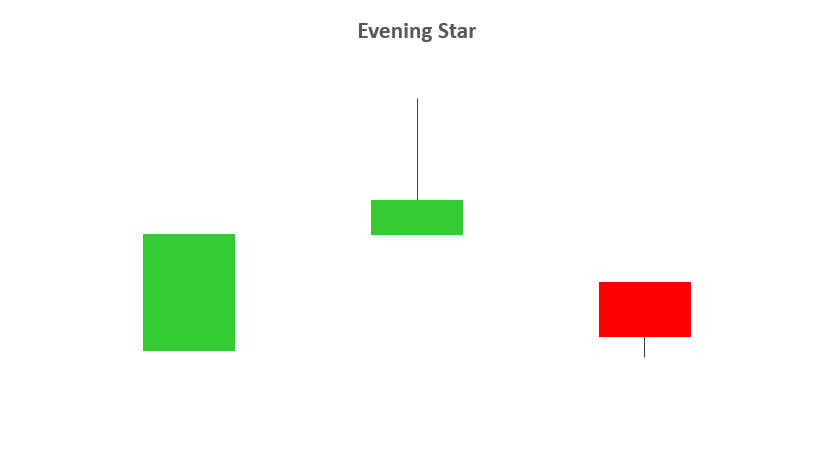
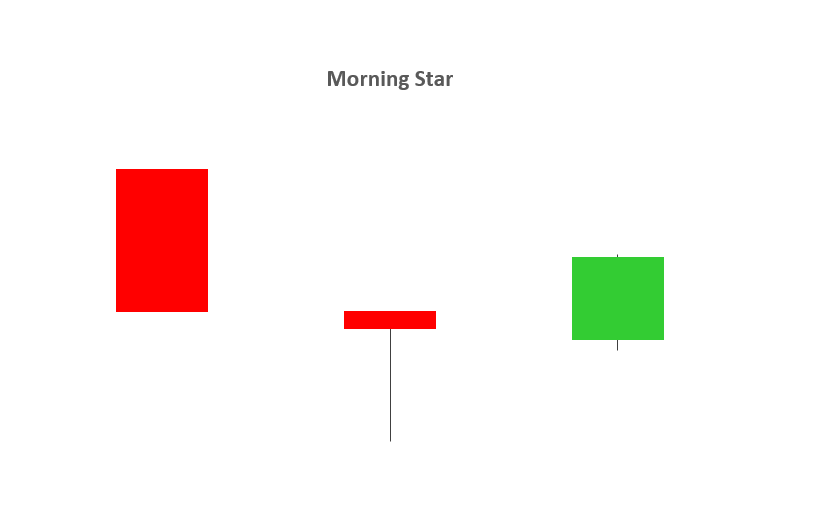
1 – EVENING STAR AND MORNING STAR

  • The evening and morning star candlestick patterns occur at the end of upwards/downward trends respectively and tend to indicate reversal patterns.
  • The names come from the star shaped formation of the arrangement.
  • As you can see from the image below, the first candlestick is in the direction of the trend, followed by a bullish or bearish candle with a small body. The third candlestick is seen in the direction of the reversal, ideally closing passed the halfway point of the first candlestick.
  • Trading this candlestick pattern will require a confirmation candle in the direction of the respective reversal – for example, traders will look for a bearish candle after the evening star.

evening star candlestickmorning star candlestick

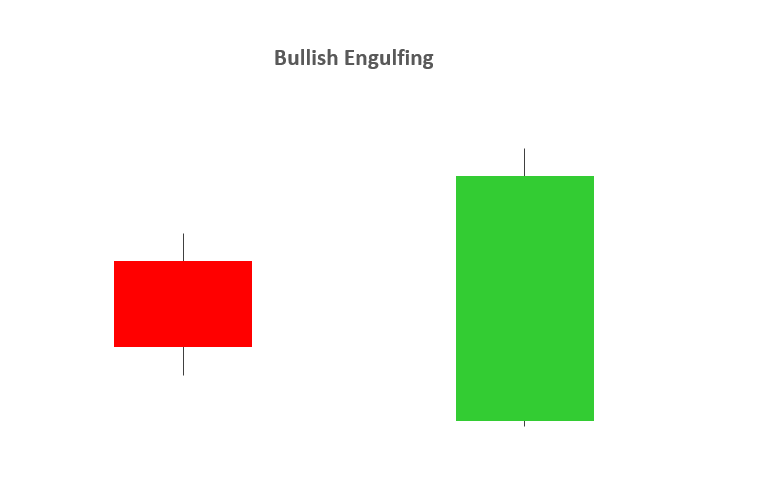
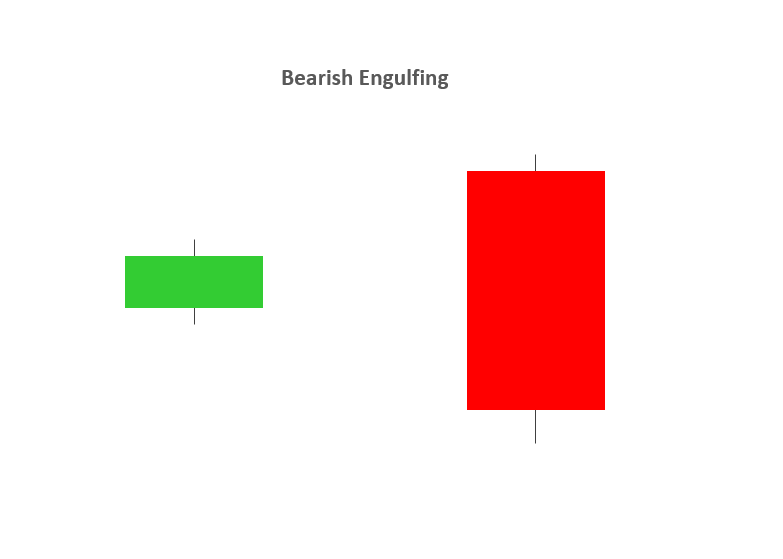
2 – BULLISH & BEARISH ENGULFING

  • A bullish or bearish engulfing candlestick pattern may indicate reversal patterns.
  • A bullish engulfing candlestick formation shows bulls outweigh bears. As the pattern below shows, the green body (bulls) covers completely the first candlestick (bears).
  • A bearish engulfing candlestick pattern is small green (or bullish) candle followed by a larger red (bearish) candle immersing the small green candle.

bullish engulfing candlestickbearish engulfing candlestick

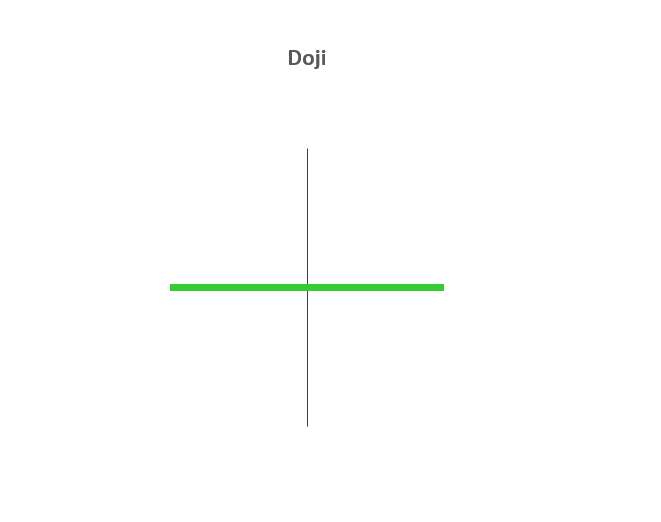
3 – DOJI

  • The Doji candlestick chart pattern is associated with indecision in the market of the underlying asset. This could mean potential reversal of the current trend or consolidation.
  • This pattern can occur at the top of an uptrend, bottom of a downtrend, or in the middle of a trend.
  • The candlestick itself has an extremely small body centered between a long upper and lower wick.

doji candlestick

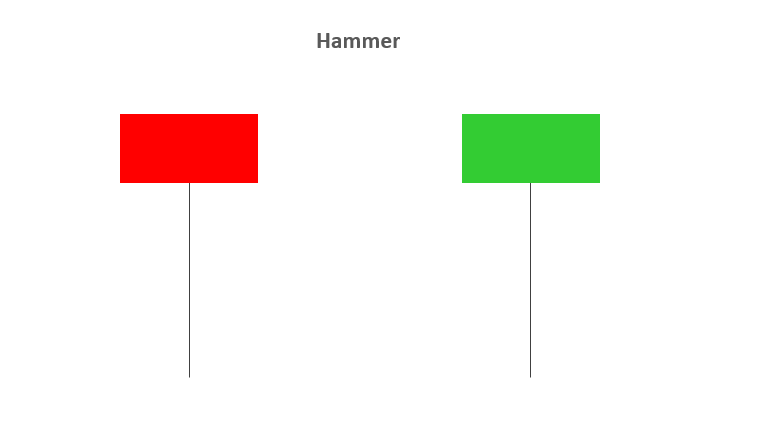
4 – HAMMER

  • The Hammer candle is viewed as a bullish reversal usually occurring at the bottom of a downward trend.
  • This candle formation includes a small body whereby the open, high, low and close are roughly the same. There is a long lower wick beneath the body which should be more than twice the length of the candle body. The body may be bullish or bearish, however bullish is considered more favorable.

hammer candlestick

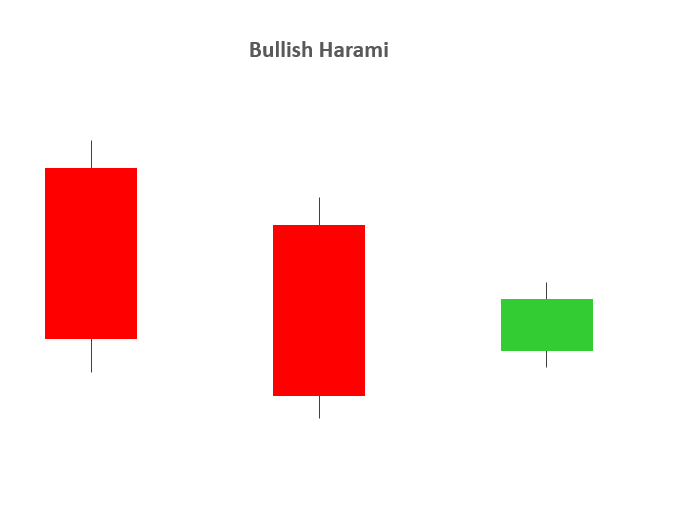
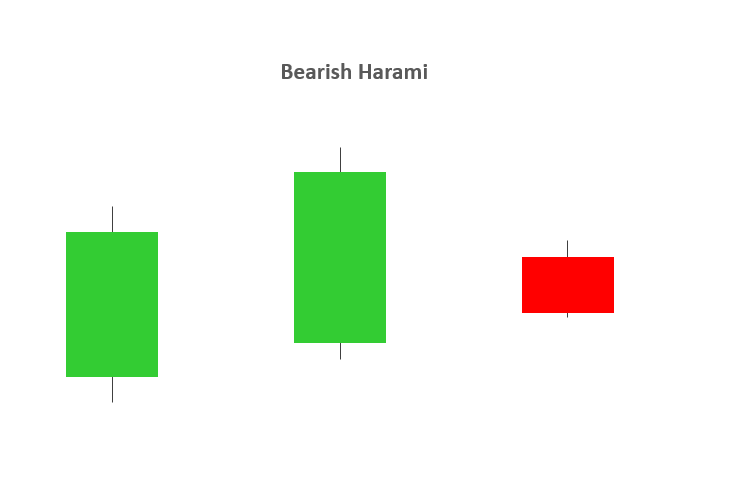
5 – BULLISH & BEARISH HARAMI

  • A Bullish or Bearish Harami may indicate reversal patterns.
  • The word “Harami” means “pregnant” in Japanese, and the name has been given to this candlestick pattern because it resembles a pregnant woman. The second candle in the pattern must be contained within the body of the first candle as seen in the images below. This holds true for both bullish and bearish Harami’s.
  • A downtrend precedes a bullish Harami and an uptrend precedes that of a bearish Harami.

bullish harami candlestickbearish harami candlestick

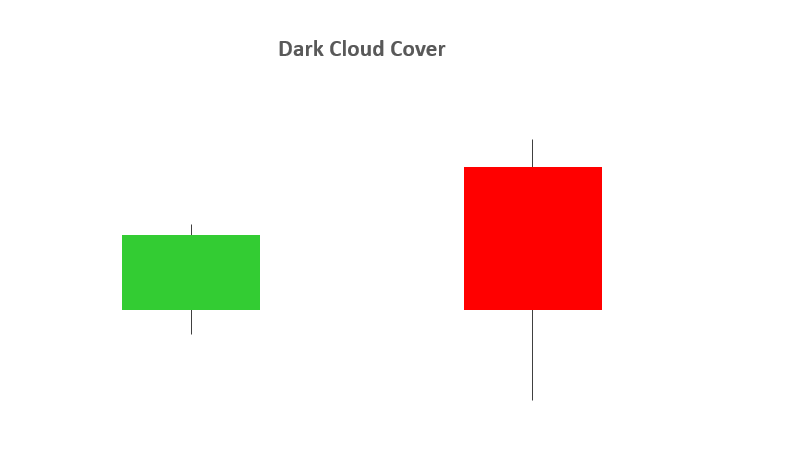
6 – DARK CLOUD COVER

  • The Dark Cloud Cover pattern is seen as a bearish reversal pattern.
  • This candlestick pattern must occur during an uptrend. As seen in the image below, the bullish candle is followed by a bearish candle.
  • This bearish candle must confirm certain criteria to validate the Dark Cloud Cover pattern:

1. The opening price must by higher than the previous days close.

2. The closing price must close below the midpoint of the previous bullish candle.

  • The Dark Cloud Cover pattern looks similar to that of the Bearish Engulfing pattern. The difference between the two relates to the second candlestick. Bearish Engulfing pattern has the second candlestick opening above the close of the first, whilst the Dark Cloud Cover opens above the high of the first candle and closes below the midpoint of the first candlestick body.

dark cloud cover candlestick

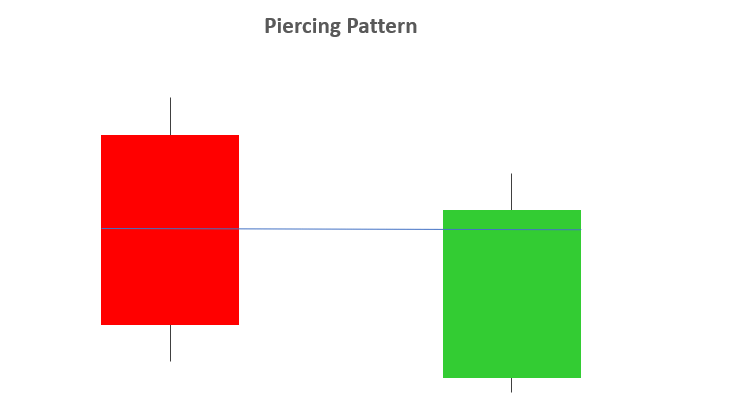
7 – PIERCING PATTERN

  • The Piercing Pattern is viewed as a bullish candlestick reversal pattern, at the end of a downtrend or during a pullback within an uptrend, or at the support.
  • There are two components of a Piercing Pattern formation:

1. Bearish candle

2. Bullish candle

  • A Piercing Pattern occurs when a bullish candle (second) closes above the middle of bearish candle (first) in a downward trending market.
  • The open price of the second candle should gap down at market open and ensue by closing above the mid-point of the previous candle as indicated below.
  • Both the Piercing and Dark Cloud Cover patterns have similar characteristics. The difference is that the piercing line is a bullish reversal pattern as mentioned above, whilst the Dark Cloud Cover pattern is a bearish reversal pattern.

piercing pattern

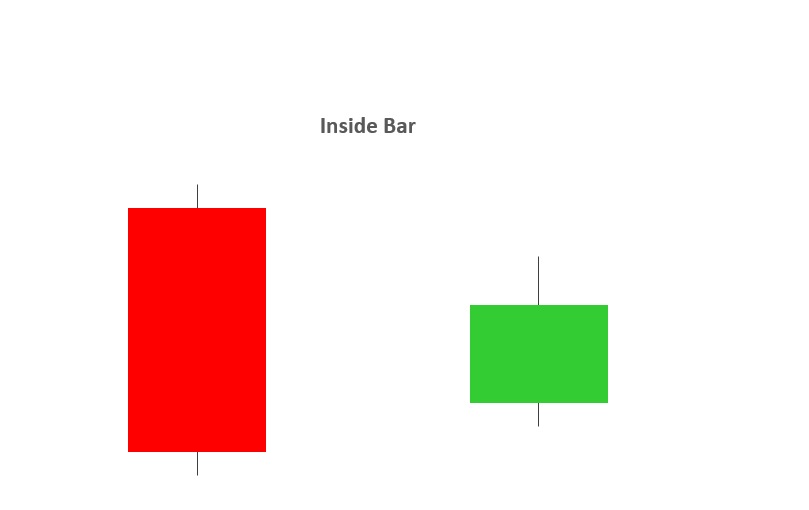
8 – INSIDE BARS

  • The Inside Bar pattern is utilized in trending markets whereby the high and low of the Inside bar is within the parameters of the previous candle or “mother bar”.
  • Inside Bars are traded within the direction of the trend – if the market is in a downtrend, the trader would look to continue with a short position with the presence of an Inside Bar. The same principal is applied in an uptrend.
  • Trading in the direction of the trend is not always a given as key levels of support/resistance can indicate a reversal. Classically, the entry points for traders is positioned above or below the high or low of the mother bar depending on the direction of the trade.
  • An inside bar is also similar to a bullish or a bearish harami candlestick pattern. The main difference being that with an inside bar, the highs and lows are considered while the real body is ignored.

inside bar candlestick

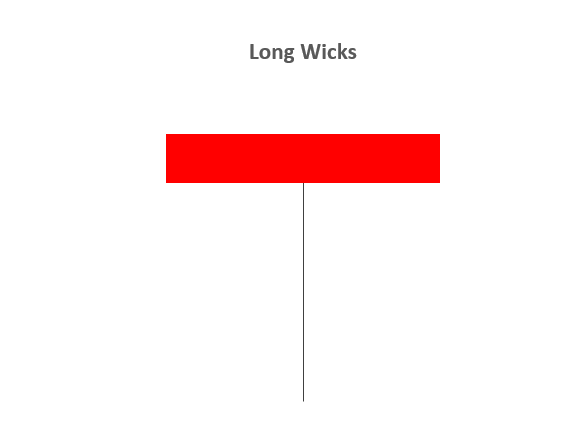
9 – LONG WICKS

  • Long Wicks candlestick patterns often indicate a reversal in the trend.
  • Long Wicks occur when prices are tested and then rejected. The wick indicates rejected prices.
  • Identifying the trend is important to interpret the significance of the Long Wick.
  • Identifying key levels and price action is often used in conjunction with Long Wick patterns.

long wicks candlestick

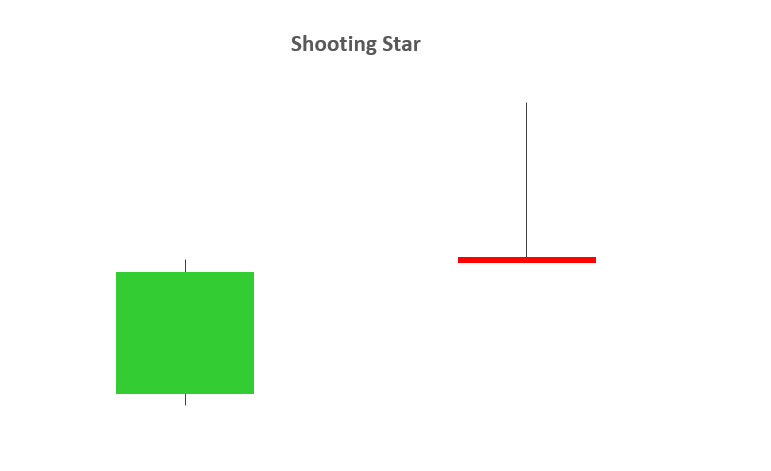
10 – SHOOTING STAR

  • A Shooting Star is a bearish candle with a long upper wick, little or no lower wick and a small real body near the day’s low. It comes after an uptrend, and potentially indicates a trend reversal to the downside.
  • The distance between the high and opening price of the candle must be more than twice as large as the Shooting Star’s body. The distance between the lowest price for the day and the closing price must be very small or nonexistent.

shooting star candlestick

How to Trade with the Relative Strength Index (RSI)

How to Trade with the Relative Strength Index (RSI)

What Goes into RSI?

The Relative Strength Index is going to measure price changes over the past X periods (with X being the input that you can enter into the indicator.)

If you set RSI of 5 periods, it will measure the strength of this candles price movement against the previous 4 (for a total of the last 5 periods). If you use RSI at 55 periods, you will be measuring this candles strength or weakness to the last 54 periods. The more periods you use, the ‘slower’ the indicator will appear to react to recent price changes.

The picture below will show 2 RSI indicators: The top RSI is set with 9 periods, and the bottom at 25 periods. Notice how much more erratic the 9 period RSI is compared to the 25 period version. This is because the indicator is changing so much faster due to the fewer inputs used to calculate its value.

RSI

RSI of 25 periods (on bottom) and RSI of 9 periods (above)

What can RSI tell us?

As an oscillator, RSI will read a value between one and 100, and will tell us how strong or weak price has been over the observed number of periods. If RSI is reading below 30, traders will often construe that to mean that price action has been weak, and the asset being charted may be oversold. If RSI is reading above 70, then price action has been strong, and price may potentially be overbought.

I say ‘may’ here as an important qualifier – because a market can get even more overbought or oversold. A market going oversold does not assure of strength nor does an overbought RSI reading denote certain losses.

RSI Oversold, Overbought Readings

Basic Usage of RSI

Because the indicator can show potentially over-bought or over-sold conditions, traders will often take this a step further to look for potential price reversals.

The most basic usage of RSI is looking to buy when price crosses up and over the 30 level, with the thought that price may be moving out of oversold territory with buying strength as price was previously taken too low. The picture below will illustrate further:

USD/CAD

RSI Potential to Identify Ranges Across Time Frames

The RSI indicator can be applied on numerous time frames. Like any other indicator built off of past pricing information, it certainly will not be predictive. But, when matched with the appropriate market environment, RSI can be a helpful tool for working with the range-bound market condition on multiple time-frames.

On the below hourly chart of USD/CAD, I’ve identified a number of both long and short signals that appeared while the pair was in the midst of a range-bound environment.

USD/CAD

Pit-falls of Trading with RSI

Inherently, the Relative Strength Index presents a flaw to traders.

RSI, by its nature, looks for reversals in price. By buying when RSI crosses above 30 or ‘over-sold,’ traders are buying a market that has already been going down; inherently a counter-trend trade. And if a trader is selling as RSI crosses below 70, the market has been going up enough to be ‘over-bought’ and the trader is initiating a sell position.

If the market is ranging, this can be a desirable trait in an indicator, as traders can often look to initiate entries in a range with RSI. However, if the market is ranging, the results can be unfavorable as price continues moving in the trending direction, leaving traders that had opened trades in the opposite direction in a compromised position. The picture below will illustrate this situation further on the right side of the chart:

GBP/USD Daily Chart

As you can see on the above graphic, there were four sell signals via RSI on the left side of the chart and a fifth towards the middle.

But, on the right side of the chart, there were three bullish signals in a hard down-trending market, none of which would’ve led into a bullish move in the pair.

How to Use Price Action to Trade New Trends

How to Use Price Action to Trade New Trends

Don’t Chase the Breakout

The period that is often most dangerous to trade a new move is also when it happens to be the most attractive, and that’s when prices are breaking out of previous support or resistance. Breakouts can be difficult to trade, even for experienced traders, because by nature it’s the process of something ‘new’ happening and thereby there’s no recent data or observations from which we might be able to derive strategy.

Chasing breakouts, or buying after price has already run through resistance or selling after price has dropped through support, can often lead to challenging trades. Even if you’re right on the direction, you’ll often have to let the position retrace against you before the ‘trend-side’ move continues. So, rather than chasing a new breakout – wait. Let price action run-higher or lower, and chalk away the potential for a trend-side entry in the not-too-distant future.

Use the breakout merely as a signal: The fact that buyers were able to power-thru resistance can be a positive indication of further top-side potential. But rarely is a market one-sided; after that new-high comes-in, we’ll often see traders taking profit; and even some trying to fade the move. Combine this with the fact that buyer demand is likely diminished by the fact that prices are now-higher; and we have a recipe for a pullback. This is the exact time that you do not want to be chasing a move higher.

Chart prepared by James Stanley

Wait for Support to Show-Up Around Prior Resistance (for up-trends)

Watching a fresh breakout can be trying for a trader’s patience, and for the new trader that can be a challenging exercise as their only real option whilst watching a breakout take place is to either chase it, or fade it (go short after a bullish breakout). Given that a breakout is, by definition, a ‘new’ observation of higher or lower prices, this is an inopportune time to open positions.

Instead, that prior level of resistance that had previously capped price action can now be re-assigned as potential support. Traders can let the breakout develop, and let the market set a new short-term ‘higher-high’. After that new high is set, traders can then wait for the next ‘higher-low’, and this will often show-up at or around a prior resistance level.

We discussed this concept in the article, A Simple but Effective Price Action Tell , and on the chart below, we can see multiple iterations of this taking place in the recent move in EUR/USD.

Chart prepared by James Stanley

Use the Shorter Time Frame to Confirm Support & Early Stage of Directional Move

Once the breakout has been found, and once the pullback has gotten under-way, traders can begin to plot their trend-side entries. This is where the greater detail and granularity of that shorter-term chart can be helpful from the additional perspective that’s provided.

To attempt at timing the entry, the trader can wait for the pullback to begin to slow. So if we’re looking at a bullish move, we’d want to have already seen the breakout produce the higher-high, followed by a pullback bringing price closer to prior resistance; at which point we can look for support to begin to show on the shorter time frame.

If buyers are responding to falling prices, wicks will show-up on the under-side of the shorter-term candles as demand begins to out-strip supply. And as buyers begin to take-over, prices will begin to edge higher on that shorter-term chart as sellers succumb to even greater demand. And it’s as this is taking place that traders want to investigate the top-side entry, because the point of support that was just established, as highlighted by those under-side wicks, is where the trader can look to place their stop. For a more in-depth explanation behind using price action to plot supply and demand, please check out our article, Using Support and Resistance to Trade Supply and Demand .


Technical Indicators Defined and Explained

Technical Indicators Defined and Explained

Technical indicators are chart analysis tools that can help traders better understand and act on price movement. There is a huge range of technical analysis tools available that analyze trends, provide price averages, measure volatility and more.

In this piece, we explore the types of technical indicators available, from RSI to Bollinger Bands®, explain how to respond to technical signals, and reveal the top tips to making the tools an effective part of your trading journey.

Types of Technical Indicators

There are four main types of technical indicators: Trend Following, Oscillators, Volatility and Support/Resistance. They are grouped based on their function, which ranges from revealing the average price of a currency pair over time, to providing a clearer picture of support and resistance levels.

List of Technical Indicators

1. Trend Indicators

Trend following indicators were created to help traders trade currency pairs that are trending up or trending down. We have all heard the phrase ‘the trend is your friend’ – these indicators can help point out the direction of the trend and can tell us if a trend actually exists.

Moving Average Indicator

A Moving Average (MA) is a technical tool that averages a currency pair’s price over a period of time. The smoothing effect this has on the chart helps give a clearer indication on what direction the pair is moving – either up, down, or sideways. There are a variety of moving averages to choose from, with Simple Moving Averages and Exponential Moving Averages being the most popular.

Ichimoku Indicator

Ichimoku is a complicated looking trend assistant that is simpler than it appears. This Japanese indicator was created to be a standalone indicator that shows current trends, displays support/resistance levels, and indicates when a trend has likely reversed. For more, check out our Definitive Guide to Trading Trends with Ichimoku Cloud.

ADX Indictor

The Average Direction Index won’t tell you whether price is trending up or down, but it will tell you if price is trending or is ranging. This makes it the perfect filter for either a range or trend strategy by making sure you are trading based on current market conditions. For more, see our article How to Use ADX to Identify Forex Trends.

2. Oscillator Indicators

Oscillators give traders an idea of how momentum is developing on a specific currency pair. When price treks higher, oscillators will move higher. When price drops lower, oscillators will move lower. Whenever oscillators reach an extreme level, it might be time to look for price to turn back around to the mean.

However, just because an oscillator reaches ‘Overbought’ or ‘Oversold’ levels doesn’t mean we should try to call a top or a bottom. Oscillators can stay at extreme levels for a long time, so we need to wait for a valid sign before trading.

RSI Indicator

The Relative Strength Index is arguably the most popular oscillator to use. A big component of its formula is the ratio between the average gain and average loss over the last 14 periods. The RSI is bound between 0 – 100 and is considered overbought above 70 and oversold when below 30. Traders generally look to sell when 70 is crossed from above and look to buy when 30 is crossed from below. Click here to learn about A Better Way to Use RSI to Signal When to Take a Forex Trade.

Stochastics Indicator

Stochastics offer traders a different approach to calculate price oscillations by tracking how far the current price is from the lowest low of the last X number of periods. This distance is then divided by the difference between the high and low price during the same number of periods. The line created, %K, is then used to create a moving average, %D, that is placed directly on top of the %K. For more, check out our article How to Trade With Stochastic Oscillator.

CCI Indicator

The Commodity Channel Index is different than many oscillators in that there is no limit to how high or how low it can go. It uses 0 as a centerline with overbought and oversold levels starting at +100 and -100. Traders look to sell breaks below +100 and buy breaks above -100. To see some real examples of the CCI in action, take a look at how to Trade Forex with the CCI Indicator.

MACD Indicator

The Moving Average Convergence/Divergence tracks the difference between two EMA lines, the 12 EMA and 26 EMA. The difference between the two EMAs is then drawn on a sub-chart (called the MACD line) with a 9 EMA drawn directly on top of it (called the Signal line). Traders then look to buy when the MACD line crosses above the signal line and look to sell when the MACD line crosses below the signal line as seen here. There are also opportunities to trade divergence between the MACD and price.

3. Volatility Indicators

Volatility measures how large the upswings and downswings are for a particular currency pair. When a currency’s price fluctuates wildly up and down it is said to have high volatility. Whereas a currency pair that does not fluctuate as much is said to have low volatility. It’s important to note how volatile a currency pair is before opening a trade, so we can take that into consideration with picking our trade size and stop and limit levels. Read our article on the Top 10 Most Volatile Currency Pairs for more.

Bollinger Bands® Indicator

Bollinger Bands ® print three lines directly on top of the price chart. The middle ‘band’ is a 20-period simple moving average with an upper and low ‘band’ that are drawn two standard deviations above and below the 20 MA. This means the more volatile the pair is, the wider the outer bands will become, giving the Bollinger Bands® the ability to be used universally across currency pairs no matter how they behave.

Bollinger Bands® is a registered trademark of John Bollinger.

ATR Indicator

The Average True Range tells us the average distance between the high and low price over the last set number of bars (typically 14). This indicator is presented in pips where the higher the ATR gets, the more volatile the pair, and vice versa. This makes it a perfect tool to measure volatility. For more, see How to Use ATR in a Forex Strategy.

4. Support/Resistance Indicators

Support and resistance is key to technical analysis. The concept refers to the price levels on charts that form barriers to an asset price being pushed in a given direction. For more, see our article on Identifying Support and Resistance and make sure you consider the indicators below.

Pivot Points

Pivot Points are one of the most widely used in all markets including equities, commodities, and Forex. They are created using a formula composed of high, low and close prices for the previous period. Traders use these lines as potential support and resistance levels, levels that price might have a difficult time breaking through.

Donchian Channels

Price channels or Donchian Channels are lines above and below recent price action that show the high and low prices over an extended period of time. These lines can then act as support or resistance if price comes into contact with them again. For a deeper look at using this tool successfully, read Breakout Trades and the Power of Price Channels.

Technical Indicators: A Summary

Each of the technical indicators above can help you to advance your technical analysis and better understand price action, but it’s important to remember not to get bogged down and to choose only the indicators that work for you.

Overly complicating your approach with too many indicators can force traders to process too much information, resulting in ‘paralysis by analysis’. As a result, it’s best to keep it simple and only use a handful in accordance with the goals set out in your trading plan.

EUR/USD Forecast: Eurozone Inflation and the ECB to Impact Rate Path Bets

EUR/USD Forecast: Eurozone Inflation and the ECB to Impact Rate Path Bets

Monday Overview

The EUR/USD gained 0.27% on Monday. After a 0.89% slide on Friday, the EUR/USD ended the day at $1.09235. The EUR/USD fell to an early low of $1.08918 before reaching a high of $1.09312.

Eurozone Inflation and the ECB in Focus

On Tuesday, finalized November inflation figures for the Eurozone will garner investor interest. Upward revisions to preliminary inflation figures would support the ECB’s forward guidance on the rate path.

Trading Derivatives carries a high level of risk to your capital and you should only trade with money you can afford to lose. Trading Derivatives may not be suitable for all investors, so please ensure that you fully understand the risks involved, and seek independent advice if necessary. A Product Disclosure Statement (PDS) can be obtained either from this website or on request from our offices and should be considered before entering into a transaction with us. Raw Spread accounts offer spreads from 0.0 pips with a commission charge of USD $3.50 per 100k traded. Standard account offer spreads from 1 pips with no additional commission charges. Spreads on CFD indices start at 0.4 points. The information on this site is not directed at residents in any country or jurisdiction where such distribution or use would be contrary to local law or regulation.

A higher-for-longer interest rate trajectory would impact borrowing costs and disposable income. The net effect would be to dampen demand-driven inflationary pressures.

According to the preliminary report, the annual inflation rate softened from 2.9% to 2.4% in November.

Away from the numbers, investors must consider ECB commentary. ECB Executive Board members Andrea Enria and Frank Elderson are on the calendar to speak on Tuesday. Forward guidance supporting a higher-for-longer rate path would drive buyer demand for the EUR/USD.

US Housing Sector in Focus

On Tuesday, the US housing sector will be in focus for the second consecutive session. A larger-than-expected fall in building permits and housing starts could raise concerns about the housing market. Economists forecast building permits and housing starts to decline by 1.2% and 0.8%, respectively, in November.

While weak figures would raise red flags, investors must consider recent trends to gauge housing market conditions. Notably, a more dovish rate path could drive home buyer demand and support the US economy.

Economists consider housing sector data to be leading indicators. The US real estate sector contributes over 15% to the economy. Significantly, increased buying activity could fuel consumer spending. Upward trends in consumer spending could fuel demand-driven inflation, forcing the Fed to maintain a more hawkish rate path.

Beyond the numbers, investors must monitor Fed commentary. Comments aligned with Fed Vice Chair John Williams could impact the buyer appetite for the EUR/USD. On Friday, the Fed Vice Chair warned that it was too soon to call victory on the fight against inflation and Fed rate cuts.

Short-Term Forecast:

Near-term, EUR/USD trends will hinge on inflation and central bank forward guidance. Sticky US inflation and hawkish Fed chatter could force the markets to reduce bets on a Q1 2024 Fed rate cut. A robust US economy and sticky inflation could suggest a EUR/USD pullback from current levels.

EUR/USD Price Action

Daily Chart

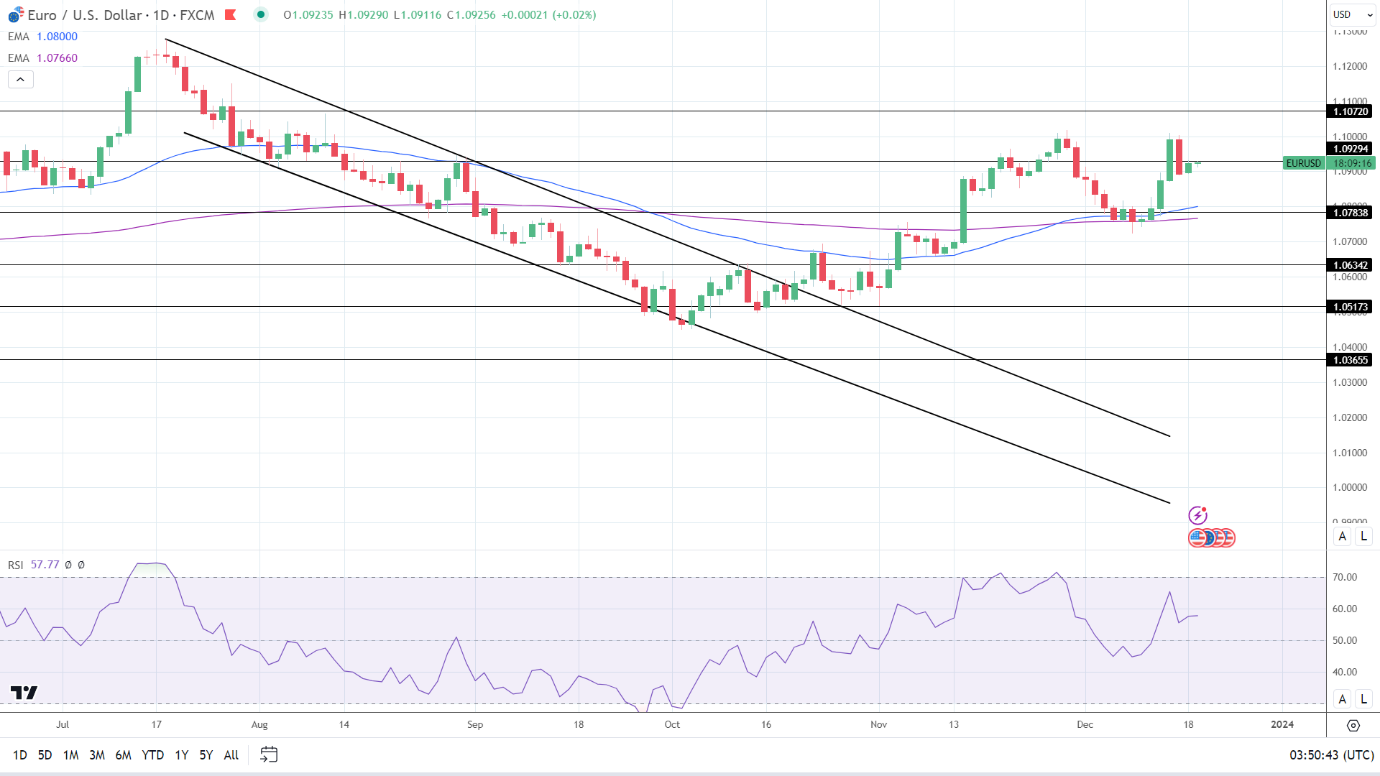
The EUR/USD held above the 50-day and 200-day EMAs, sending bullish price signals.

A EUR/USD breakout from the $1.09294 resistance level would bring the $1.10720 resistance level into play.

Eurozone inflation, ECB commentary, the US housing market, and the Fed need consideration.

However, a EUR/USD fall through the $1.08500 handle would support a drop to the 50-day EMA and the $1.07838 support level.

The 14-period Daily RSI, 57.77, suggests a EUR/USD return to the $1.10 handle before entering overbought territory.

EUR/USD Daily Chart sends bullish price signals.
EURUSD 191223 Daily Chart

4-Hour Chart

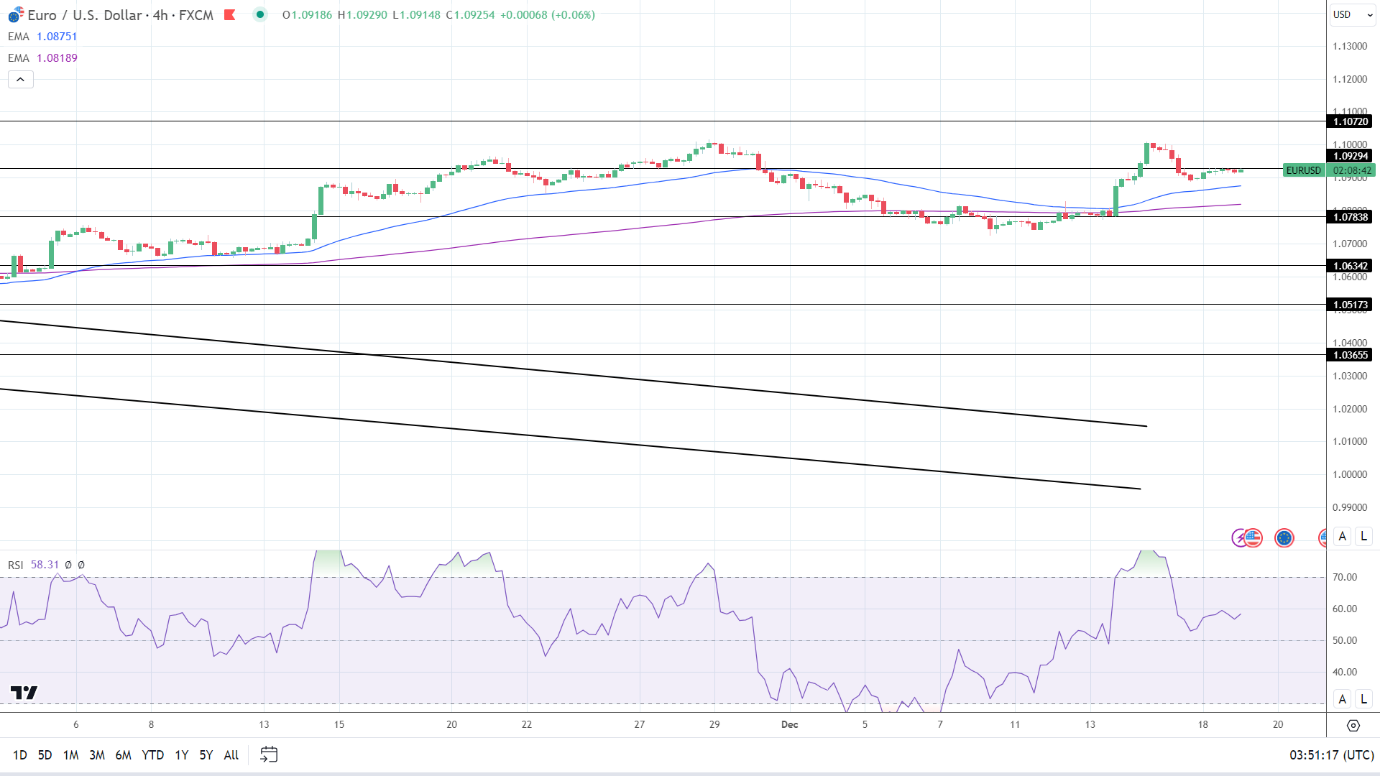
The EUR/USD sat above the 50-day and 200-day EMAs, affirming bullish price signals.

A EUR/USD break above the $1.09294 resistance level would support a move toward the $1.10720 resistance level.

However, a drop below the 50-day EMA would bring the 200-day EMA and the $1.07838 support level into play.

The 14-period RSI on the 4-hour chart, 58.31, indicates a EUR/USD move to the $1.10 handle before entering overbought territory.

4-Hourly Chart affirms bullish price signals.
EURUSD 191223 4 Hourly Chart
DAX Index: Eurozone Inflation and ECB Commentary in Focus

DAX Index: Eurozone Inflation and ECB Commentary in Focus

The DAX ended the Monday session down 0.60%. Following a 0.79-point loss on Friday, the DAX ended the Monday session at 16,651. Significantly, the DAX extended its losing streak to five sessions.

German Business Sentiment Wanes, Pressuring the DAX

On Monday, German business sentiment figures for December surprised the markets. The Ifo Business Climate Index unexpectedly fell from 87.2 to 86.4 in December. Contrasting outlooks across the German sectors signaled an uncertain economic outlook.

Trading Derivatives carries a high level of risk to your capital and you should only trade with money you can afford to lose. Trading Derivatives may not be suitable for all investors, so please ensure that you fully understand the risks involved, and seek independent advice if necessary. A Product Disclosure Statement (PDS) can be obtained either from this website or on request from our offices and should be considered before entering into a transaction with us. Raw Spread accounts offer spreads from 0.0 pips with a commission charge of USD $3.50 per 100k traded. Standard account offer spreads from 1 pips with no additional commission charges. Spreads on CFD indices start at 0.4 points. The information on this site is not directed at residents in any country or jurisdiction where such distribution or use would be contrary to local law or regulation.

The deterioration in business sentiment coincided with ECB plans to keep interest rates higher for longer.

The US Housing Sector and the Fed Offer Little Support

On Monday, FOMC members echoed Fed Vice Chair John Williams’s comments from Friday. FOMC member Austan Goolsbee discussed the market reaction to the Fed projections and press conference. Loretta Mester said the markets had mistakenly bet on a quick return to policy normalization.

Better-than-expected US housing sector data failed to fuel the buyer appetite for DAX-listed stocks. The NAHB Housing Market Index climbed from 34 to 37 in December. Economists forecast an increase to 36. Notably, falling mortgage rates contributed to an improved sentiment toward the US housing market.

However, the US equity markets offered late support, with the DAX recovering from session lows.

On Monday, the Nasdaq Composite Index and the S&P 500 gained 0.62% and 0.45%. The Dow ended the session flat.

The Monday Market Movers

Concerns about the German economy and hawkish Fed commentary impacted tech and consumer-related stocks. Siemens Energy AG and Infineon Technologies slid by 3.25% and 2.48%, respectively.

BMW and Mercedes Benz Group ended the day down 1.98% and 1.29%, respectively. Volkswagen and Porsche fell by 1.00% and 0.06%, respectively. Daimler Truck Holding bucked the trend, gaining 0.06%.

Eurozone Inflation and the ECB in Focus

On Tuesday, finalized Eurozone inflation figures for November warrant investor attention. Downward revisions to the preliminary numbers could impact ECB plans to keep rates higher for longer. According to the preliminary numbers, the Eurozone’s annual inflation rate softened from 2.9% to 2.4%.

Softer inflation numbers could allow the ECB to bring forward rate cut discussions, a boon for riskier assets.

However, investors must monitor ECB commentary throughout the day. ECB Executive Board members Andrea Enria and Frank Elderson are on the calendar to speak on Tuesday. Hawkish comments relating to interest rate trajectories could test the buyer appetite for DAX-listed stocks.

The Fed and the US Housing Sector

On Tuesday, US housing sector data will garner investor attention. Worse-than-expected declines in building permits and housing starts could be the early signs of a waning US economy. Economists consider housing market data as leading indicators for the US economy. However, investors must consider trends rather than monthly numbers in isolation.

Economists expect US building permits to decline by 1.2% and housing starts by 0.8%.

Away from the numbers, investors must also consider Fed commentary. Hawkish Fed chatter could test the appetite for riskier assets later in the session.

The futures markets pointed to a mixed start to the Tuesday session. The DAX was up 30 points, while the Nasdaq mini was down 13 points.

Short-Term Forecast

Near-term trends for the DAX will likely hinge on the euro area (Tues) and US inflation (Fri) numbers. Softer-than-expected inflation trends would support bets on more dovish rate paths, a boon for riskier assets.

DAX Technical Indicators

Daily Chart

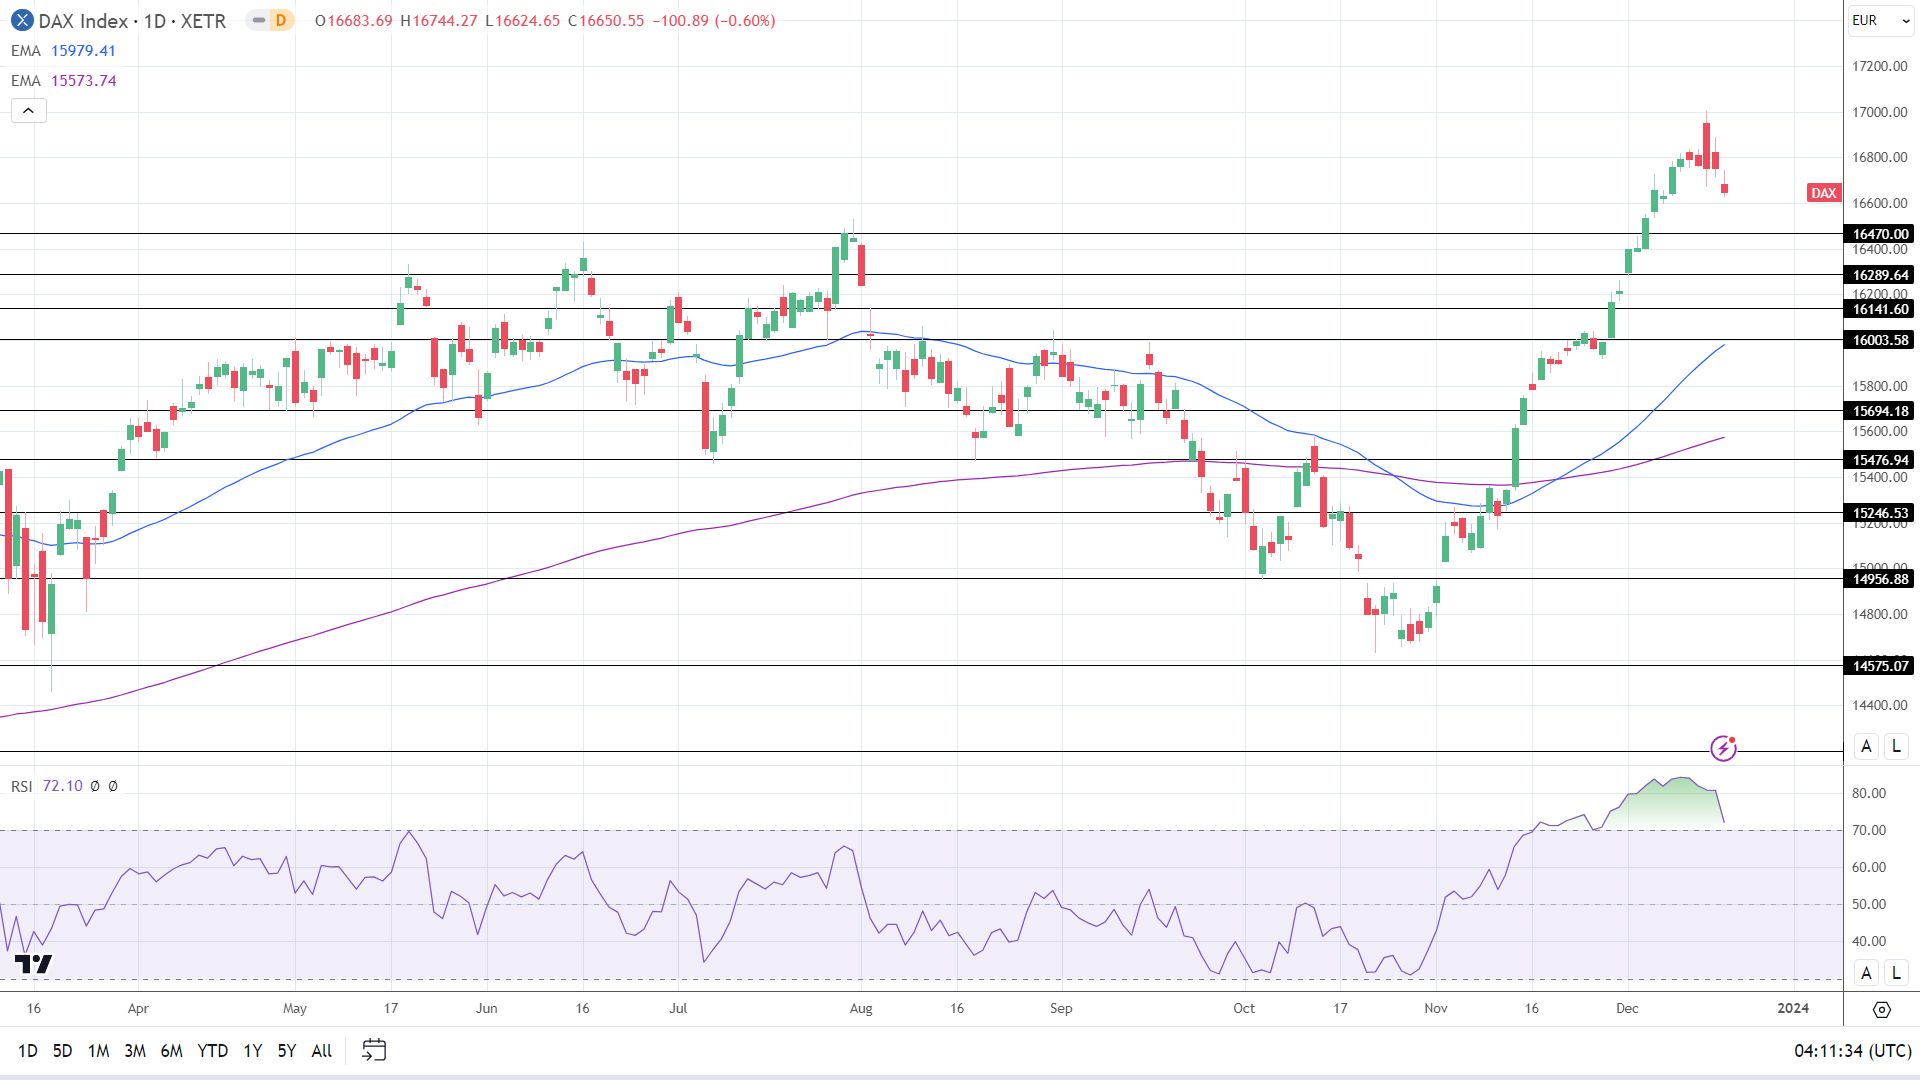
The DAX held above the 50-day and 200-day EMAs, with the EMAs sending bullish price signals.

A DAX return to the 16,850 handle would support a move to the December 14 ATH 17,003.

The ECB, Eurozone inflation, the Fed, and the US housing market will need consideration on Tuesday.

However, a break below the 16,600 handle would give the bears a run at the 16,470 support level.

The 14-day RSI reading of 72.10 shows the DAX in overbought territory. Selling pressure may intensify at the 16,850 handle.

DAX Daily Chart sends bullish price signals.
DAX 191223 Daily Chart

4-Hourly Chart

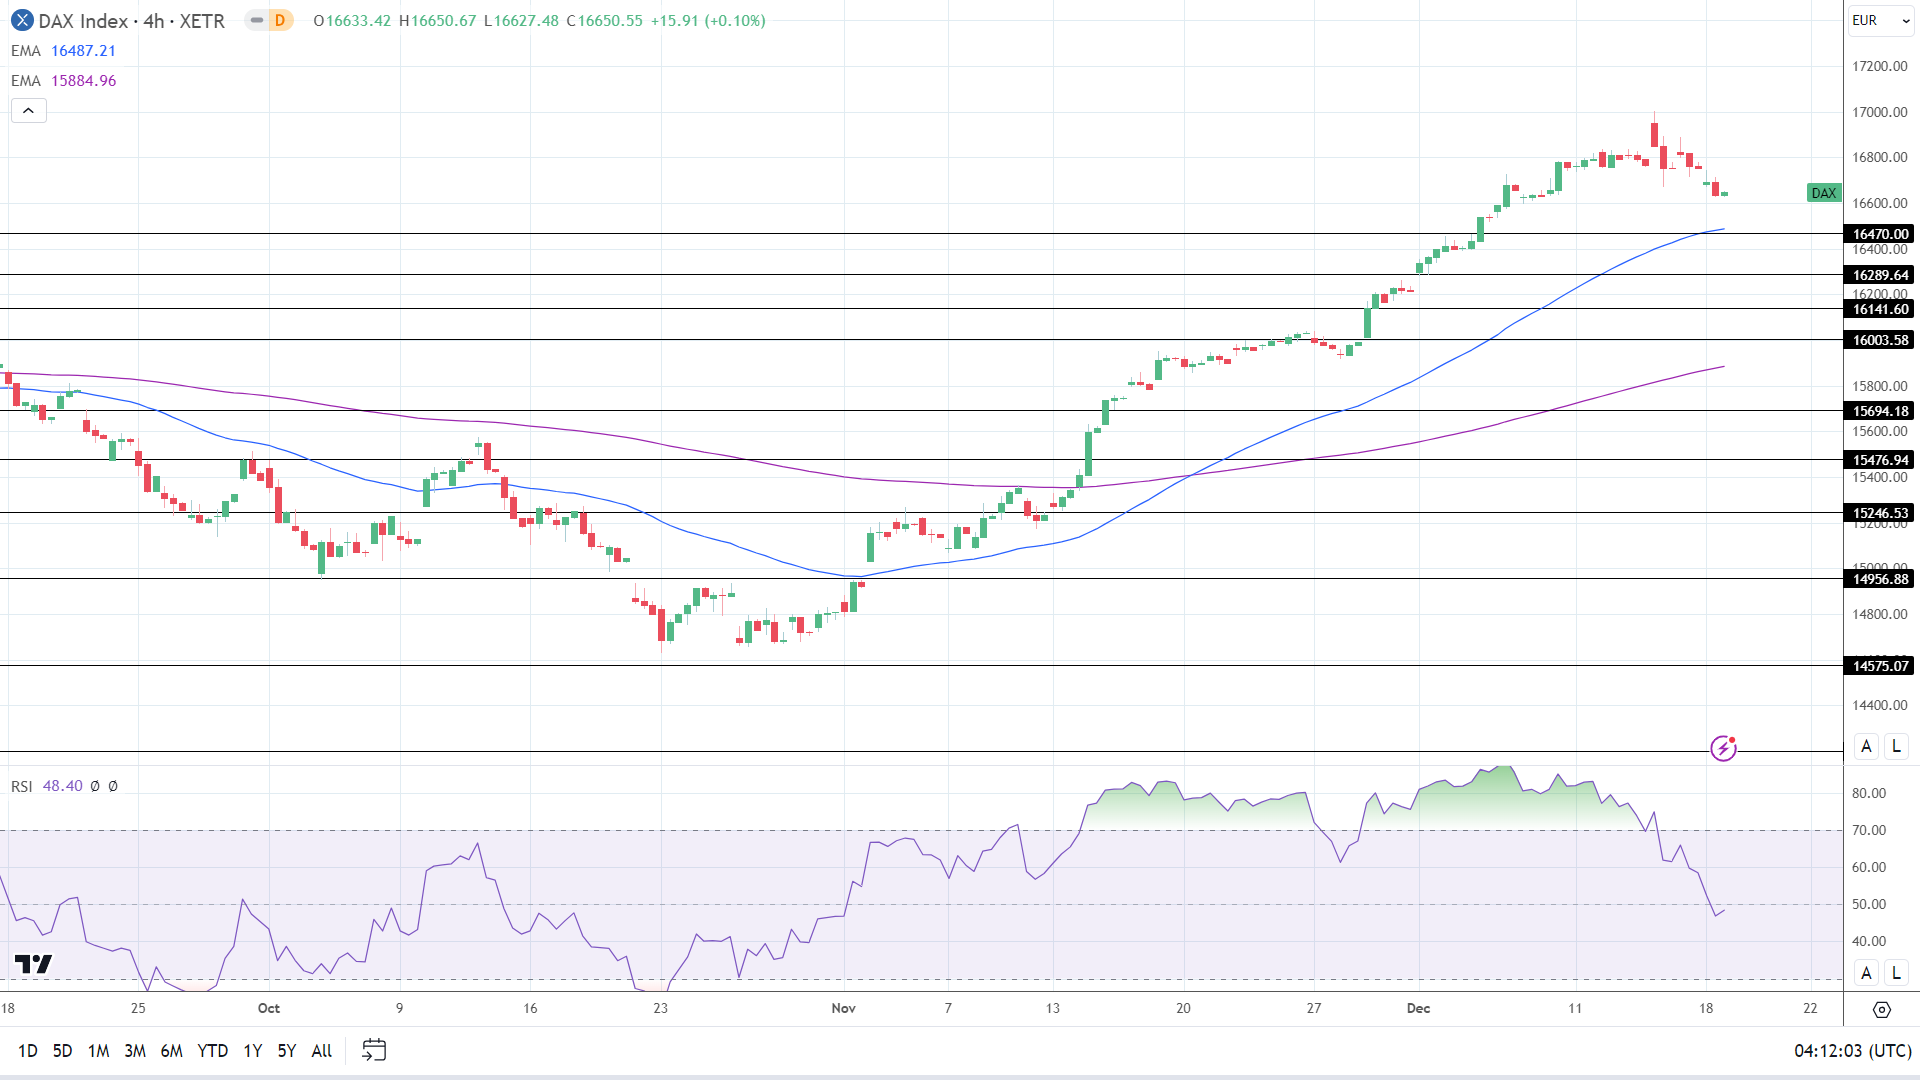
The DAX remained above the 50-day and 200-day EMAs, affirming bullish price signals.

A DAX return to the 16,850 handle would bring the December 14 ATH 17,003 into play.

However, a fall below the 16,600 handle would give the bears a run at the 50-day EMA and the 16,470 support level. Buying pressure could intensify at 16,480. The 50-day EMA is confluent with the 16,470 support level.

The 48.40 14-4 hour RSI indicates a DAX drop to the 50-day EMA before entering oversold territory.

4-Hourly Chart affirms bullish price signals.
DAX 191223 4-Hourly Chart