Bank of Japan Keeps Policy Unchanged Shifting Focus to the Press Conference

Bank of Japan Keeps Policy Unchanged Shifting Focus to the Press Conference

The Bank of Japan Leaves Interest Rates Unchanged

On Tuesday, the Bank of Japan left interest rates unchanged at -0.10%, as per forecasts. Notably, the Board voted unanimously to keep interest rates in negative territory.

According to the Bank of Japan Monetary Policy Statement,

  • The Bank of Japan left 10-year JGB yields at around 0%.
  • There were also no tweaks to the Yield Curve Control (YCC) policy.
  • “Extremely high uncertainties about economies and financial markets, the Bank will patiently continue with monetary policy easing while nimbly responding to developments in economic activity as well as financial conditions.”
  • The Bank will continue to maintain the stability of financing, mainly of firms, and financial markets, and will not hesitate to take additional easing measures if necessary.

The statement showed no immediate intention to pivot from negative interest rates, impacting the buyer appetite for the Yen. However, the Press Conference could move the dial. Bank of Japan Governor Kazuo Ueda recently discussed a willingness to exit negative rates without wage growth materializing.

USD/JPY Reaction to the Bank of Japan Monetary Policy Statement

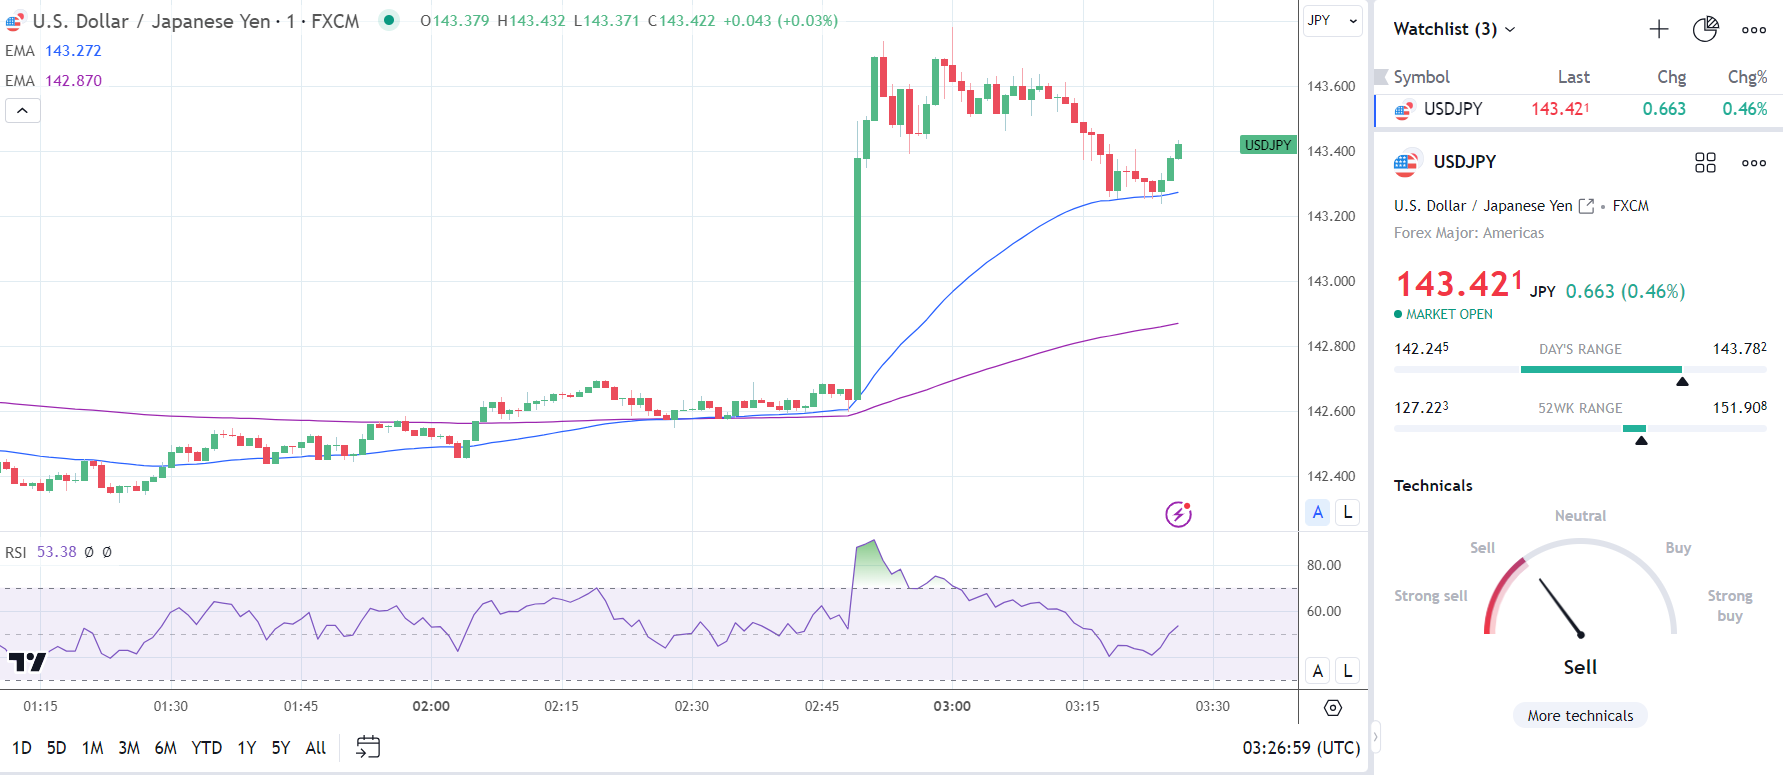
The USD/JPY fell to a Tuesday session low of 142.245 before steadying.

In response to the Bank of Japan policy decision and policy statement, the USD/JPY surged from 142.637 to a morning high of 143.782 before easing back.

This morning, the USD/JPY was up 0.46% to 143.421.

USD/JPY reacts to BoJ hold.
191223 USDJPY 3 Minute Chart

The Fed and the US Housing Sector in Focus

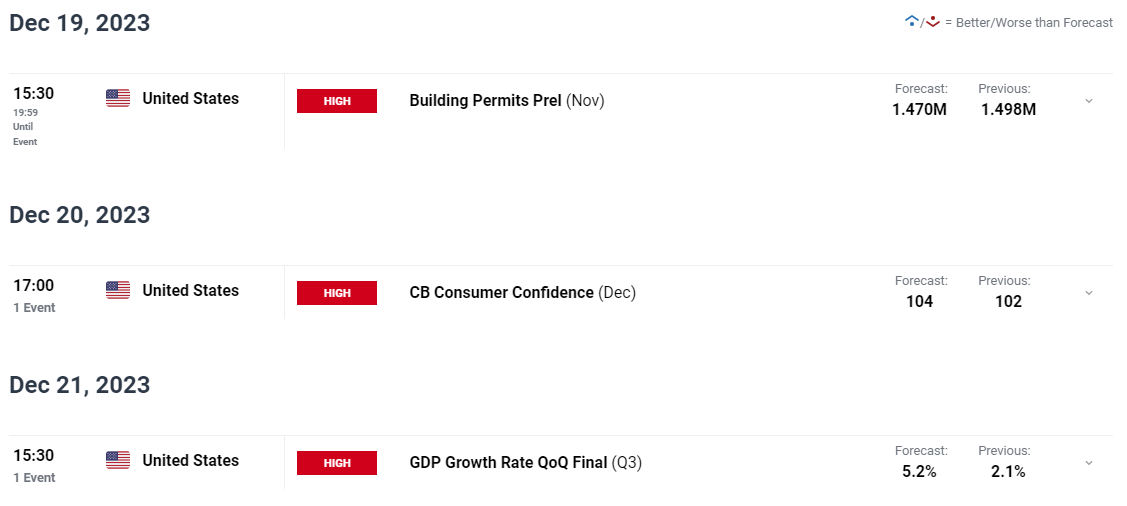
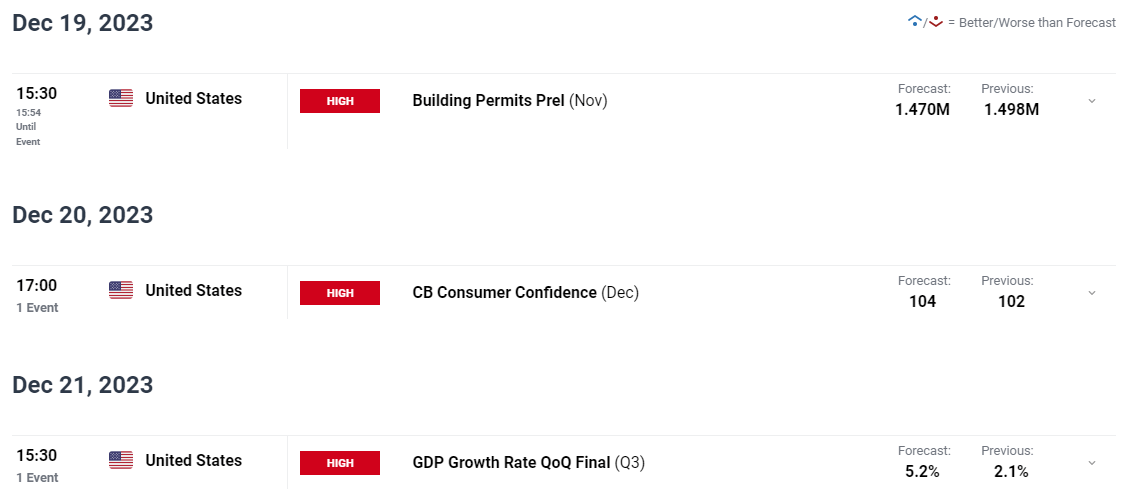
On Tuesday, US housing sector numbers need consideration. Economists forecast US housing starts and building permits to decline by 0.8% and 1.2%, respectively, in November.

However, investors must also consider Fed chatter. Hawkish comments could temper market bets on a Q1 2024 Fed rate cut. Near-term USD/JPY trends could hinge on the Bank of Japan press conference and US economic indicators. On Friday, personal outlays and inflation could impact bets on a Q1 2024 Fed rate cut.

Avalanche Price Analysis: Is this Bullish Indicator Signaling $50 AVAX Retest?

Avalanche Price Analysis: Is this Bullish Indicator Signaling $50 AVAX Retest?

Avalanche (AVAX) price held a $40 support level on Monday, as the bulls fiercely battled the resistance, despite the tepid sentiment in the broader crypto market.

On-chain data trends reveal that Avalanche’s fundamental growth factors continued to strengthen, suggesting the price rally could enter another leg up this week. Can the spikes in Avalanche network transactions drive AVAX price towards $50, for the first time since May 2022?

Trading Derivatives carries a high level of risk to your capital and you should only trade with money you can afford to lose. Trading Derivatives may not be suitable for all investors, so please ensure that you fully understand the risks involved, and seek independent advice if necessary. A Product Disclosure Statement (PDS) can be obtained either from this website or on request from our offices and should be considered before entering into a transaction with us. Raw Spread accounts offer spreads from 0.0 pips with a commission charge of USD $3.50 per 100k traded. Standard account offer spreads from 1 pips with no additional commission charges. Spreads on CFD indices start at 0.4 points. The information on this site is not directed at residents in any country or jurisdiction where such distribution or use would be contrary to local law or regulation.


Avalanche Has Recorded 5M Transactions in 5 Consecutive Days

Avalanche’s price action has grabbed media headlines over the past month as it leapfrogged the likes of Cardano (ADA) and Solana (SOL). But this week, the Ordinals inscriptions craze that gripped the prominent EVM (Ethereum Virtual Machine) compatible gains has triggered historic levels of transactional activity on the Avalanche network.

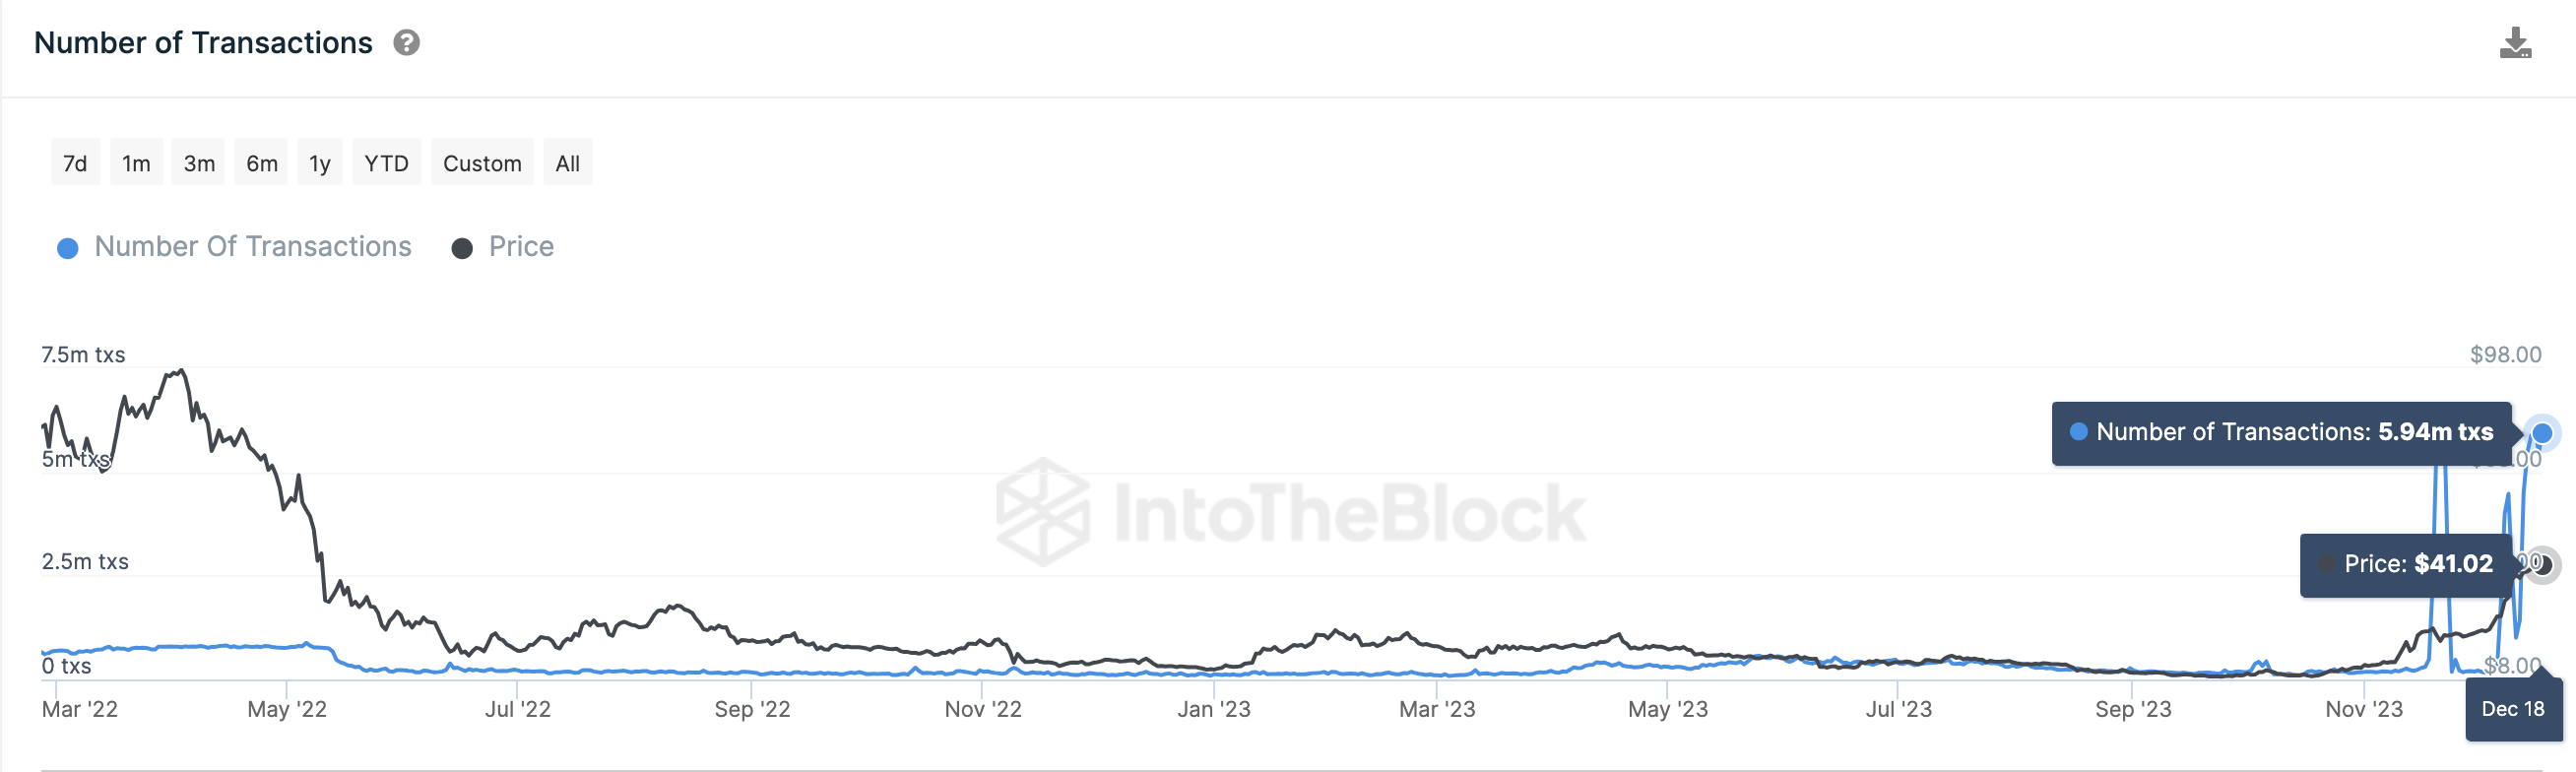
According to IntoTheBlock, Avalanche has recorded more than 5 million daily transactions on every trading day since Dec 14. The latest reading on 5.94 million AVAX denominated transactions were recorded on Dec 18, the second highest since the inception of the Avalanche project.

Avalanche (AVAX) Transaction Count vs. Price | Source: IntoTheBlock

Avalanche (AVAX) Transaction Count vs. Price | Source: Source: IntoTheBlockThe daily transaction count, as the name implies, measures the level of economic activity carried out daily on a blockchain network.

However, Ordinals inscriptions have been widely criticized for contributing relatively low economic value to the blockchain ecosystem. They have been cricizied for causing congestion, fee spikes and even network outages.

But, due to Avalanche’s superior scalability, relatively low fees, and built in fee-burn dynamics, this Ordinals boom appears to be having a positive impact on AVAX price.

Interestingly, as Avalanche network transactions crossed 5 million for the fifth consecutive day on Monday, AVAX price reclaimed $40 despite other layer-1 coins like BTC, ETH and ADA enduring a pull back.

AVAX Price Forecast: Can it Finally Reach $50

Avalanche price looks set to remain in an uptrend as the bulls fend off market FUD (fear, uncertainty and doubt) surrounding the Ordinals Inscription.

However, to reclaim $50, historical buy/sell trends show that the bulls must first clear the significant resistance at the $43 area.

The Global In/Out of the Money Around Price (GIOM) data, which groups the current AVAX holders based on their entry prices, affirms this positive outlook.

It shows that 370,022 current holders acquired 9.43 million coins the last time AVAX price crossed $43. After over 1-year of holding at a loss, Avalanche price could experience a pullback if those holders now look to book some profits.

But if the Oridinals inscription keeps triggering more Avalanche fee burns, the deflationary pressure could push AVAX price toward reclaiming $50 as predicted.

Avalanche (AVAX) Price Forecast | GIOM data | Source: IntoTheBlock

Avalanche (AVAX) Price Forecast | GIOM data | Source: IntoTheBlockStill, the bears could invalidate that positive prediction if AVX price wobbles below the critical psychological resistance at $30. But, in that case, the 811,410 holders that bought 211.4 million AVAX at the maximum price of $37 could offer support.

If that support level holds, AVAX price can avoid a major correction in the short-term.

How to Create a Trading Plan in 7 Steps

How to Create a Trading Plan in 7 Steps

What is a Trading Plan?

A trading plan is essentially a framework that guides traders through the entire trading process. It sets the conditions under which a trader enters trades, identifies markets, exits trades and manages risks along the way. The trading plan ensures accountability and keeps traders focused on their personal strategy.

trading plan on the wall

How to Create a Trading Plan

1) Choose Your Analytical Approach

The analytical approach answers the question, “how do you identify trade set-ups?”. It could be a combination of price support and resistance, trend lines, chart patterns, Fibonacci levels, moving averages, Ichimoku Clouds, Elliott Wave Theory, sentiment or the use of fundamentals etc.

This initial step of the trading plan helps traders to narrow their focus on a handful of scenarios that the trader is comfortable with. Thereafter, traders can look for opportunities to trade based on preferred trade set ups.

2) Select Your Favourite Trade Set Ups

The trade setup is at the core of the trading process. But first, think of the analytical approach as the event that triggers the trade setup. An example of this would be viewing a consolidation pattern (listed in the analytical approach as a chart pattern) which then gives rise to subsequent action from the trader, i.e. the trader will decide to trade the breakout or wait for a pullback or combine breakouts with pullbacks only after the chart pattern has successfully played out.

Set ups are based on a number of factors that collectively lead to higher probability trades. If you are new to forex trading, this process may take some time to figure out but it is essential for traders to find a trade setup that works best for them.

3) Limit the Markets to Focus on

When starting out, it is important for traders to limit the number of markets in focus. No market is the same and limiting the scope of markets can assist traders to understand the nuances of the market in question. Traders can even focus on specific time frames in a single market to familiarize themselves with its characteristics and movements.

4) Think About Your Holding Period

Time frames will depend on the type of trader. Traders that focus on short-term trades (trades opened and closed on the same day) include scalpers and day traders. Medium-term traders usually hold trades for a few hours up to a few days and are referred to as swing traders. Long-term trading involves time frames ranging from a number of days, weeks, months and in some cases, years.

Planning is essential to any trading plan

5) Know Your Risk Tolerance

Each step in the trading plan is important, however, if risk management is missing, the whole plan will fall apart. In this step, traders will need to discover their personal risk tolerance which corresponds with how far a trader is willing to set stop losses when limiting downside risk.

At DailyFX, we researched over 30 million live trades to discover that traders with a minimum risk to reward ratio of 1:1 were three times more likely to turn a profit than traders without any defined risk-to-reward. This and other information all traders should know can be found in our Traits of Successful Traders report.

6) Plan How You Will Handle Adversity (and Success)

All traders will eventually experience the dreaded drawdown, so it is important for traders to set a few rules to follow once this happens in order to manage emotions. An effective way to do this is to quantify an amount, or percentage loss, that would force the trader to take a step back and evaluate what went wrong/ is going wrong. Do not fall into the trap of setting this figure along the way, rather quantify this upfront.

Now the good news – what to do when trades are successful. Confidence is good, but overconfidence can quickly turn winning trades into losing trades. If the market moves favorably it is not unusual to increase risk/exposure however, this should be kept to a minimum.

7) Have a Routine For Staying on Track

Traders should set aside time to reflect on the week’s events and analyze individual trades. It’s a good idea to regularly review the trading plan and make tweaks if necessary. Periodical trade review and journaling are excellent ways to ensure you are following the process outlined in the trading plan. Make a note or save charts relating to successful/unsuccessful trade set ups that can be reviewed later on.

Trading plans should be rigid to begin with but should become a little more malleable as the trader becomes more familiar with the market in focus. The purpose of a trading plan is to give you a strong foundation and boundaries to operate within.

Oil Price Forecast: Oil Surges on Supply Chain Concerns as Red Sea Disruptions Intensify

Oil Price Forecast: Oil Surges on Supply Chain Concerns as Red Sea Disruptions Intensify

RED SEA SUPPLY INTERRUPTION AND THREATS POSED

The tensions around the Red Sea do not bode well for those who have wished that the war remain confined. This being the first sign that it may spread and affect the Global Economy, something which had been stressed by Central Bank bosses from the EU, Bank of England and the US Federal Reserve. All Central Bank heads cited their concern that the longer the war draws on the greater the likelihood of a spread which could have consequences from Global growth and the Global Economy. Just as it seems Central Banks are getting inflation under control, will the supply chain disruptions and a potential spread in the Middle East weigh on Global Markets heading into 2024? Well, if anything, these developments are likely to strengthen the belief that things may get worse in the early part of 2024.

BP stated today that It has temporarily suspended all transits through the Red Sea. This was a response to a Norwegian Vessel was attacked earlier in the day with consumers now facing the prospect of shouldering increased transport costs and time constraints for refineries. The longer the war drags on the more chance I believe there is of disruptions around the Straight of Hormus as Iranian allies in the region continue to grow bolder. This could become a key feature and focus for the early part of 2024.

LOOKING AHEAD TO THE REST OF THE WEEK

Looking to the rest of the week and the Geopolitical risk is likely to be the key driver and the most important risk to pay attetion to. There is a bunch of data and from the US and inventories data as well which could also impact on Oil prices.

TECHNICAL OUTLOOK AND FINAL THOUGHTS

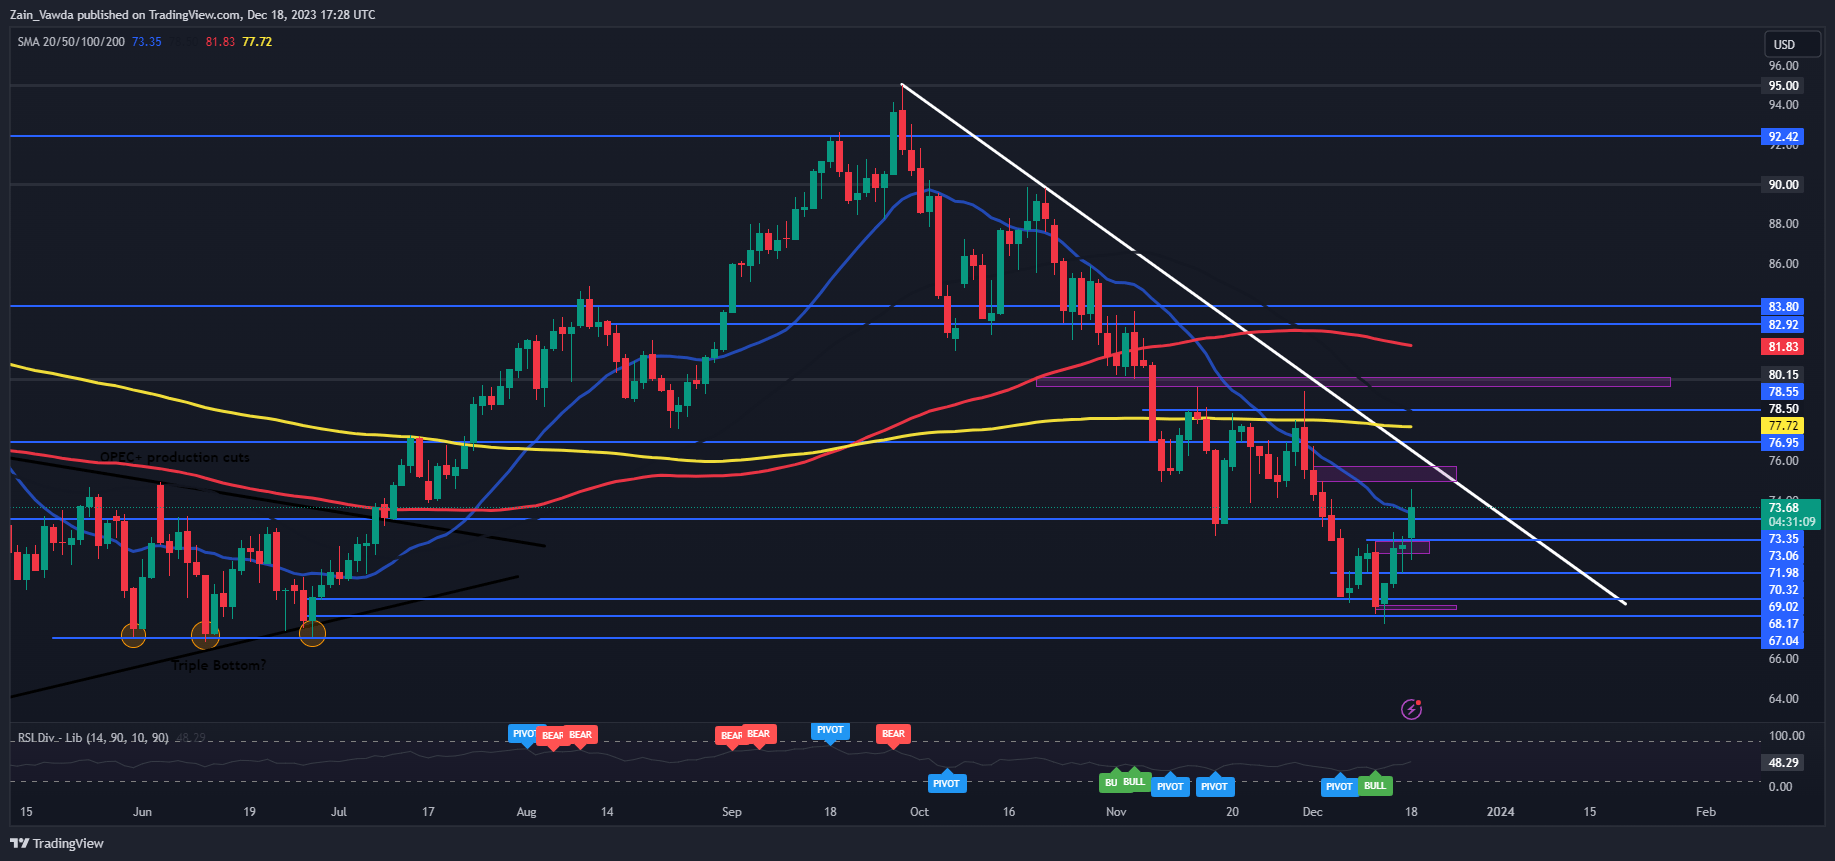
From a technical perspective WTI is attempting to close above the $73.35 mark which houses the 20-day MA with the next resistance area at the key psychological level at the $75 mark. There is also the descending trendline which could come into play at the $76.50-$77.00 area which would be the third touch of the trendline. Usually, this leads to a continuation of the trend but if the geopolitical situation remains strained we could see a break above and a push back toward the $80 mark.

WTI Crude Oil Daily Chart – December 18, 2023

Key Levels to Keep an Eye On:

Support levels:

  • 73.00
  • 72.10
  • 70.00

Resistance levels:

  • 75.00
  • 77.00
  • 77.72

IG CLIENT SENTIMENT

IG Client Sentiment data tells us that 83% of Traders are currently holding LONG positions. Given the contrarian view to client sentiment adopted here at DailyFX, does this mean we are destined to revisit the $70 a barrel mark?

AUD/USD Price Forecast: Channel Breakout to Keep Bulls in Control?

AUD/USD Price Forecast: Channel Breakout to Keep Bulls in Control?

AUSTRALIAN DOLLAR FUNDAMENTAL BACKDROP

The Australian Dollar has held onto its gains from the past couple of weeks despite a slight recovery from the US Dollar index at the back end of last week. The Australian Dollar has been on a steady move higher since the RBA raised rates at the November meeting.

The Australian Dollar has since been on an uptrend as this coincided with the US Dollar weakness and the Federal Reserve Meeting last week. The Australian economy has been showing signs of a slowdown with both services and composite metrics in contractionary territory.

If this is the peak rate for the RBA it still puts the Australian Dollar in the driving seat given the comments by Fed Chair Powell. The Fed are expecting 75bps of cuts in 2024 while the RBA are yet to strike such a dovish tone. The RBA could remain hawkish for a bit longer before we see some dovish repricing which could halt the Australian Dollar rally.

It will be an interesting end to the year and even more interesting in 2024 as we see how Central Banks navigate their way toward potential rate cuts.

THE WEEK AHEAD

The rest of the week still brings in a lot of data releases from the US in particular. These releases could see small alterations in the Fed Funds rate expectations for the Federal Reserve. This is likely to persist heading into 2024 as data continues to be released.

Right now, however, any data releases are unlikely to have any lasting impact and is likely to only result in short term changes. Earlier this evening we also heard comments from Fed Policymaker Mary Daly who confirmed that 3 rate cuts would likely be needed to avoid overtightening. Daly also said that this would likely depend on inflation, another sign that it is not a given. The recent rise in tensions in the Middle East has the potential to prop inflation up once more and lead to a global economic slowdown as well. Interesting times ahead indeed.

For all market-moving economic releases and events, see theDailyFX Calendar

PRICE ACTION AND POTENTIAL SETUPS

AUDUSD

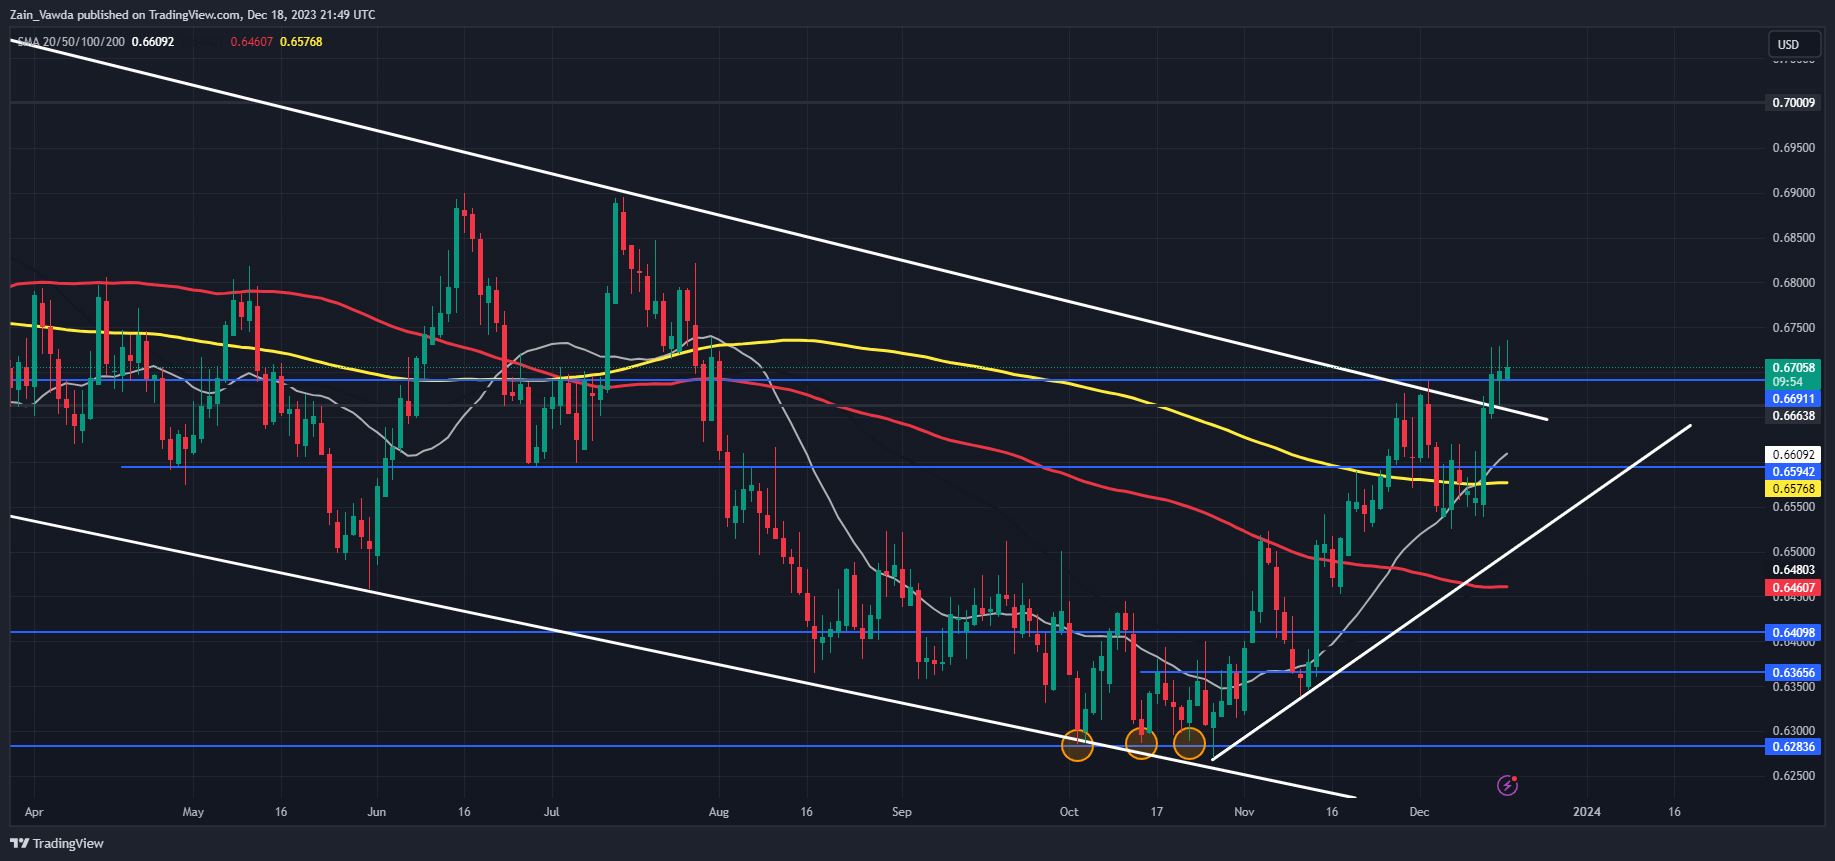
AUDUSD had finally broke out of the channel which had been in play since March 2023. The breakout occurred last week Thursday and since AUDUSD has stalled. Looking at general structure we have just printed a fresh higher high which usually occurs before a pullback. The Dollars resurgence on Friday failed to push AUDUSD lower and thus i am skeptical that the retracement i am looking for will come to fruition.

If it does however, i will be paying close attention to the ascending trendline which could come into play, but before that there is support at the 0.6690 and 0.6590 handle which could prove to be stubborn.

Alternatively, should AUDUSD continue its move higher from here then immediate resistance rests at 0.6790 and 0.6890 respectively.

Key Levels to Keep an Eye On:

Support levels:

  • 0.6690
  • 0.6590
  • 0.6500

Resistance levels:

  • 0.6790
  • 0.6890
  • 0.7000 (psychological level)

AUD/USD Daily Chart

IG CLIENT SENTIMENT

IG Client Sentiment data tells us that 51% of Traders are currently holding SHORT positions. Given the contrarian view to client sentiment adopted here at DailyFX, does this backup my assumption that a retracement may be incoming?

Japanese Yen Pared Back and Nikkei Advances after BoJ Keeps Rates on Hold

Japanese Yen Pared Back and Nikkei Advances after BoJ Keeps Rates on Hold

Conditions for BoJ Policy Pivot in 2024: Inflation and Wages

The BoJ’s Ueda stressed not only the incoming data but will also consult companies regarding what has been referred to as the ‘wage-price virtuous cycle’. Ueda mentioned that underlying inflation will gradually increase through FY 2025 but increases will be modest due to lower energy prices. Most importantly, Ueda stressed that the bank is still not in a position to foresee sustainable, stable inflation with sufficient confidence.

As long as this remains the case, policy is unlikely to shift but that won’t stop markets from speculating, especially if wage negotiations result in the fastest pace of pay rises in decades. In January trade unions will put forward their demands with the negotiation process coming to an end in March, leaving the BoJ with plenty of information to possibly make a decision to abolish negative interest rates in Q2.

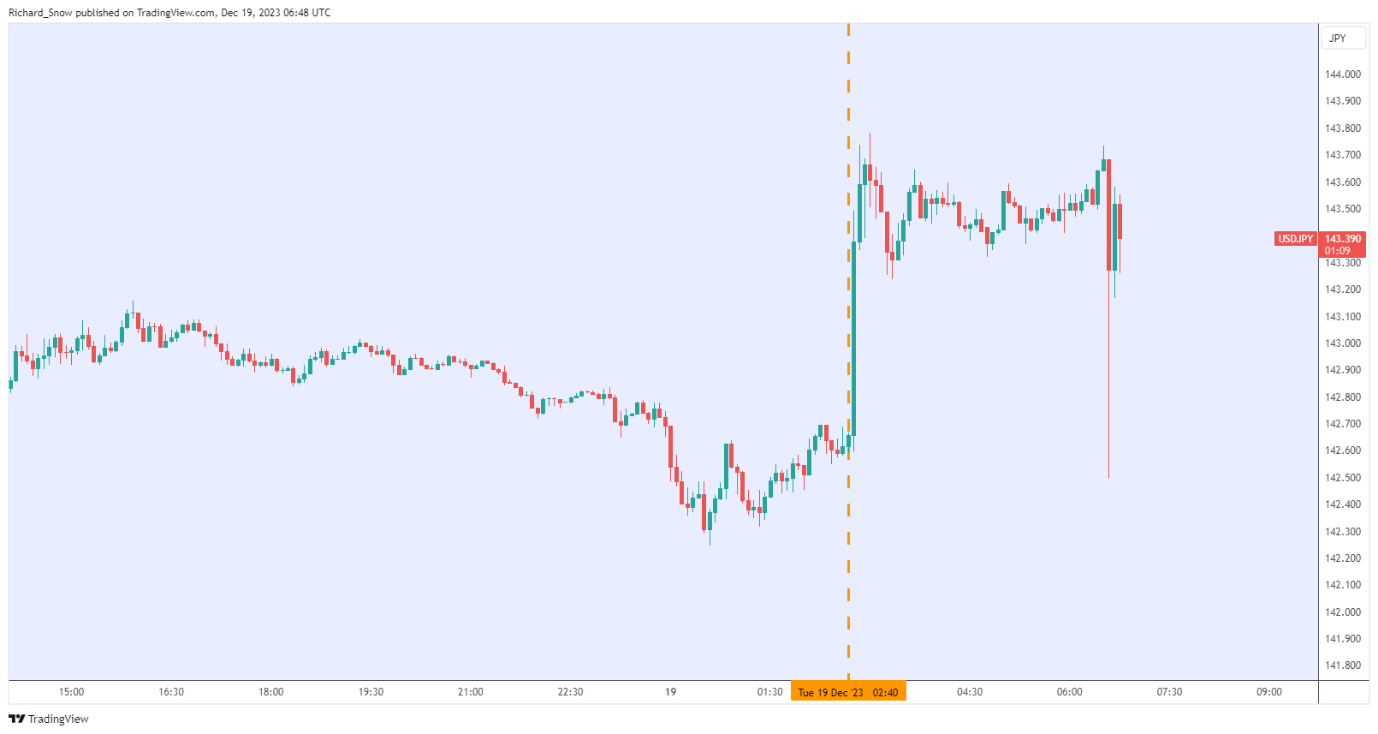
The 5-minute USD/JPY chart reveals the immediate rise followed by a volatile spike back down to levels witnessed ahead of the meeting with prices stabilizing around the intra-day high.

USD/JPY 5-Minute Chart

image2.png

Source: TradingView, prepared by Richard Snow

USD/JPY Receives Modest Boost, Pullback in Focus

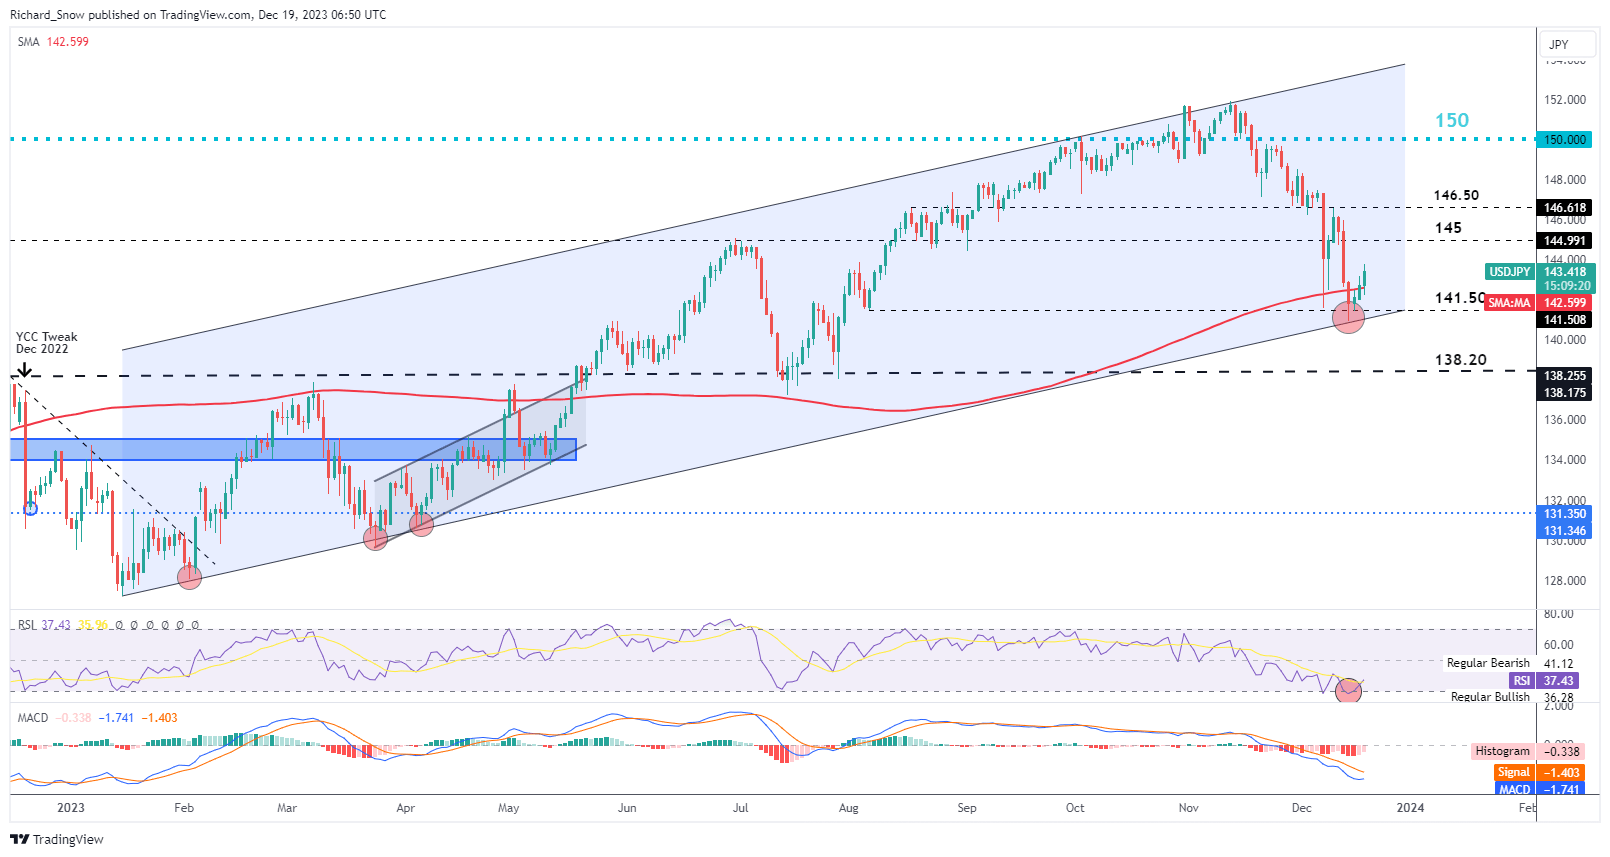
USD/JPY had witnessed a counter-trend drift in the lead up to the BoJ announcement which has continued in the moments after. The zone of support around 141.50 and the underside of the large ascending channel resulted in a rejection of a move lower – requiring some other catalyst to force a sustained move lower. Friday is a big day for the pair as we get Japanese inflation data and US PCE figures where the possibility of higher Japanese inflation could be coupled with lower US inflation to send the pair lower once again. However, we will have to see what the data reveals.

Traders looking for a medium-term bearish continuation will be looking for potential areas of resistance, bringing the pullback to an end. The 145 mark is the most imminent level followed by the 146.50 mark. As we head into Christmas and the notably lower volume that accompanies this period, selling rallies may be something to consider as markets appear to lack the necessary momentum to fight the prevailing trend for extended periods of time.

USD/JPY Daily Chart

image3.png

Nikkei Buoyed by BoJ Decision to Stand Pat

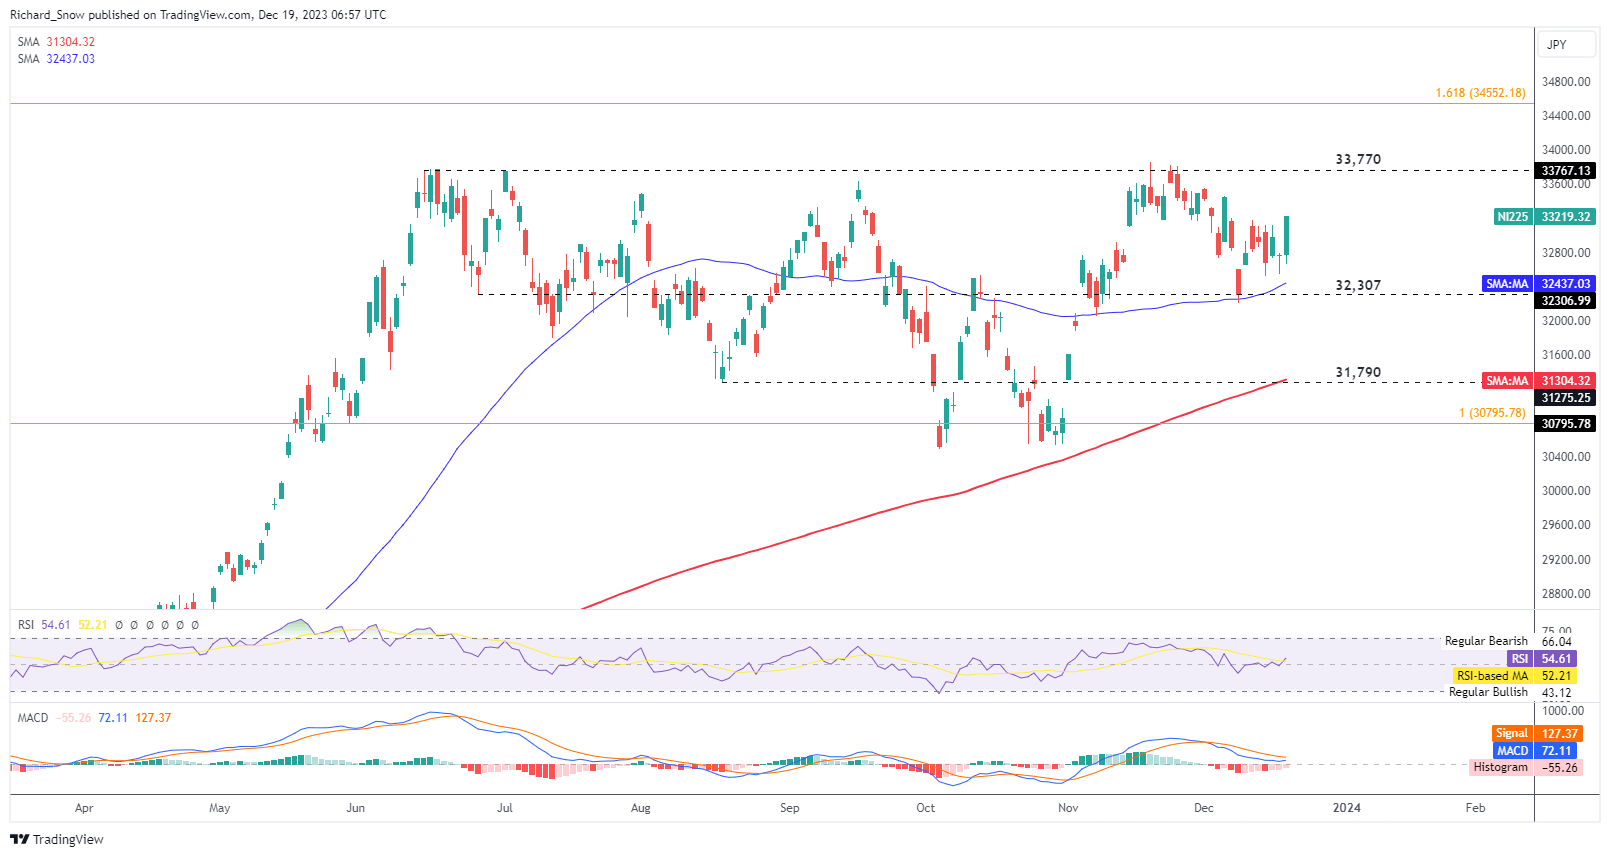
The Nikkei responded well to the decision to leave rates unchanged and consider incoming data. The index remains near its yearly high of 33,770, a potential level of resistance is today’s move can find subsequent follow through.

Price action previously bounced off the 50 SMA, consolidated for a while and then rose this morning. Dynamic support appears at the 50-day SMA followed by 32,307.

Nikkei Daily Chart

image4.png

If you’re puzzled by trading losses, why not take a step in the right direction? Download our guide, “Traits of Successful Traders,” and gain valuable insights to steer clear of common pitfalls that can lead to costly errors:

The Importance of Liquidity in Forex Trading

The Importance of Liquidity in Forex Trading

What is liquidity and why is it important?

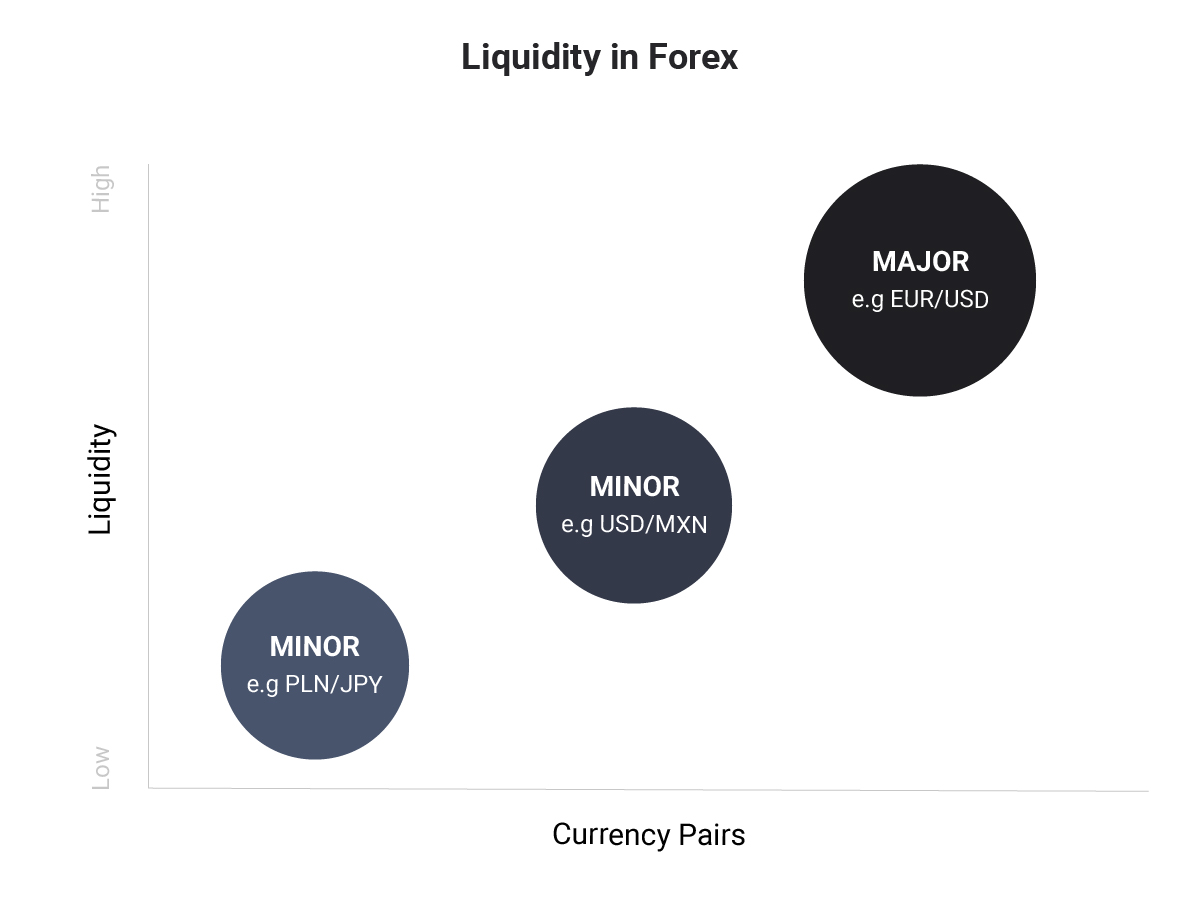
Liquidity in the forex market is by definition, the ability of a currency pair to be traded (bought/sold) on demand. When you’re trading major currency pairs, you’re trading a market that is exceedingly liquid. However, you are trading based on the available liquidity of financial institutions which get you in or out of the trade (currency pair) of your choosing.

liquidity in forex

Not all currency pairs are liquid. In fact, currencies tend to have varying levels of liquidity depending on whether they are major, minor and exotic pairs (including emerging market currencies). Forex liquidity dries up as trader’s move from major pairs to minor pairs and finally to the exotic pairs.

High Liquidity:

High liquidity in forex refers to a currency pair that can be bought/sold in significant sizes without large variances in its exchange rate (price level) – e.g. Major currency pairs such as EUR/USD.

Other major currency (highly liquid) pairs to be aware of:

Low Liquidity:

Low liquidity in forex refers to a currency pair that cannot be bought/sold in significant sizes without large variances in its exchange rate price level – e.g. Exotic currency pairs such as PLN/JPY.

Forex liquidity vs illiquidity: 3 Signs to look out for

From a trader’s point of view, an illiquid market will have chaotic moves or gaps because the level of buying or selling volume at any one moment can vary greatly. A highly liquid market is also known as a deep market or a smooth market and price action is also smooth. Most traders need and should require a liquid market because it is very hard to manage risk if you’re on the wrong side of a big move in an illiquid market.

Here are three signs to look out for which are:

1. GAPS WHEN TRADING FOREX

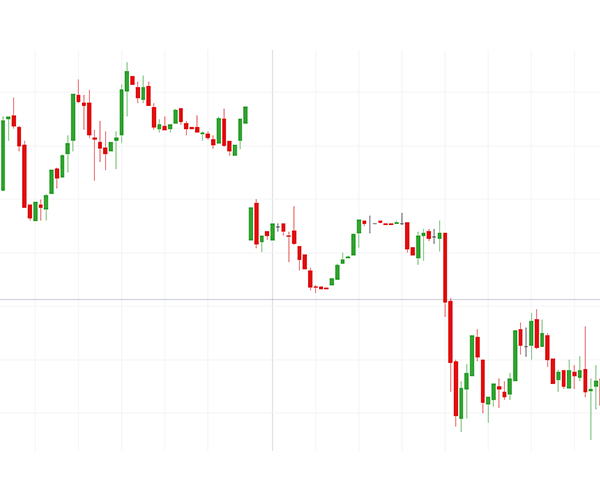
Gaps in forex vary compared to other markets. However, price gaps can occur in forex if an interest rate announcement or other high impact news announcement comes out against expectations.

Gaps can occur at the week’s opening on Sunday afternoon in the US. If there is a news announcement over the weekend, then overall gaps in forex are usually less than a 0.50% of a currency’s value.

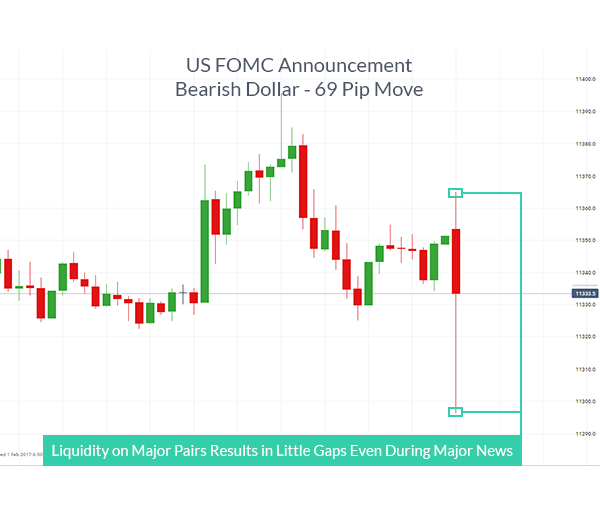
The charts below depict the difference in the liquidity between the equity market and the forex market, as highlighted by gapping.

Equity markets are prone to gaps: FTSE 100 Index

Chart to show illiquid market and gaps

Forex market exhibits little/no gapping:

Chart to show a more liquid forex market

A market that trades 24 hours a day like the forex market is consideredmore liquid or simply tends to have less gaps due to the continuous naturein the equities market. This allows traders to enter and exit the market at their discretion. A market that only trades for a fraction of the day like the US Equity market or Futures Exchange would be condensed into a thinner market because price can jump at the open if overnight news comes out against the crowd’s expectations.

2. THE FOREX LIQUIDITY INDICATOR

Brokers often offer a “volume” option on the chart whereby a trader can gauge the liquidity of the market. This forex liquidity indicator is interpreted by analysing the bars on the volume chart.

Each volume bar represents the volume traded during the specific time period, thus giving the trader a suitable approximation of liquidity. It is important to remember that most brokers only reflect their own liquidity data and not the overall forex market liquidity. However, using a broker’s liquidity as a gauge can represent the retail market fittingly depending on the size of the broker.

3. DIFFERENT TIMES OF DAY OFFER VARYING AMOUNTS OF LIQUIDITY

Short term traders or scalpers should be aware of how liquidity in forex varies through the trading day. There are less active hours like the Asian Session that is often range bound meaning support and resistance levels are more likely to hold from a speculation point of view. The major moving market sessions such as the London session and US session are more prone to breakouts and larger percentile moves on the day.

The time of day that you’re likely to see the biggest moves are the US Morning Session because it overlaps with the European / London Session which alone accounts for roughly +50% of total daily global volume. The US session alone accounts for around 20% and in the US Afternoon, you will often see a sharp drop off in aggressive moves except for when the Federal Open Market Committee (FOMC) comes out with a surprise announcement which is but a few times a year.

Liquidity Risk vs Reward

The relationship between risk and reward in financial markets is almost always proportionate, so understanding the risks involved in a trade must be taken into consideration.

A primary example of liquidity risk in the forex market is the Swiss Franc crisis in 2015. The Swiss central bank announced they would no longer be preserving the Swiss Franc peg against the Euro causing the interbank market to become broken due to an inability to price the market. This led to brokers being unable to offer liquidity on CHF. As interbank pricing (the backbone of forex pricing) returned, EUR/CHF prices were far from the previous range. This led to retail client account balances for those trading CHF to be largely affected. While these “Black Swan” events are rare, they are not impossible.

Retail forex traders need to manage these liquidity risks by either lowering their leverage or making use of guaranteed stops whereby the broker is obligated to honour your stop price level.

Weighing up the options between liquidity risk and reward should not be overlooked and should be included as a part of a trader’s analysis routine.

Currency Carry Trade: What is it and how does it work?

Currency Carry Trade: What is it and how does it work?

What is a currency carry trade and how does it work?

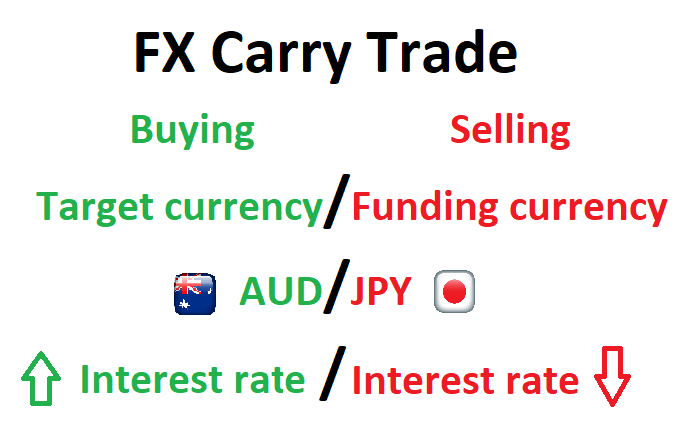
An FX carry trade involves borrowing a currency in a country that has a low interest rate (low yield) to fund the purchase of a currency in a country that has a high interest rate (high yield). Holding this position overnight will result in an interest payment being made to the trader based on the “positive carry” of the trade.

The lower yielding currency is referred to as the “funding currency” while the currency with the higher yield is referred to as the “target currency”.

Currency carry trade infographic

Rollover

“Rollover” is the process whereby brokers extend the settlement date of open forex positions held past the daily cut-off time. The broker either debits or credits the account, based on the direction of the trade (long or short) and whether the interest rate differential is positive or negative. Since interest is quoted as an annual figure, these adjustments will be the daily adjusted rate.

Interest rates

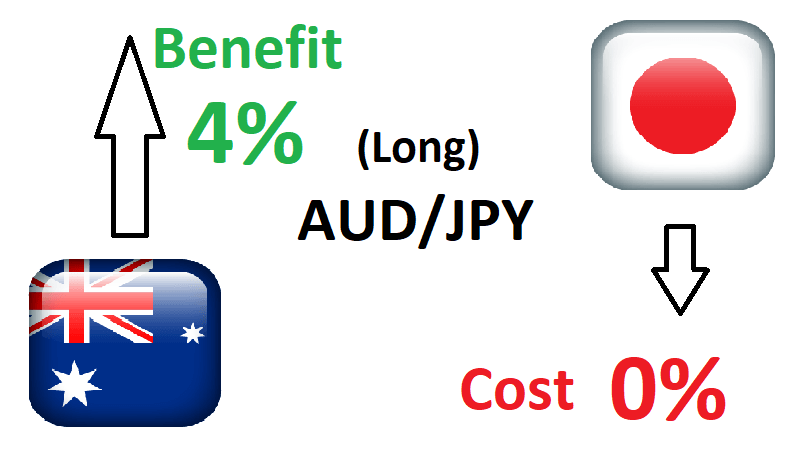
Interest rates are set by a country’s central bank in accordance with the mandate of that country’s monetary policy – this will differ from country to country. A trader then earns interest on a position when they are long the currency in the pair with the higher interest rate. For example, if the Australian dollar offers 4% and the Japanese Yen has interest rates set at 0%, traders could look to buy (long) AUD/JPY to take advantage of the 4% net interest rate differential.

There are two main components to the FX carry trade:

1) Changes in interest rates

The main component of the carry trade is centered around the interest rate differential between the two traded currencies. Even if the exchange rate between the two currencies remains unchanged, the trader will profit from the overnight interest payment. However, over time, central banks deem it necessary to alter interest rates and this poses a potential risk to the carry trade strategy.

2) Exchange rate appreciation/depreciation

The other component of the carry trade strategy focuses on the exchange rate of the two currencies. A trader looks for the target currency to appreciate (increase in value) when long. When this happens the payoff to the trader includes the daily interest payment and any unrealised profit from the currency. However, the profit the trader sees, as a result of the target currency appreciating, will only be realised when the trader closes the trade.

It is possible for a trader to lose money when the target currency depreciates against the funding currency so that the capital depreciation wipes out the positive interest payments.

Currency carry trade example

Continuing with the example used above, if the Australian Official Cash Rate is currently at 4% and the Japanese Yen yields 0%, a trader may decide to take a long trade on AUD/JPY if the pair is likely to rise.

FX carry trade example using AUD/JPY

Traders looking to capitalise on the interest rate differential will essentially be borrowing Yen at the much lower rate and receiving the higher interest rate associated with the Australian dollar. In reality, retail traders will receive less than 4% as forex brokers usually apply a spread.

For a detailed example of how to calculate the approximate overnight interest charge/gain, read our article on understanding foreign exchange rollover.

The risks involved with carry trades

A currency carry trade, like most trading strategies, carries a degree of risk and therefore, requires the adoption of sound risk management. Risk management has become even more important since the 2008/09 global financial crisis which resulted in lower interest rates for developed nations, forcing carry traders to look to riskier, high yielding emerging markets currencies until interest rates normalize.

  • Exchange rate risk: Should the target currency weaken against the funding currency, traders that are long the pair will see the trade move against them but will still receive the daily interest.
  • Interest rate risk: If the country of the target currency reduces interest rates and the country behind the funding currency increases interest rates, this will reduce the positive net interest rate and is likely to reduce the profitability of the FX carry trade.

FX Carry trade strategy

Filtering FX carry trades in the direction of the trend is one such strategy employed by top traders. This is because the carry trade is a long term trade, and therefore, it’s useful to analyse markets that exhibit strong trends.

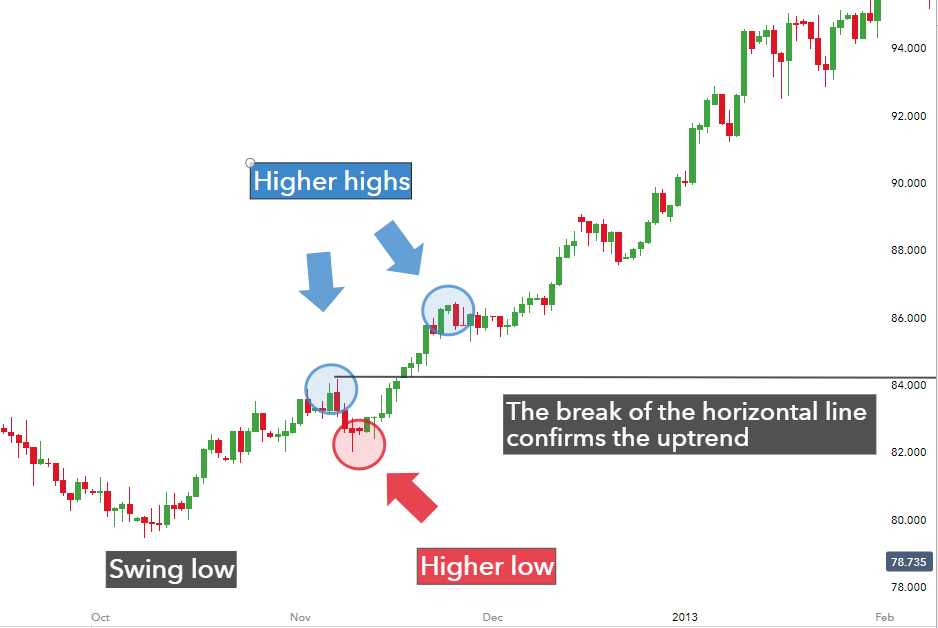
In an attempt to get into higher probability trades, traders should first look to confirm the uptrend which, in the below chart, is confirmed after the higher high and higher low.

Trend bias in positive carry trade strategy

The figure depicts higher highs and higher lows whereby a break of the horizontal line (drawn at the first higher high) confirms the uptrend. Thereafter, traders can make use of multiple time frame analysis and indicators to spot ideal entry points to enter a long trade.

Conclusion

Currency carry trades present traders with two avenues to profit (exchange rate and interest rate differential) but it is essential to manage risk as losses are can arise when the pair moves against traders or the interest rate differential narrows.

For higher probability trades, traders should look for entry points in the direction of an uptrend and should protect downside risk by utilizing prudent risk management techniques.

Technical Indicators Defined and Explained

Technical Indicators Defined and Explained

Technical indicators are chart analysis tools that can help traders better understand and act on price movement. There is a huge range of technical analysis tools available that analyze trends, provide price averages, measure volatility and more.

In this piece, we explore the types of technical indicators available, from RSI to Bollinger Bands®, explain how to respond to technical signals, and reveal the top tips to making the tools an effective part of your trading journey.

Types of Technical Indicators

There are four main types of technical indicators: Trend Following, Oscillators, Volatility and Support/Resistance. They are grouped based on their function, which ranges from revealing the average price of a currency pair over time, to providing a clearer picture of support and resistance levels.

List of Technical Indicators

1. Trend Indicators

Trend following indicators were created to help traders trade currency pairs that are trending up or trending down. We have all heard the phrase ‘the trend is your friend’ – these indicators can help point out the direction of the trend and can tell us if a trend actually exists.

Moving Average Indicator

A Moving Average (MA) is a technical tool that averages a currency pair’s price over a period of time. The smoothing effect this has on the chart helps give a clearer indication on what direction the pair is moving – either up, down, or sideways. There are a variety of moving averages to choose from, with Simple Moving Averages and Exponential Moving Averages being the most popular.

Ichimoku Indicator

Ichimoku is a complicated looking trend assistant that is simpler than it appears. This Japanese indicator was created to be a standalone indicator that shows current trends, displays support/resistance levels, and indicates when a trend has likely reversed. For more, check out our Definitive Guide to Trading Trends with Ichimoku Cloud.

ADX Indictor

The Average Direction Index won’t tell you whether price is trending up or down, but it will tell you if price is trending or is ranging. This makes it the perfect filter for either a range or trend strategy by making sure you are trading based on current market conditions. For more, see our article How to Use ADX to Identify Forex Trends.

2. Oscillator Indicators

Oscillators give traders an idea of how momentum is developing on a specific currency pair. When price treks higher, oscillators will move higher. When price drops lower, oscillators will move lower. Whenever oscillators reach an extreme level, it might be time to look for price to turn back around to the mean.

However, just because an oscillator reaches ‘Overbought’ or ‘Oversold’ levels doesn’t mean we should try to call a top or a bottom. Oscillators can stay at extreme levels for a long time, so we need to wait for a valid sign before trading.

RSI Indicator

The Relative Strength Index is arguably the most popular oscillator to use. A big component of its formula is the ratio between the average gain and average loss over the last 14 periods. The RSI is bound between 0 – 100 and is considered overbought above 70 and oversold when below 30. Traders generally look to sell when 70 is crossed from above and look to buy when 30 is crossed from below. Click here to learn about A Better Way to Use RSI to Signal When to Take a Forex Trade.

Stochastics Indicator

Stochastics offer traders a different approach to calculate price oscillations by tracking how far the current price is from the lowest low of the last X number of periods. This distance is then divided by the difference between the high and low price during the same number of periods. The line created, %K, is then used to create a moving average, %D, that is placed directly on top of the %K. For more, check out our article How to Trade With Stochastic Oscillator.

CCI Indicator

The Commodity Channel Index is different than many oscillators in that there is no limit to how high or how low it can go. It uses 0 as a centerline with overbought and oversold levels starting at +100 and -100. Traders look to sell breaks below +100 and buy breaks above -100. To see some real examples of the CCI in action, take a look at how to Trade Forex with the CCI Indicator.

MACD Indicator

The Moving Average Convergence/Divergence tracks the difference between two EMA lines, the 12 EMA and 26 EMA. The difference between the two EMAs is then drawn on a sub-chart (called the MACD line) with a 9 EMA drawn directly on top of it (called the Signal line). Traders then look to buy when the MACD line crosses above the signal line and look to sell when the MACD line crosses below the signal line as seen here. There are also opportunities to trade divergence between the MACD and price.


3. Volatility Indicators

Volatility measures how large the upswings and downswings are for a particular currency pair. When a currency’s price fluctuates wildly up and down it is said to have high volatility. Whereas a currency pair that does not fluctuate as much is said to have low volatility. It’s important to note how volatile a currency pair is before opening a trade, so we can take that into consideration with picking our trade size and stop and limit levels. Read our article on the Top 10 Most Volatile Currency Pairs for more.

Bollinger Bands® Indicator

Bollinger Bands ® print three lines directly on top of the price chart. The middle ‘band’ is a 20-period simple moving average with an upper and low ‘band’ that are drawn two standard deviations above and below the 20 MA. This means the more volatile the pair is, the wider the outer bands will become, giving the Bollinger Bands® the ability to be used universally across currency pairs no matter how they behave.

Bollinger Bands® is a registered trademark of John Bollinger.

ATR Indicator

The Average True Range tells us the average distance between the high and low price over the last set number of bars (typically 14). This indicator is presented in pips where the higher the ATR gets, the more volatile the pair, and vice versa. This makes it a perfect tool to measure volatility. For more, see How to Use ATR in a Forex Strategy.

4. Support/Resistance Indicators

Support and resistance is key to technical analysis. The concept refers to the price levels on charts that form barriers to an asset price being pushed in a given direction. For more, see our article on Identifying Support and Resistance and make sure you consider the indicators below.

Pivot Points

Pivot Points are one of the most widely used in all markets including equities, commodities, and Forex. They are created using a formula composed of high, low and close prices for the previous period. Traders use these lines as potential support and resistance levels, levels that price might have a difficult time breaking through.

Donchian Channels

Price channels or Donchian Channels are lines above and below recent price action that show the high and low prices over an extended period of time. These lines can then act as support or resistance if price comes into contact with them again. For a deeper look at using this tool successfully, read Breakout Trades and the Power of Price Channels.

Cardano (ADA) Price Analysis: Correction and then $1? -Key Insights

Cardano (ADA) Price Analysis: Correction and then $1? -Key Insights

Cardano (ADA) price tumbled toward $0.57 on Monday morning, a 16% pull-back from the  20-month peak of $0.68 recorded on Dec 14. Despite the ongoing retracement, on-chain data shows that Cardano has not recorded a major deterioration in the fundamental growth metrics.

Can the growing number of new entrants trooping into the Cardano ecosystem improve ADA’s price rebound prospects?

Trading Derivatives carries a high level of risk to your capital and you should only trade with money you can afford to lose. Trading Derivatives may not be suitable for all investors, so please ensure that you fully understand the risks involved, and seek independent advice if necessary. A Product Disclosure Statement (PDS) can be obtained either from this website or on request from our offices and should be considered before entering into a transaction with us. Raw Spread accounts offer spreads from 0.0 pips with a commission charge of USD $3.50 per 100k traded. Standard account offer spreads from 1 pips with no additional commission charges. Spreads on CFD indices start at 0.4 points. The information on this site is not directed at residents in any country or jurisdiction where such distribution or use would be contrary to local law or regulation.


Cardano Continues to Attract High Volume of ‘New User’ Transactions

Cardano emerged the second-best performing Layer-1 altcoin last week, behind Avalanche (AVAX) ecosystem. The Cardano DeFi ecosystem witnessed a 185% spike to $444 million, driving ADA price to a 20-month peak of $0.68. The bears narrowly managed to avert a $0.70 retest and have imposed 16% retracement since then.

However, the Cardano has not recorded major deterioration in its fundamental growth metrics. Firstly, the TVL continues to trend around $400 million range. But more importantly, on-chain data trends show that new users are still trooping in to Cardano ecosystem with fresh capital.

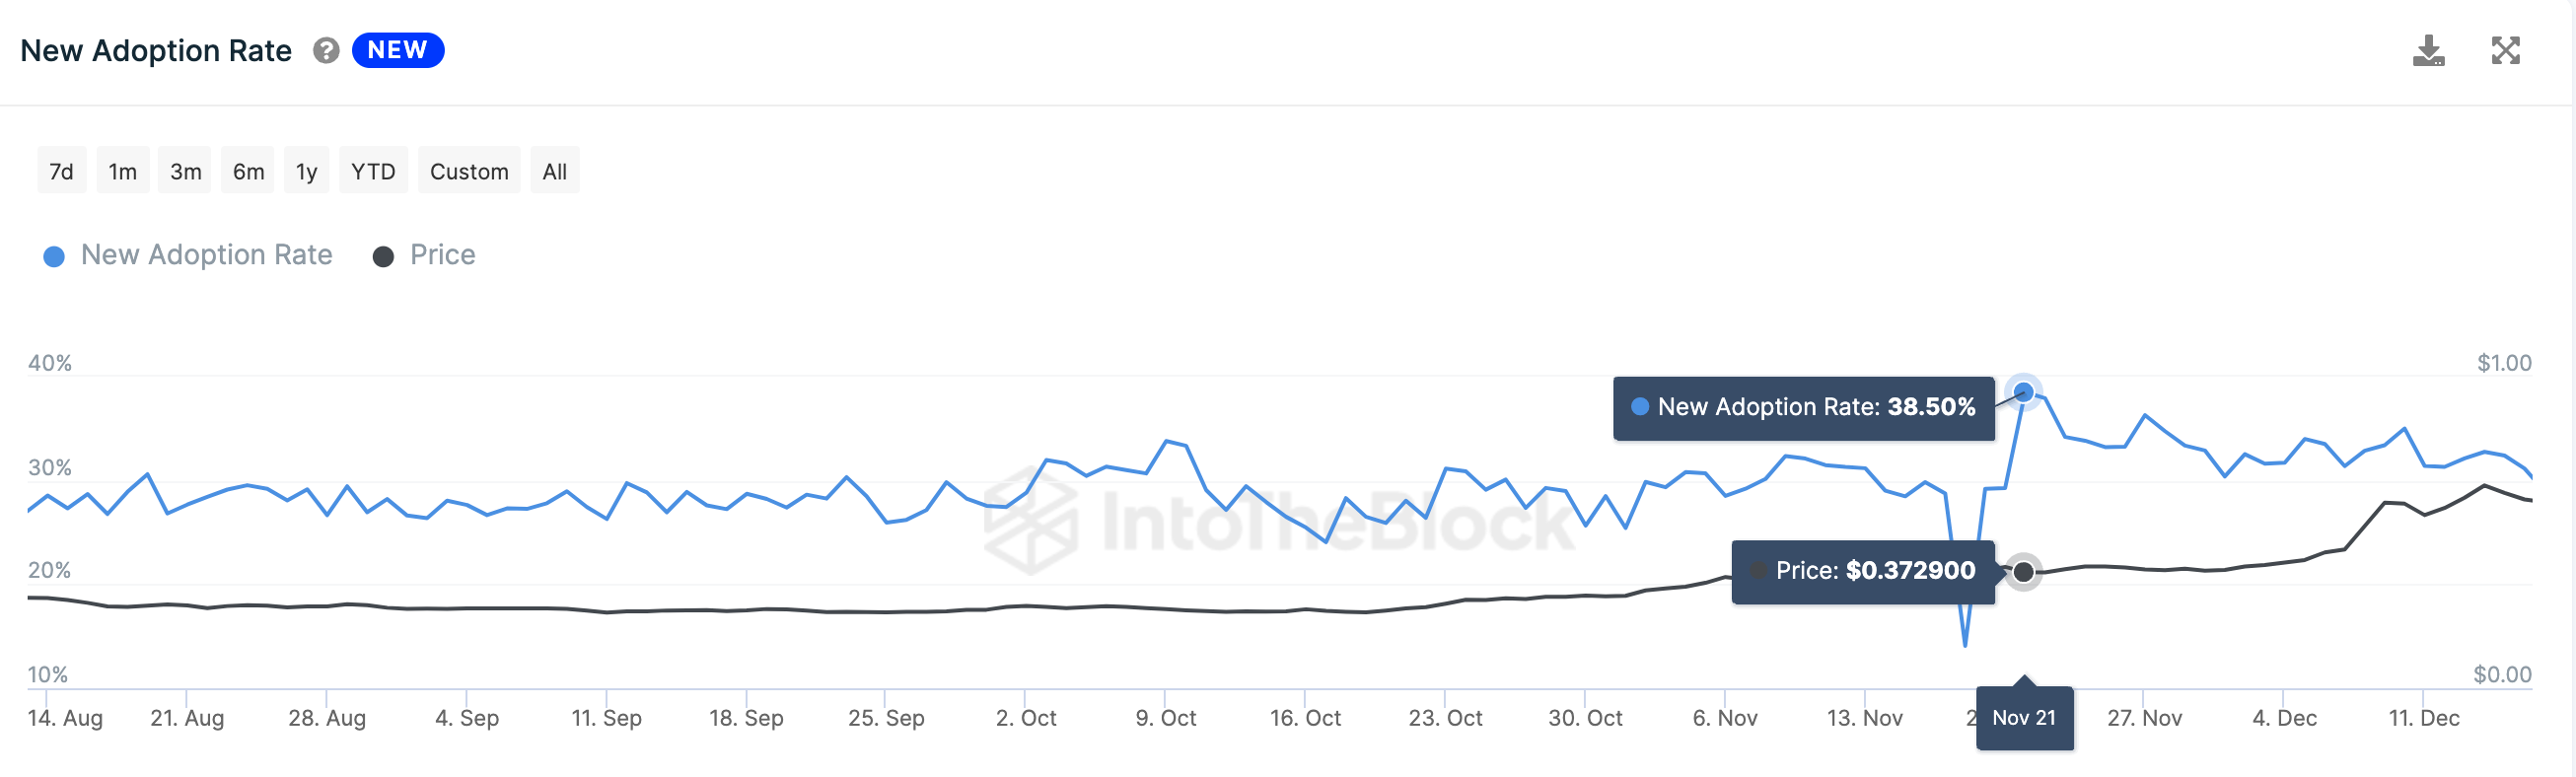
According to IntoTheBlock, Cardano new adoption rate has trended above 30% for the better part of the past month, since hitting a 60-day peak of 38.50% on Nov 21 which had set off the initial price breakout

As seen below, the Cardano New Adoption rate has not recorded a significant drop off despite the price correction this week. This signals that ADA is still currently attracting demand courtesy of usually high number new joiners.

Cardano (ADA)  New Adoption Rate vs. Price. Source: IntoTheBlock

Cardano (ADA)  New Adoption Rate vs. Price. Source:IntoTheBlockThe New Adoption Rate metric measures the percentage of total active addresses that conducted their first transaction on a given day. This provides clear insights into the rate at which crypto investors are bringing new money into the ADA spot markets.

When new user adoption increases during a price correction, it signals that the underlying token is still attracting high demand and could be primed up for an early rebound.

ADA Price Forecast: Possible Rebound toward $1

From an on-chain perspective the influx of new capital from the new entrant put ADA price is good stead for a possible rebound toward $1, once the current consolidation phase is over.

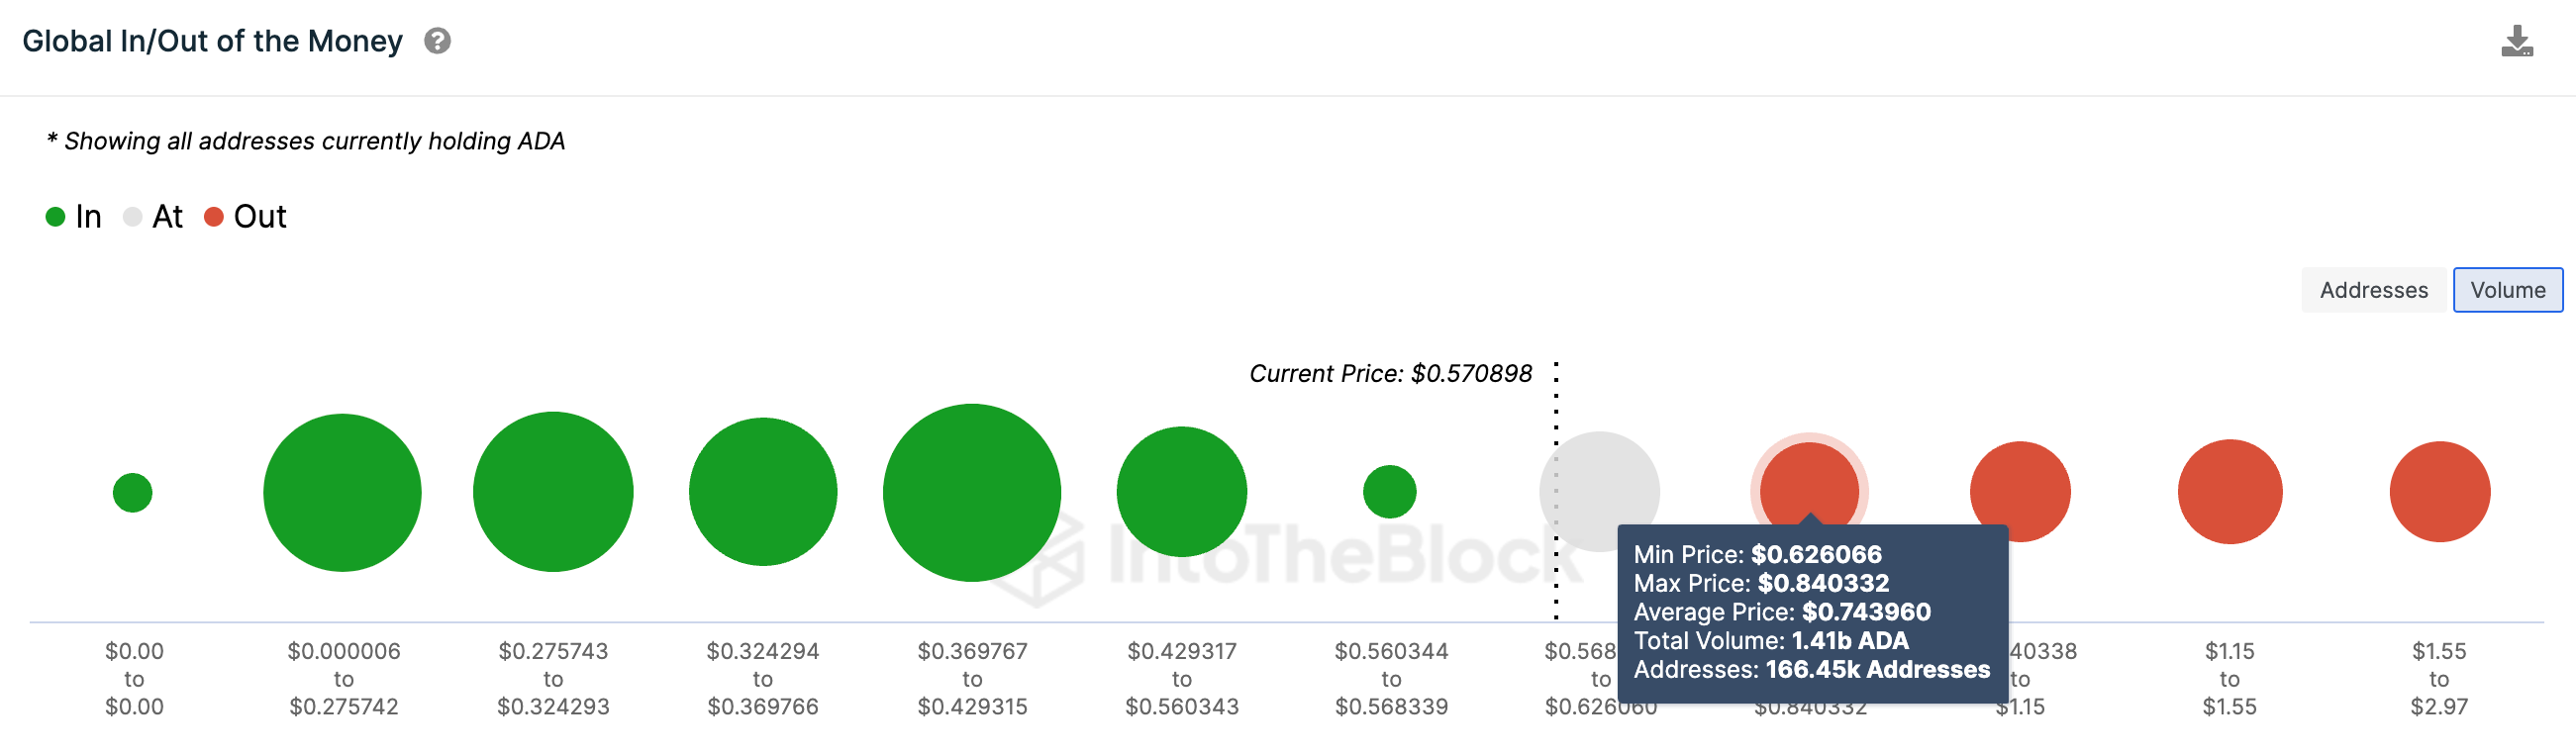
The In/Out of the Money Around Price (IOMAP) data, which groups the current ADA holders based on their historical entry prices, also affirms this optimistic outlook. It shows that the $0.74 area poses the largest resistance to Cardano’s price rebound mission to reclaim $1.

As seen below, 166,450 current holders had bought 1.41 billion ADA at a minimum price of $0.74. Hence, Cardano price could suffer another retracement if those holders look to take some profits, after over 1-year of holding at a loss.

But if Cardano continues to attract fresh capital from new users, ADA price will likely smash that resistance has reclaim $1 as predicted.

Cardano (ADA) Price Forecast | GIOM data | Source: IntoTheBlock

Cardano (ADA) Price Forecast | GIOM data | Source: IntoTheBlockOn the downside, the bears could invalidate that positive prediction if ADA price dips below the critical psychological resistance at $0.50. But, in that case, the 481,980 million holders that bought 3.17 billion ADA at the maximum  price of $0.56 could offer significant support.