Engulfing Formations for Price Action Trading

Engulfing Formations for Price Action Trading

Engulfing candlesticks are fairly simple to explain, it’s simply a candle that takes out the entirety of the prior candle. But, working with them can be a bit more difficult and new traders are seemingly perplexed by the formation so, we’ll dig into this topic in a little more depth in this article. We do have some additional materials available on the topic in DailyFX Education. We looked at bearish engulfing candlesticks and bullish engulfing in different articles and, in this piece, we’ll incorporate that formation into our broader price action education as these can be very actionable when they do show up.

The important takeaway is that the engulfing candlestick body must take out the entirety of the prior candlestick body – indicating a momentum-driven reversal.

Defining the Engulf

There are two types of engulfing patterns. The first and most common is an engulfing of the entire prior body. In FX or futures markets, where prices are streaming 24 hours a day, these are far more common as the end of one bar simply starts the next. This means that the prior candle’s close is this candle’s open, so if we’re going to see an engulfing formation take place, buyers will need to step in (in terms of a bullish engulf) to completely eclipse the move from the prior bar – and this bar still needs to close above the prior bar’s open.

The second brand of engulf is more rare but this would include a full engulf of the prior candle’s wicks. This would illustrate a wider range from the prior bar but, similarly, both show a possible shift in momentum.

Is one better than the other? That’s difficult to say as they both illustrate the same kind of thing but, the second engulf with full cover of the prior candle’s wicks does make a strong statement about an increasing rate of activity.

On the below hourly chart of GBP/JPY I’ve pointed out a handful of these patterns that appeared between April 17th and April 22nd, 2022. The engulf located on the far right of the chart is the only that was a full candle engulf, where even the wicks of the engulfing candlestick took out the prior bar’s entire range.
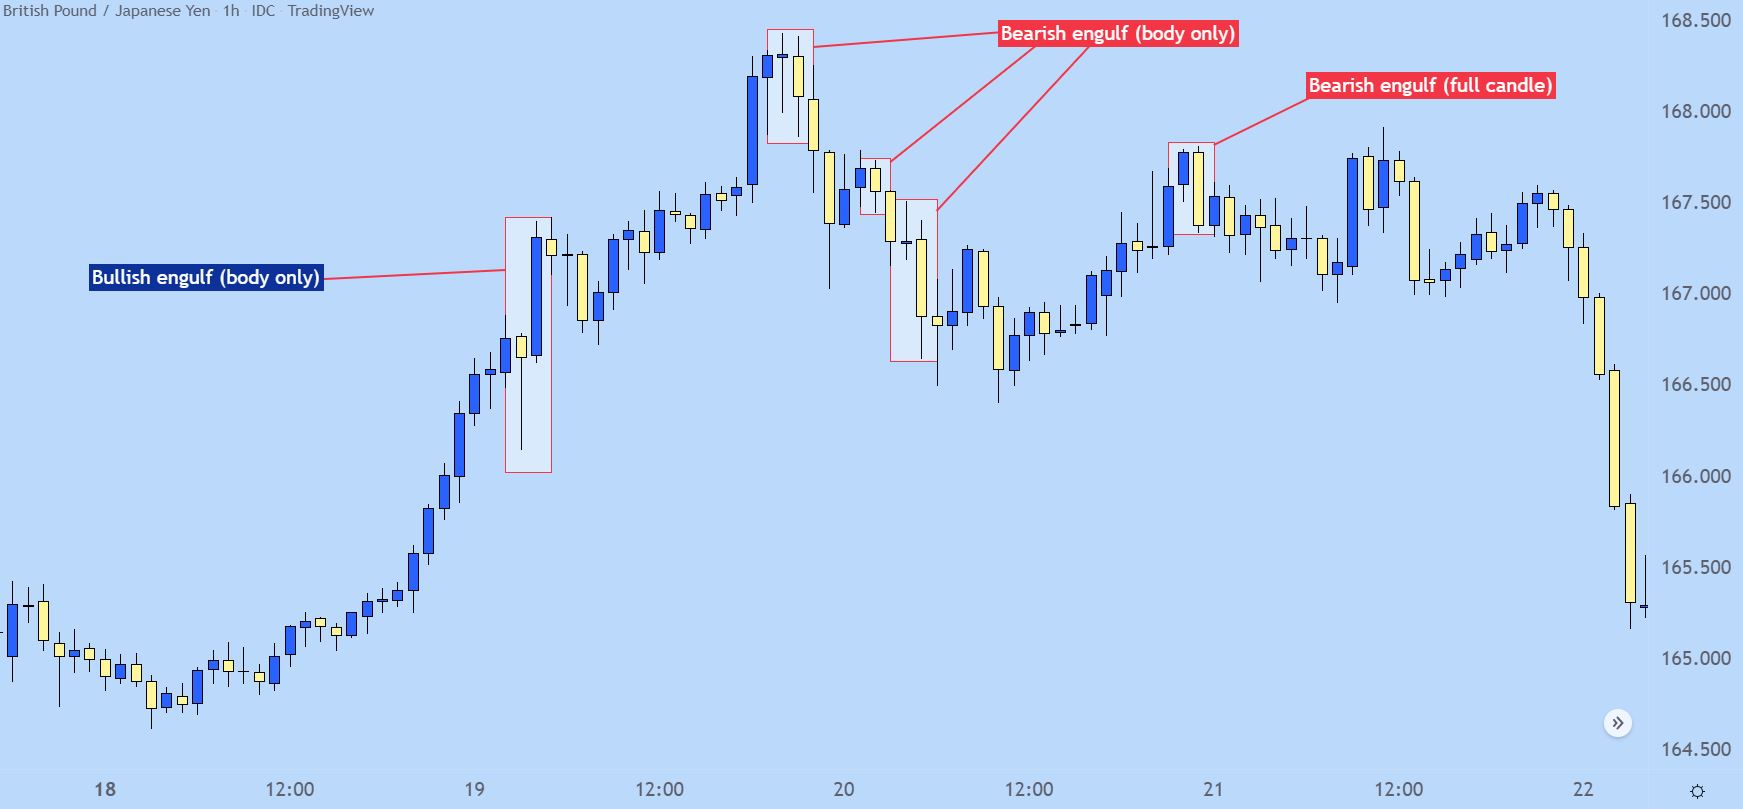
GBP/JPY Hourly Price Chart

Chart prepared by James Stanley ;GBP/JPY hourly chart, April 18 – April 22, 2022

Types of Engulfing Candlesticks

The engulfing candlestick says quite a bit and will often be approached with anticipation of something continuing to happen. There’s a few specific situations where this can come up as important, and I’ll look at a few of those below.

The Engulfing Reversal

Reversals are notoriously tough because, as traders, we’re basically saying ‘what’s been happening – is about to change.’ And by and large it’s often more advisable to follow the status quo, but when an engulfing candlestick shows up at the top of a trend that can be a big statement. And, it could also be a sign of what’s to come.

On the below GBP/JPY chart, I’m looking at a trend on the daily chart from Q4 of 2021. I’ve noted a few engulfs on the left side of the chart but the ‘reversal’ setup can be found towards the top of the below illustration, in red. At the time, the trend had jumped by more than 900 pips in the first three weeks of October, and then this bar showed up on the daily chart.

It wasn’t a full candle reversal, as only the body of this candle engulfed the prior candle’s body. This was a clear sign in shifting momentum that eventually played through for a really strong reversal. And, notably, the three engulfs that I pointed out before that reversal formation showed up – those also so continuation on the day after they had printed, further illustrating the potential for momentum to continue after one of these engulfing patterns print.

GBP/JPY Daily Price Chart (Sept -Dec 2021)

Chart prepared by James Stanley; GBP/JPY daily chart, Sep. – Dec. 2021

The ‘In Trend’ Engulf

Timing trends can be tricky. There’s been an observable bias so there’s a directional pull that you’d like to incorporate but, it seems that many have the same idea at the same time and this can keep trends from pulling back far enough to afford an attractive entry point. And – when the pullback does come about – how is the trader to know that it’s a pullback and not a reversal? What’s the proper way of timing re-entry in the trend-side direction?

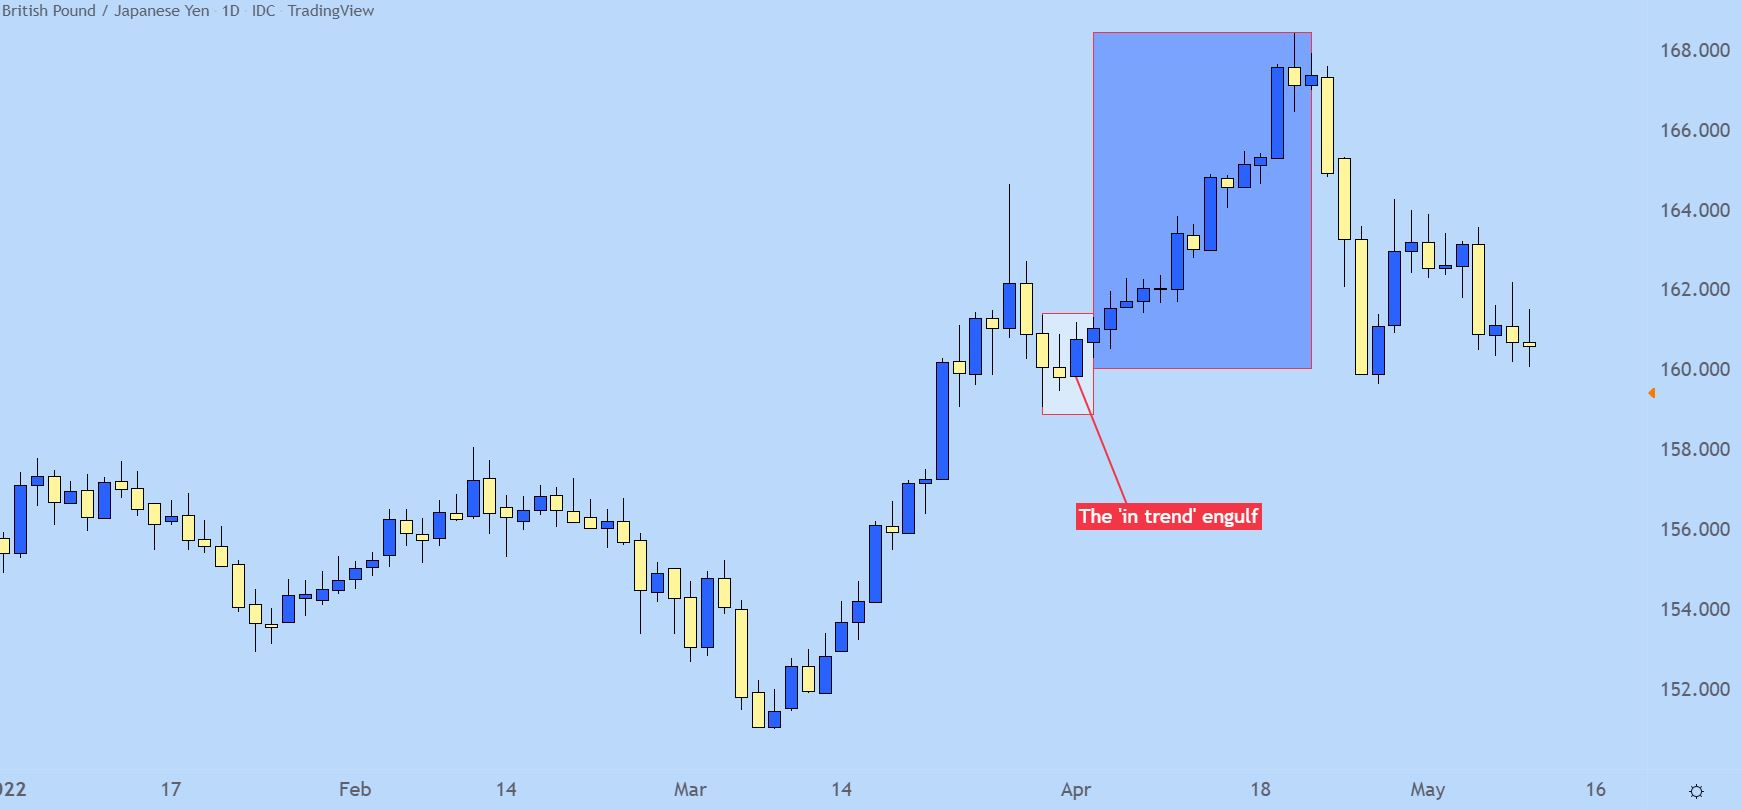
The ‘in trend’ engulfing candlestick can help with this. It’s basically looking for a pullback, followed by an engulf in the direction of the trend, thereby giving the idea that buyers are back and the trend may be ready to continue up to fresh highs.

GBP/JPY Daily Price Chart (2022 – May 2022)
The Counter Trend Engulf

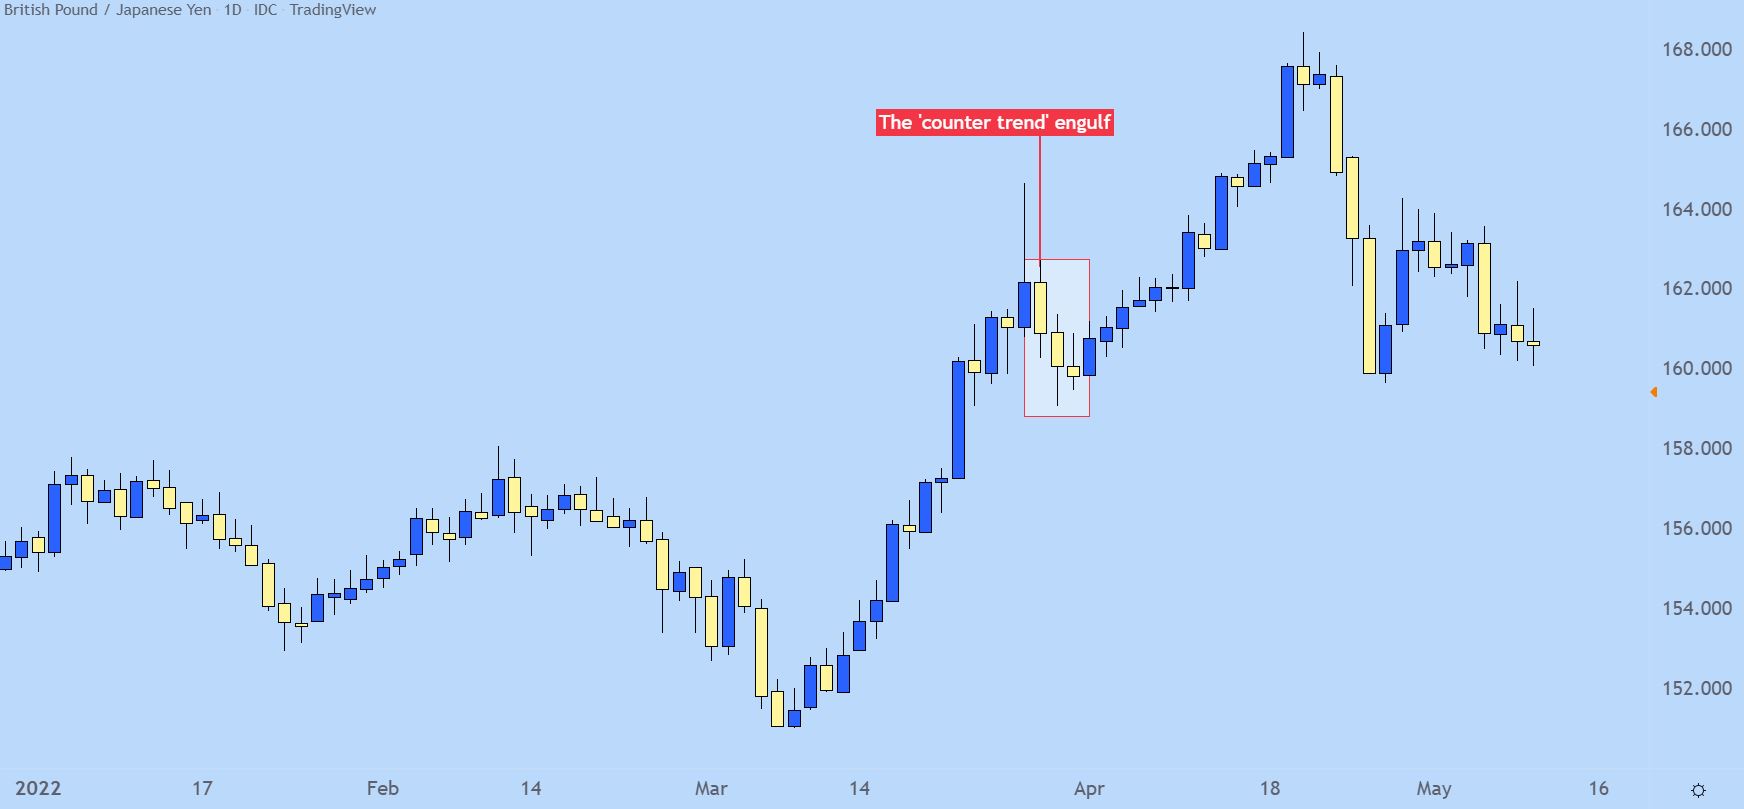
On that topic of trends – for traders looking to fade the move, engulfs can help there, as well. The essential logic would be waiting for an engulf to print in the opposing direction of the trend, which may turn into a bigger picture reversal.

Sure, not everyone will turn into a full-fledged reversal. But – it can help to open the door for reversal strategies and the momentum that can carry through such a formation will usually allow for some fast counter-trend movement.

GBP/JPY Daily Price Chart
 

Hang Seng Index, ASX 200, Nikkei 225: Futures Flash Red After Overnight US Sell-Off

Hang Seng Index, ASX 200, Nikkei 225: Futures Flash Red After Overnight US Sell-Off

Overview of the Wednesday Session

On Wednesday, the Nikkei led the ASX 200 and the Hang Seng Index into positive territory.

Overnight US economic indicators from Tuesday and gains across the US equity markets set the tone for the Wednesday Asian session.

Trading Derivatives carries a high level of risk to your capital and you should only trade with money you can afford to lose. Trading Derivatives may not be suitable for all investors, so please ensure that you fully understand the risks involved, and seek independent advice if necessary. A Product Disclosure Statement (PDS) can be obtained either from this website or on request from our offices and should be considered before entering into a transaction with us. Raw Spread accounts offer spreads from 0.0 pips with a commission charge of USD $3.50 per 100k traded. Standard account offer spreads from 1 pips with no additional commission charges. Spreads on CFD indices start at 0.4 points. The information on this site is not directed at residents in any country or jurisdiction where such distribution or use would be contrary to local law or regulation.

US housing starts surged by 14.8% in November. The sharp increase raised expectations of a soft landing despite building permits falling by 2.5%.

The US equity markets responded to the housing sector figures. On Tuesday, the Nasdaq Composite Index ended the day up 0.66%. The Dow and the S&P 500 saw gains of 0.68% and 0.59%, respectively.

On Wednesday, the Asian economic calendar had a limited impact on market risk sentiment. Trade data from Japan reflected a weak demand environment. Nonetheless, the weaker import and export figures supported the Bank of Japan’s decision to leave rates in negative territory.

There were no surprises from China, with the PBoC leaving the one-year and five-year loan prime rates at 3.45% and 4.20%, respectively. The markets expect further stimulus measures from Beijing to bolster the Chinese economy.

US Consumer Confidence and US Session Losses to Set the Tone

On Thursday, US consumer confidence numbers from Wednesday will draw investor interest. The CB Consumer Confidence Index increased from 101.0 to 110.7 in December. A pickup in consumer confidence could support consumer spending and bets on a soft landing. Notably, the upswing was not enough to suggest the need for a more hawkish Fed rate path.

10-year US Treasury yields declined by 2.14% to 3.849%. However, the US equity markets ended the Wednesday session in negative territory. The Dow and S&P 500 fell by 1.27% and 1.39%, respectively. The Nasdaq Composite Index slid by 1.50%. Investors reacted to FedEx (FDX) cutting its revenue forecast, testing market bets on a soft landing.

China and the Bank of Japan Remain in Focus

On Thursday, investors must monitor stimulus chatter from Beijing and Bank of Japan commentary. Steps towards a substantial stimulus package from Beijing would drive demand for riskier assets. However, Bank of Japan commentary favoring a pivot from negative rates would impact the Nikkei and export stocks.

There are no economic indicators from the Asian session to influence market risk appetite.

In the futures markets, the ASX 200 and Nikkei were down 74 and 550 points, respectively.

ASX 200

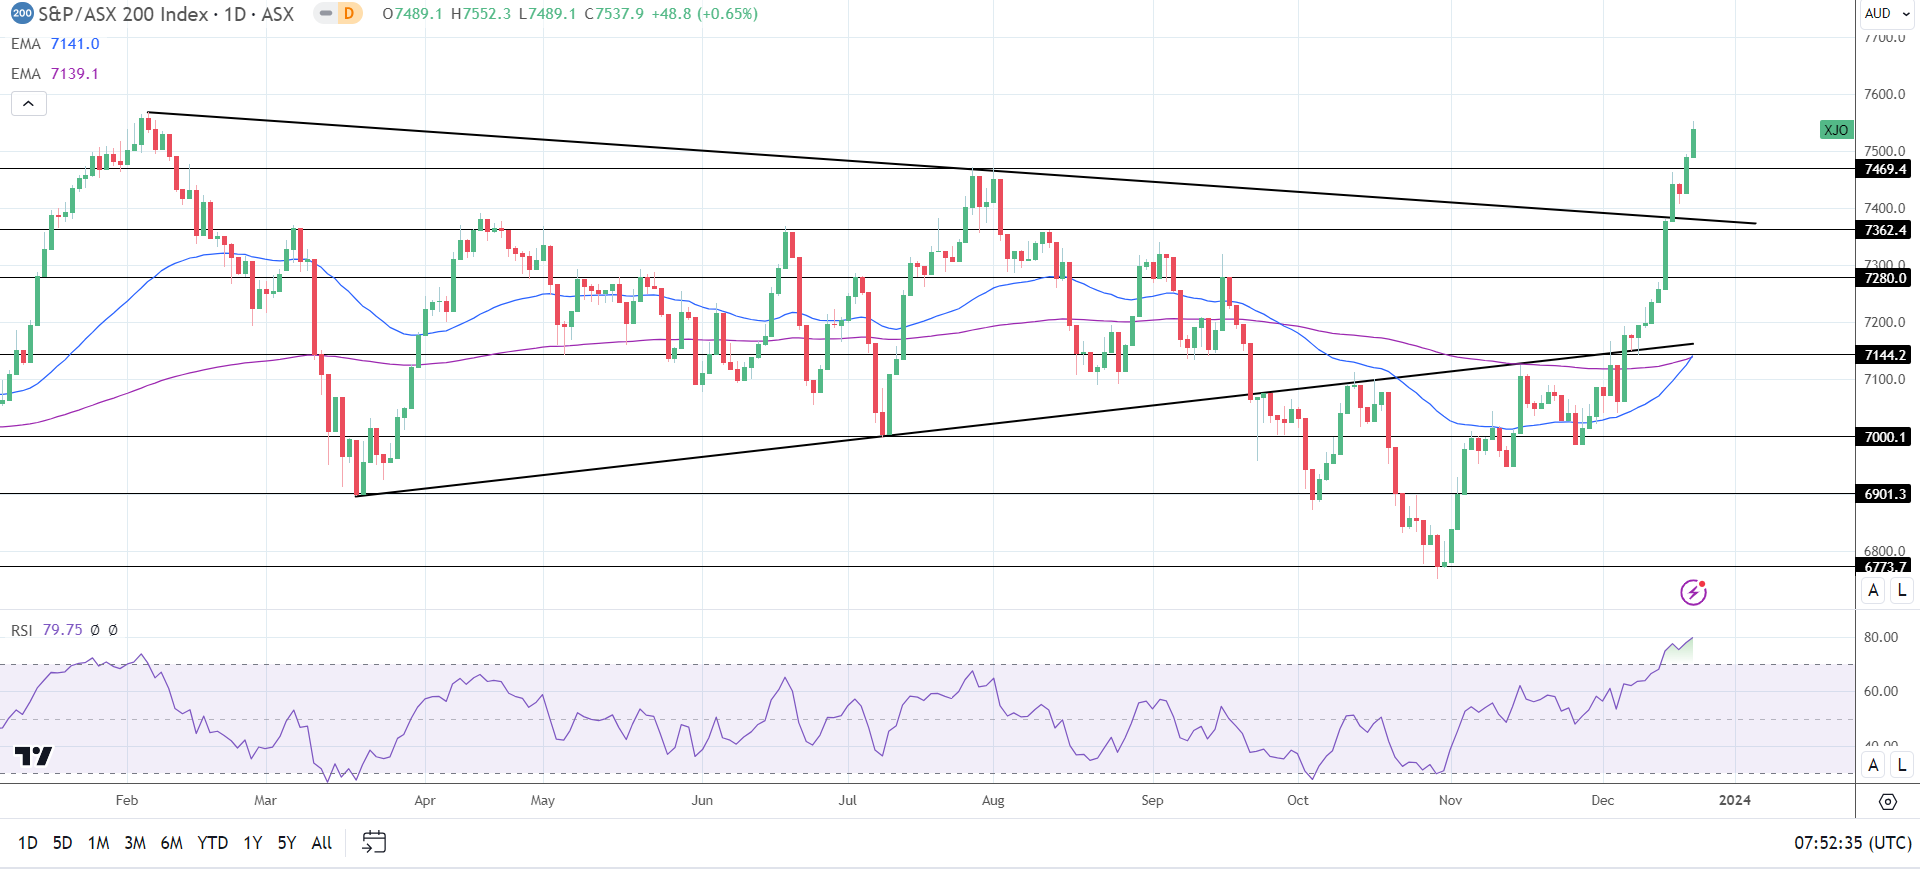
ASX 200 saw green on Wednesday.
ASX200 211223 Daily ChartThe ASX 200 ended the Wednesday session up 0.65%. Tech stocks continued to climb mid-week, with the S&P ASX All Technology Index (XTX) rising by 0.21%. The big four banks and gold stocks aligned with consumer stocks, contributing to gains for the session.

Gold (XAU/USD) stocks Northern Star Resources Ltd. (NST) and Evolution Mining Ltd. (EVN) ended the day up 1.64% and 2.01%, respectively.

The big four banks also had a positive session. Westpac Banking Corp. (WBC) and ANZ Group Holdings Ltd (ANZ) gained 1.02% and 0.70%, respectively. Commonwealth Bank of Australia (CBA) and National Australia Bank Ltd. (NAB) rose by 0.33% and 0.66%, respectively.

BHP Group Ltd (BHP) and Rio Tinto Ltd. (RIO) saw gains of 0.36% and 0.10%, respectively. Fortescue Metals Group Ltd. (FMG) declined by 0.75%.

Oil stocks also had a mixed session. Woodside Energy Group Ltd (WDS) rose by 0.61%, while Santos Ltd (STO) declined by 0.26%.

Hang Seng Index

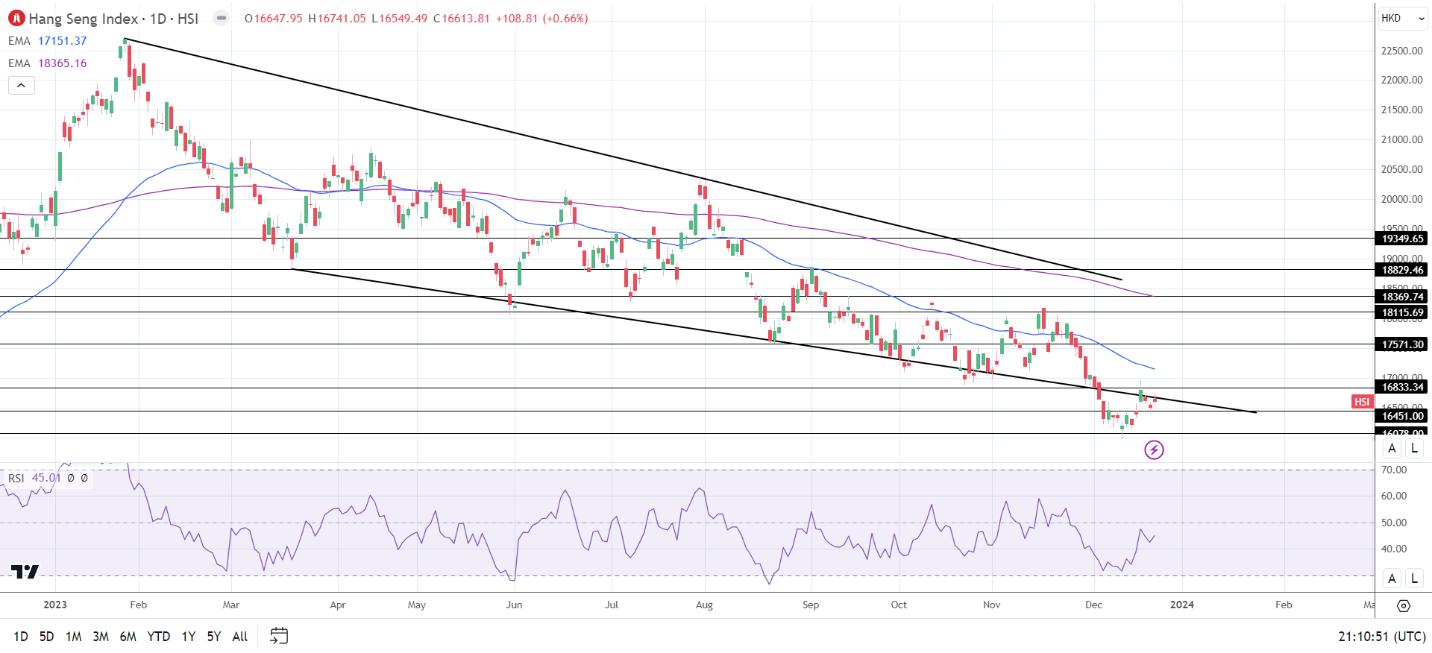
Hang Seng Index enjoyed a positive Wednesday session.
HSI 211223 Daily ChartThe Hang Seng Index gained 0.66% on Wednesday. The Hang Seng Tech Index (HSTECH) increased by 0.51%, with the Hang Seng Mainland Properties Index (HSMPI) rising by 1.55%.

Alibaba (9988) rallied 2.65% as investors reacted to news of an internal reshuffle. Tencent (0700) gained 0.77%.

However, bank stocks had a mixed session. HSBC (0005) rose by 1.49%. China Construction Bank (0939) and Industrial Commercial Bank (1398) fell by 0.22% and 0.54%, respectively.

The Nikkei 225

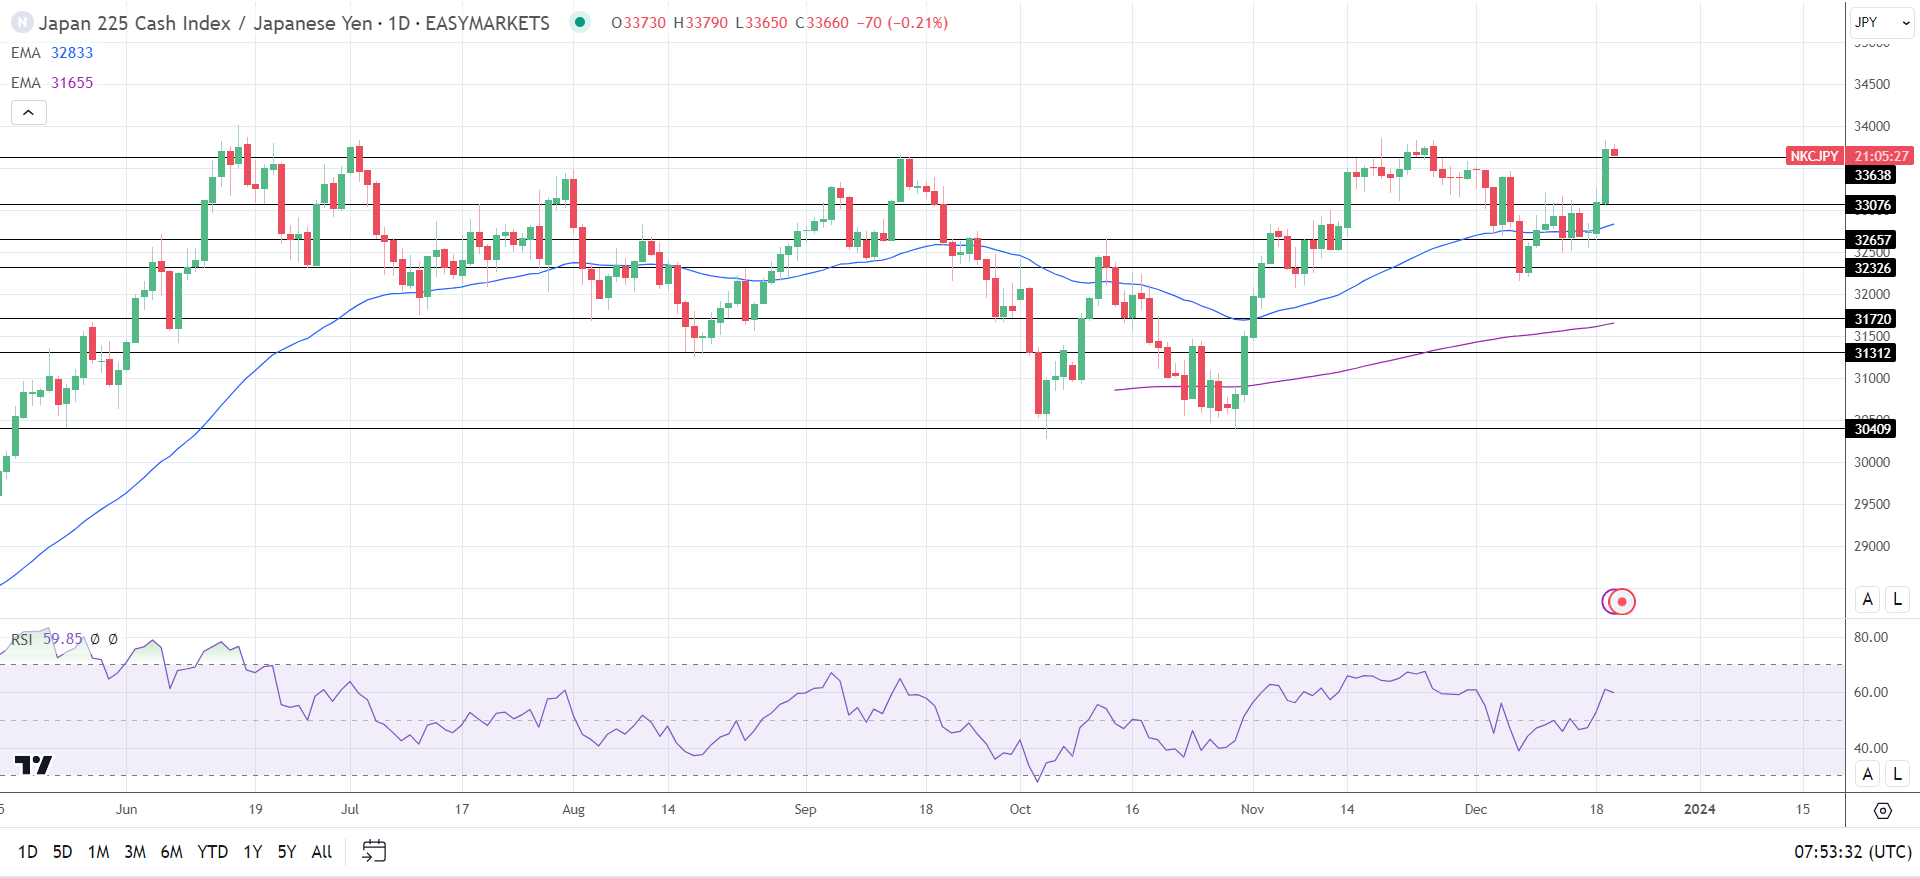
Nikkei rallied for a second consecutive session on the BoJ hold.
Solana Price Analysis: SOL Flips XRP Market Cap  —$100 Next Target?

Solana Price Analysis: SOL Flips XRP Market Cap —$100 Next Target?

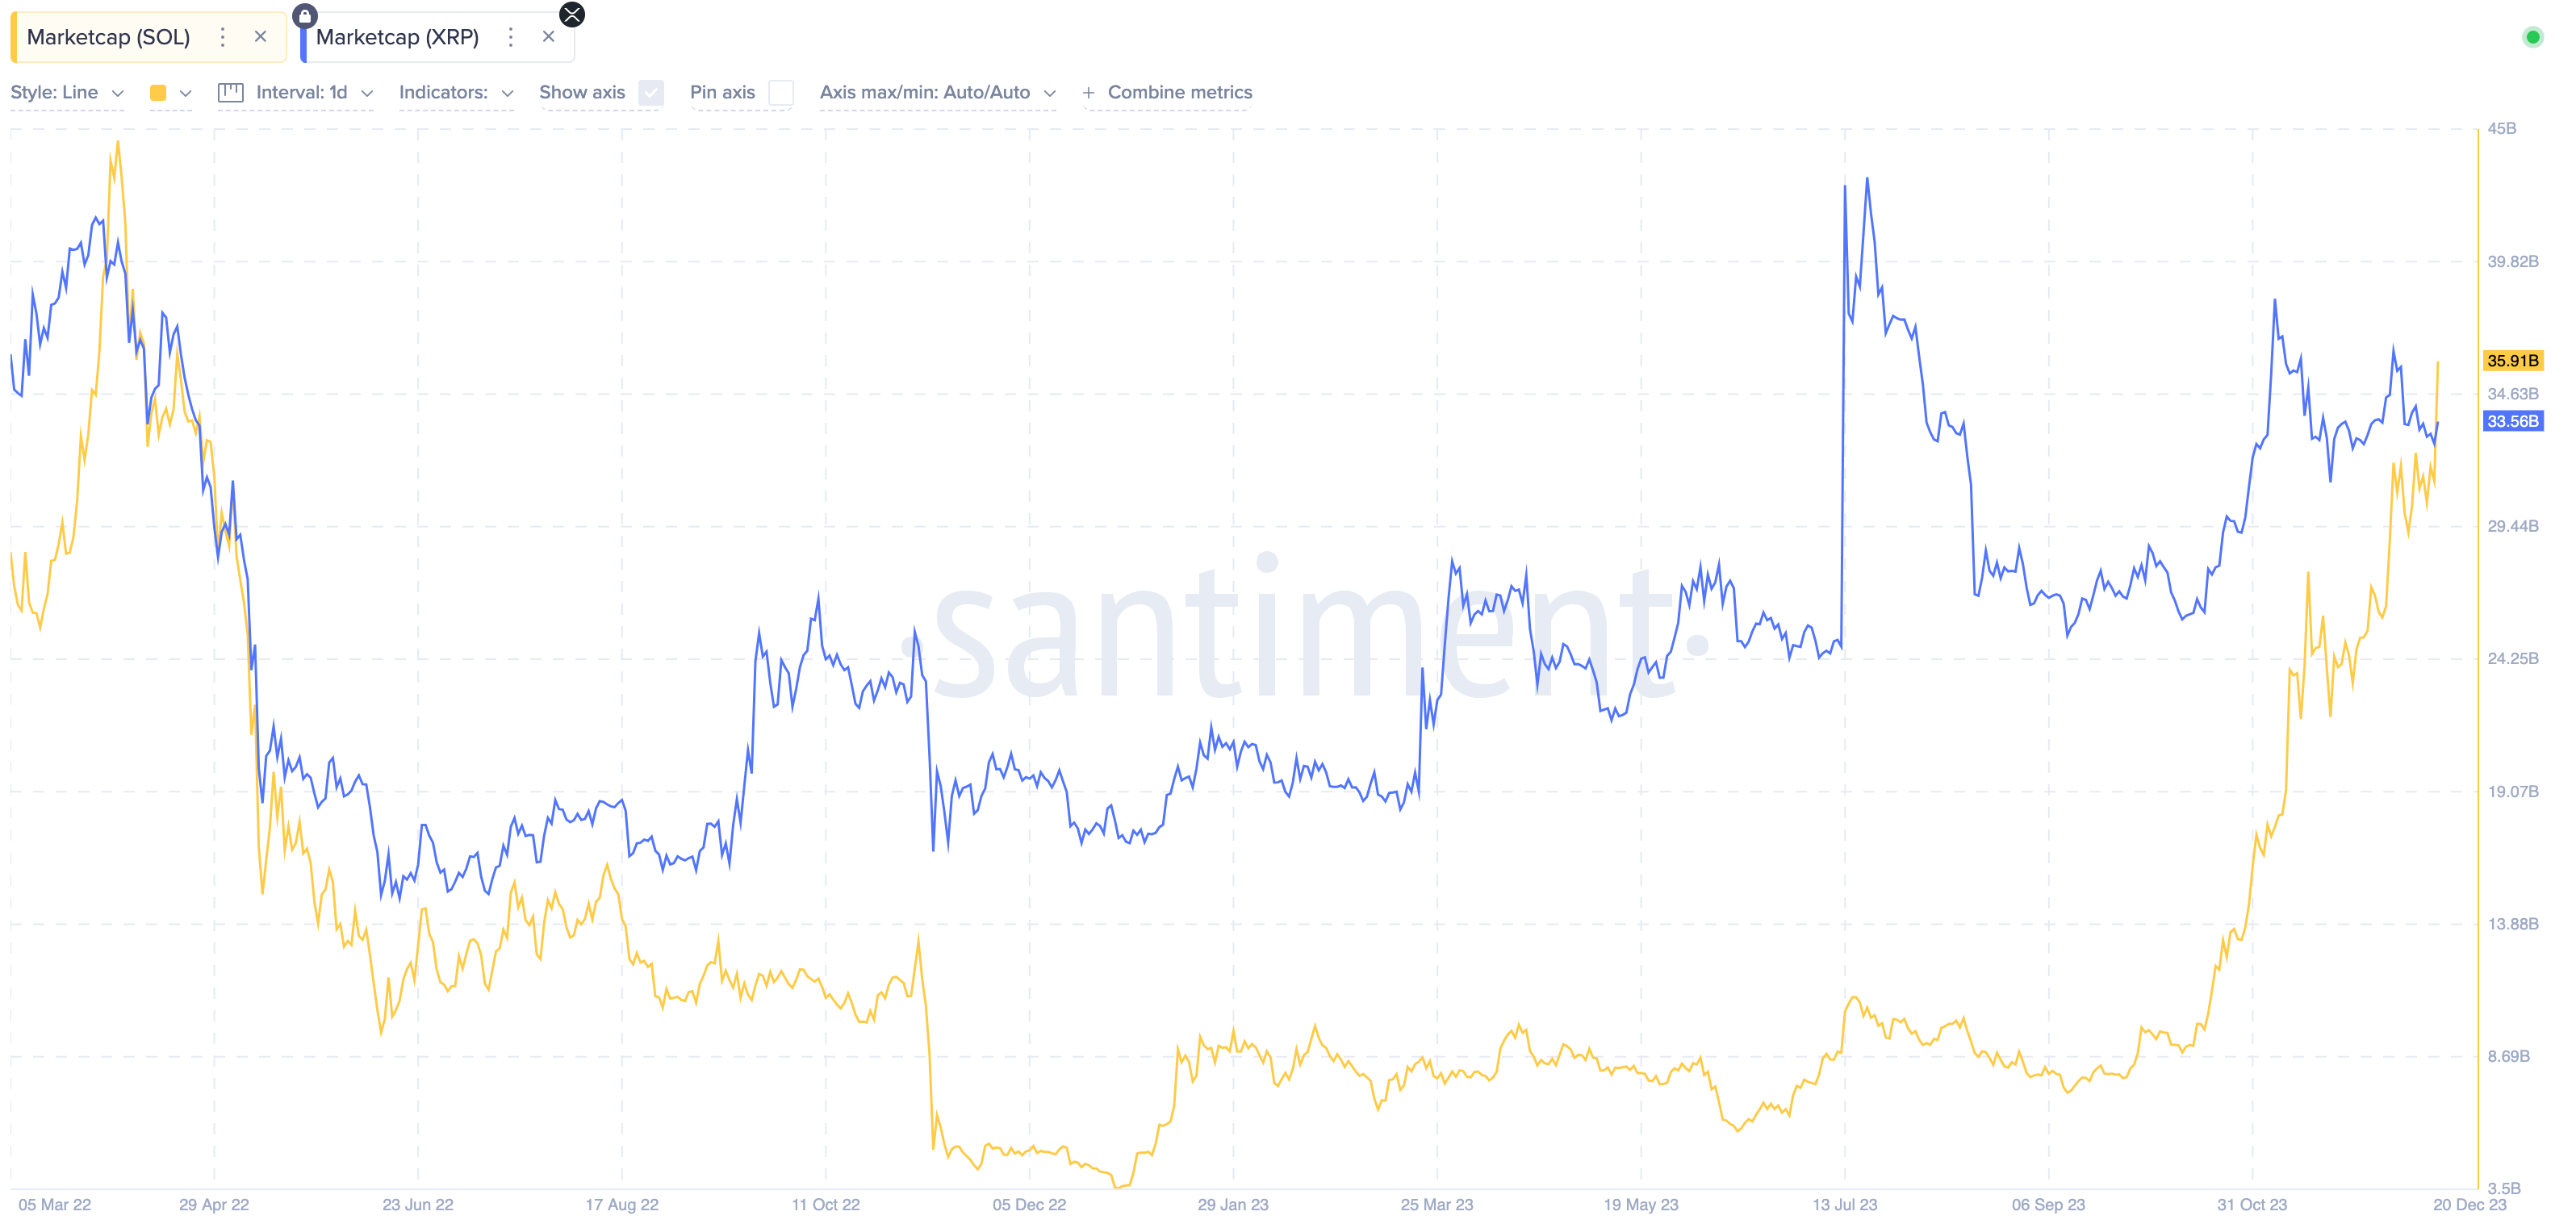
Solana (SOL) price crossed $84 on Wednesday, Dec 20, bringing its total market capitalization above $34 billion, $1 billion more than Ripple (XRP). Derivatives data analysis highlights how SOL traders are doubling down on their bullish positions following the latest price breakout.

Trading Derivatives carries a high level of risk to your capital and you should only trade with money you can afford to lose. Trading Derivatives may not be suitable for all investors, so please ensure that you fully understand the risks involved, and seek independent advice if necessary. A Product Disclosure Statement (PDS) can be obtained either from this website or on request from our offices and should be considered before entering into a transaction with us. Raw Spread accounts offer spreads from 0.0 pips with a commission charge of USD $3.50 per 100k traded. Standard account offer spreads from 1 pips with no additional commission charges. Spreads on CFD indices start at 0.4 points. The information on this site is not directed at residents in any country or jurisdiction where such distribution or use would be contrary to local law or regulation.

Solana Market Cap Flips XRP to Claim 5th Position on the Crypto Rankings

Solana broke some historic records following another double-digit growth performance on Wednesday Dec 20. Firstly, SOL price hit a new 2023 peak of $84 to replace Avalanche (AVAX) to emerge the best performing asset in the top 10 crypto market rankings over the last 7-days, but there’s more.

In a more eye-catching fashion, Solana market capitalization crossed $34.4 billion, leapfrogging Ripple (XRP) to become 5th most-valuable cryptocurrency asset.

Solana (SOL) vs. Ripple (XRP) Market Cap | Source: Santiment
Solana (SOL) vs. Ripple (XRP) Market Cap | Source: SantimentThe Santiment chart above shows that the last time Solana market cap was higher than XRP, was back in April 2022. But since then, Solana price has struggled having been embroiled in the multiple controversies.

Solana network had suffered a series of network outages in 2022. And the Solana NFT ecosystem was heavily criticized for being a cesspool of rugs pulls.

But chief of the issues that possessed significant concern for investors, what the embattled FTX exchange’s skewed exposure to Solana.

Court fillings in September confirmed that the defunct exchange held over $1.2 billion in SOL, which at the time was feared to be awaiting full liquidation to repay creditors.

However, after FTX fund administrators were spotted moving SOL holdings into stalking contracts, it buoyed investors confidence that all of the SOL coins will likely not be liquidated in one fell swoop as initially feared.

In effect investors have begun piling on capital into the Solana ecosystem as the crypto market rally began in mid-October.

Derivatives Traders Are Doubling Down on their Positions

Based on the data trends observed in the Solana derivatives markets SOL price looks set to enter further gains. According to crypto derivatives data tracking tool, Coinglass, majority of SOL traders were doubling down on their bullish SOL positions on Wednseday.

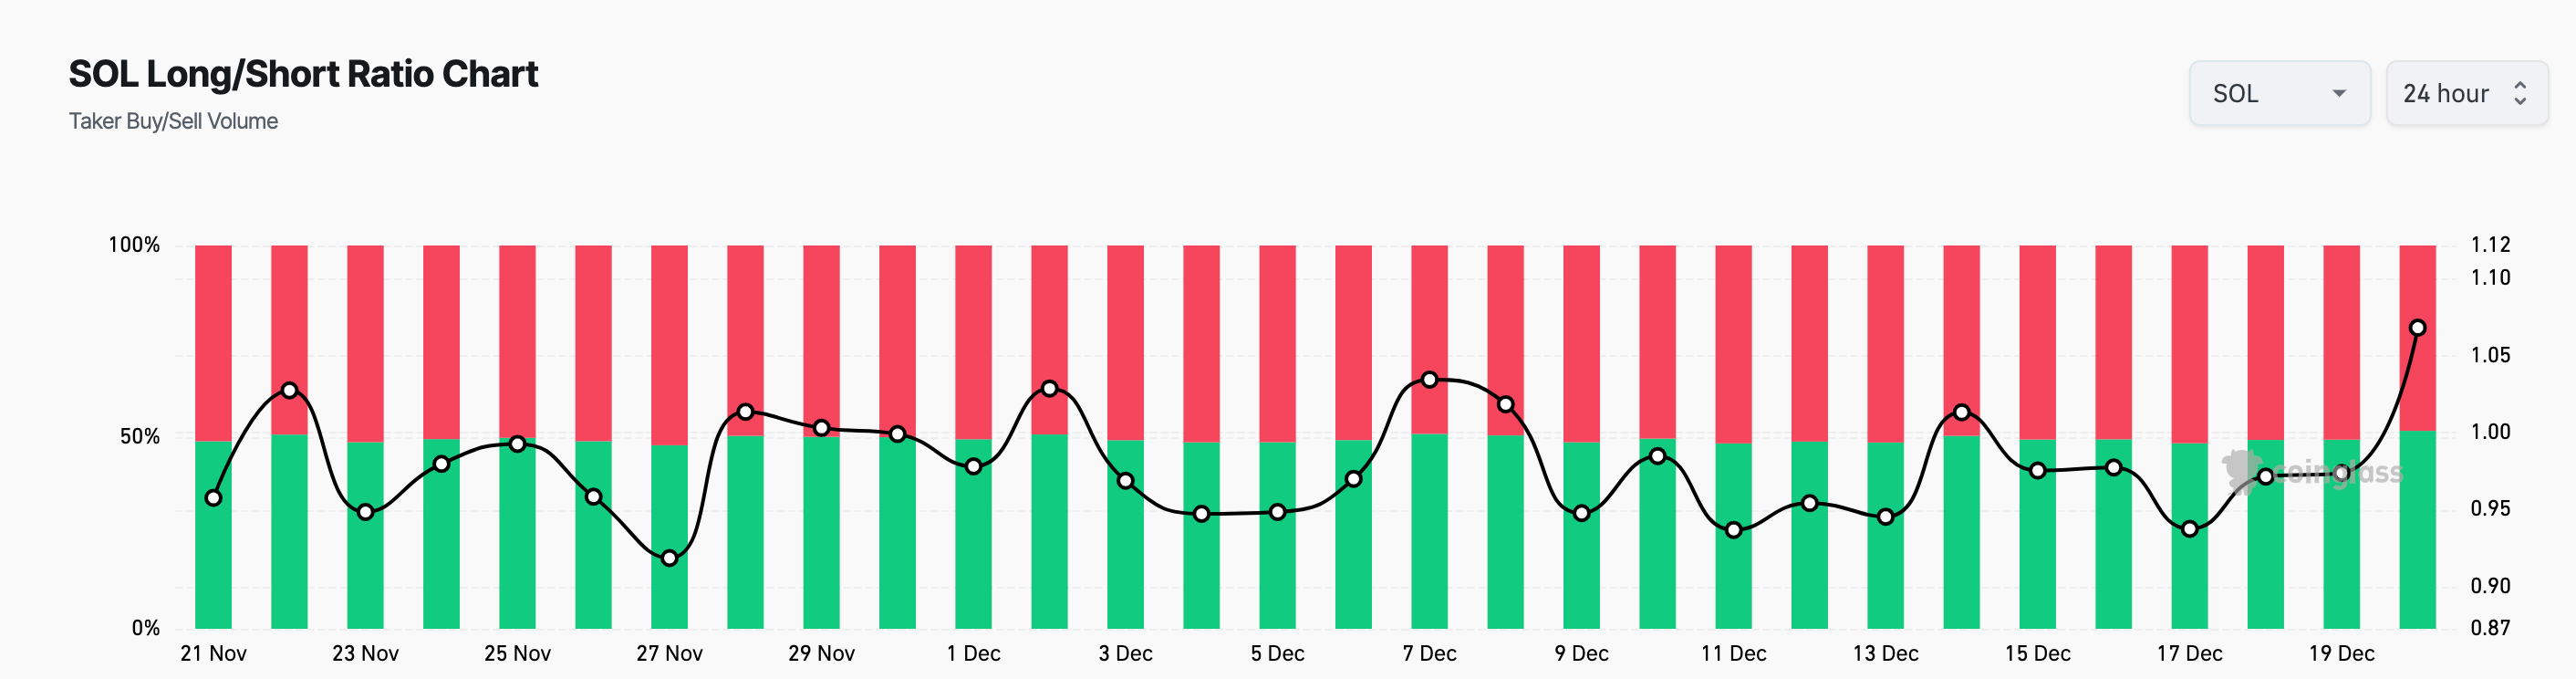
The chart below illustrates that SOL LONG/SHORT ratio rose to 1.07 on Dec 20, the highest in the last 30-days. This affirms that traders are increasingly betting on the Solana price rally to rise to new peaks in the days ahead.

Solana (SOL) LONG/SHORT ratio | Source: Coinglass
Solana (SOL) LONG/SHORT ratio | Source: CoinglassThe LONG/SHORT ratio is a derivatives trading metric that shows the proportion of newly opened positions that are bullist or bearish.

This ratio provides insights into market sentiment and the directional bias of traders. When the LONG/SHORT ratio is greater than 1, as observed above, it means more LONG positions were opened than SHORT during that trading period.

Hence, SOL LONG/SHORT ratio hitting a 30-day peak of 1.07 on Dec 20 can be taken as an indication of a prevailing bullish sentiment.

In summary, despite SOL price currently trading at a euphoric peak of $84, majority of traders are betting on an imminent $100 retest.

XRP News: Ripple Expands into Ireland with an Eye on Europe

XRP News: Ripple Expands into Ireland with an Eye on Europe

The Wednesday Overview

On Wednesday, XRP gained 1.90%, after a 1.13% loss on Tuesday. XRP ended the day at $0.6165. Significantly, XRP avoided sub-$0.60 price levels for the first time in three sessions.

Ripple Gets Central Bank of Ireland Approval for Digital Asset Services

On Tuesday, Ripple announced the Central Bank of Ireland approved Ripple Markets Ireland Limited as a registered Virtual Asset Service Provider (VASPs). On joining the VASPs list, Ripple Markets can provide digital asset services in Ireland.

Trading Derivatives carries a high level of risk to your capital and you should only trade with money you can afford to lose. Trading Derivatives may not be suitable for all investors, so please ensure that you fully understand the risks involved, and seek independent advice if necessary. A Product Disclosure Statement (PDS) can be obtained either from this website or on request from our offices and should be considered before entering into a transaction with us. Raw Spread accounts offer spreads from 0.0 pips with a commission charge of USD $3.50 per 100k traded. Standard account offer spreads from 1 pips with no additional commission charges. Spreads on CFD indices start at 0.4 points. The information on this site is not directed at residents in any country or jurisdiction where such distribution or use would be contrary to local law or regulation.

The July 2023 Programmatic Sales of XRP ruling has proven significant for Ripple and its expansion goals. In October, Ripple Markets APAC obtained a Major Payments Institution license from the Monetary Authority of Singapore. In November, the Dubai Financial Services Authority (DFSA) included XRP for use within the Dubai International Financial Centre (DIFC).

Before the Programmatic Sales ruling, global central banks and regulatory agencies hesitated to deal with Ripple.

Ripple Chief Legal Officer Stuart Alderoty lauded the approval, saying,

“Capping off incredible momentum in 2023 with the Central Bank of Ireland approving Ripple as a registered VASP to offer compliant crypto services. This year, we also received our full Major Payments Institution license from the MAS, and the Dubai Financial Services Authority approved XRP for use by licensed institutions with the DIFC.”

The Ripple Chief Legal Officer recognized the significance of the Programmatic Sales ruling, adding,

“Biggest crypto story of 2023: Gary Gensler suffered his ‘worst loss’ when Judge Torres ruled that XRP is not a security.”

Ripple CEO Brad Garlinghouse responded to the Central Bank of Ireland news, saying,

“Ripple is heading into 2024 with a compliance-first mindset (as we’ve always done).”

However, there were no SEC v Ripple case-related updates to influence investor sentiment. The SEC and Ripple are progressing through remedies-related discovery regarding the sale of XRP to institutional investors.

However, crypto-spot ETF-related news contributed to the positive Thursday session. Progress toward a BTC-spot ETF market drove buyer demand for BTC and the broader market.

XRP Price Action

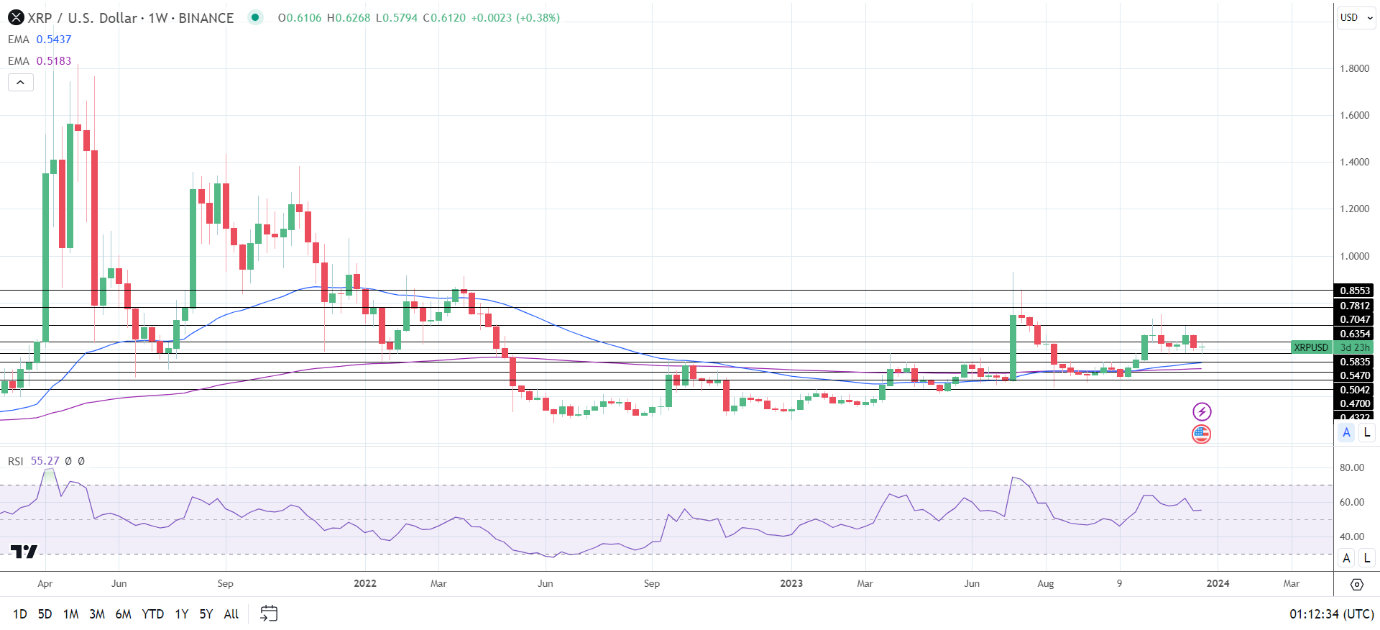
Weekly Chart sends bullish price signals.
XRPUSD 211223 Weekly Chart

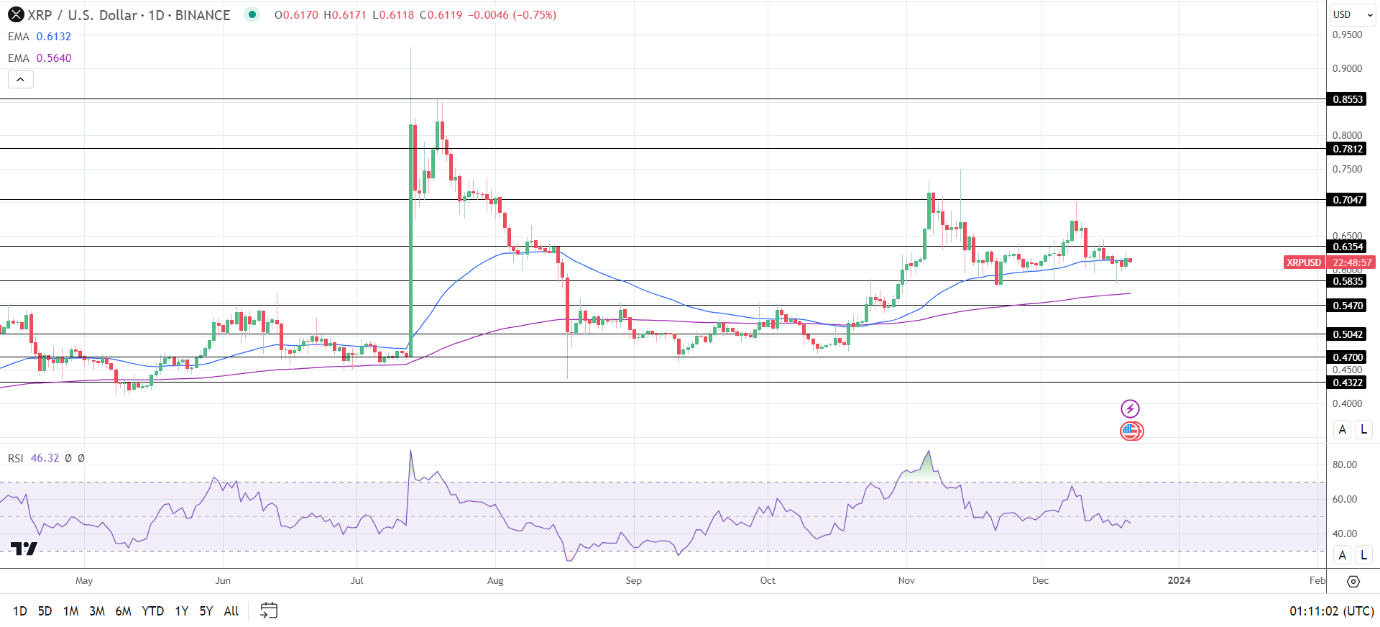
Daily Chart

XRP remained below the 50-day EMA while sitting above the 200-day EMA, affirming bearish near-term but bullish longer-term price signals.

An XRP move through the 50-day EMA would give the bulls a run at the $0.6354 resistance level.

SEC v Crypto news, SEC activity, and US lawmakers are focal points for the Thursday session.

However, a break below the $0.5835 support level would support a fall to the 200-day EMA.

The 14-day RSI reading, 46.32, indicates a drop to the $0.5835 support level before entering oversold territory.

XRP Daily Chart sends bearish near-term price signals.
XRPUSD 211223 Daily Chart

4-Hourly Chart

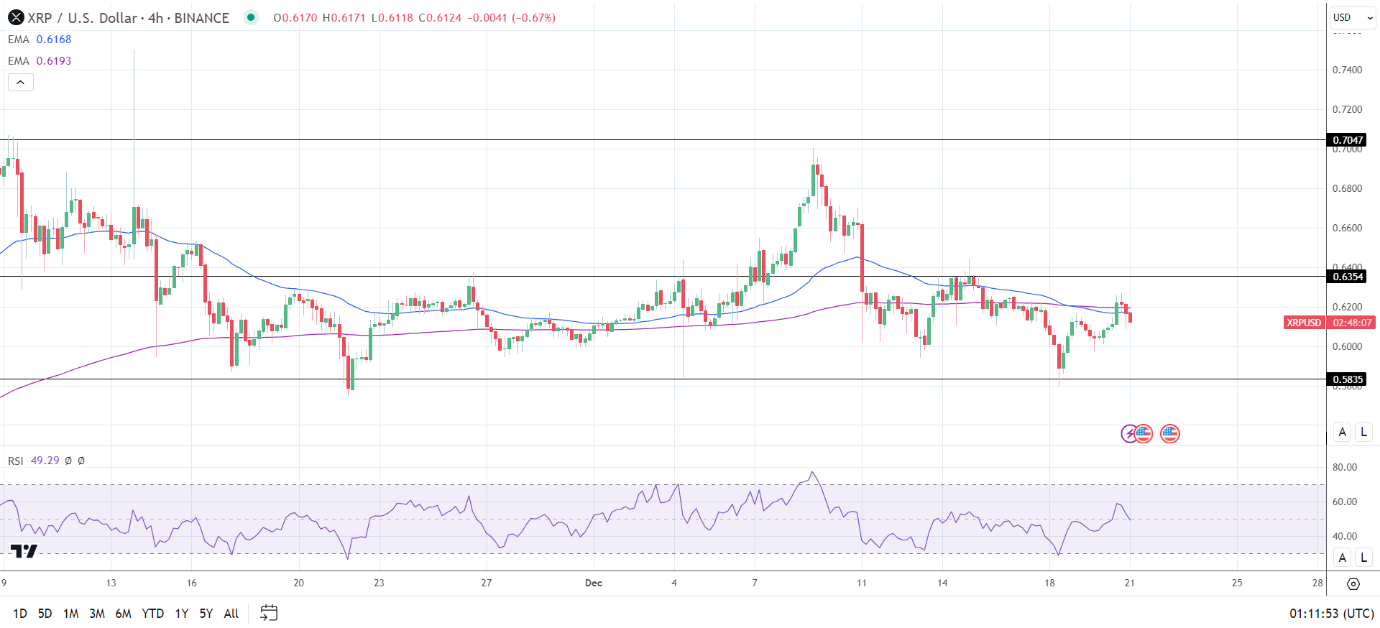
On the 4-hourly, XRP remained below the 50-day and 200-day EMAs, affirming bearish near-term price signals.

An XRP move through the EMAs would bring the $0.6354 resistance level into play.

However, an XRP drop below the $0.60 handle would give the bears a run at the $0.5835 support level.

The 4-hourly RSI, with a reading of 49.29, indicates an XRP drop to the $0.5835 support level before entering oversold territory.

XRP 4-Hourly Chart affirms bearish near-term price signals.
XRPUSD 211223 4-Hourly Chart
Bitcoin (BTC) Eyes a Fresh Multi-Month High, Solana (SOL) Continues to Outperform

Bitcoin (BTC) Eyes a Fresh Multi-Month High, Solana (SOL) Continues to Outperform

Bitcoin (BTC), Solana (SOL) Prices, Charts, and Analysis:

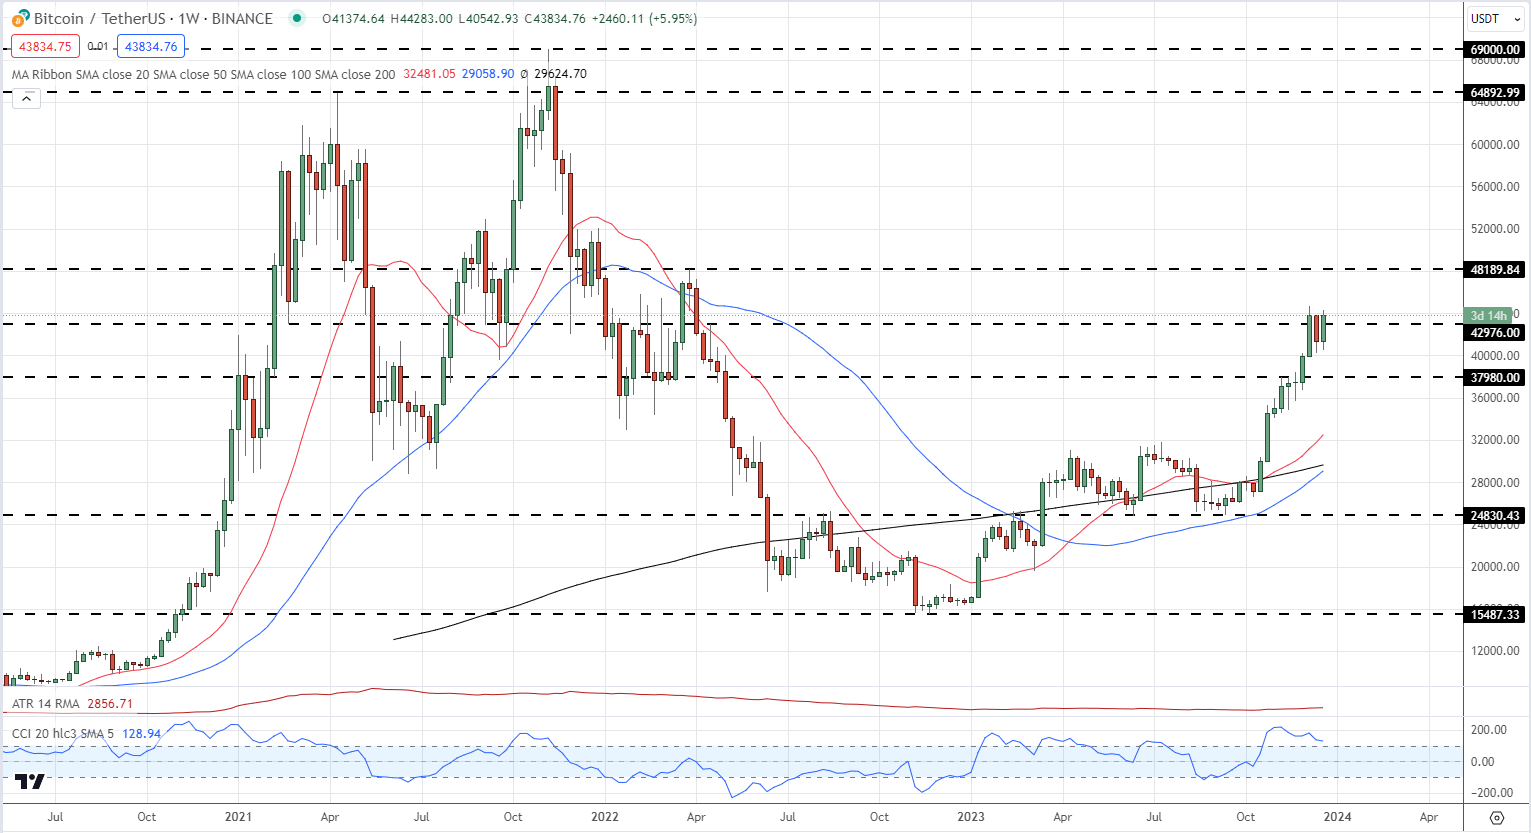
The multi-week Bitcoin rally remains intact and is pushing the largest cryptocurrency by market cap to levels last seen in April last year. The spot Bitcoin narrative remains the main driver of positive sentiment, while the technical Bitcoin halving event, expected in mid-April, is supporting the push higher. A decision by the SEC on multiple spot Bitcoin ETF applications is expected by early January and a positive decision is currently seen as the most likely outcome. Bitcoin traders are actively watching any SEC announcement at the moment and, it seems, buying Bitcoin ahead of the decision.

The technical outlook for BTC/USD is positive with the weekly chart showing a bullish flag formation being formed, while a bullish 50-day/200-day gold-cross is close to being made. The CCI indicator shows BTC/USD as overbought, suggesting a period of consolidation before any move higher. On the weekly chart there is little in the way of resistance ahead of $48.2k. Support is seen at $40k and a fraction under $38k.

Bitcoin (BTC/USD) Weekly Price Chart – December 21, 2023
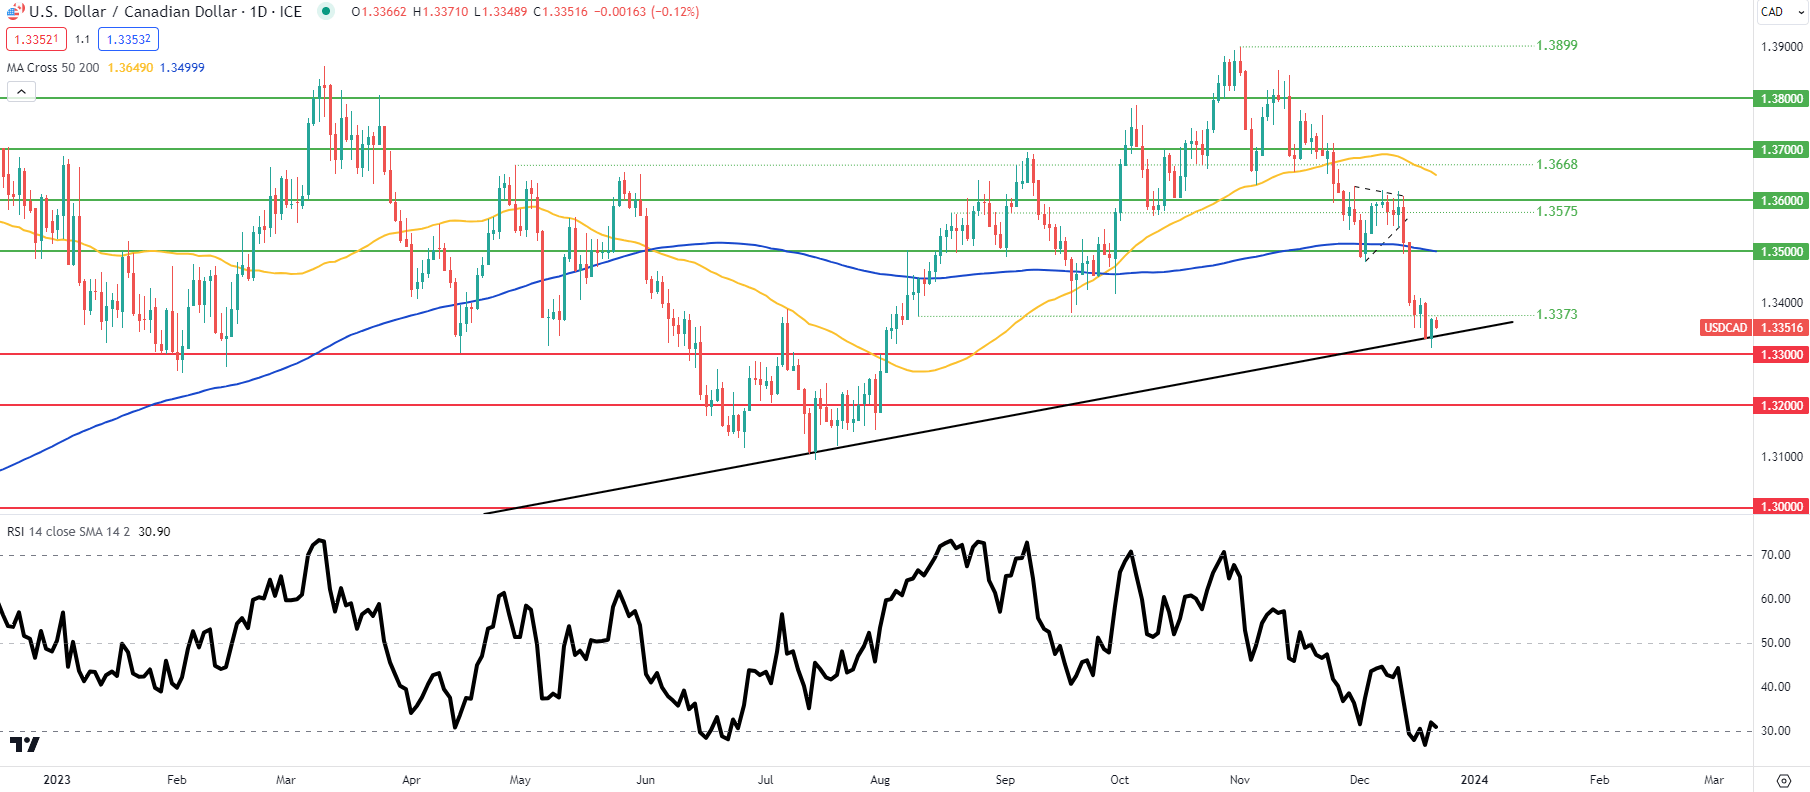
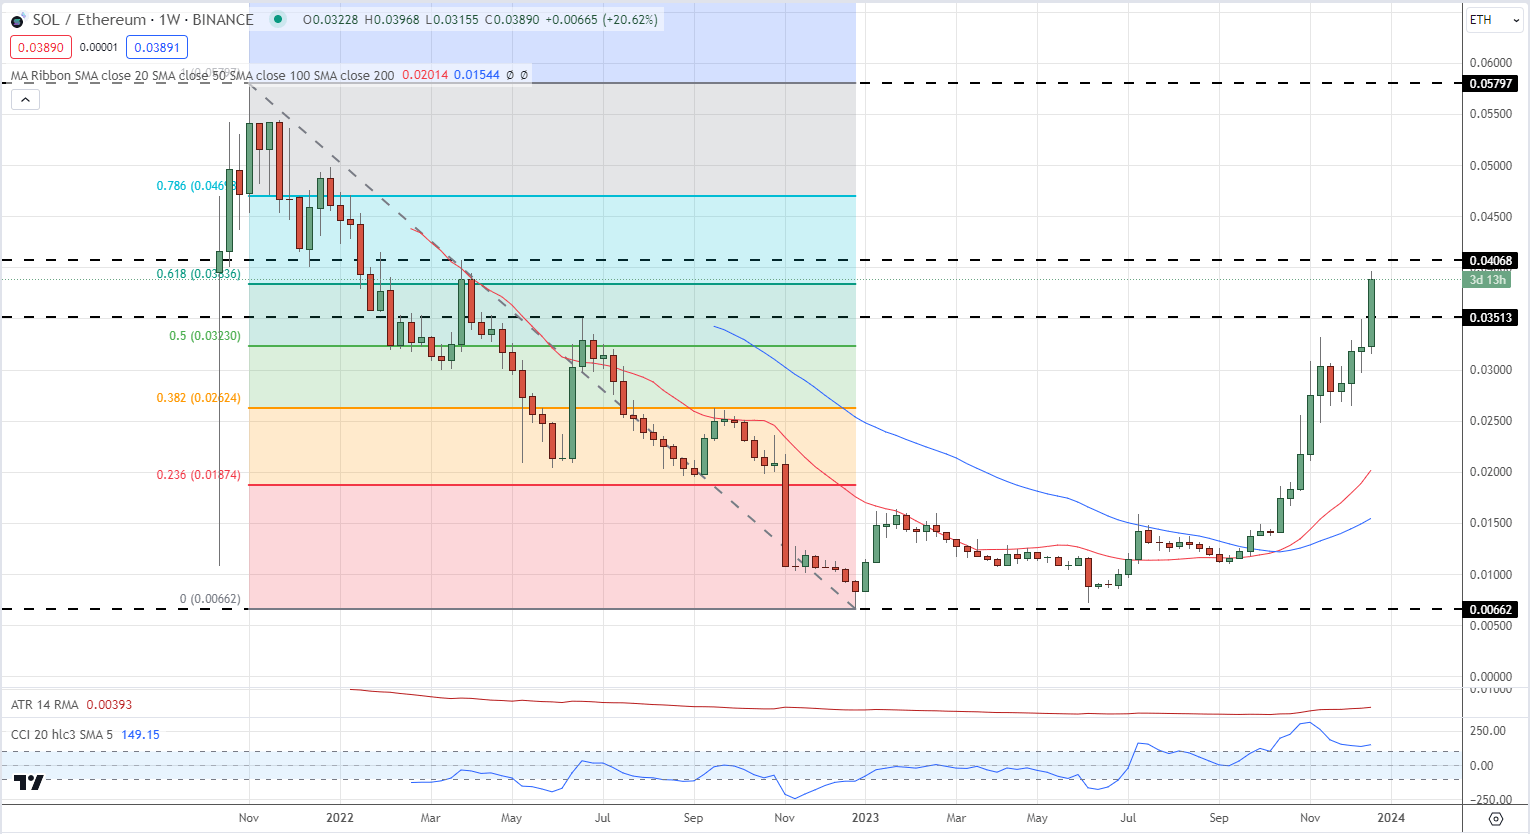
image1.pngSolana (SOL), a popular Layer 1 blockchain, has been on a tear over the past weeks, rallying from just under $20 in late September to a current spot price of $88. This performance has refueled the Solana vs Ethereum debate as to which is the best L1 blockchain. While Ethereum dwarfs Solana by market capitalization ($269 billion vs $37.5 billion), Solana has outperformed Ethereum strongly in the past weeks. The SOL/ETH spread has just broken above the 61.8% Fibonacci retracement November 2021-Novemebr 2022 move and if this break is confirmed, the June 2022 swing high at 0.04068 comes into play ahead of the 78.6% Fib retracement just under 0.4700.

Solana/Ethereum Spread Weekly Chart – December 21, 2023

image2.png 

Dow, Nasdaq 100 and Nikkei 225 Steady after Wednesday’s Losses

Dow, Nasdaq 100 and Nikkei 225 Steady after Wednesday’s Losses

Dow Jones, Nasdaq 100, Nikkei 225 – Analysis and Charts

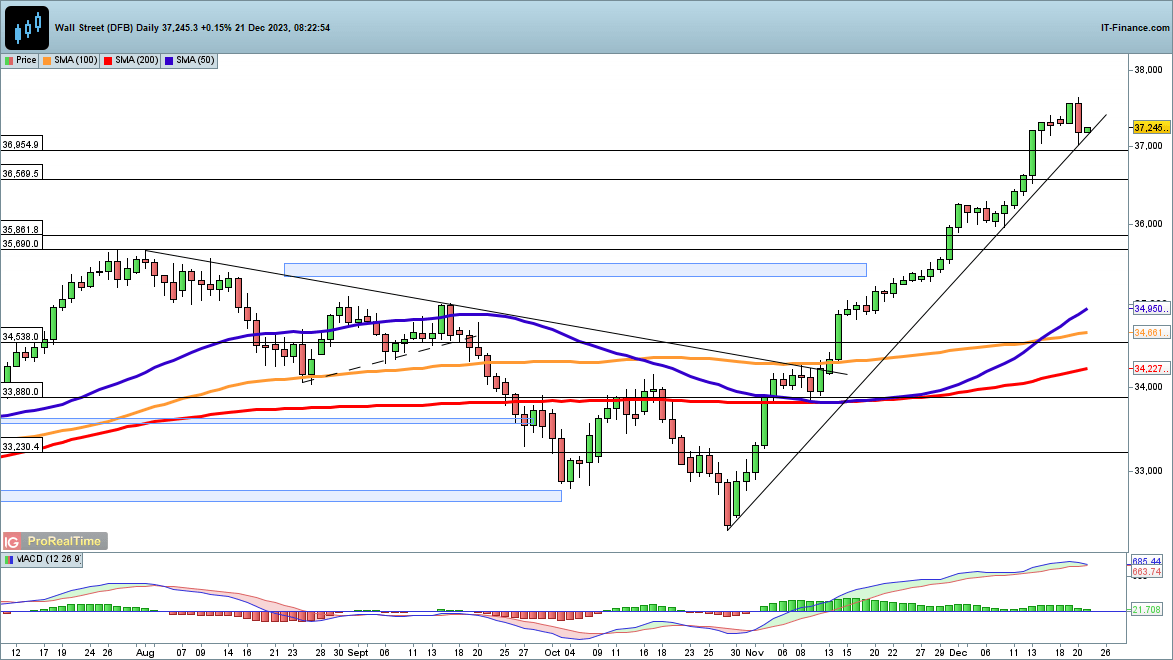
​​​Dow hits an air pocket

​After the huge gains made since the end of October, yesterday’s drop came as a surprise. ​But with volumes low and newsflow almost absent, it was perhaps not surprising that some profit-taking occurred, although the price continues to hold uptrend support from the lows of October.

​A close below 37,000 could yet see a move serious pullback develop, though a rally back above 37,500 puts more record highs on the agenda.

Dow Jones Daily Chart

See how changes in daily and weekly sentiment affect price action

​Nasdaq 100 steadies after drop

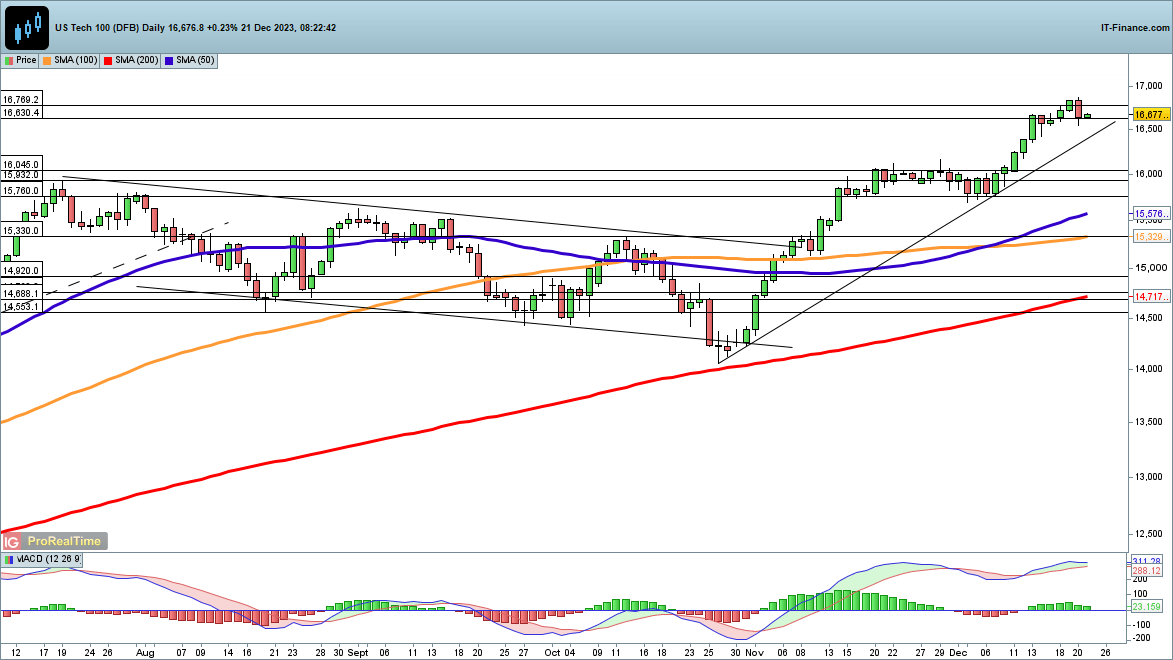
​This index also suffered a drop, though it only took the price back to the levels seen earlier in the week.​This week has seen the index hit a fresh record high, and despite yesterday’s brief volatility momentum still leans towards the upside.

​A close below trendline support from the October lows could spark more selling and see the price head back toward the 16,000 area, where the price consolidated in November.

Nasdaq 100 Daily Chart

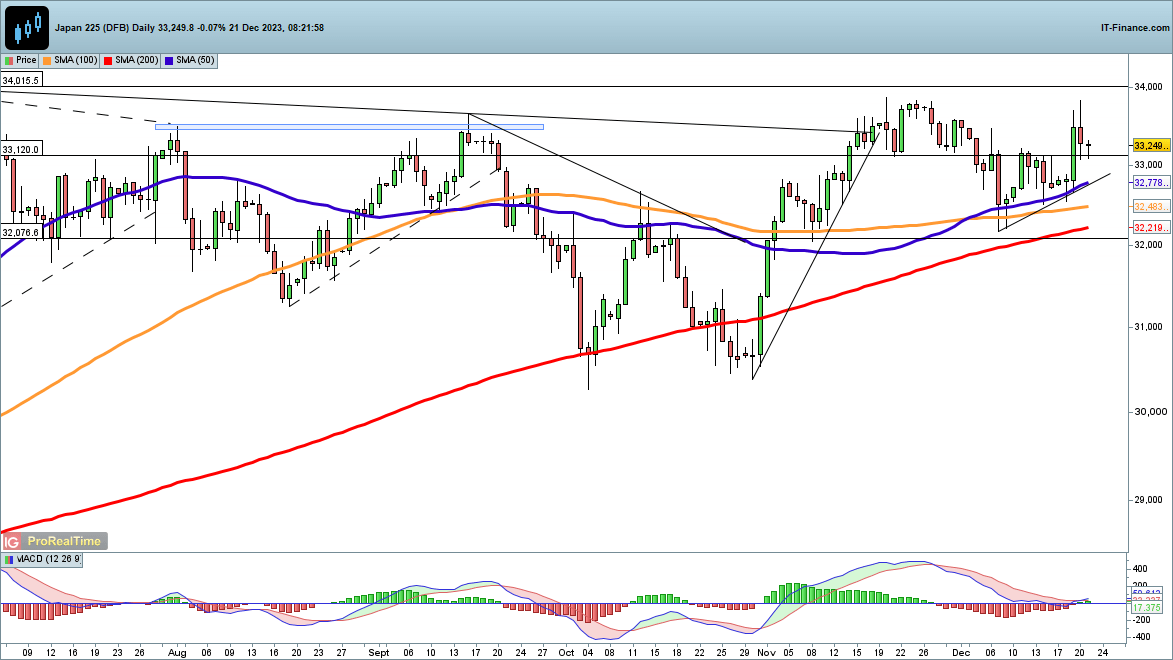
​Nikkei 225 stuck below 33,500

​Sellers have held back the price from making further headway above 33,500 this week.​For the moment, the price has yet to retest the 50-day SMA or rising trendline support from the December low. A close back above 33,500 means another test of the 33,900/34,000 zone could be in play.

​A close back below 32,750 would be needed to put further bearish pressure on the index.

Nikkei 225 Daily Chart

Getting Started with Moving Averages

Getting Started with Moving Averages

Moving Averages and Reaction to Price Action

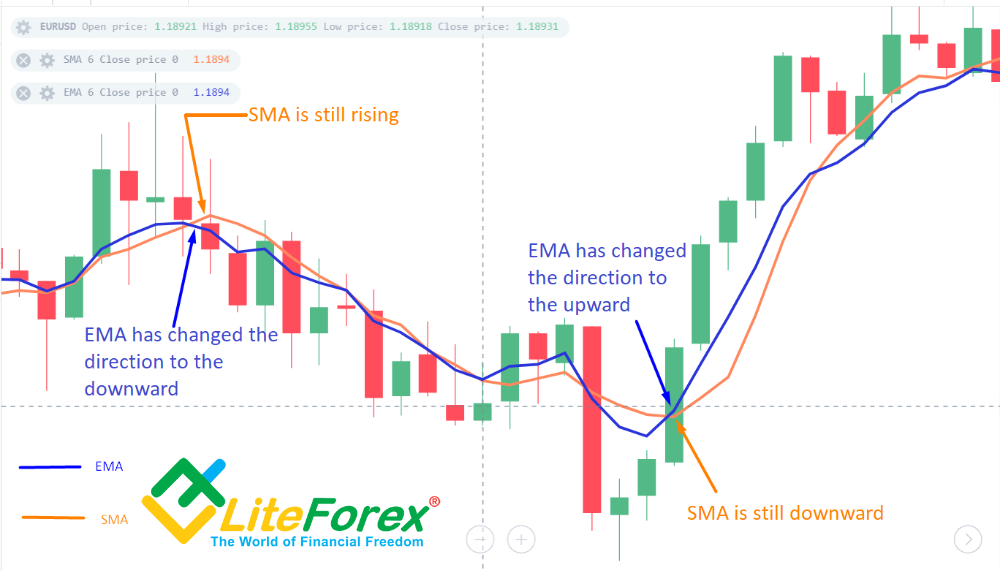
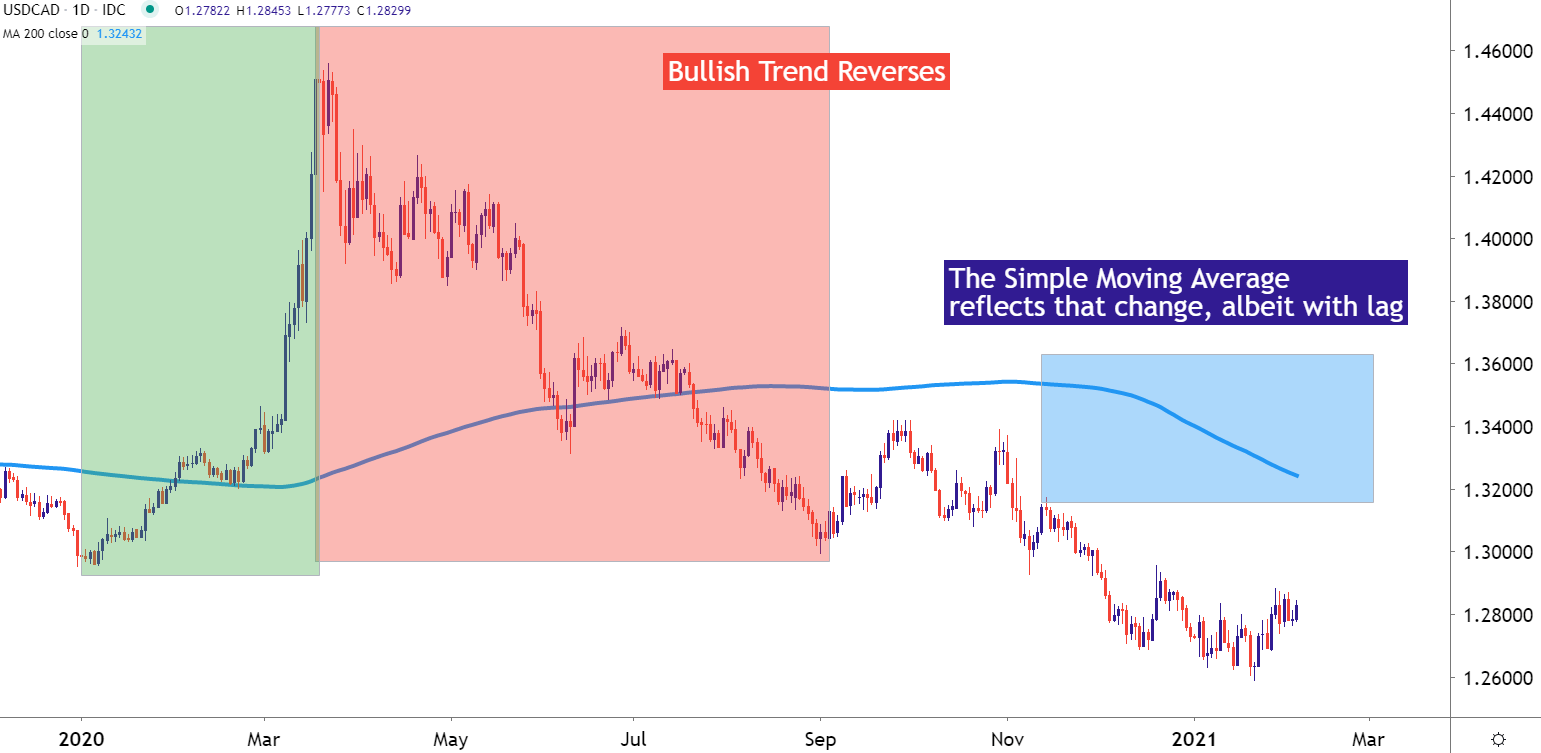
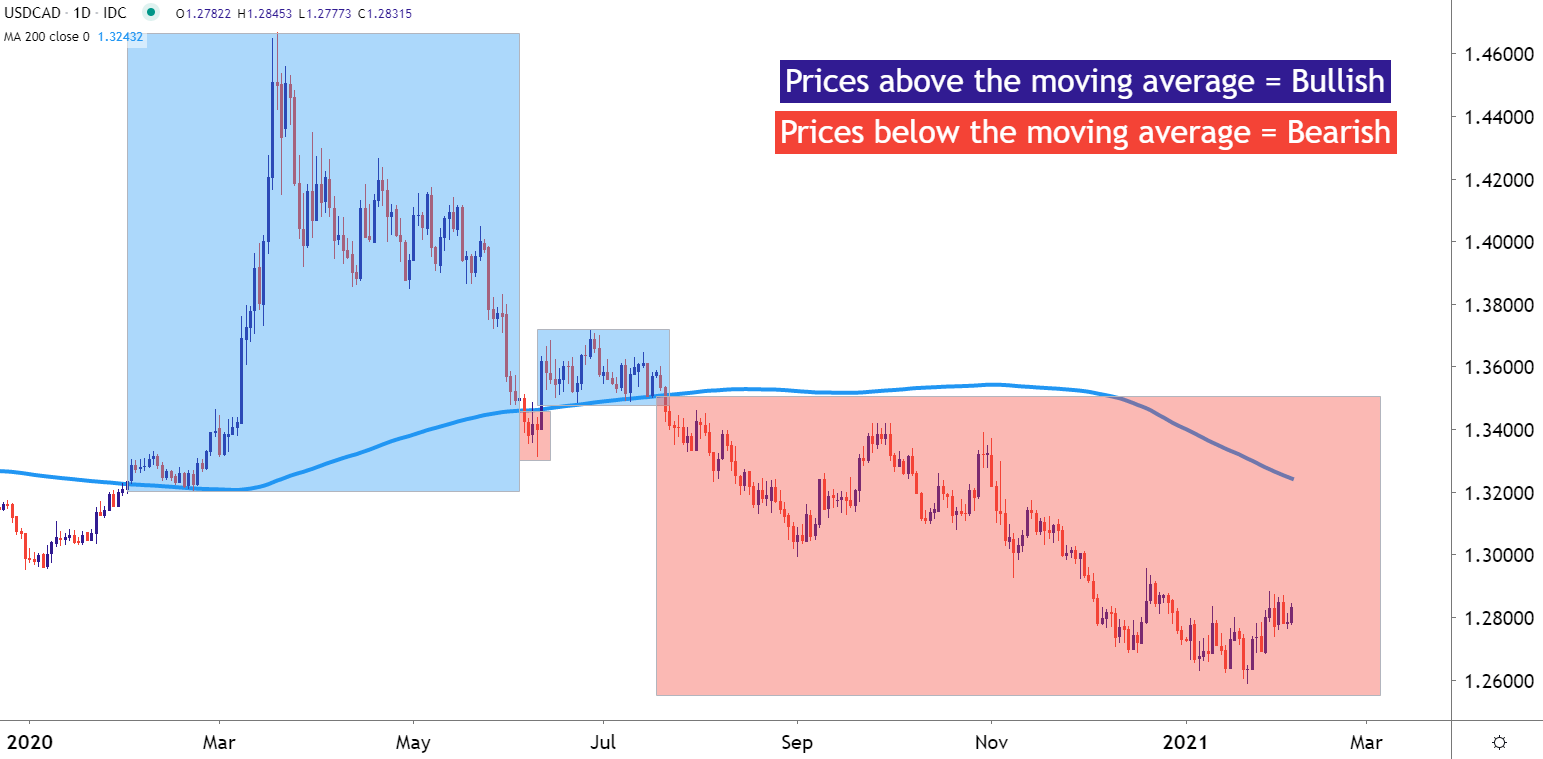
Moving averages are simple technical tools that are designed to measure the average price presented on a chart for a designated number of periods. For example the 200 period moving average is shown below. This means that the closing price has been taken for the last 200 periods, added together and then that sum is divided by the input of ‘200’ to find an average price. Once this number has been established, the average is printed on the graph as a frame of reference, and as each new bar or candle comes in with new information, that will similarly be reflected in the average as the new higher or lower price is registered in the data.

Below we can see a USDCAD daily chart with prices trending downward. You should notice as price trends downward, the moving average will begin moving lower as well. With price moving down faster than the 200 period MVA, this is an indication that prices declining and the prevailing trend is ‘bearish’.Likewise as price moves upward, as it did on the left side of the chart, the average will slowly move towards higher levels, as well. Knowing this, we can now implement the moving average into our analysis.

Simple Moving Average

Trading with a MVA Filter

You may notice from the above chart some incredible lag as it took the moving average quite a while to begin reflecting the down-trend in USD/CAD. This is partially by design, and is a direct function of the inputs being used in the indicator. Because this was a 200 period simple moving average, and because this reversal appears to have been particularly sharp, it took the moving average some considerable time before it too began to head-lower.

But – you may also notice that when prices fell below the moving average, at least for the second time, prices continued to run-lower for an extended period of time. This highlights the potential usage of a moving average as a ‘trend filter.’ So if prices are above the 200 period moving average, traders are looking at bullish strategies while prices below the 200 period moving average highlight the potential for bearish trends and short-side strategies.

Simple Moving Average

What’s Next?

After a trader has graded the trend, they then have a directional bias that can be used in a variety of ways. As we discuss in the article looking at popular strategies, trend filters can be used as a type of first step in a strategy, so that traders can then approach the market with a trend-side bias.

Or, even in its most simple of forms, traders can use a moving average filter to gain a potential bias with another indicator that can be used for entries and exits, such as MACD or RSI.

Such a strategy was laid out in the article, MACD Trading Strategy: 3 Steps to Find a Trend. The first step in that strategy is to grade the trend, after which the MACD indicator can be utilized with a trend-side bias.

In the following pages of this section on moving averages, we’ll get into considerably more depth behind this simple yet versatile indicator that can serve traders in a variety of ways.

CAD Price Forecast: Loonie Flirts With Key Support

CAD Price Forecast: Loonie Flirts With Key Support

CANADIAN DOLLAR FUNDAMENTAL BACKDROP

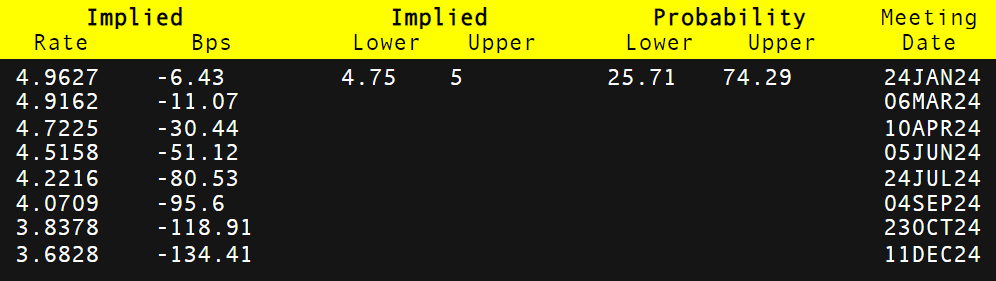
The Canadian dollar recovery may be fading after last nights Bank of Canada (BoC) summary of deliberations that highlighted the progress being made on the inflationary front. Despite Tuesday’s marginal beat on both core and headline metrics, there has been no upside shift that is cause for concern at this point. Consequently, we have seen an increase in cumulative interest rate cuts (refer to table below) for 2024 as markets now expect this to be the peak of the cycle for the BoC.

BANK OF CANADA INTEREST RATE PROBABILITIES

image1.png

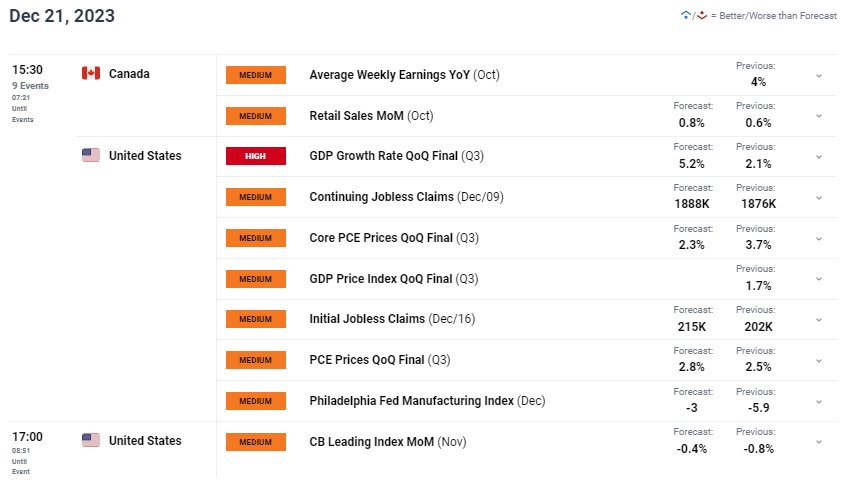
The economic calendar today holds some important data for Canada including average weekly earnings and retail sales data. Earnings has been sticky and will be welcomed by the BoC should we see a move lower. Retail sales has also been stubborn of recent regardless of restrictive monetary policy and it will be interesting to see how consumer demand has been impacted for October.

From a USD perspective, US GDP , jobless claims and core PCE figures are scheduled later today. GDP is expected to move sharply higher which could stabilize the weakening greenback. The Fed’s Harker yesterday pushed back against cutting rates too early and may well gai traction with other Fed officials.

USD/CAD ECONOMIC CALENDAR (GMT +02:00)

image2.png

TECHNICAL ANALYSIS

USD/CAD DAILY CHART

image3.png

Daily USD/CAD price action above has bears testing the long-term trendline support zone (black) which has held firm since June 2021. While the Relative Strength Index (RSI) shows momentum pushing out of oversold territory, a break below trendline support cannot be ruled out. Bulls may be looking for a reversal but should exercise sound risk management as a support break may catalyze a significant drop towards 1.3200 psychological level.

Key resistance levels:

Key support levels:

  • Trendline support
  • 1.3300
  • 1.3200

IG CLIENT SENTIMENT DATA: MIXED

IGCS shows retail traders are currently net LONG on USD/CAD, with 76% of traders currently holding long positions (as of this writing).

Curious to learn how market positioning can affect asset prices? Our sentiment guide holds the insights—download it now!

The Four-Hour Trader, A Full Trading Plan

The Four-Hour Trader, A Full Trading Plan

Four-Hour Trader Talking Points:

  • Traders can implement a well-heeled plan taking only four hours per week
  • The four-hour chart can be ideal for Forex Traders looking to trade around the clock
  • We outline a full plan based on Price Action that traders can begin using today

All of a sudden, the world has gotten very small, and life is moving faster than ever before.

The internet presents a lot of benefits to the human species, but time management is not one of them. As competition for page views, viewer numbers, and attendance continues to heat up, very little in this life emphasizes a slow and steady approach.

But to the trader, in many cases, that is the best way to go about speculation in markets: Slow, steady, and consistent.

But being there as a trader, and getting there as a new speculator are completely different markets. In this article, we’re going to outline a complete trading plan that will take less than four hours of a trader’s time each week. And further, this is an approach that can be focused on longer-term moves , and swings.

If you have a day job, or any other pre-existing commitments that limit your time on charts, this is an approach that can offer quite a few benefits.

The Center of the Approach

The 4-hour chart plays a special role in the FX market.

Most equity markets are open between 8 and 9 hours each day, and as such, the four-hour chart might take on less importance. After all, a four-hour chart just shows two bars for each trading session, so traders might as well just look at the daily chart.

But in the Forex market, the four-hour time frame takes on special importance. The market never closes, and traders are literally Trading the World . The four-hour candle represents half of each geographic trading session. Each of these sessions can take on markedly different tones, and that is where traders can look for potential opportunities.

In the FX Market, traders are truly ‘Trading the World’

Forex markets are traded world wide giving traders wider potential of oppurtunities.

Image taken from Trading the World

Traders can use the price movements and gyrations on these four-hour charts to analyze markets and find potential pockets of opportunity.

Watch for the close of each 4-hour candle that you can. Using the New York close to define ‘financial time’ means that we’re seeing candles close at 5, 9, and 1 AM and PM (based on ET). If you’re using Central Time, that’s 4, 8, and 12 AM/PM while Pacific Time is 2, 6, and 10 AM/PM.

If you’re busy at the time, Mobile Applications can generally offer you what you need to perform the analysis at the close of each of these candles.

Traders can then take a ten-minute block of time upon the close of each of these four-hour candles to look for potential trade setups, while also using this as an opportunity to manage risk .

If the trader is awake for four of the six four-hour candles that form each day that would mean that the trader would need approximately 40 minutes per day to analyze charts. If time permits, an additional 10-15 minutes can be used at or around the daily close.

The total time commitment required is 40-50 minutes each day, for a total of 200-250 minutes per week (240 minutes is 4 hours).

Use Price Action to locate the strongest trends

Trends in markets can be easily graded and seen with price action… by simply looking for charts to make progressively higher-highs, and higher-lows (in the case of an uptrend), and lower-lows, and lower-highs (for downtrends).

Price Action can help traders locate the strongest trends

Higher-highs and Higher-lows denote an up-trend per Price Action

In the article Price Action, an Introduction we look at a way that traders can grade trends without the use of any indicator at all, using just past prices.

Traders want to look to trade in the direction of these trends; buying up-trends, and selling down-trends. But, is it enough to just buy up-trends or sell down-trends and ‘hope’ that they continue? No. Traders can use price action to appropriate their entries into these positions.

Use Price Action to buy up-trends cheaply, and sell down-trends expensively

Once a strong trend has been located, the trader can then plot their entry by looking for a ‘trigger’ into the position via price action.

Once again, traders want to look to efficiently buy up-trends when the price is cheap, or near support. We looked at how traders can find this support in the article, Price Action Swings .

Traders can look to buy up-trends after a recent swing low

Traders buying up-trends can wait for a higher swing low to form before entering

Traders can look for additional confirmation of the entry by looking to the price action candles that form at or around those swings.

We looked at quite a few of these triggers in Trading Bearish Reversals (for down-trends) , and The Hammer Trigger for Bullish Reversals (for up-trends).

Traders can look for bullish triggers at or around recently printed new lows

Uptrends can be interrupted by brief retracements giving traders a trigger to enter and take part of the trend.

Taken from The Hammer Trigger for Bullish Reversals

Use Stops and Limits to Enforce Favorable Risk-Reward Ratios

We talk about this a lot at DailyFX, and there is a reason for it: It’s important!

One of the main premises of our price action education is that future prices are unpredictable, and as such, there is no such thing as a ‘holy grail’ or ‘can’t lose’ strategy.

By adding a stop and limit, and letting the trade work – the trader eliminates the possibility of making a knee-jerk reaction that they may end up regretting. It also enforces a favorable risk-reward ratio, and puts traders in the most promising spot to avoid the number one mistake that Forex traders make.

Trade Management

Since traders are looking at their charts for each four-hour bar, they have built-in trade management for each position that they take on.

Traders can use the close of each four-hour candle as an opportunity to adjust stops ( particularly the break-even stop ), or to take profits while also looking to trigger new positions.

Traders can take this a step further by trailing their stop in an effort to lock in gains in the event that the trend gets especially built-in. We looked at this premise in Trading Trends by Trailing Stops with Price Swings.

Traders can lock up gains to maximize trends

Traders can use trade management strategies to adjust stops while also looking for new triggers, or to capture profits and make an exit.

Created by James Stanley

Why does the average trader lose money? We studied over 30 million trades to help you become a more consistent trader. On page 4 of our Traits of Successful Traders Guide , we discuss the most common trading mistakes.

A Guide to Safe-Haven Currencies and How To Trade Them

A Guide to Safe-Haven Currencies and How To Trade Them

What Qualifies as a Safe-Haven Currency?

When considering the question of what qualifies as a safe-haven currency, the factors to bear in mind can relate to the currency itself. These include strong liquidity, as well as to the wider economic climate in its issuing country – such as a stable political system, economic growth and stable finances.

However, these factors are not always fully reliable as indicators of a safe-haven currency. For example, the Japanese Yen is seen as a safe haven despite the country’s weak financial situation, which includes the highest government debt to GDP in the world.

Factors that actively undermine a currency’s safe-haven appeal should be considered by traders. One of these is that governments can intervene to stop a nation’s currency becoming too strong. An example of this is the Swiss Central Bank, which has on numerous occasions flooded the country’s market with Francs to protect exports.

The Japanese Yen experiences a similar pattern; it tends to soar during periods of global risk-off sentiment. As the country is so reliant on exports, the rising Yen can be problematic – when exports become less competitive, Japanese businesses are less profitable and equities can fall. As a result, Japan’s government may sell Yen and buy US Dollars, or, as in 2016, even adopt negative interest rates in an effort to maintain a depressed currency.

Top 4 Safe-Haven Currencies to Trade

The list of safe-haven currencies includes the Japanese Yen, the Swiss Franc, the Euro, and the US Dollar.

US Dollar (USD) Euro (EUR) Japanese Yen (JPY) Swiss Franc (CHF)
Rank (trading volume) 1st 2nd 3rd 6th
Percentage of global trades involving the currency* 88 31 22 6.9
Most commonly traded pair EUR/USD EUR/USD USD/JPY USD/CHF
Average amount traded* $4.4 bn $1.6 bn $1.1 bn $0.24 bn

Source: Bank for International Settlements (2016)

*Net-net basis, daily averages for April 2016

Japanese Yen (JPY)

The Yen as a safe haven is driven by factors such as Japan’s strong current account surplus, positioning the country as the world’s largest creditor nation. Additionally, the Yen is a popular carry trade, meaning investors often borrow Yen from Japan, where interest rates are low, in order to buy currency in a country where interest rates are higher. This can push up the price of Yen during financial turmoil, as international speculators choose to unwind risky positions and pay back Yen loans.

In recent years, examples of the Yen’s appreciation include during the 2008 financial crisis, with the currency soaring against the British Pound and the US Dollar, the uncertainty of Brexit in 2015, and the 1998 near-collapse of the Long Term Capital Management Hedge Fund.

Since both USD and JPY are considered safe haven currencies, sometimes the USD/JPY market doesn’t move strongly, but a cross pair like GBP/JPY , AUD/JPY , and NZD/JPY often does.

US Dollar (USD)

The US Dollar ’s safe-haven status is maintained by the reliability of the US Treasury to pay its investors. Since the financial crisis, the received wisdom has been that, during times of market turbulence, investors sell risky assets and turn to US Treasuries and the US Dollar.

However, in recent years there have been instances when Yen and Euros have been the safe haven of choice over USD, and some analysts argue that there is little evidence that USD is being bought in meaningfully larger amounts than other safe haven currencies during economic difficulties.

Euro (EUR)

As with the US Dollar, disputes exist over the Euro ’s safe-haven status in today’s climate. The Euro has certainly displayed the hallmarks of a safe haven in past years – in 2015 analysts turned increasingly bullish on the Euro, driven by a positive outlook for selected European economies. Also, the low interest rates in major European economies led to expectations of the Euro acting like a safe haven.

However, in early 2018, following a plunge in US equities, the expected rush to buy Euros didn’t happen. It was business as usual for the Japanese Yen though, which did attract buyers.

Swiss Franc (CHF)

The safe-haven status of the Swiss Franc is underpinned by a stable Swiss government and a strong financial system. This is coupled with low inflation and high levels of confidence in the country’s central bank, the Swiss National Bank.

One example of CHF demonstrating its allure was 2011, when US Dollars and Euros poured into the Franc as nervous investors flocked for protection against the debt crises on either side of the Atlantic. This caused USD to slump against CHF from 0.9400 at the beginning of 2011 to 0.7900 by July, meaning one US Dollar could buy only 0.79 Swiss Francs. On the Euro side, in July 2011 EUR fell against CHF to around parity, from around 1.3000 at the start of the year.

As with the Japanese Yen, carry trade speculators like to leverage funds in Swiss Francs with no funding costs, paying back the loans when the position goes against them.

Using Safe-Haven Currencies in Forex Trading

When using self-haven currencies in forex trading, traders should be aware that some currencies, as discussed above, react differently to market events than others. Also, there is not always consensus on what currencies qualify as safe havens.

For example, while some view the Norwegian Krone as a safe haven, citing the country’s lack of net debt and its current account surplus, others believe that it is not the best option as it lacks liquidity and is too correlated to commodity currencies.

As well as using currencies for safe havens, gold is a popular consideration for traders looking to protect against excess risk. Gold is seen as a safe-haven because of its proven store of value, market utility and a price that generally isn’t influenced by interest rate decisions from central banks.

Whether going long on safe-haven currencies or choosing a higher risk strategy, make sure you access DFX Forex trading and educational guides to boost your confidence and skills, and refer to our news and analysis to stay up to date on currency pair movements.