ggg

Gold under pressure due to the Fed’s outlook

Gold prices fell in European trading on Friday, resuming losses after a brief rebound the previous day from a three-week low, as the metal once again traded below the $4,000 per ounce mark under pressure from a stronger US dollar across global markets.

The decline came after the Federal Reserve’s policy meeting this week delivered a more hawkish tone than markets had expected, reducing the likelihood of another rate cut in December following two consecutive 25-basis-point reductions.

Despite today’s weakness, gold remains on track to post a third consecutive monthly gain, supported by persistent safe-haven demand amid heightened global political and trade tensions.

Price overview

• Gold prices fell 0.9% to $3,989.27 per ounce, after opening at $4,024.67 and hitting a session high of $4,046.35.

• On Thursday, the metal rose 2.4%, snapping a four-day losing streak, as it rebounded from a three-week low of $3,886.64.

US dollar

The US Dollar Index hovered near a three-month high around 99.72 points on Friday, reflecting continued strength in the greenback against major and minor peers.

The dollar’s gains have been supported by renewed safe-haven buying following the Fed’s hawkish stance this week, which increased doubts about further monetary easing or rate cuts.

Sentiment was also buoyed by signs of easing trade tensions between the United States and China after Presidents Donald Trump and Xi Jinping met in South Korea and agreed to a temporary trade truce aimed at reviving negotiations.

Federal Reserve

As widely expected, the Fed cut interest rates by 25 basis points on Wednesday to 4.00%, the lowest since November 2022, marking its second consecutive cut this year.

The decision was backed by a majority of FOMC members, with two dissenters — Steven Miran, who favored a 50-basis-point cut, and Jeffrey Schmid, who preferred no change.

The policy statement noted slower job growth and a slight rise in unemployment while emphasizing that the labor market remains relatively tight. It also said economic activity continues to expand at a moderate pace and that inflation remains elevated compared with earlier this year.

Jerome Powell

Fed Chair Jerome Powell said Wednesday that another rate cut in December “is far from a given,” adding that policymakers hold “sharply divided views” on the path forward.

Powell acknowledged rising tensions in money markets in recent weeks and said the Fed has been managing liquidity conditions carefully. He emphasized that the central bank is relying on all available data — including private surveys and sector data — as official government reports remain unavailable due to the ongoing shutdown.

He described the current situation as “complex,” noting that the economy is caught between the risks of persistently high inflation and a weakening labor market, and said current policy remains “moderately restrictive.”

Interest-rate outlook

According to CME’s FedWatch Tool, market pricing for a 25-basis-point rate cut in December has fallen from 99% to 70%, while the probability of holding rates steady rose from 1% to 30%.

Monthly performance

• For October, gold is still up around 3.5%, on track for a third straight monthly gain.

• Earlier this month, the metal hit an all-time high of $4,381.73 before entering a broad correction and profit-taking phase.

Market outlook

Tim Waterer, chief market analyst at KCM Trade, said: “Powell’s tone was notably hawkish this week, which hasn’t been favorable for gold.”

He added that “the December rate-cut outlook now looks far less certain, boosting the dollar’s strength and complicating gold’s near-term appeal.”

SPDR Gold Trust

Holdings at the SPDR Gold Trust, the world’s largest gold-backed ETF, rose by 4.3 metric tons on Thursday to 1,040.35 metric tons — their highest level since October 24.


usy

The USDJPY is declining after reaching our expected target

The (USDJPY) declined in its last intraday trading, after reaching 154.30 resistance, which represents our expected target in our previous analysis, which stopped the rise, taking temporary truce to catch its breath and gather gains, besides its attempt to offload some of its overbought conditions on the relative strength indicators, especially with the emergence of the negative signals, to gather its positive strength that might help it to breach this resistance, amid the dominance of the main bullish trend on the short-term basis and its trading alongside trendline.


Untitled

Silver price is getting ready to attack critical resistance

Silver price settled higher in its last intraday trading, after a series of consecutive gains, the price successfully breached bearish corrective trendline, leading it to surpass the resistance of its EMA50, to get rid of its negative pressure, on the other hand, this rise led the relative strength indicators to reach overbought levels, which may obstruct the continuation of these gains on the near-term basis, especially with the emergence of negative overlapping signals.

gbp

GBPUSD is under negative pressure

The (GBPUSD) price settles downside during its last intraday trading, amid the dominance of the main bearish trend on the short-term basis with its trading alongside trendline that confirms the extension of this negative track, accompanied by the continuation of the technical pressure due to its trading below EMA50, reducing the possibilities of sustainable recovery currently.


Noticing the emergence of the negative signals on the relative strength indicators, which supports the negative overview and increases the possibilities for extending the range of the losses on the near-term basis, unless the price success in recovering main resistance levels that return the bullish momentum again.


blog-eurusd-28-10-25

EURUSD price is rising, affected by key support

The (EURUSD) price rose in its last intraday trading, supported by the stability of the key support at 1.1550, which was our target in our previous analysis, and that pushed the pair to attempt to recover some of its last losses, and attempts to offload the clear oversold conditions on the relative strength indicators, especially with the appearance of bullish crossover that supports a potential temporary rebound.


Despite these modest bullish moves, the negative pressure remains dominant, due to the continuation of the trading below EMA50, besides the stability of the main bearish trend with its trading alongside trendline that indicates the strength of this track.

crude

Crude oil price remains supported by its moving average

Crude oil price settled with slight decline in its last intraday trading, with the continuation of its attempts to look for bullish momentum to recover its bullish track, and the price keeps its stability above EMA50, forming key dynamic support that helps it to keep the bullish moves despite the current decline.


The bullish trend remains the dominant on short-term basis, supported by its trading alongside bullish trendline that confirms the strength of this track, and we witness an improvement in the relative strength indicators signs after approaching the oversold levels, providing recover chances in its upcoming trading unless it breaks the key support levels.

gold4

Gold price is declining from a key resistance level

Gold price declined in its last intraday trading after a clear stability for the resistance at $4,050, which limited the ability to achieve more gains. This weak performance comes with the continuation of the negative pressure due to the trading below EMA50, keeping the recovery attempts limited and not sustainable until now.


At the same time, we notice the relative strength reaching sever oversold levels compared to the price move, with the emergence of negative crossover that indicates losing the bullish momentum, this technical scene keeps the price vulnerable to further downside in the near-term basis unless it breaks the constraints of the dominance bearish track on the short-term basis.

Screenshot 2025-10-30 at 08-19-41 (20 ) Facebook

risk management ratio

Businesses and investors utilize risk management ratios, a collection of financial measurements, to evaluate and manage different kinds of risk, such as credit, market, and financial risk. The ratios evaluate a business’s overall stability, performance, and financial health to assess its capacity to fulfill commitments and expand in a sustainable manner. Risk management ratios fall into various categories, each of which focuses on a certain facet of a business’s financial situation.
Liquidity ratios 
Liquidity ratios measure a company’s ability to cover its short-term financial obligations with its current, or most liquid, assets. 
  • Current Ratio: Compares a company’s current assets to its current liabilities. A ratio greater than 1 suggests good short-term financial health.
    • Formula:

      Current AssetsCurrent Liabilitiesthe fraction with numerator Current Assets and denominator Current Liabilities end-fraction

      Current AssetsCurrent Liabilities

  • Quick Ratio: Also known as the acid-test ratio, it is a stricter measure of liquidity. It excludes less liquid assets, such as inventory and prepaid expenses, from the calculation.
    • Formula:

      Current Assets – InventoryCurrent Liabilitiesthe fraction with numerator Current Assets – Inventory and denominator Current Liabilities end-fraction

      Current Assets – InventoryCurrent Liabilities

  • Cash Ratio: A more conservative measure of liquidity that assesses a company’s ability to cover short-term debt using only cash and cash equivalents.
    • Formula:

      Cash and Cash EquivalentsCurrent Liabilitiesthe fraction with numerator Cash and Cash Equivalents and denominator Current Liabilities end-fraction

      Cash and Cash EquivalentsCurrent Liabilities


Leverage and solvency ratios 
These ratios evaluate a company’s long-term financial structure and its ability to meet its long-term debt obligations. 
  • Debt-to-Equity (D/E) Ratio: Compares a company’s total debt to its total shareholder equity. A higher ratio indicates that a company relies heavily on debt for financing, which increases financial risk.
    • Formula:

      Total DebtTotal Equitythe fraction with numerator Total Debt and denominator Total Equity end-fraction

      Total DebtTotal Equity

  • Debt-to-Capital Ratio: Measures the proportion of a company’s total capital (debt and equity) that is financed by debt. A lower ratio is generally preferred.
    • Formula:

      Total DebtTotal Debt + Total Shareholders′ Equitythe fraction with numerator Total Debt and denominator Total Debt + Total Shareholders prime Equity end-fraction

      Total DebtTotal Debt + Total Shareholders′ Equity

  • Interest Coverage Ratio: Also called the “times interest earned ratio,” this shows how many times a company’s earnings before interest and taxes (EBIT) can cover its interest expenses. A low ratio can signal potential financial problems.
    • Formula:

      EBITInterest Expensesthe fraction with numerator EBIT and denominator Interest Expenses end-fraction

      EBITInterest Expenses


Risk-adjusted return ratios 
For investors, these ratios assess how much return is generated for each unit of risk taken, allowing for comparisons between different investments. 
  • Sharpe Ratio: Measures the performance of an investment by adjusting for its risk. It calculates the excess return per unit of standard deviation (total risk). A higher ratio is better.
    • Formula:

      Return of Portfolio – Risk-Free RateStandard Deviation of Portfolio′s Excess Returnthe fraction with numerator Return of Portfolio – Risk-Free Rate and denominator Standard Deviation of Portfolio prime s Excess Return end-fraction

      Return of Portfolio – Risk-Free RateStandard Deviation of Portfolio′s Excess Return

  • Sortino Ratio: Similar to the Sharpe ratio, but focuses only on downside risk, or negative volatility. It’s often preferred by investors who are less concerned with upside volatility.
    • Formula:

      Return of Portfolio – Risk-Free RateStandard Deviation of Negative Asset Returnsthe fraction with numerator Return of Portfolio – Risk-Free Rate and denominator Standard Deviation of Negative Asset Returns end-fraction

      Return of Portfolio – Risk-Free RateStandard Deviation of Negative Asset Returns

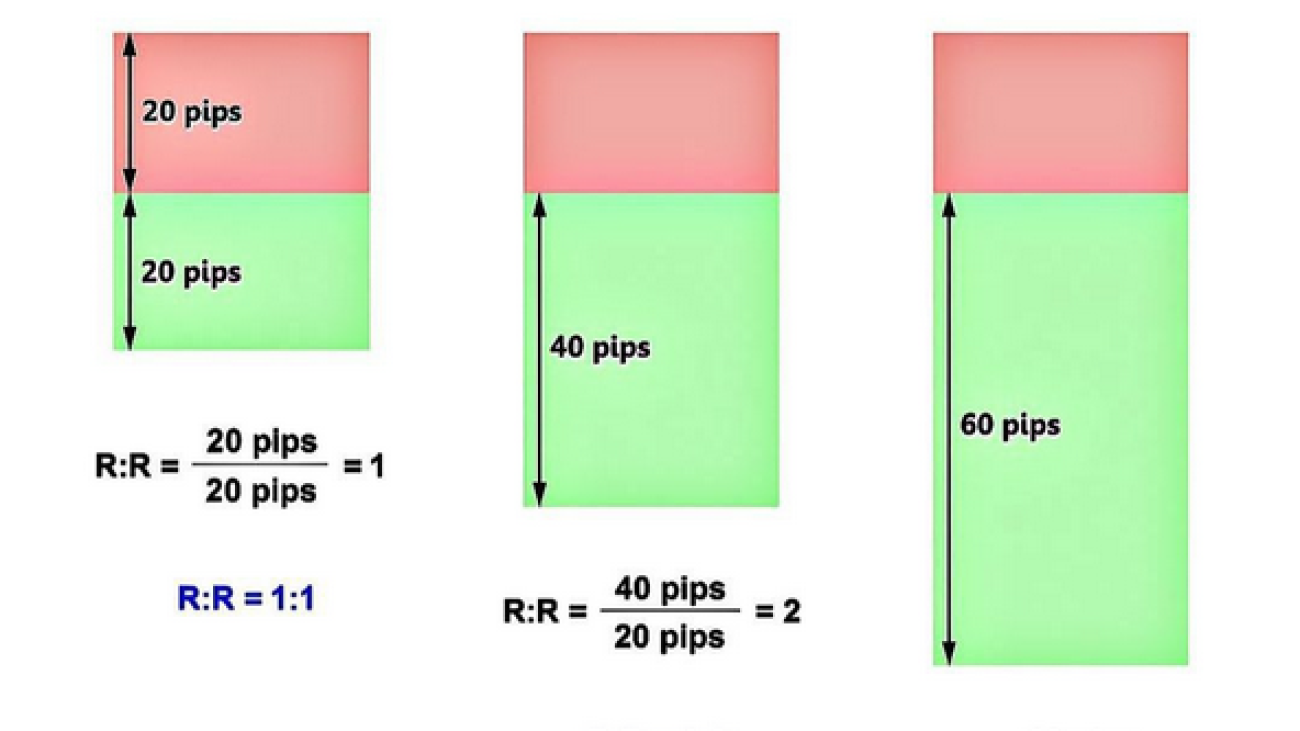
  • Risk/Reward Ratio: Compares the potential profit of a trade to its potential loss. For example, a 1:3 ratio means the potential profit is three times the potential loss.
    • Formula:

      Potential LossPotential Gainthe fraction with numerator Potential Loss and denominator Potential Gain end-fraction

      Potential LossPotential Gain  Other important risk measures 

Beyond traditional financial ratios, other metrics provide a more comprehensive view of risk. 
  • Beta: Measures a stock’s volatility in relation to the overall market. A beta of 1 indicates the stock’s price moves with the market, while a beta over 1 is more volatile.
  • Standard Deviation: A statistical measure used to quantify the amount of variation or dispersion of an investment’s returns around its average return.
  • Value at Risk (VaR): A statistical technique used to estimate the potential loss of a portfolio over a specific time period with a given level of confidence. 
banks

Euro moves in a positive zone before the ECB’s policy decisions

The euro rose in European trading on Thursday against a basket of global currencies, resuming its gains after a brief pause yesterday versus the US dollar. The currency moved into positive territory, supported by a pullback in the dollar’s rally following the conclusion of the Federal Reserve meeting.

The advance comes ahead of the European Central Bank’s monetary policy decision later today, with markets widely expecting interest rates to remain unchanged for the third consecutive meeting.

Global investors are closely watching for any new signals from the ECB regarding the potential resumption of its monetary easing cycle next year, amid low odds of such a move in December.

Price Overview

• EUR/USD rose 0.3% to 1.1637, up from the day’s opening at 1.1600, after touching a low of 1.1597.

• The euro closed Wednesday down 0.25% against the dollar, its first loss in six sessions, following more hawkish remarks from Fed Chair Jerome Powell.

US Dollar

The US Dollar Index declined more than 0.2% on Thursday, retreating from a two-week high of 99.36 points, reflecting a pause in the greenback’s recent rally against major and minor currencies.

Beyond profit-taking, the dollar’s pullback was also driven by easing trade tensions between the United States and China, along with continued market conviction that the Federal Reserve will cut rates again in December.

European Central Bank

The ECB concludes its seventh policy meeting of 2025 later today, with expectations pointing to another pause in rate cuts. The upcoming statement is anticipated to provide further insight into the bank’s outlook for interest rates through the remainder of this year and into 2026.

Current projections suggest that the ECB will maintain its key rate unchanged at 2.15%, the lowest level since October 2022, marking the third consecutive meeting without adjustment.

The ECB rate decision and policy statement are due at 13:15 GMT, followed by a press conference from President Christine Lagarde at 13:45 GMT.

Euro Outlook

At Economies.com, we expect that if the ECB’s tone proves more hawkish than markets anticipate, the likelihood of a December rate cut will decline — a scenario that could drive further gains for the euro against a broad basket of global currencies.

sma-1

The USDJPY is leaning on the simple moving average

The (USDJPY) declined in its last intraday trading, in attempt to gain bullish momentum that might help it to rise again, to reinforce the chances of breaching the stubborn and key resistance at 153.25, supported by its trading above EMA50, supported by its trading above EMA50, representing dynamic support that strengthens the dominance of the main bullish trend on the short-term basis, especially with its trading alongside trendline, besides the emergence of the positive signals on the relative strength indicators.