French Inflation Slows More Than Expected to Weakest in Year

French Inflation Slows More Than Expected to Weakest in Year

French inflation eased to its lowest level in a year, though Italy overshot analyst expectations, underlining the challenge for the European Central Bank as it nears the end of its unprecedented campaign of interest-rate hikes.

Consumer prices in France rose by 6% from a year ago in May — down from 6.9% in April and way below the 6.4% gain economists surveyed by Bloomberg had predicted, data Wednesday showed.

In Italy, inflation moderated to 8.1% from 8.7% but was significantly above the 7.5% median estimate in a separate poll.

The data follow a larger-than-expected dip in Spanish price gains and are part of a raft of releases from the region’s top economies. Germany will publish its reading for this month later Wednesday, with early regional figures pointing to a similar retreat in price gains. The 20-nation euro area will report numbers on Thursday.

Money-market traders trimmed rate bets and are no longer fully pricing another 50 basis points of hikes this year. German bonds rallied, with two- and five-year yields falling as much as 10 basis points. The euro held losses, trading near a two-month low of $1.0673 touched Tuesday.

What Bloomberg Economics Says…

“Lower-than-expected readings for France and Spain add modest downside risks to our forecast for euro-area inflation. We forecast that headline inflation will decline to 6.2% in May from 7.0% in April and core to 5.4% from 5.6%.”

—Maeva Cousin, senior euro-area economist. Click here for full REACT

While the retreats in headline inflation will be welcomed by the ECB, Italy’s above-estimate reading and signs that core price pressures exlcuding energy and food costs remain elevated mean policymakers can’t relax.

“I could not say that the victory is there so far,” ECB Vice President Luis de Guindos said in Frankfurt. “I think that we are on the correct trajectory and we have to look very carefully at the evolution of core inflation.”

His ECB colleague Madis Muller said there’ll probably be more than one additional quarter-point hike, warning that underlying inflation “unfortunately shows no signs of slowing yet.”

In France, price growth slowed across sectors, particularly in energy. Manufactured goods and services inflation, which are keenly watched by ECB officials, also moderated to 4.1% and 3%, according to the Insee statistics agency.

Bank of France Governor Francois Villeroy de Galhau said last week that core inflation is “showing persistence,” and services will likely become the dominant force driving prices.

Speaking after Wednesday’s data, he described the composition of price growth as encouraging, saying the downward shift means it is “probable we’ve passed the peak.”

“Part of this can doubtless be attributed to the first effects of monetary-policy transmission,” Villeroy said.

The rising cost of living, meanwhile, is proving trickier for President Emmanuel Macron to alleviate than the spike in energy costs. As part of a campaign to narrow profit margins, the Finance Ministry has pressured large food companies to renegotiate prices and supermarkets.

“Retailers have stuck to their commitments,” Finance Minister Bruno Le Maire said Wednesday. “Industrial food manufacturers, who committed in my office to return to the table for commercial negotiations to translate this decrease in inflation into prices on supermarket shelves, must respect their commitments.”

In a separate release, Insee said consumer spending fell 1% in April as households cut back on food and energy outlays. Economists polled by Bloomberg had expected a 0.3% increase.

–With assistance from Craig Stirling, Giovanni Salzano, Joel Rinneby, Ainhoa Goyeneche, James Regan, Ott Tammik, Jana Randow, Constantine Courcoulas and Alessandra Migliaccio.

Asian Indices Slide After China Data: Hong Kong HSI, Australia ASX, Singapore STI Price Action

Asian Indices Slide After China Data: Hong Kong HSI, Australia ASX, Singapore STI Price Action

Asian indices have fallen sharply after China’s manufacturing activity contracted faster than expected in May – another sign that China’s post-Covid recovery is losing momentum.

The official manufacturing PMI dropped further into contraction territory to 48.8 in May from 49.2 in April, compared with expectations of 49.4. This follows a string of weaker-than-expected data, including retail sales, industrial output, and fixed asset investment amid deepening producer price deflation.

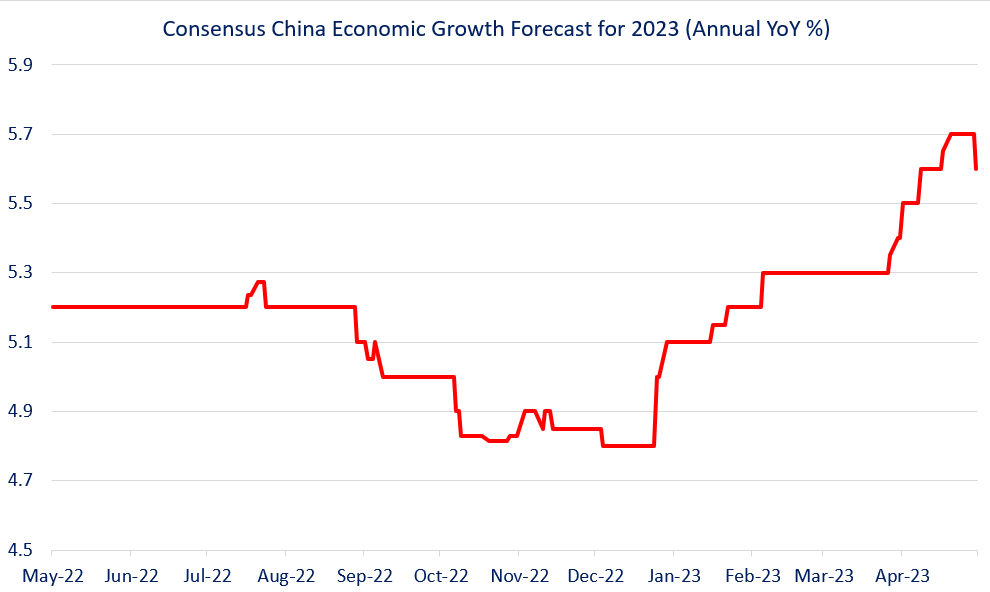
Consensus Growth Expectations

A picture containing text, screenshot, diagram, line  Description automatically generated

Source data: Bloomberg; Chart prepared in Excel

China’s economic outlook has steadily improved after Beijing lifted relaxed Covid restrictions, prompting a significant upgrade in China consensus economic growth forecasts for 2023 (see chart). Most recently, though, some of the optimism has scaled back, as reflected in the slight downgrade in those assessments. Key focus will be on anystimulusmeasures to support the economy which could cushion some of the downside risks.

Hang Seng Index Daily Chart

image2.png

Hang Seng Index: Breaks below key support

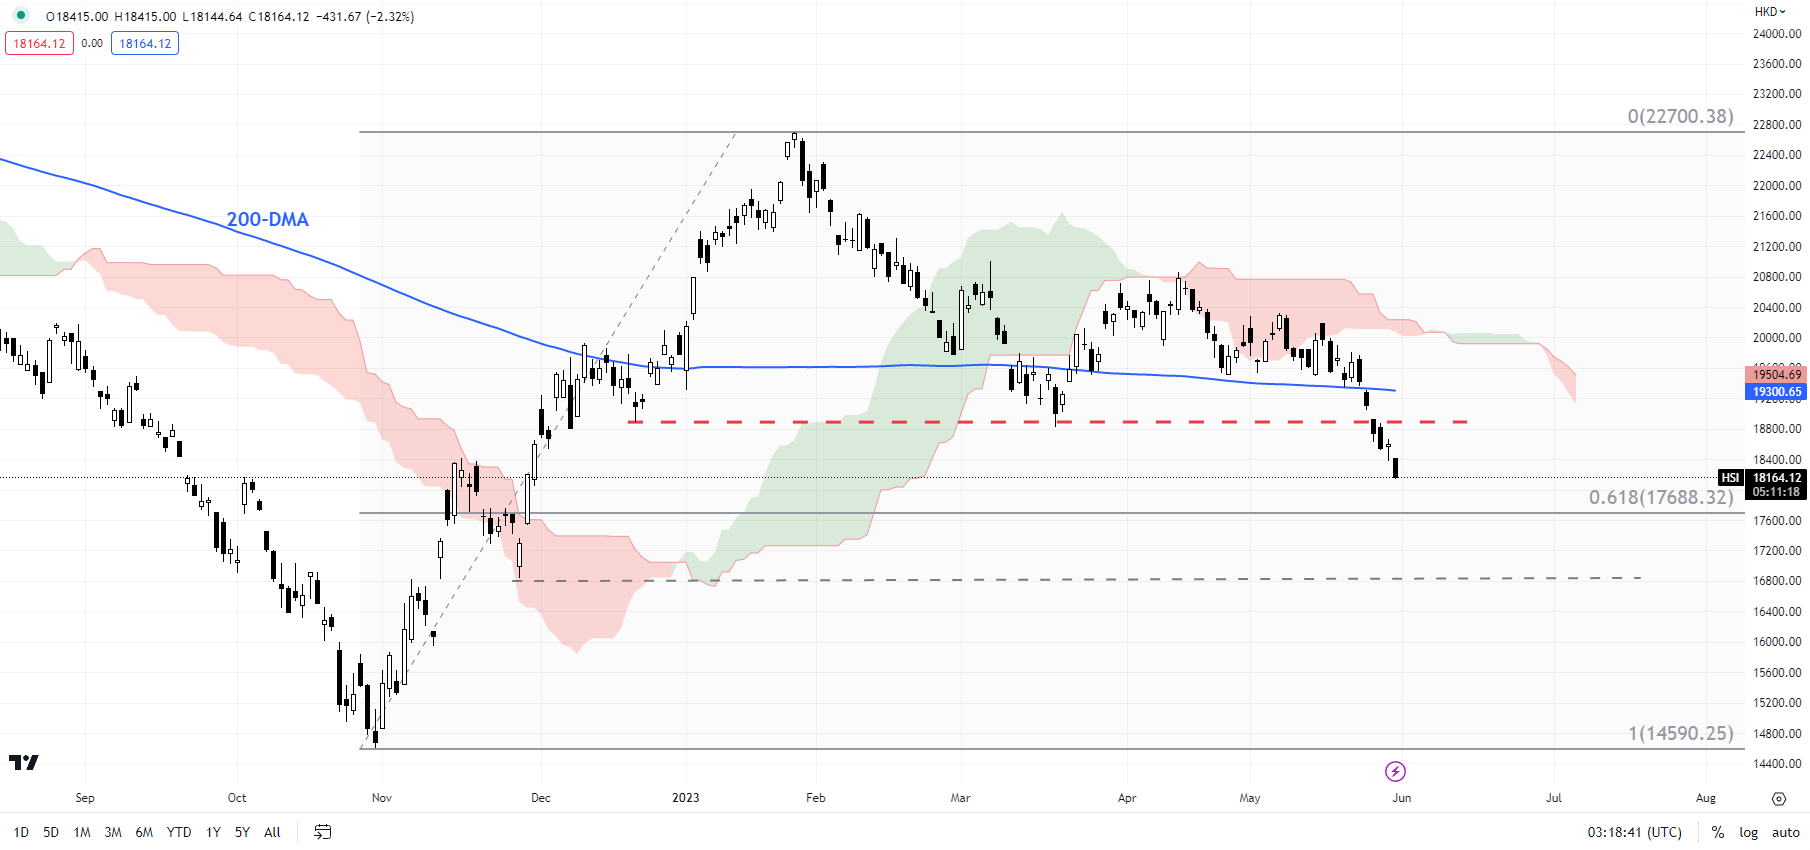
The Hang Seng Index has broken below key horizontal trendline support at about 18800, reversing the higher-top-higher-bottom sequence that began in late 2022. This follows a failure in April to rise above a vital ceiling at the March high of 21000. The index looks set to drop toward 17680 (the 61.8% retracement of the October 2022-January 2023 rally). Subsequent support is seen at the end-2022 low of 16830. On the upside, HSI, at minimum, would need to rise above the 200-day moving average for the downward pressure to begin fading.

ASX 200 Index Daily Chart

image3.png

ASX 200 Index: Tail risk bearish scenario

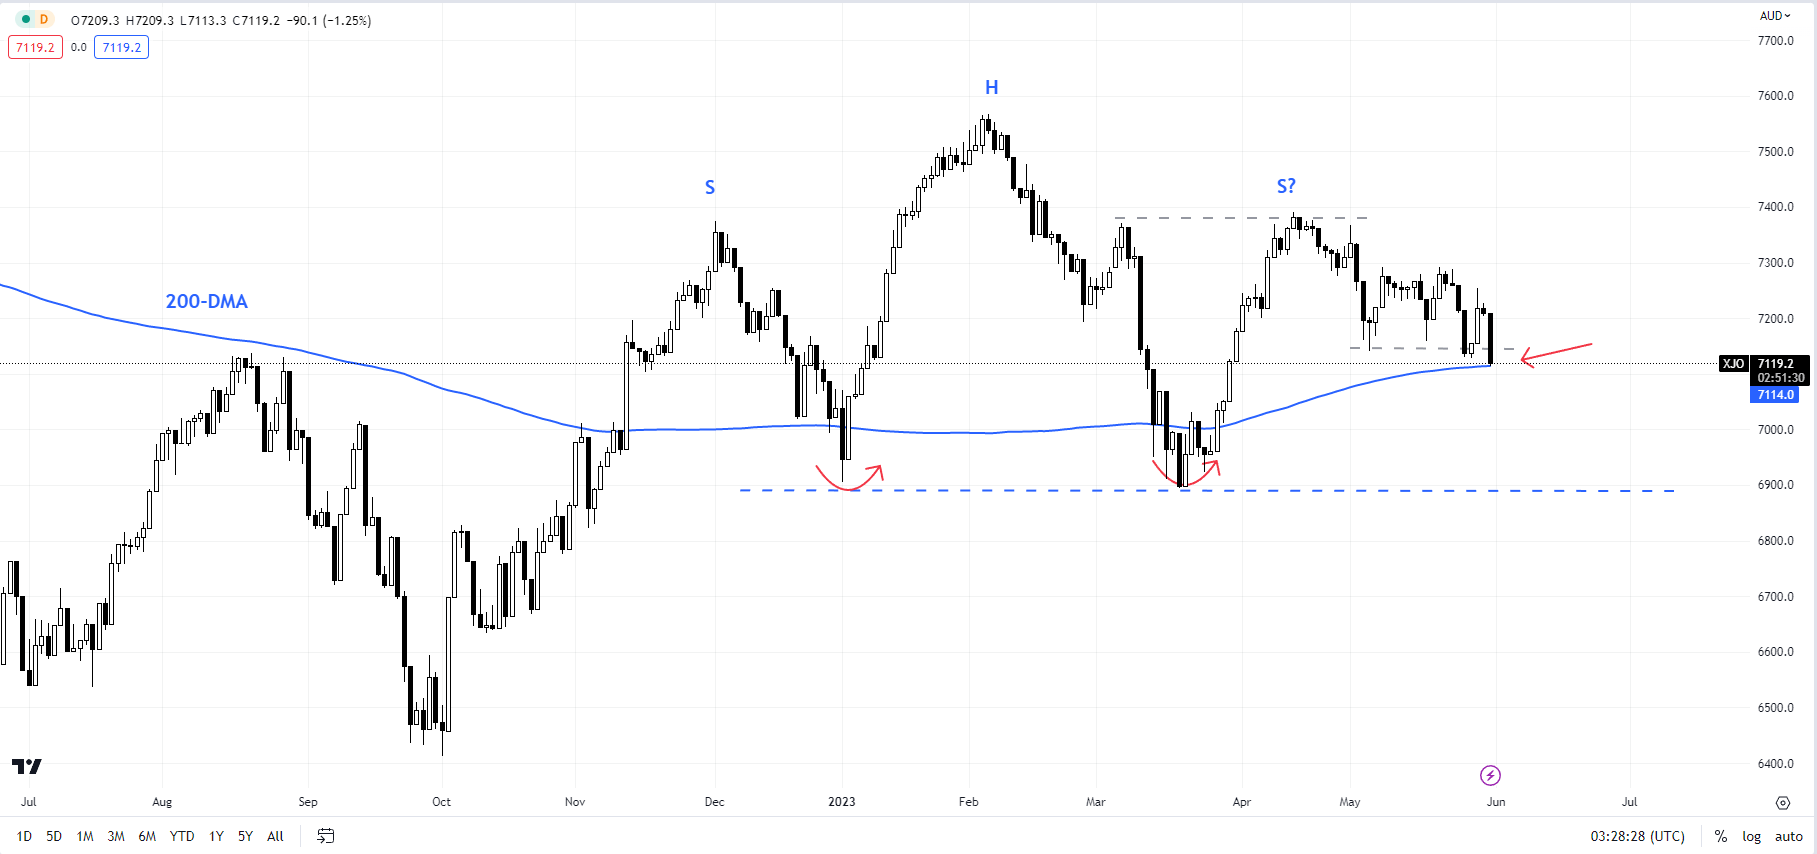
Probably a tail-risk scenario, but one that can’t be ignored. There is a potential head & shoulders pattern developing in the Australia ASX 200 index (the left shoulder at the December high, the head at the February high, and the right shoulder at the April high). There is a long way to go before the neckline (that comes at about 6900), and in all fairness, the pattern might not get triggered at all. Still, one needs to be mindful given the index is now attempting to break below immediate support at the early-May low of 7141, around the 200-day moving average. A decisive break could raise the odds of a drop toward the neckline.

FTSE Straits Times Index Weekly Chart

image4.png

FTSE STI: Risks a drop toward the lower end of the range

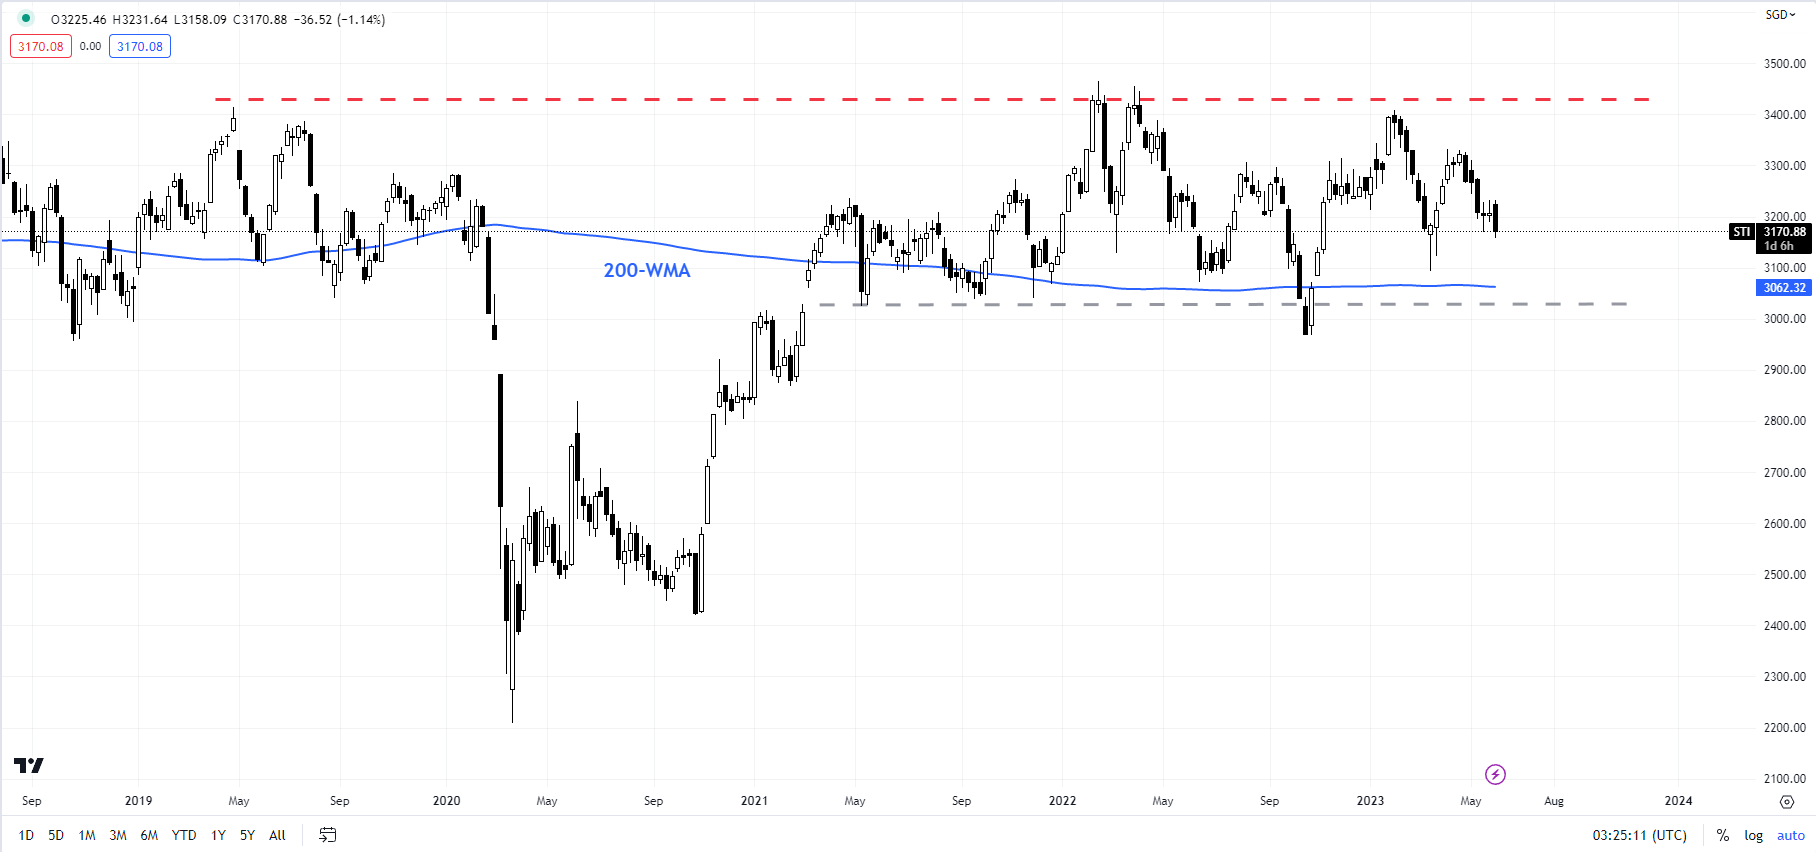
The retreat in February from stiff resistance on a horizontal trendline from 2019 and the subsequent lower high created in April has raised the odds of a drop toward the lower end of the range. Singapore FTSE Straits Times Index has been sideways for many months, and it looks like it may take a while before it starts trending again. Critical support is on the lower edge of the range at about 3025, near the 200-week moving average. A decisive break below could threaten the post-Covid uptrend.

AUD/USD risks a move to 0.6450 – UOB

AUD/USD risks a move to 0.6450 – UOB

In the opinion of Economist Lee Sue Ann and Markets Strategist Quek Ser Leang at UOB Group, AUD/USD faces further selling pressure as long as it trades below 0.6575.

Key Quotes

24-hour view: “Yesterday, we expected AUD to consolidate between 0.6500 and 0.6550. However, AUD traded in a range of 0.6521/0.6558. There is no directional bias for now and today, we expect AUD to trade sideways between 0.6490 and 0.6550.”

Next 1-3 weeks: “In our most recent narrative from last Friday (26 May, spot at 0.6505), we highlighted that the weakness in AUD that started in the middle of the month has yet to stabilize. We held the view that it could weaken further to 0.6450. Since then, AUD has not been able to make much headway below 0.6500 and downward momentum is beginning to slow. However, as long as 0.6575 (‘strong resistance’ level previously at 0.6590) is not breached, there is still a chance, albeit not a high one, for AUD to weaken to 0.6450.”

EUR/USD battles 1.0700 as China worries lift the US Dollar

EUR/USD battles 1.0700 as China worries lift the US Dollar

EUR/USD is testing 1.0700, retreating from near the 1.0740 region in Wednesday’s Asian trading. Dismal China’s NBS Manufacturing PMI and pre-US debt deal vote anxiety reinstate the US Dollar’s safe-haven appeal. US/ German data, Fedspeak and House vote in focus

The market sentiment remains fragile amid worries about slowing global economic growth. The fears were further fueled by the disappointing Chinese macro data released this Wednesday. In fact, the National Bureau of Statistics (NBS) reported that China’s factory activity shrank faster than expected in May and the official Manufacturing PMI fell to a five-month low of 48.8. Adding to this, service sector activity expanded at the slowest pace in four months and the official non-manufacturing PMI fell to 54.5 in May from 56.4 previous. This, along with concerns about the worsening US-China ties overshadow the optimism over raising the US debt ceiling and temper investors’ appetite for riskier assets. The anti-risk flow, meanwhile, leads to some follow-through slide in the US Treasury bond yields and might cap the USD.

Bullish traders, meanwhile, seem unaffected by hawkish remarks by several European Central Bank (ECB) officials, backing the case for more rate hikes in the coming months. In fact, ECB Governing Council Gediminas Šimkus said on Tuesday that he expects a 25 basis points (bps) rate hike in June and July. Furthermore, ECB policymaker Mario Centeno said earlier this Wednesday that further adjustments are still necessary, albeit noted key interest rate is approaching its peak. This, in turn, warrants some caution for bears ahead of the flash German consumer inflation figures. Later during the early North American session, traders will take cues for the US economic docket, featuring the release of the Chicago PMI and JOLTS Job Openings data. This, along with speeches by influential FOMC members, the US bond yields and the broader risk sentiment, will drive the USD demand and provide some meaningful impetus to the EUR/USD pair.

EUR/USD Price Outlook: Reprieve for the Euro as USD, Yields ease

EUR/USD Price Outlook: Reprieve for the Euro as USD, Yields ease

Persistent US Inflation and Worsening Euro Economic Prospects Weigh on EUR/USD

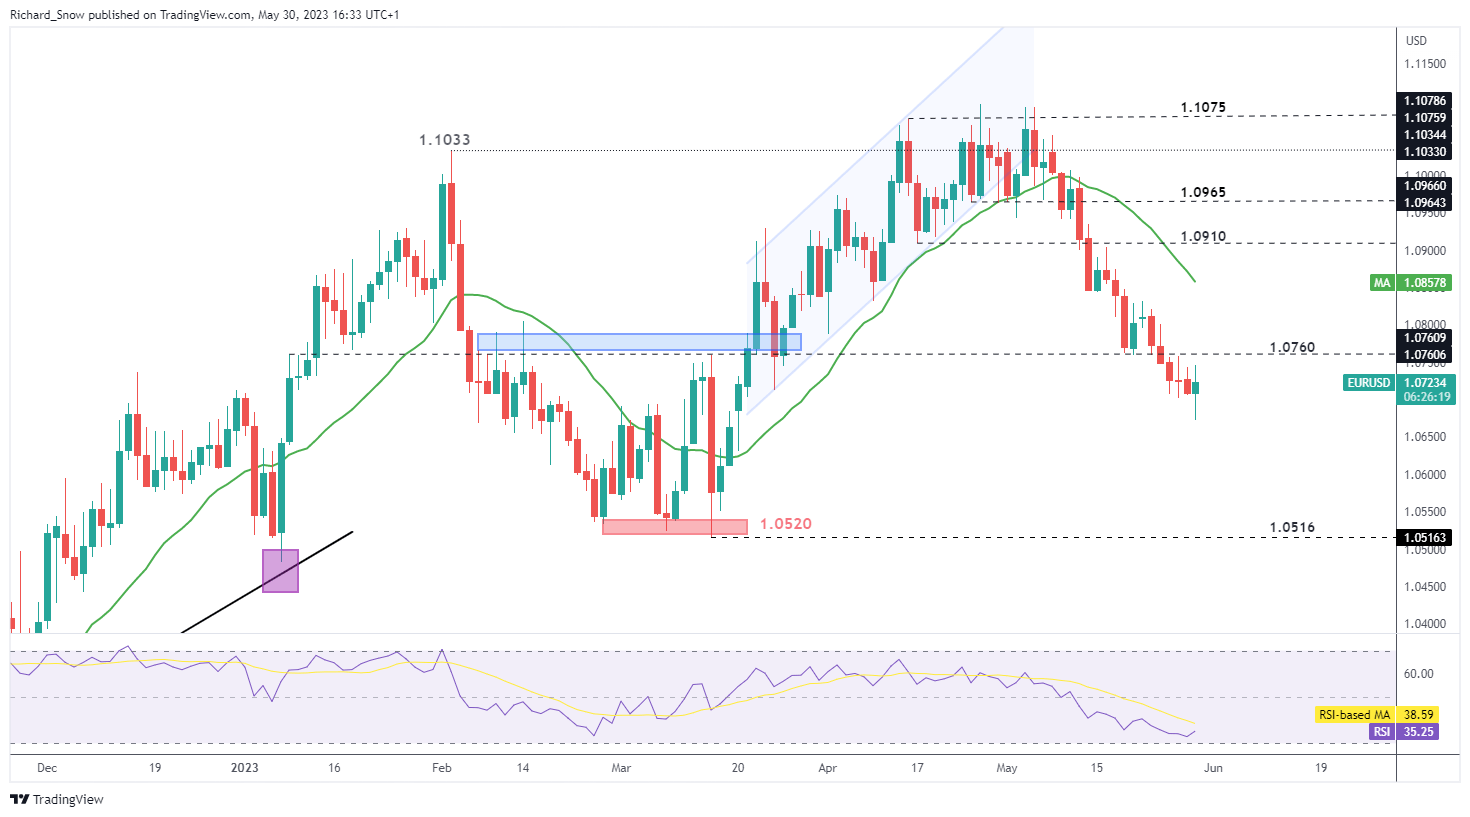
Ever since the bearish break below 1.0910, EUR/USD price action has been relentless. Aided by shifting US rate expectations, the dollar has strengthened against major currencies with the euro no exception. Traders initially expected around 75 basis points of Fed cuts before year end at the time when the banking industry suffered from a wave of uncertainty as three regional US banks imploded. The effects were felt in Europe where the already beleaguered Credit Swiss had to be absorbed onto local rival UBS.

Since then, the banking sector appears to have stabilized, despite banking indices yet to fully recover. More recently, persistent inflation in the US has forced traders to rethink the path of future interest rates as the Fed contemplates another 25-bps hike or a ‘skip’ – essentially allowing the Fed more flexibility.

EUR/USD Technical Levels of Consideration

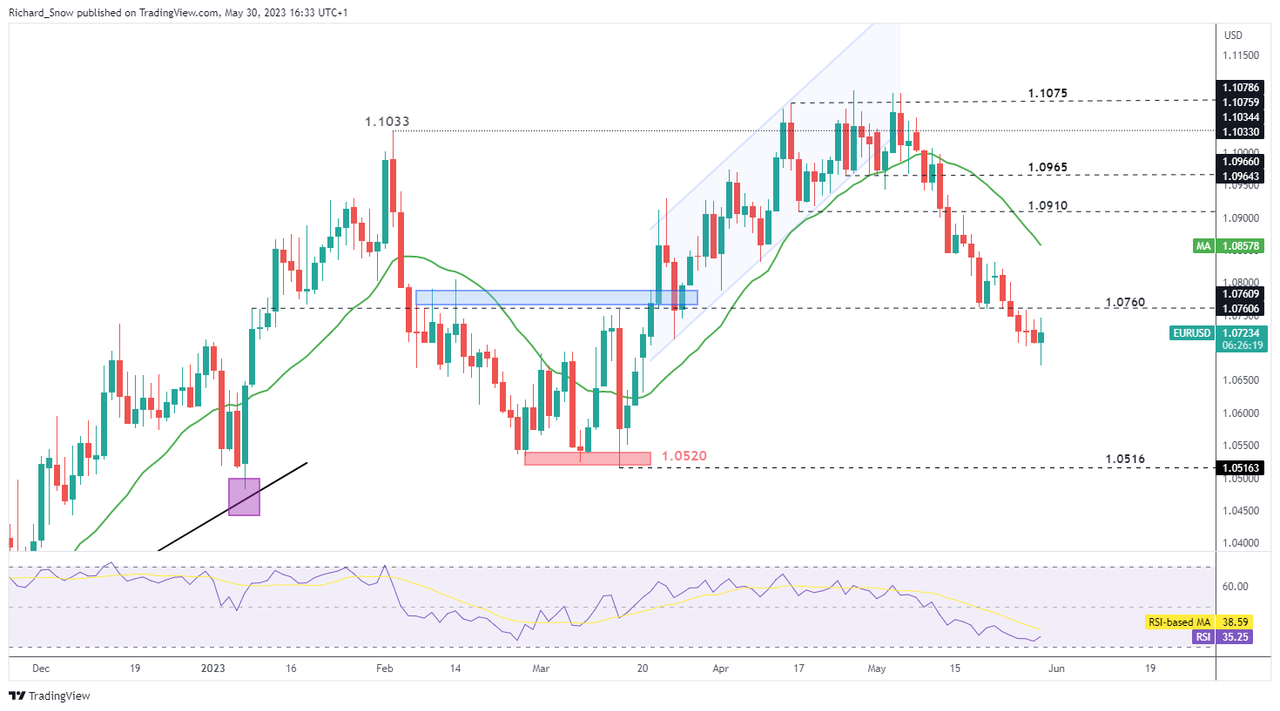
Throughout the sell-off, pullbacks have been very shallow – a signal of strong directional momentum. Price action has moved through prior levels of support with ease, trading below 1.0760 more recently. Today’s move higher attempts to test the same level, now as resistance. EUR/USD bears will be watching this level with great interest, looking for a rejection of higher prices and possible bearish continuation. Support comes in all the way at 1.0516 – the level observed in March.

Daily EUR/USD Chart

image1.png

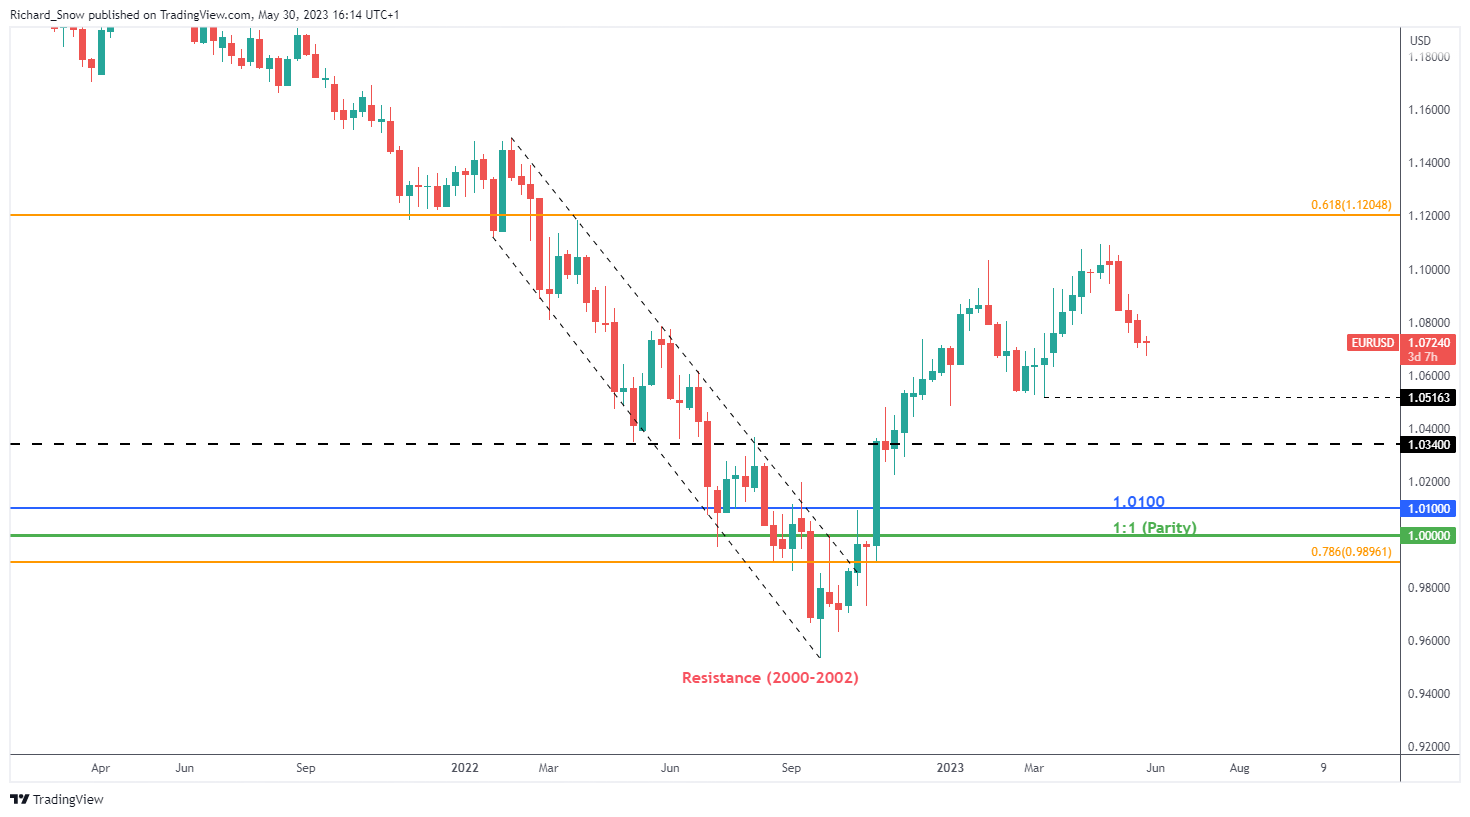
The weekly chart reveals the shorter-term trend in the context of the much broader bullish trend that is yet to be invalidated. The next level of consideration appears at the March low, where the viability of the longer-term trend ought to be reassessed.

Weekly EUR/USD Chart

image2.png

Major Risk Events Ahead

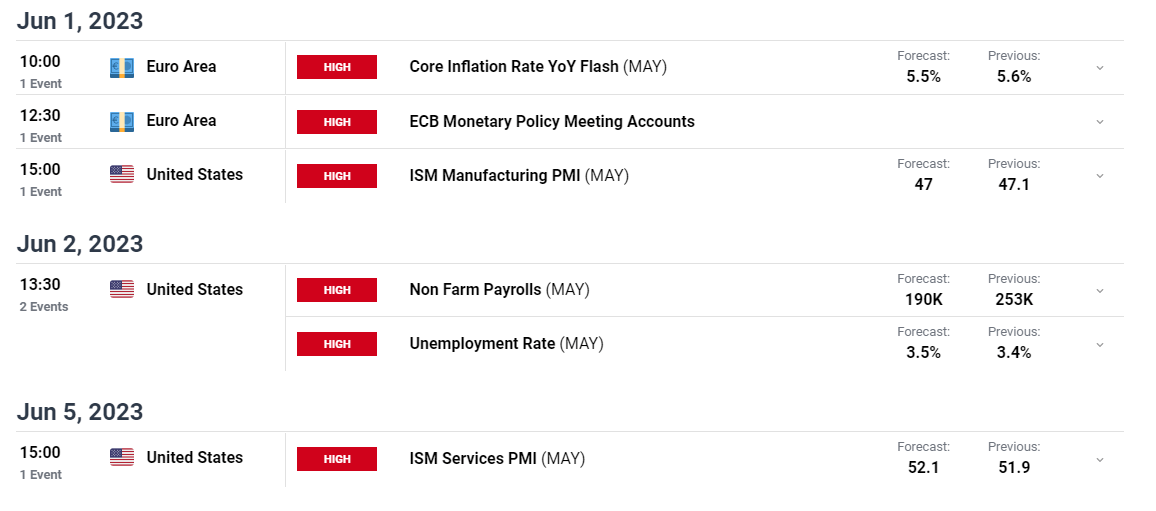
In the absence of the biggest market theme at the moment (US debt ceiling), EU and US event risks pick up this week with the inclusion of inflation, manufacturing and labour market data. On Thursday, EU inflation data for May will shed more light on whether the trading bloc may have peaked as far as core inflation is concerned.

On Friday US NFP data and the accompanying wage data will be watched closely by the Fed ahead of their mid-June FOMC meeting. Central banks are motivated to avoid a wage-price spiral – a situation where higher wages improve the purchasing power of consumers who pay higher prices for goods, adding further to the elevated prices and resulting in further wage increases. The ISM services print is due on June 5th – the ‘X date’ for a potential US default if a deal cannot be agreed.

image3.png

Crude Oil Prices in Tailspin amid Demand Worries and OPEC+ Infighting

Crude Oil Prices in Tailspin amid Demand Worries and OPEC+ Infighting

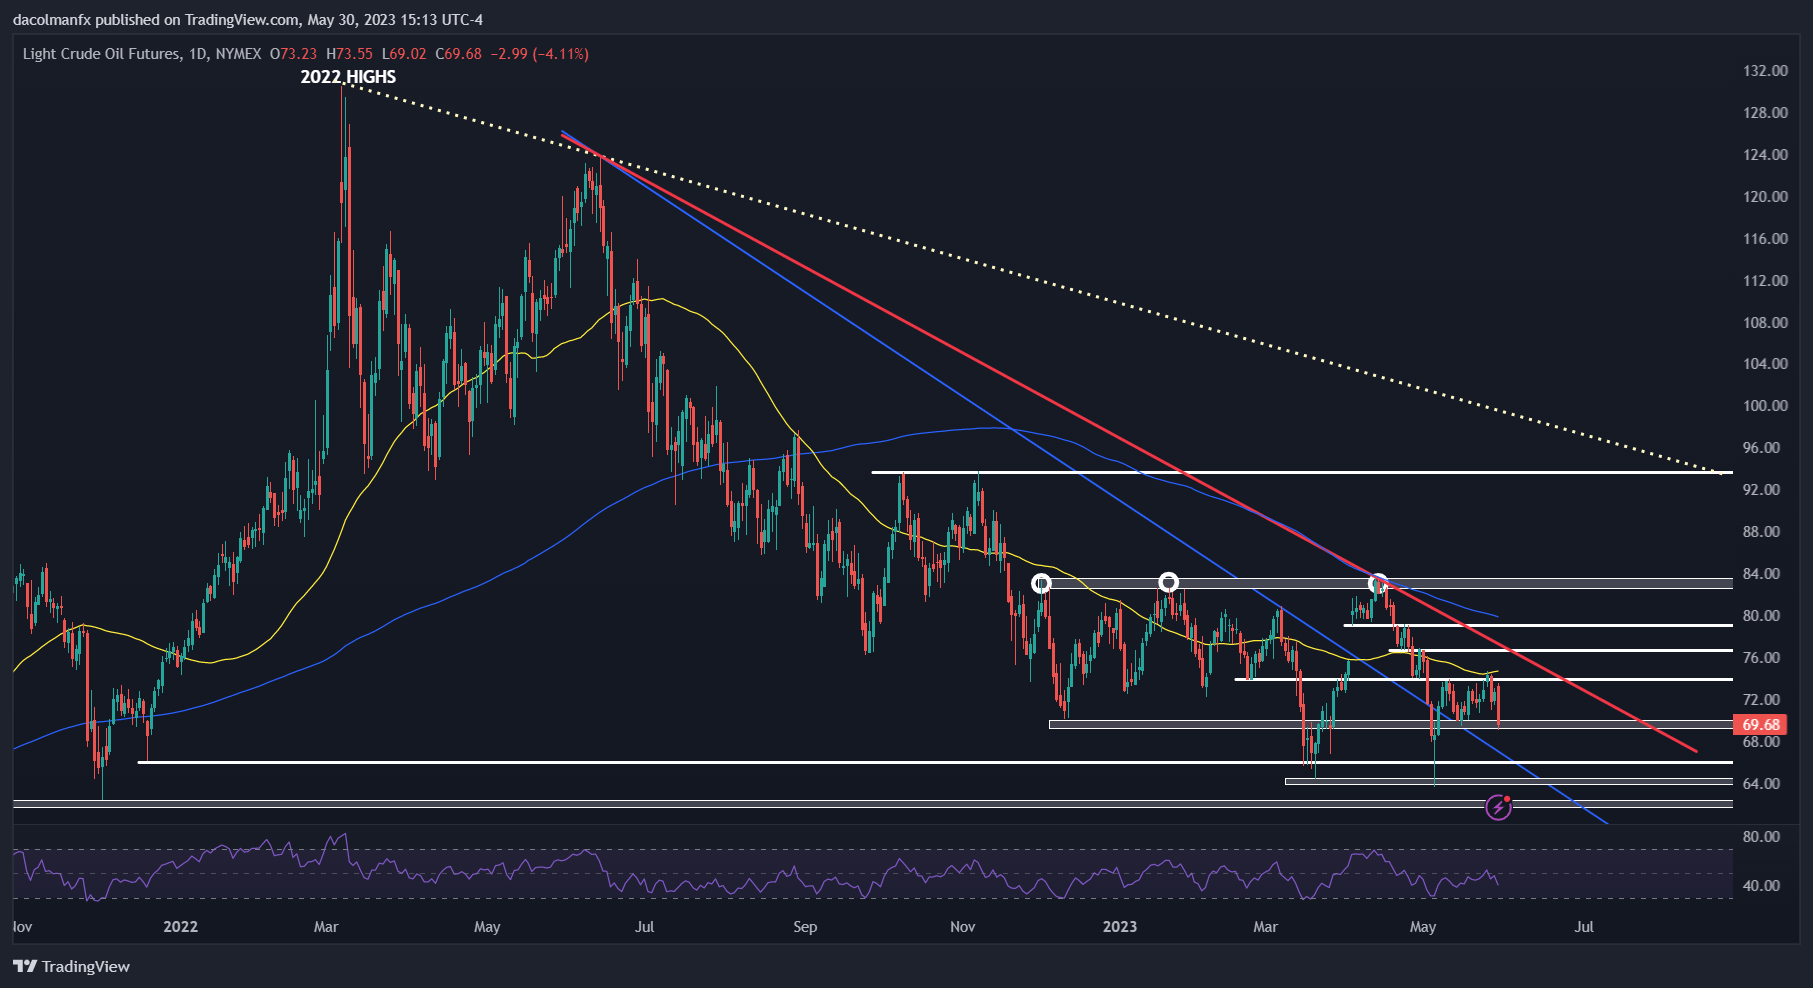
Crude oil prices (WTI futures) plunged on Tuesday, falling more than 4% to $69.65 per barrel, undermined by heightened uncertainty over demand prospects amid increasing global headwinds, including slowing growth, rising rates and OPEC+ infighting.

While the removal of China’s coronavirus restrictions earlier in the year was seen as a game changer for fossil fuels, the reopening of the Asian economy has fallen short of expectations, with economic activity flattening out in recent weeks.

Swelling supplies from Russia also appears to be weighing on the commodity. Although OPEC+ slashed output a couple of months ago, Russia has continued to pump huge volumes of crude in an effort to maximize its revenues, reneging on its promise to throttle production.

The OPEC+ internal strife may prevent the cartel from further reducing quotas at the June meeting, as many members may voice opposition to such a move given recent developments. This situation may keep physical markets in surplus during the second half of 2023, especially if the global economy takes a turn to the downside.

The Fed’s policy outlook is complicating matters for oil. A few weeks ago, traders were convinced that policymakers would hit the pause button next month, but expectations have since shifted in a more hawkish direction, with Wall Street starting to lean in favor of another 25 basis point hike.

Although the U.S. economy has remained resilient, investors are forward-looking, which means they are more concerned about what might happen down the road rather than today. In this context, the more rates rise, the worse the economy and cyclical commodities will perform over the medium term.

In terms of technical analysis, oil is hovering above an important support zone near $69.40 after Tuesday’s selloff. If bears manage to push prices below this floor in the coming days, we could see a move toward the psychological $66.00 level in short order.

On the flip side, if WTI establishes a base around current levels and turns higher, initial resistance lies at $74.00. Upside clearance of this ceiling could open the door for a rally toward $76.50, followed by $79.00, just a touch below the 200-day simple moving average.

CRUDE OIL PRICES TECHNICAL CHART


Taking Your Trading International: Risks and Rewards

Taking Your Trading International: Risks and Rewards

Traders tend to focus on their domestic markets at the start of their careers. That’s natural and understandable enough. Local knowledge of conditions and market dynamics is likely deeper, the essential feeling of being plugged into the economic news cycle that much stronger. At the most basic level we all make more confident decisions when we feel we have more relevant facts at our command. Traders are certainly no different.

However, it’s now very easy to access global assets, be that in the foreign exchange, fixed-income, equity or commodity space. It can be well worth taking advantage of the opportunities offered by a broader geographical spread.

Traders usually look overseas for two main reasons. The first is to diversify trading opportunities, broadening their risk profile and reducing reliance on market conditions in just one place. The second is to take advantage of perhaps better growth prospects elsewhere.

So if you feel it’s time to start trading beyond your borders, what’s the best way to start?

image1.png

Stick to Major Markets At First, They’re Easier to Trade Out Of

When looking at overseas markets for the first time, it’s probably wise to cleave to the major ones. They’ll offer the deepest and most liquid pools of capital and the sort of trading environment that makes it easier to get out if you make a mistake. Which you probably will.

In foreign exchange think of the ‘major’ currencies. The US Dollar and the Euro dominate, with the Japanese Yen, Swiss Franc and British Pound also very widely traded. Below them, the dollars of Australia and Canada are popular trading choices. China’s Renminbi as well as the Hong Kong and New Zealand Dollars round out the global top ten. Those countries’ stocks and bonds are likely the first stops in international trading in those asset classes too.

Are You Risk On, or Risk Off?

Now is certainly an interesting time to consider an overseas approach as we could be seeing a major change. The last couple of decades were years of extraordinary connectivity between global markets as economies became more and more globalized, inflation was docile and interest rates low.

The effect of this was to sort nearly all global assets into just two camps, which went by the somewhat bizarre monikers of ‘risk on’ and ‘risk off.’ What they meant was that, when a piece of economic data was released suggesting stronger growth ahead – perky US employment figures, strong Chinese industrial production or what have you – the ‘risk on’ assets would rise in impressive unison.

These included stock markets, industrial commodities and the currencies of major commodity producers, such as Australia and Canada. The stronger global growth was, the greater the demand for commodities and the currencies needed to buy them. That’s a fairly clear correlation.

On the flipside, weaker economic numbers would see ‘risk off’ assets supported. The ranks of these included perceived ‘haven’ currencies like the Swiss Franc along with gold, bonds and, often, for specific reasons of its own, the Japanese Yen. With ultra-low interest rates long the norm in Japan, it’s hard to see the Yen as any kind of real haven for investors. But those same low rates forced Japanese investors to look overseas for yield. When overseas growth seemed threatened, a lot of that cash came home.

This market connectivity was enhanced by the monetarism which had gained force since the early 1980s, part of a concerted global effort to smash the inflationary forces which had played hell with developed economies in the 1960s and ‘70s. Interest rate policy became the key global market driver, much as industrial policy had been in the generation before. The US Federal Reserve tended to run this table, with just about every traded market on Earth reacting to what the Fed did, said and implied about the future.

It still does. Other major central banks tend to shadow the Fed to some extent, but they, too generate significant cross-market impact.

We’re still living in that world to a very large degree, but it’s clear that some changes have taken place over the past twelve months. An inflation surge, the Covid pandemic’s supply chain destruction and war in Ukraine have all taken their toll, as have deteriorating relations between China and the West. Previously unchallenged, even economic globalization is up for debate as never before. Nervous Western politicians increasingly seek supply security rather than merely encouraging ever-freer trade.

So, What Now?

For the trader considering a move out of his or her home market these are certainly interesting times. If current conditions persist we are likely to see more fragmented, less correlated and less liquid markets. These will of course bring opportunities of their own, but taking advantage of these will very likely require a lot more learning and judgement than would have been the case in a more globalized world.

It’s likely that those countries most successful in the anti-inflation fight, and their markets, are going to be the near-term winners. But the extent to which that dynamic replaces the old risk calculus, and how durably, is perhaps the most important thing for would-be global traders to weigh up right now.


Australian Dollar Jolted by Soft China Data and Mixed Local Action. Lower AUD/USD?

Australian Dollar Jolted by Soft China Data and Mixed Local Action. Lower AUD/USD?

The Australian Dollar dipped toward its six-month low under 65 cents after Chinese PMI missed forecasts. The data appears to have further fermented the perception that the world’s second-largest economy is struggling to reignite growth as it re-emerges out of the pandemic era.

Chinese manufacturing PMI for May printed at 48.8 against the 49.5 anticipated and the non-manufacturing came in at 54.5, against the 55.2 forecast. This combined to give a composite PMI read of 52.9 against 54.4 previously.

The China PMI indices are the result of a survey of 3,000 manufacturers across China, mostly large firms. It is a diffusion index, so a reading over 50 is viewed as a positive of the economic outlook for the Middle Kingdom.

At the same time that China PMI came out, Australian private sector credit for April showed growth of 0.6% month-on-month against the 0.3% expected.

This contributed to an annual read of 6.6% year-on-year against 6.8% prior. The monthly CPI gauge from the Australian Bureau of Statistics (ABS) ticked higher to 6.8% year-on-year to the end of April, above forecasts of 6.4% and 6.3% previously.

Today’s data comes on the back of yesterday’s disappointing Australian building approvals for the month of April which fell by -8.1% month-on-month instead of the 2% rise that had been anticipated.

Elsewhere today, RBA Governor Philip Lowe appeared before the Senate Economics Legislation Committee earlier in the day and he reiterated the bank’s determination to fight inflation.

He cited the issues of wage-price pressures and the difficulties of getting CPI back within the target range of 2- 3% when the wage-price index is at 3.7%. He also noted that September will see a significant amount of fixed-rate mortgages rolling off from very low rates to today’s much higher borrowing costs.

Interest rate futures are expecting no change at the RBA’s monetary policy meeting next Tuesday.

For the Aussie Dollar, a sluggish Chinese economy and a negative interest rate differential to many parts of the world might continue to undermine the currency.

AUD/USD PRICE REACTION – 1-MINUTE CHART


Retreat in US Yields Supports Gold, But for How Long? XAU/USD, XAU/EUR Price Setups

Retreat in US Yields Supports Gold, But for How Long? XAU/USD, XAU/EUR Price Setups

Gold rose on Tuesday, tracking the decline in US Treasury yields after a deal in Washington to raise the government’s debt ceiling, potentially averting a catastrophic government default. But is the short-term downtrend in the yellow metal over?

Yields on near-end US Treasury bills fell sharply even as the deal needs to secure blessings from Congress before June 5, when the Treasury Department could run out of funds to pay its debts. A vote on this is expected to occur in the House on Wednesday which gives the Senate time to consider it before June 5.

XAU/USD 240-minute Chart

image1.png

However, the upside in gold could be capped by growing odds of another rate hike by the US Federal Reserve at its next meeting. Markets are pricing in a 60% chance of a 25 bps Fed rate hike at the June meeting up from 25% about a week ago, according to the CME FedWatch tool.

XAU/USD Daily Chart

image2.png

XAU/USD: Short-term trend remains down

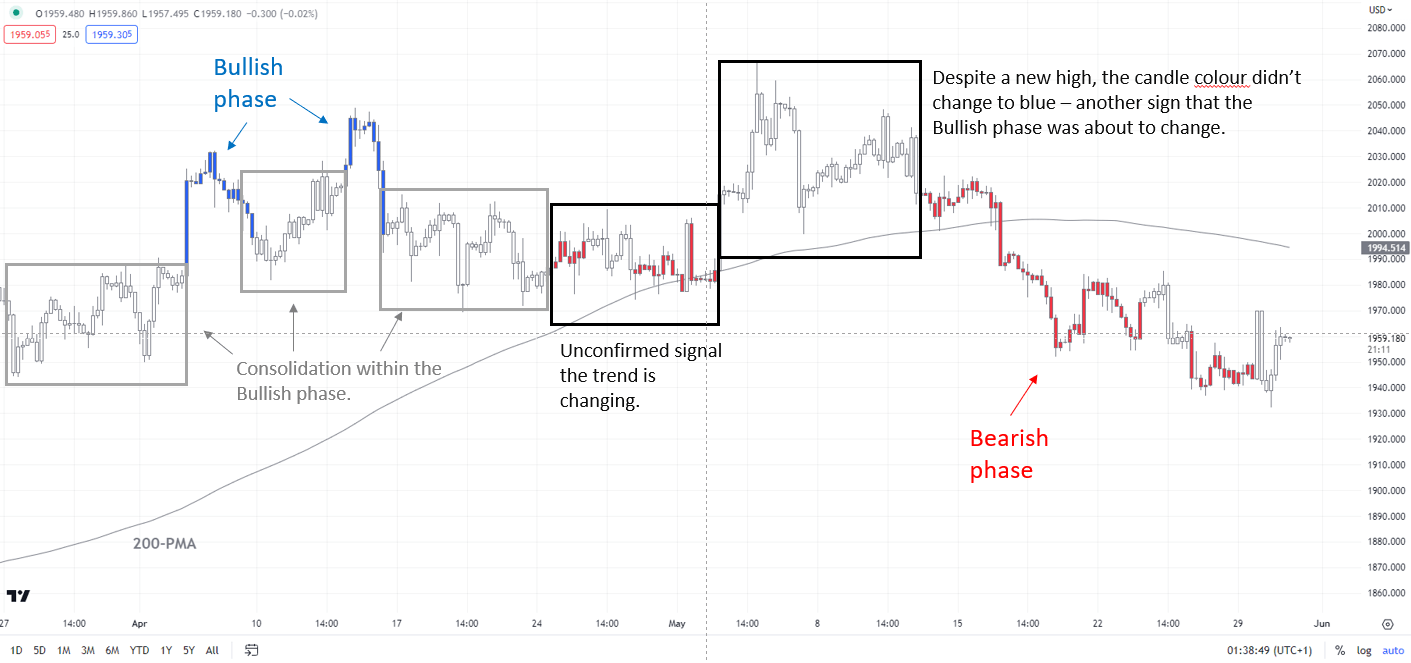
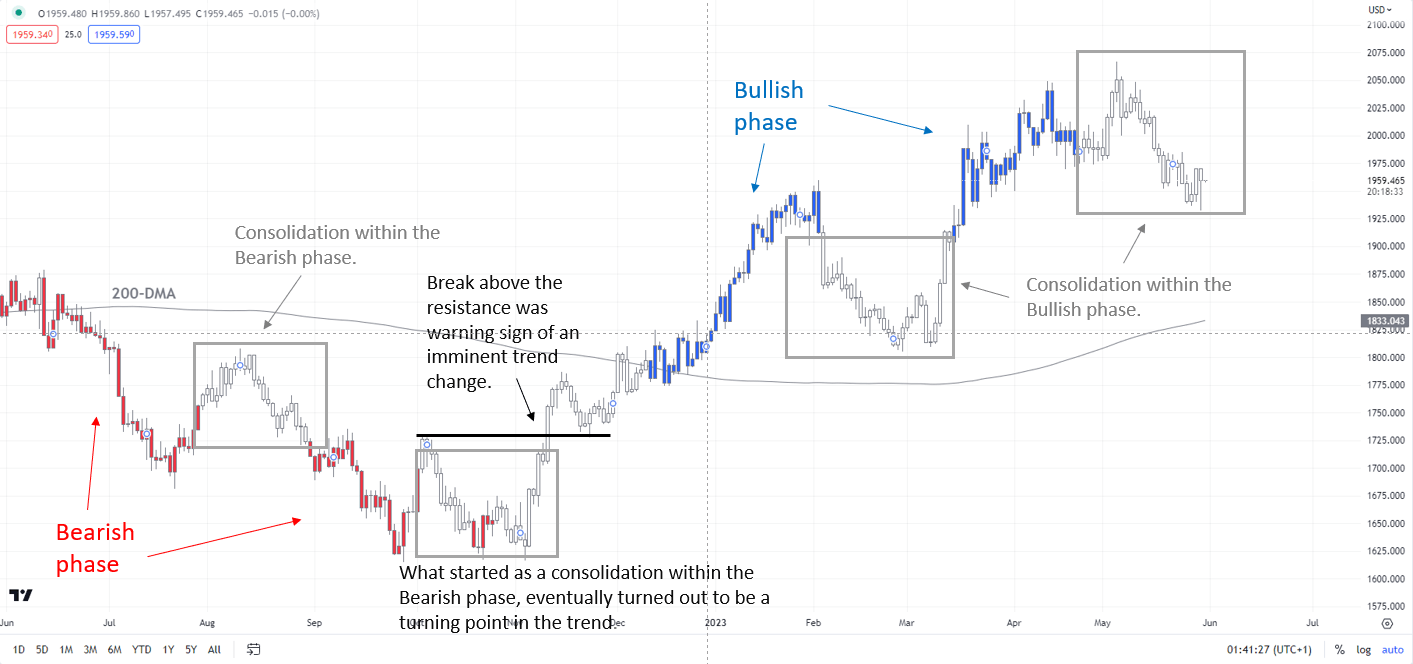
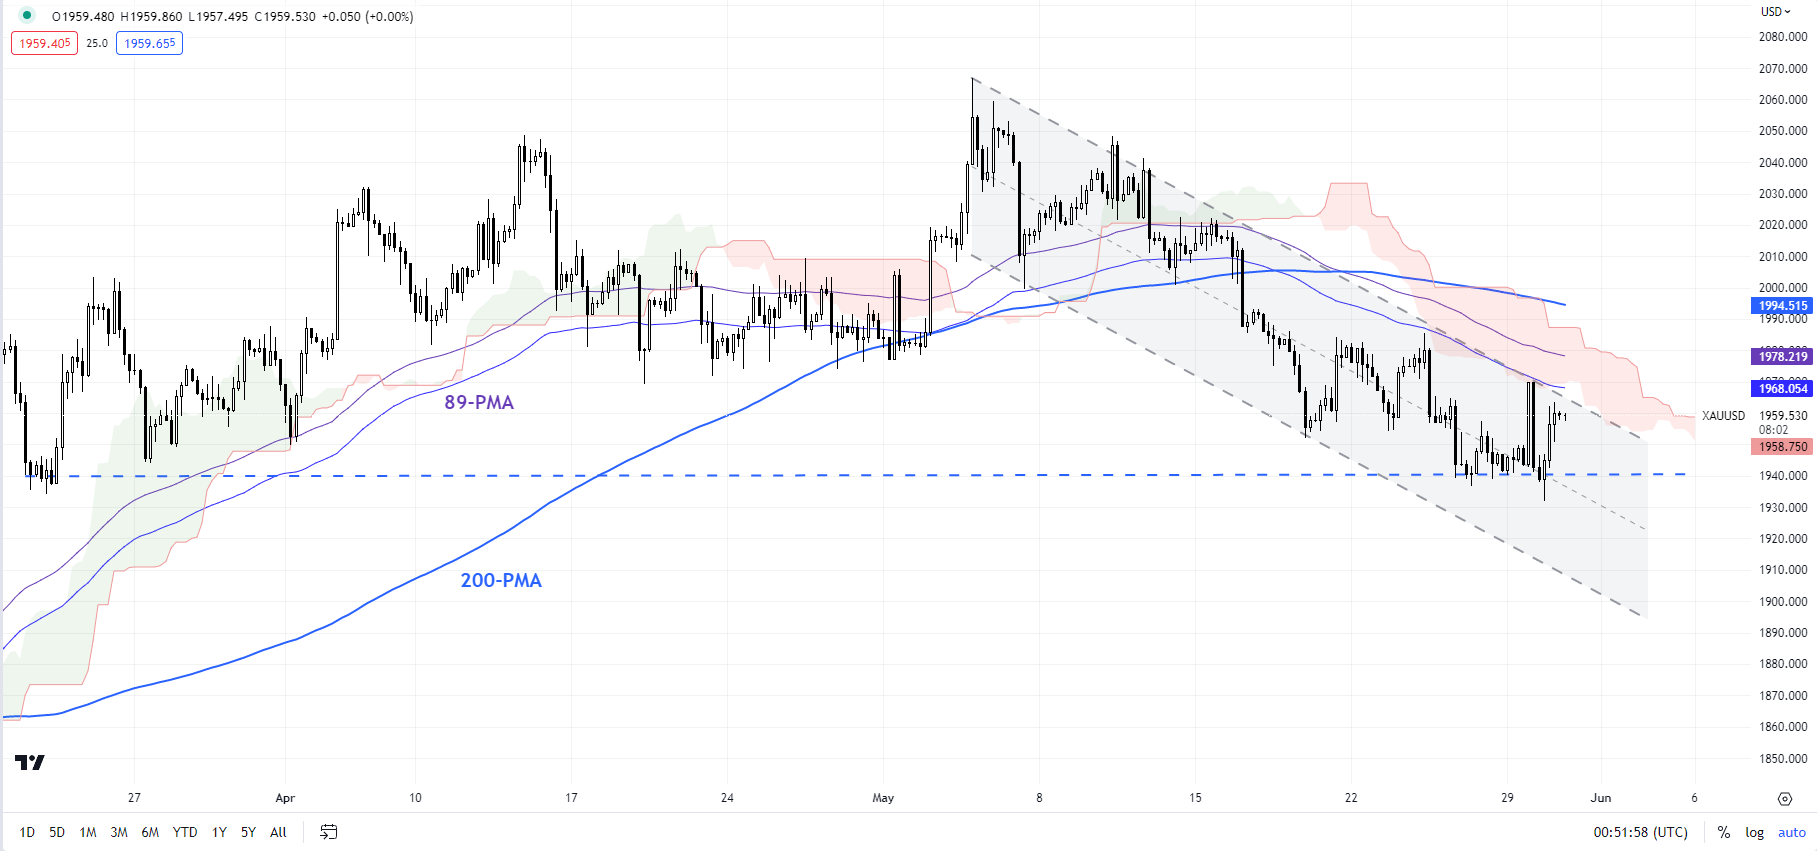
On technical charts, XAU/USD remains within a well-defined downtrend channel since early May on the 240-minute charts, a point reinforced by colour-coded candlestick charts, based on trending / momentum indicators. For the immediate downward pressure to fade, the yellow metal needs to break above the 1985-2000 area (including the 200-period moving average and the late-March high on the 240-minute charts).

XAU/USD Daily Chart

image3.png

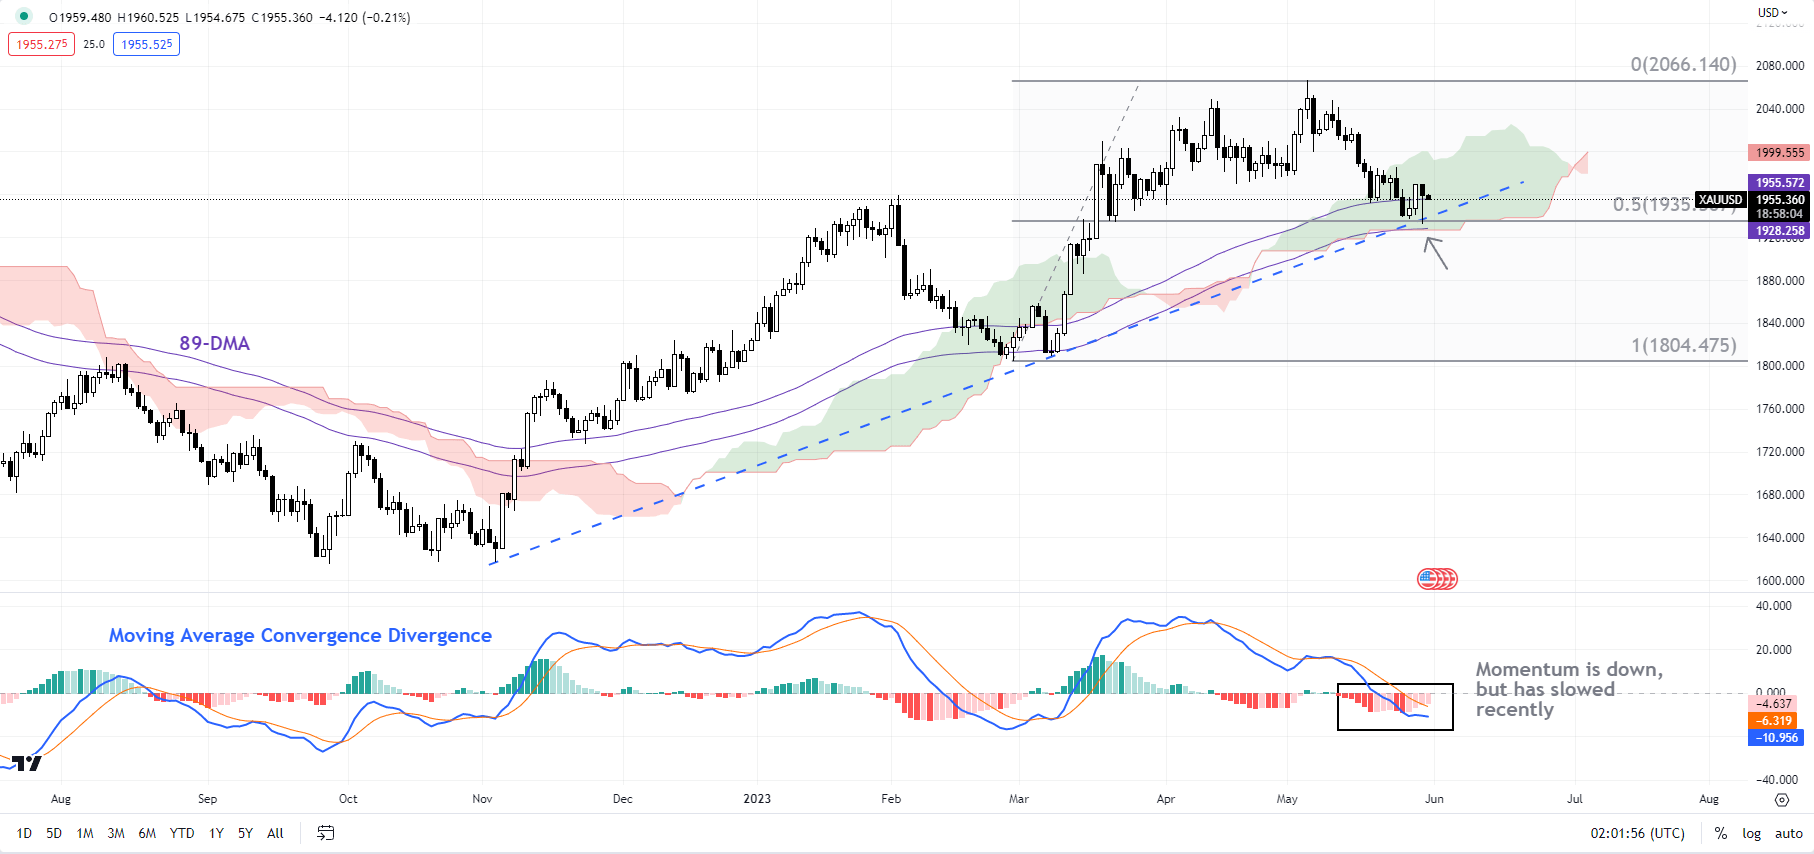
On the daily charts, as the colour-coded candlestick charts show, the trend has moved to a consolidation phase within the overall bullish structure. If history is any guide, consolidations can extend from a few days to a few weeks. So far, gold is holding above quite a strong cushion around 1930, including an uptrend line from the end of 2022, the 89-day moving average, and the lower edge of the Ichimoku cloud on the daily charts. This support is crucial, and any break below could open the door toward the 200-day moving average (now at about 1835).

XAU/USD 240-minute Chart

image4.png

Beyond the daily charts, in recent months, the momentum on higher timeframe charts has been a concern – see previous updateson March 28,April 16,April 24,May 10, May 17, and the most recent “Is the Downward Correction in Gold Over?”, published May 22.

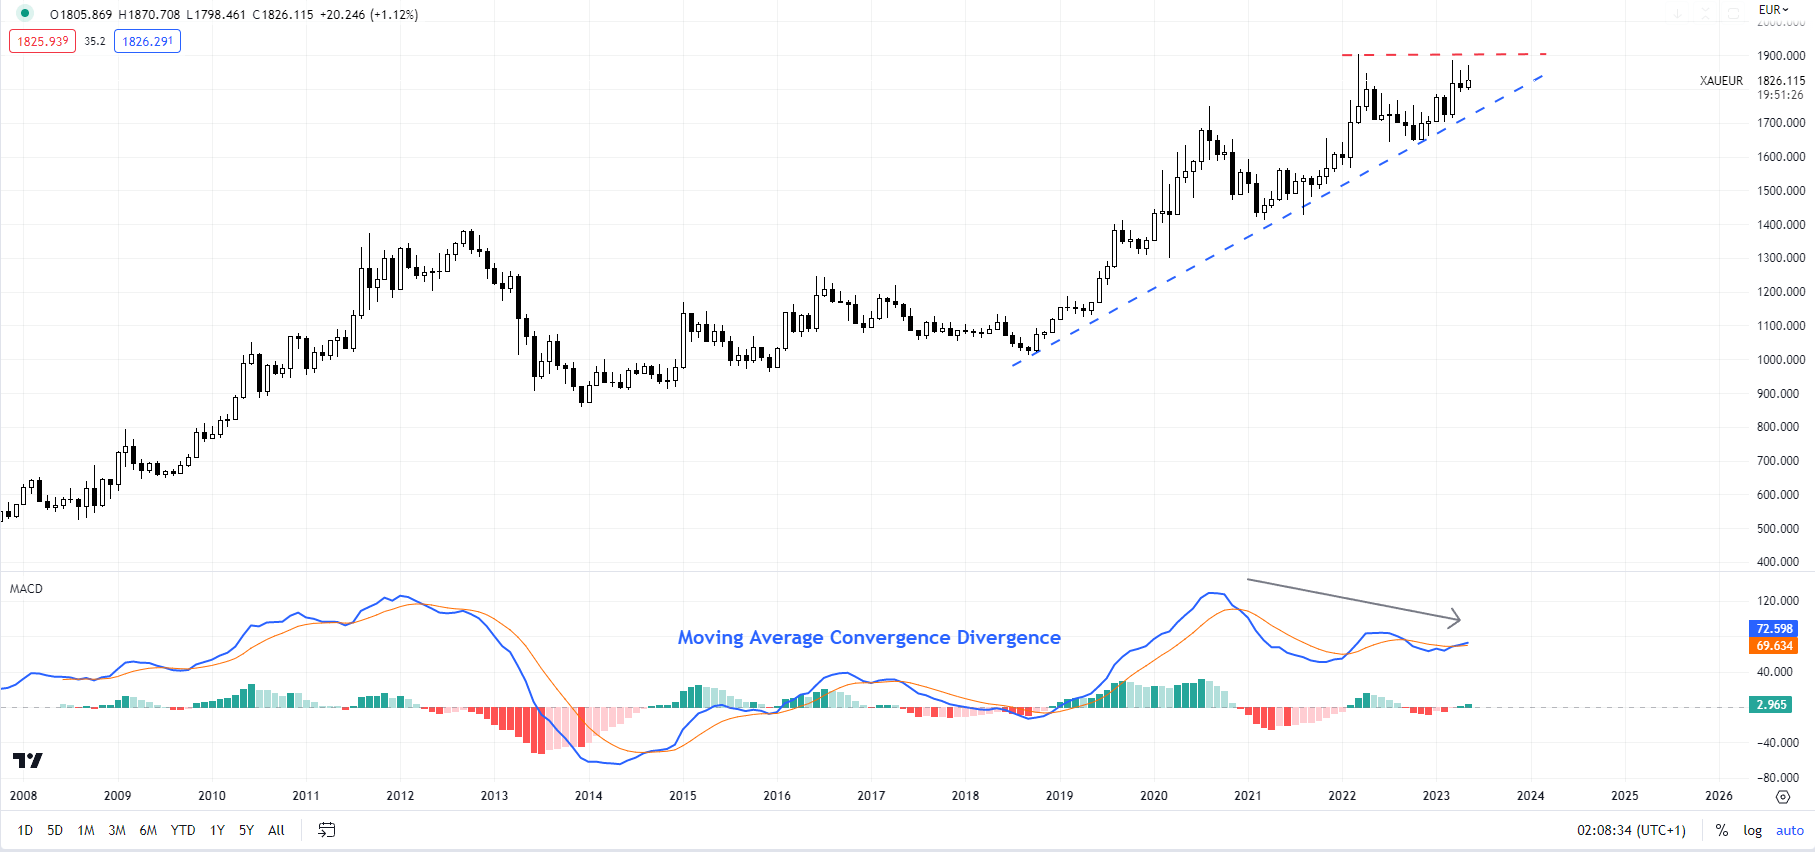
XAU/EUR Monthly Chart

image5.png

XAU/EUR: Slowing momentum on higher timeframe charts

Like in the case of XAU/USD, the momentum on higher timeframe charts has slowed even as XAU/EUR has made new highs in recent months. Most recently, gold has failed to cross above the March highs of 1865-1885 against the euro. Any break below an uptrend line from early 2021 (at about 1725) would indicate that the upward pressure had faded in XAU/EUR.

Note: In the above colour-coded charts, Blue candles represent a Bullish phase. Red candles represent a Bearish phase. Grey candles serve as Consolidation phases (within a Bullish or a Bearish phase), but sometimes they tend to form at the end of a trend. Note: Candle colors are not predictive – they merely state what the current trend is. Indeed, the candle color can change in the next bar. False patterns can occur around the 200-period moving average, or around a support/resistance and/or in sideways/choppy market. The author does not guarantee the accuracy of the information. Past performance is not indicative of future performance. Users of the information do so at their own risk.

Japanese Yen Gains on Intervention Warning as US Dollar Steadies

Japanese Yen Gains on Intervention Warning as US Dollar Steadies

The Japanese Yen rallied toward the end of the Asian session on Wednesday as markets recalibrate the prospect of Japanese authorities intervening in USD/JPY.

Masato Kanda, Japan’s Vice Finance Minister for international affairs, intimated late Tuesday that authorities may act to curd the sinking Yen. He said, “We will closely watch currency market moves and respond appropriately as needed.”

On the topic of intervention, he further ventured, “If necessary, we won’t rule out every option available,”

The Bank of Japan directly intervened several times last year as USD/JPY climbed. Initial buying of Yen near 137 did little to stem the flow, but the bank persisted and continued selling IUSD/JPY toward the peak near 152.

With USD/JPY above 141, the jawboning would seem inevitable in hindsight. There remains potential for more verbal entreaties toward market participants.

The BoJ’s extremely loose monetary policy remains in place for now and today’s industrial production for Japan is not seen as helpful for a tilt away from the stance. Month-on-month output for April decreased -0.4% against forecasts of a 1.4% gain and 1.1% prior.

Going into Wednesday the focus for the next few sessions seems to be on the debt deal being passed. Expectations are that it will get over the line after several comments from Washington lawmakers overnight.

Aside from USD/JPY, the US Dollar is stronger across the board with the high beta AUD and NZD bearing the brunt of Chinese PMI figures missing estimates.

Chinese manufacturing PMI for May printed at 48.8 against the 49.5 anticipated and the non-manufacturing came in at 54.5, against the 55.2 forecast. This combined to give a composite PMI read of 52.9 against 54.4 previously.

APAC equities are all in the red with the perspective of slowing growth in the region becoming apparent. South Korea’s KOSDAQ is the only bright spot in today’s trade.

Treasury yields are steady going into the European session after sliding overnight. The 2-year note saw the largest declines, trading toward 4.4% today after nudging 4.64% late last week.

The slide in yields boosted gold with the front-month COMEX futures contract now trading back near US$ 1,980, after bouncing off support at US$ 1,936 yesterday.

Crude oil remains under pressure after yesterday’s collapse. The WTI futures contract is under US$ 69.50 bbl while the Brent contract is below US$ 73.50 bbl.

The full economic calendar can be viewed here.

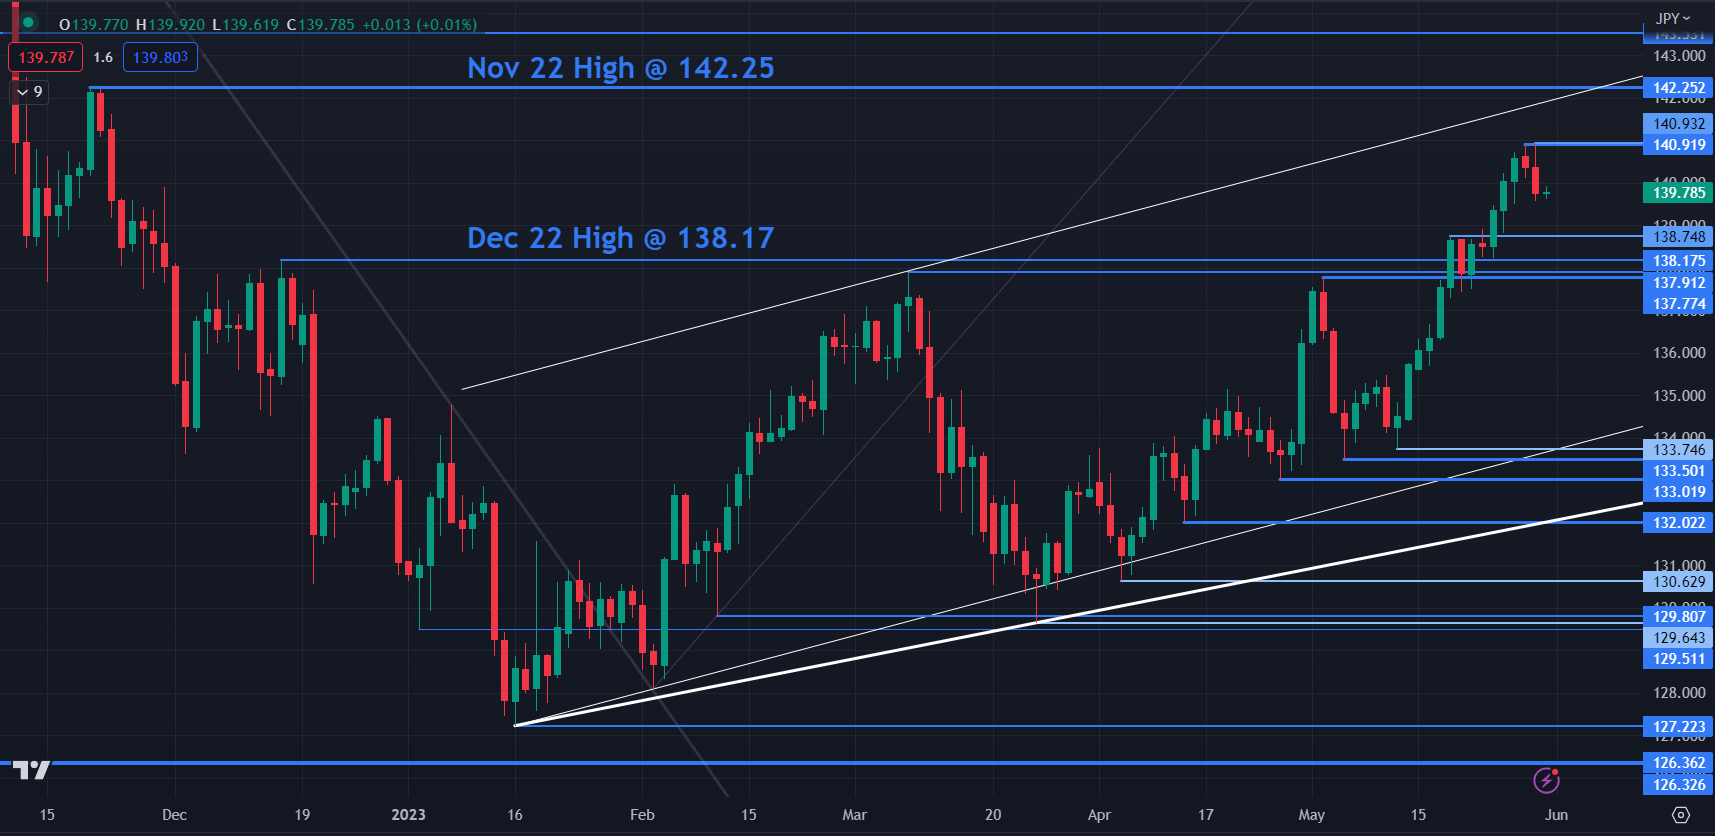
USD/JPY LEVLES TO WATCH

USD/JPY made a six-month high yesterday at 140.93 and that level may offer resistance ahead of November 2022 peak at 142.25. and a breakpoint near 143.50.

On the downside, support may lie at the breakpoints of 138.75, 138.18, 137.91 and 137.77.

image1.png