US Dollar Price Forecast: DXY Climbs to $103.600 Amid Consumer Confidence, FOMC Ahead

US Dollar Price Forecast: DXY Climbs to $103.600 Amid Consumer Confidence, FOMC Ahead

Dollar Strengthens Ahead of FOMC and Fed Rate

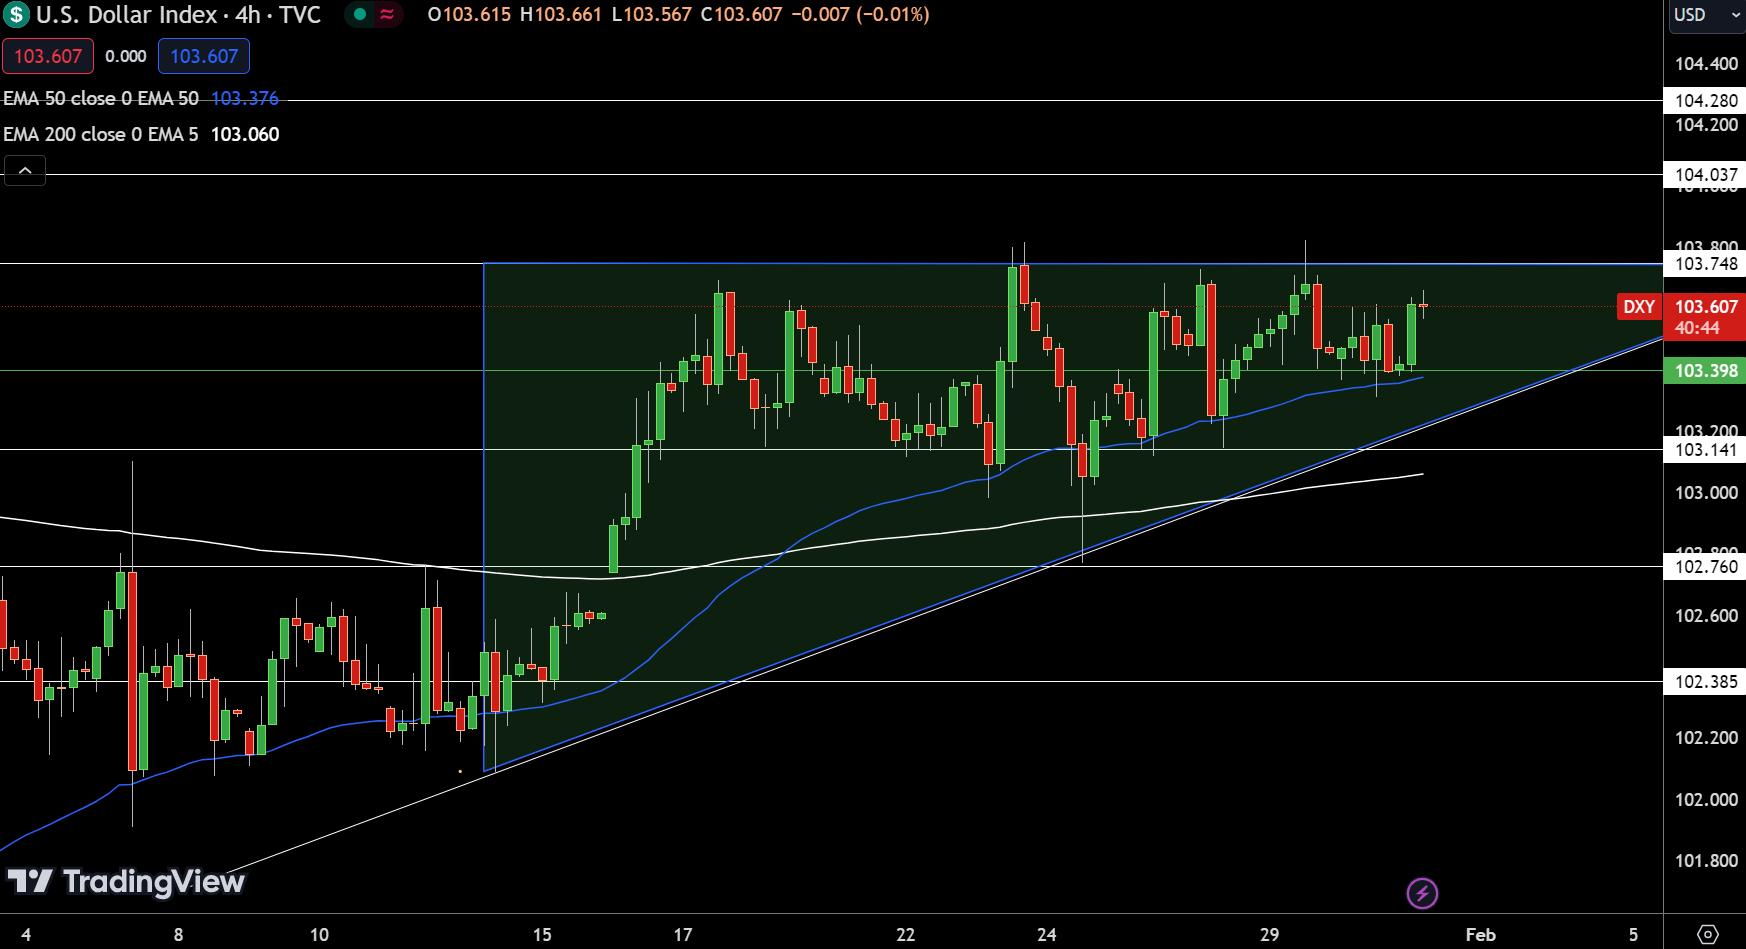
In today’s trading, the US dollar appreciated by 0.20%, reaching $103.600 amid the release of US economic data, with the Consumer Confidence index reporting at 114.8, above the anticipated 114.2, and JOLTS Job Openings indicating a robust labor market with 9.03 million vacancies, exceeding the forecast of 8.93 million.

Events Ahead

Looking ahead, the financial calendar is packed with significant US data releases. The ADP Non-Farm Employment Change is expected to reveal 148,000 new jobs, slightly below the previous 164,000 projection.

The Employment Cost Index, a key inflation gauge, is predicted to show a 1.0% rise. Additionally, the Chicago PMI and the Federal Funds Rate announcement are on the horizon, with the interest rate projected to remain at 5.50%.

US Dollar Index (DXY)

Dollar Index
Dollar IndexOn January 31, the Dollar Index’s  pivot point stands at 103.398 with potential resistance levels at 103.748, 104.037, and 104.280. Support levels are closely set at 103.141, with further cushions at 102.760 and 102.385, indicating a narrow trading range that could influence future movements.

EUR/USD Price Chart - Source: Tradingview
EUR/USD Price Chart – Source: Tradingview

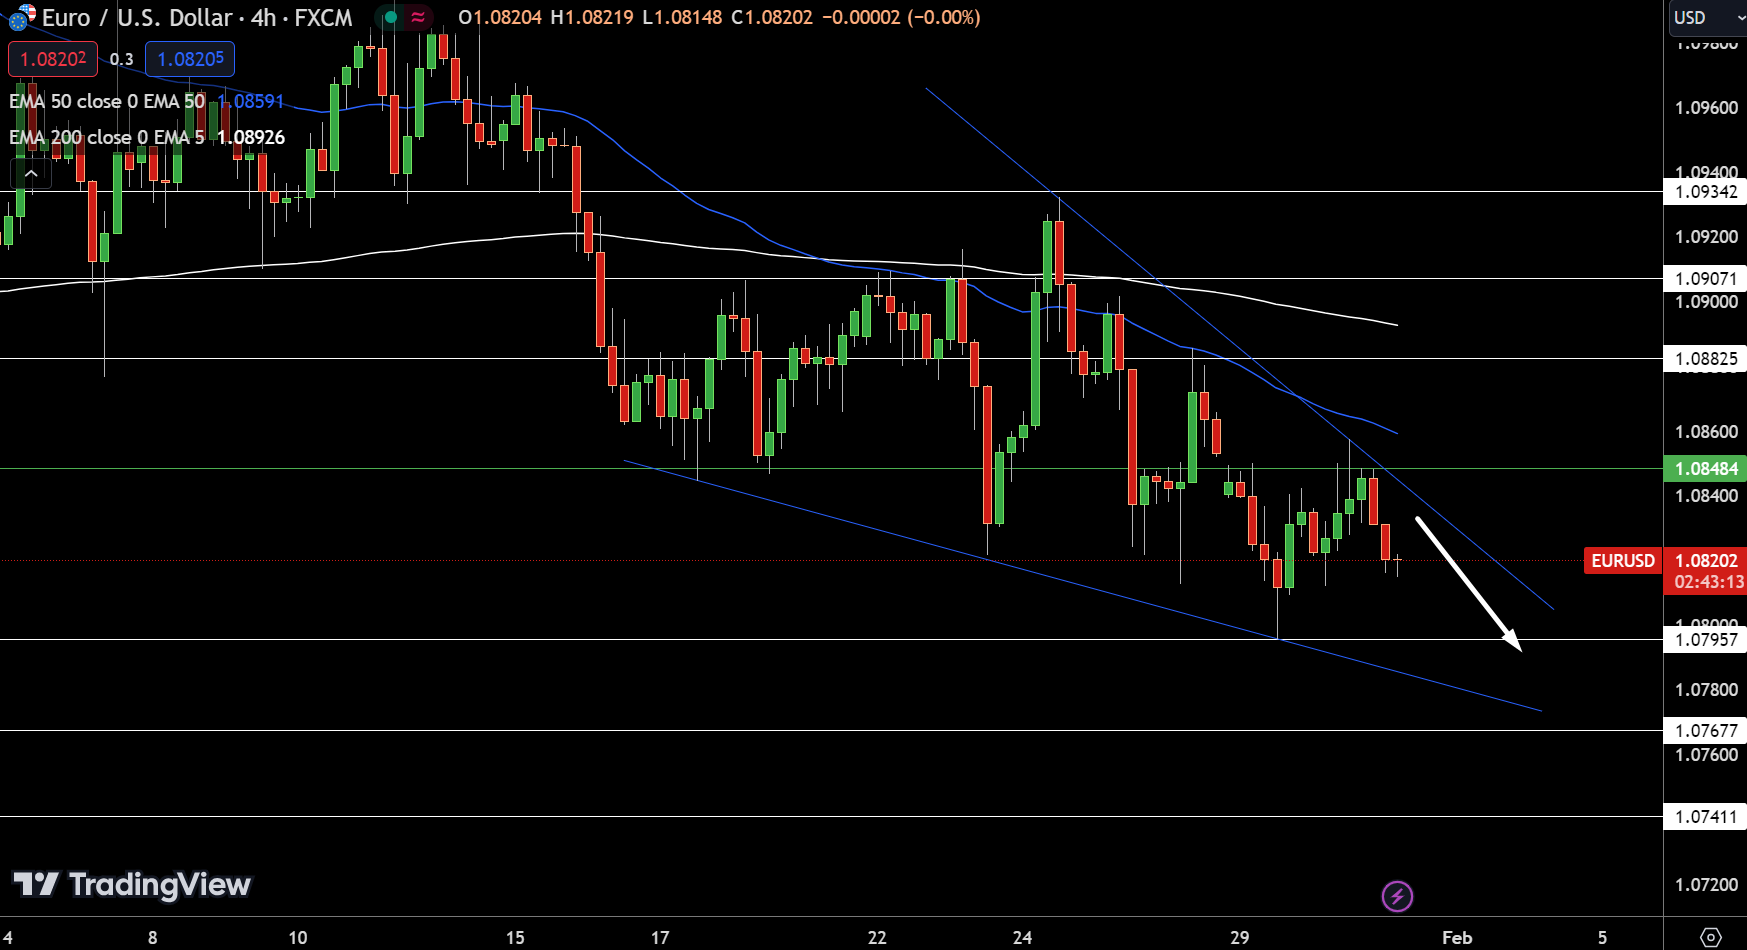
Technical analysis reveals a bearish engulfing candlestick pattern on the 4-hour timeframe, positioned just below the pivot point and coinciding with a descending trendline. This pattern suggests that sellers are gaining control, particularly as the price action remains under the critical level of $1.08484.

GBP/USD Technical Forecast

GBP/USD Price Chart - Source: Tradingview
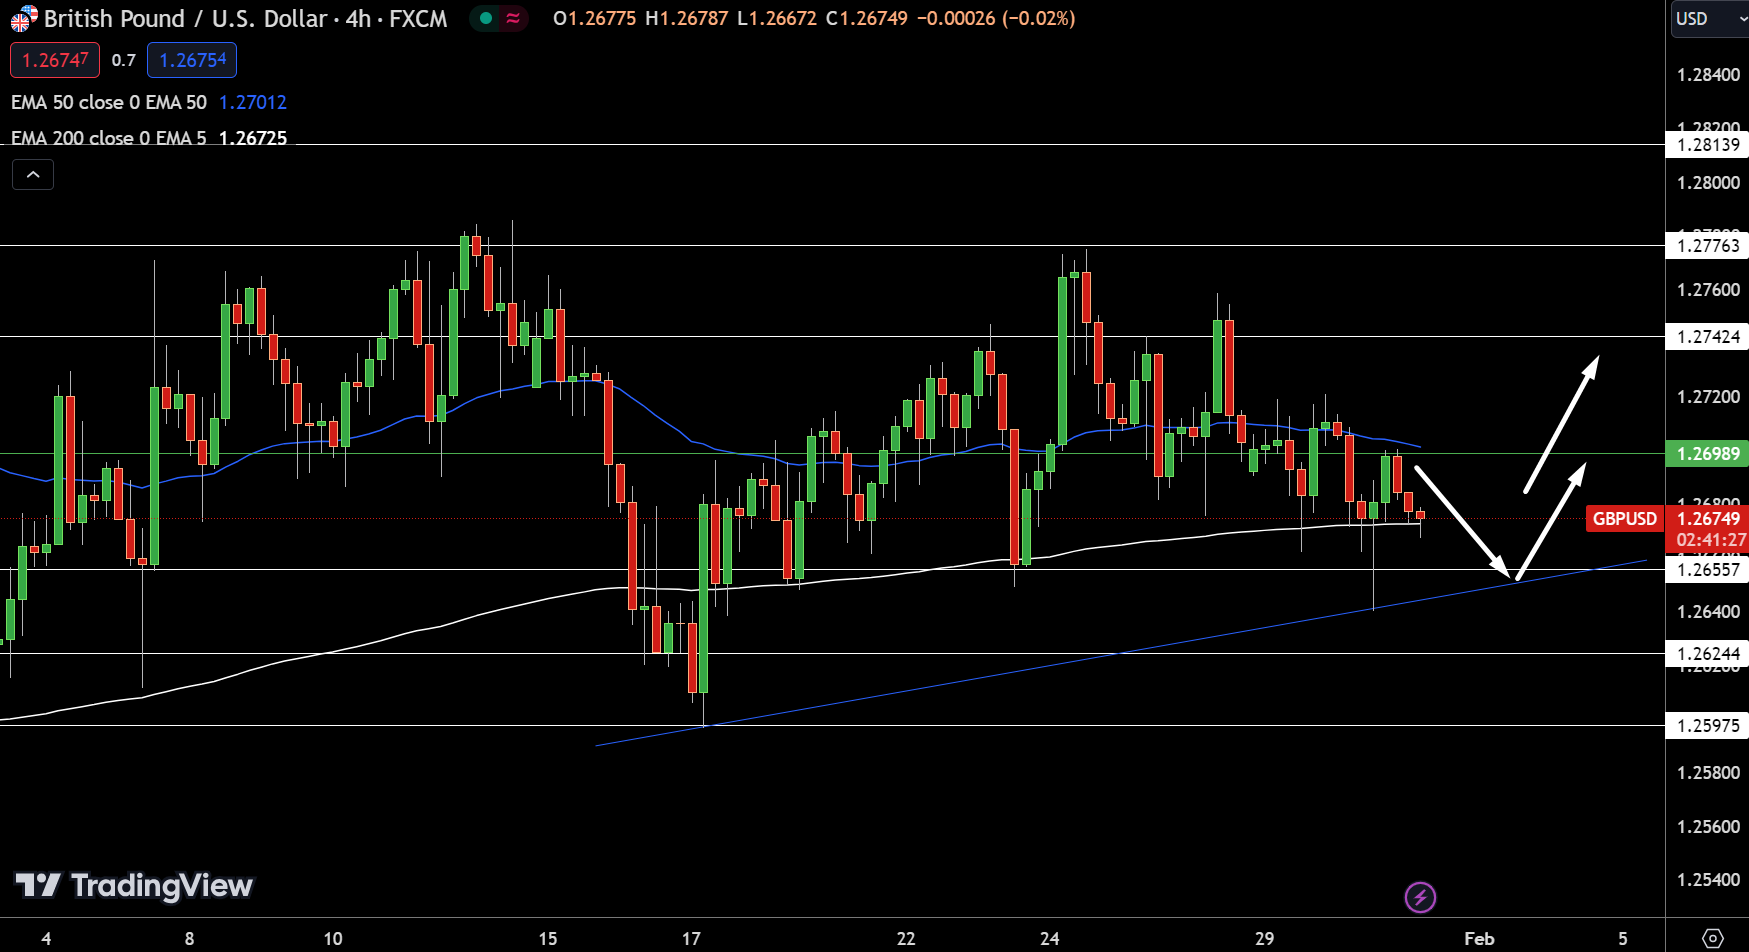
GBP/USD Price Chart – Source: TradingviewThe GBP/USD pair experienced a slight decline of 0.17%, settling at 1.26756 with pivot point at 1.26989, hinting at potential bearish momentum in the short term. Resistance levels are staged at 1.27424, 1.27763, and 1.28139, which could challenge any upward movement. Support is found at 1.26557, followed by 1.26244 and 1.25975, providing a cushion against further drops.

Technical analysis indicates the GBP/USD is currently navigating through a tight range, specifically between 1.2775 and 1.2650, as markets await forthcoming policy decisions. This consolidation suggests a cautious stance among traders.

Given the pair’s proximity to both the 50-Day Exponential Moving Average (EMA) at 1.27012 and the 200-Day EMA at 1.26725, the technical outlook leans towards a bearish bias below the pivot point of 1.26989

Hang Seng Index, ASX 200, Nikkei 225: ASX Seven Day Winning Streak at Risk

Hang Seng Index, ASX 200, Nikkei 225: ASX Seven Day Winning Streak at Risk

Overview of the Tuesday Session

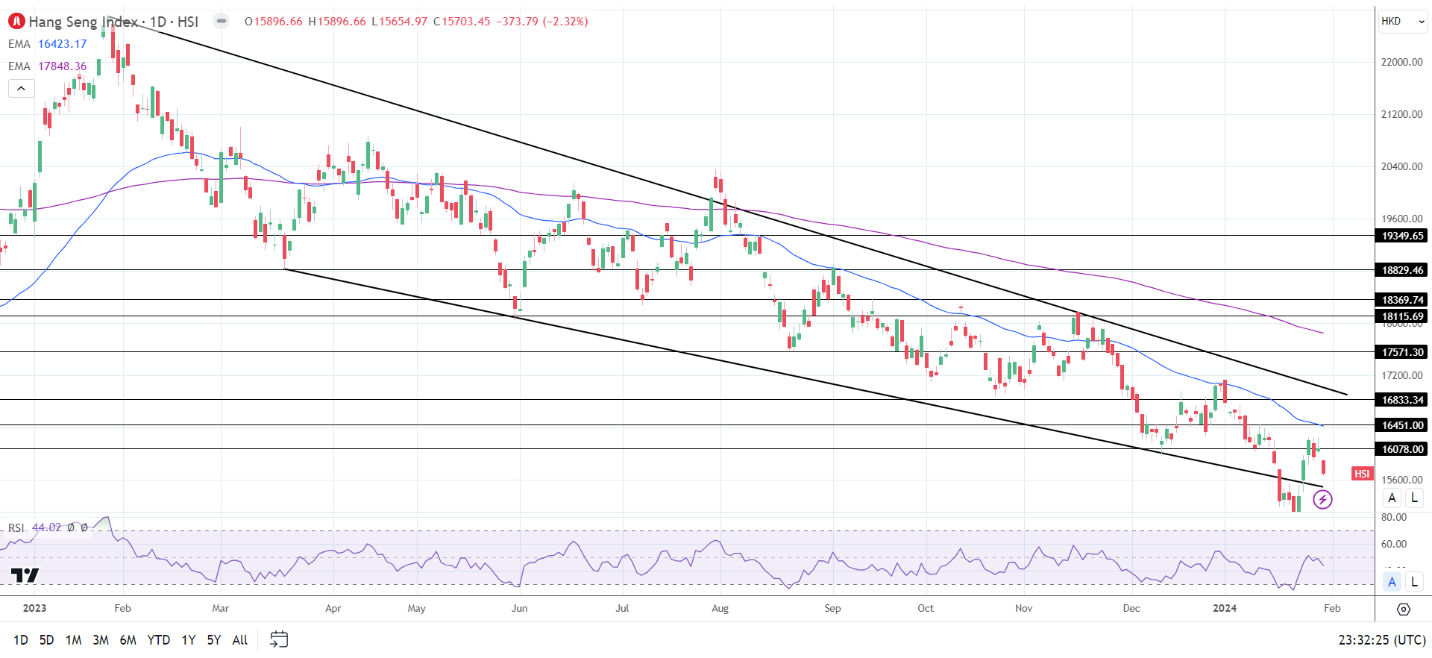
On Tuesday, the Hang Seng Index bucked the broader market trend. Investors reacted to the winding up order for China Evergrande Group. However, the ASX 200 extended its winning streak to seven sessions, with the Nikkei ending the day in positive territory.

Falling US Treasury yields and optimism before mega-cap tech earnings results delivered a positive Monday session for the US equity markets.

On Monday, the Nasdaq Composite Index gained 1.12%. The Dow and the S&P 500 rose by 0.59% and 0.76%, respectively. 10-year US Treasury yields fell by 1.57%, ending the session at 4.076% on bets the Fed will begin signaling rate cuts.

While gains across the US equity markets set the tone, the Asian economic calendar also influenced.

From the Asian economic calendar, Australian retail sales figures eased bets on an RBA rate hike in February. Retail sales slid by 2.7% in December after rising by 1.6% in November.

Labor market data from Japan beat expectations. The unemployment rate unexpectedly fell from 2.5% to 2.4%. The job/application ratio declined from 1.28 to 1.27 in December. Tighter labor market conditions could support wage growth and a Bank of Japan pivot from negative rates.

However, fears of the China Evergrande Group winding up order having a more widespread impact on the real estate sector pressured the Hang Seng Index. Uncertainty remains over whether the order will impact its operations in Mainland China.

US Corporate Earnings, China, and the Asian Economic Calendar

On Wednesday, US economic indicators and corporate earnings from Tuesday warrant investor attention.

The US CB Consumer Confidence Index increased from 108.0 to 114.8 in January. JOLTs Job Openings increased from 8.925 million to 9.026 million in December. The figures supported expectations of a soft landing.

Mega-cap tech stocks were also in focus. Alphabet Inc. (GOOG) and Microsoft (MSFT) released earnings results.

The US equity markets responded to the earnings results. On Tuesday, the Nasdaq Composite Index and S&P 500 declined by 0.76% and 0.06%, respectively. The Dow ended the day up 0.35%.

However, the Asian economic calendar will also need consideration. Australian inflation numbers and retail sales figures from Japan could influence bets on RBA and BoJ policy goals. Economists forecast the Australian annual inflation rate to soften from 5.4% to 4.3% in Q4. However, economists predict retail sales in Japan to increase by 4.7% year-over-year in December versus 5.3% in November.

Worse than or in line with forecasts could ease pressure on the RBA to hike rates and the BoJ to pivot from negative rates.

Beyond the economic calendar, China Evergrande Group will remain in focus. Updates on liquidation plans of offshore assets and the future of operations in Mainland China will draw interest.

On Tuesday, the ASX 200 and Nikkei futures were down 18 and 70 points, respectively.

ASX 200

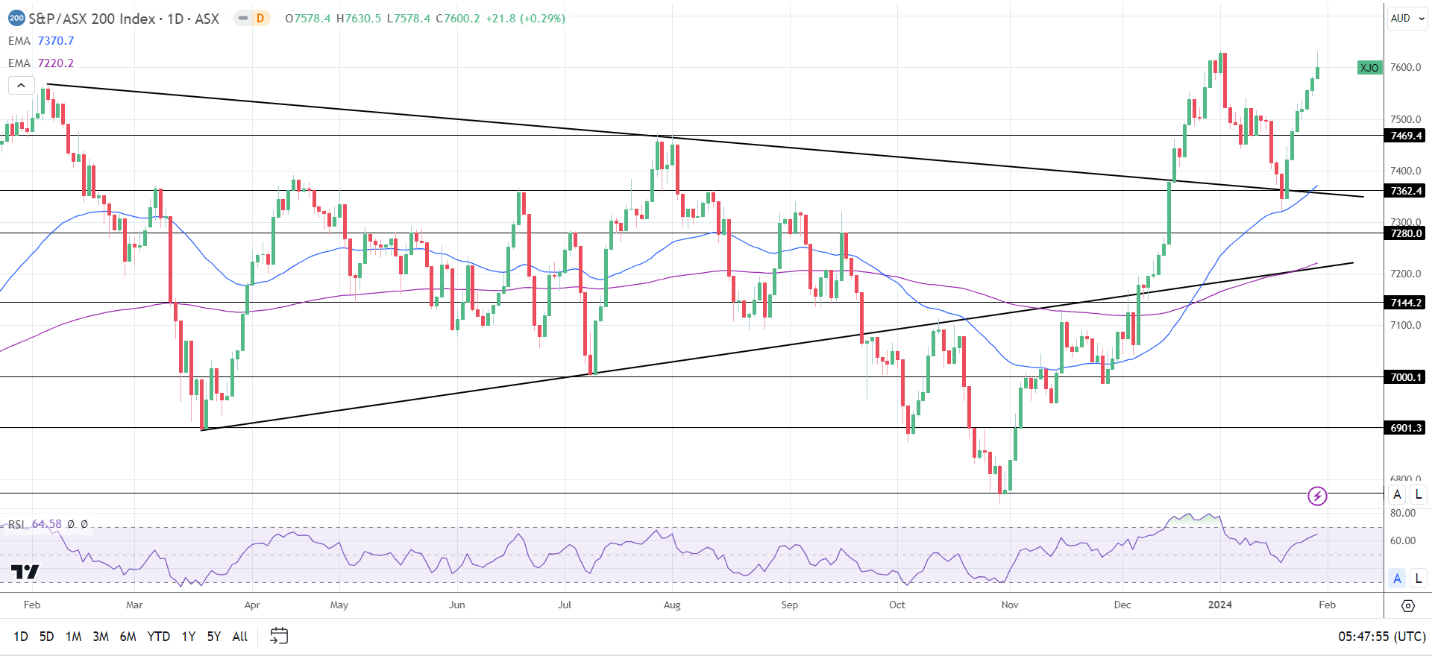
ASX 200 extended the winning streak to 7 on Tuesday.
ASX200 310124 Daily ChartThe ASX 200 rose by 0.29% on Tuesday. Gold (XAU/USD), mining, and tech stocks contributed to the gains. The S&P ASX All Technology Index ended the day up 1.11%.

Northern Star Resources Ltd. (NST) and Evolution Mining Ltd. saw gains of 2.93% and 1.59%, respectively.

BHP Group Ltd (BHP) and Rio Tinto Ltd. (RIO) rose by 0.38% and 0.49%, respectively. Fortescue Metals Group Ltd. (FMG) gained 1.54%. Rising overnight iron ore prices from Monday drove buyer demand for mining stocks.

However, the big four banks and oil stocks had a mixed session. Woodside Energy Group Ltd (WDS) and Santos Ltd (STO) fell by 0.13% and 0.51%, respectively.

ANZ Group Holdings Ltd (ANZ) and Westpac Banking Corp. (WBC) fell by 0.22% and 0.46%, respectively. National Australia Bank Ltd. (NAB) slipped by 0.03%, while Commonwealth Bank of Australia (CBA) rose by 0.11%.

Hang Seng Index

Hang Seng Index hit by China Evergrande Group
HSI 310124 Daily ChartThe Hang Seng Index declined by 2.32% on Tuesday. On Tuesday, the Hang Seng Mainland Properties Index (HSMPI) slid by 3.54%. The Hang Seng Tech Index (HSTECH) ended the session down 3.27%.

Alibaba (9988) and Tencent (0700) declined by 2.00% and 2.91%, respectively.

However, bank stocks had a mixed session. HSBC (0005) ended the session flat%. China Construction Bank (0939) and Industrial Commercial Bank (1398) fell by 0.85% and 1.30%, respectively. Concerns about contagion from China Evergrande Group on the real estate sector pressured mainland bank stocks.

The Nikkei 225

Nikkei ended the Tuesday session in positive territory
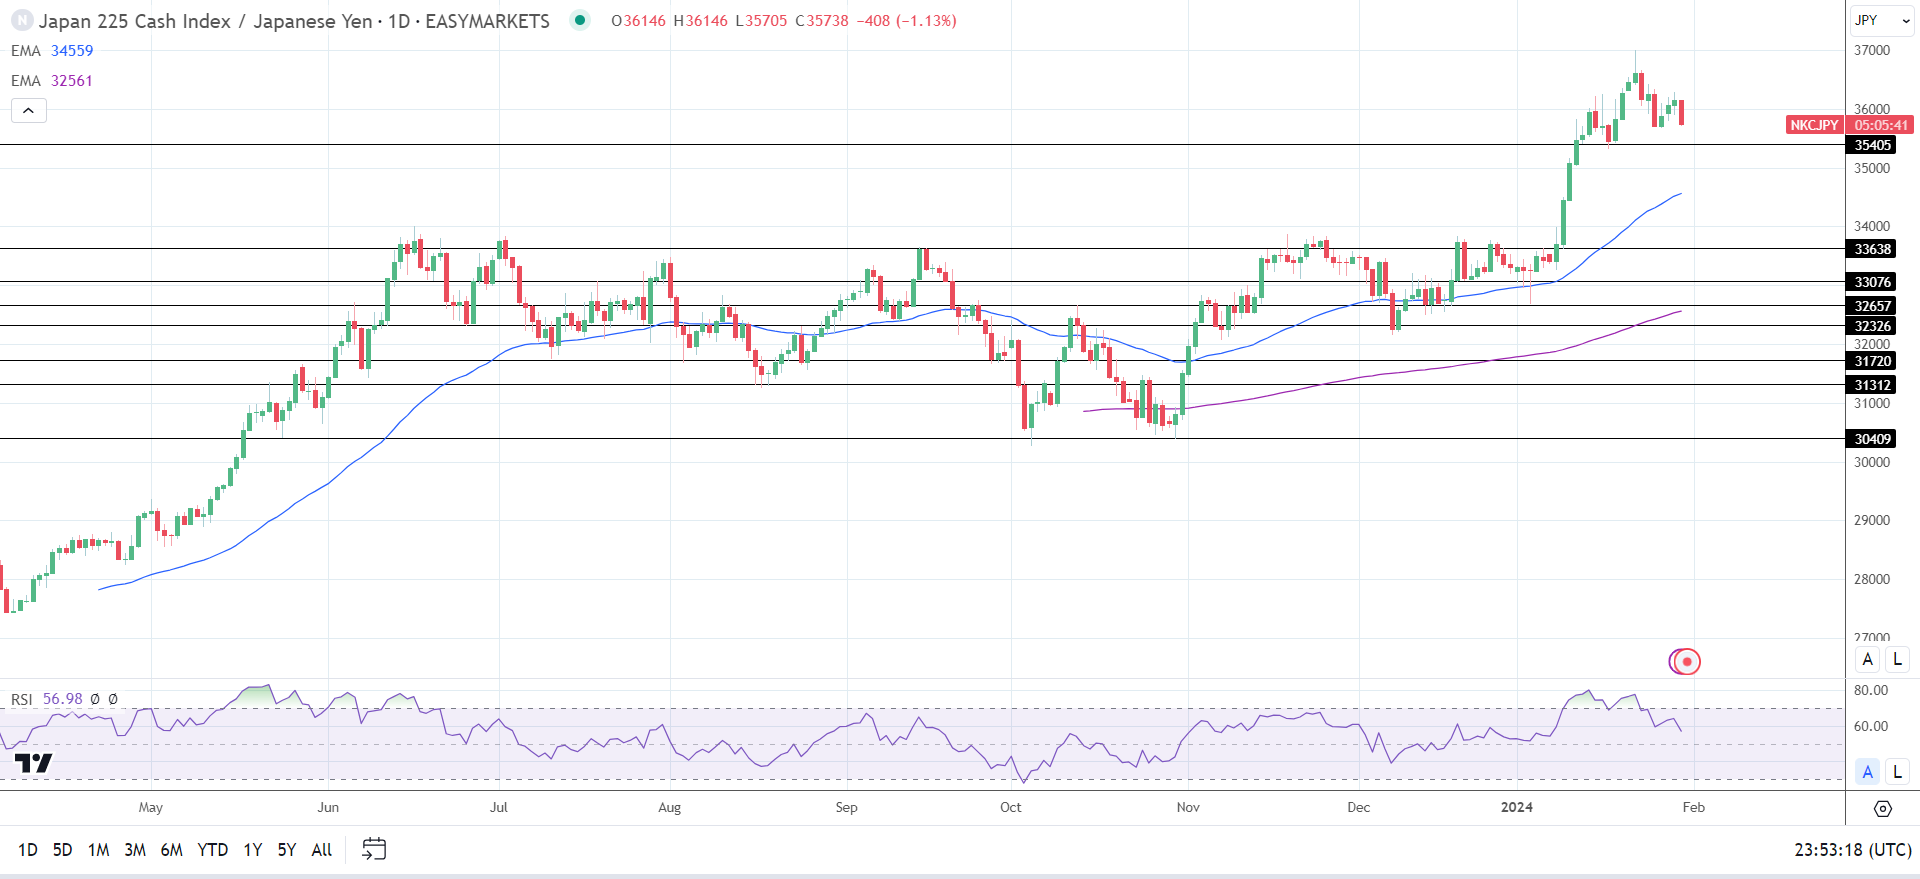
The Nikkei gained 0.11% on Tuesday.Bank stocks ended the day in negative territory. Sumitomo Mitsui Financial Group Inc. (8316) and Mitsubishi UFJ Financial Group Inc. (8306) fell by 0.13% and 0.15%, respectively.

The main components of the Nikkei had a mixed session.

Sony Group Corp. (6758) and Fast Retailing Co. Ltd. (9983) saw gains of 1.01% and 0.74%, respectively.

However, Softbank Group Corp. (9948) fell by 0.35%. KDDI Corp. (9433) and Tokyo Electron Ltd. (8035) declined by 0.35% and 0.09%, respectively.

Gold Prices Forecast: XAU/USD Steadies as Fed Rate Policy Decision Looms

Gold Prices Forecast: XAU/USD Steadies as Fed Rate Policy Decision Looms

Market Anticipation Ahead of Fed Statement

Gold prices remained steady, poised for their first monthly decline in four months. Investors are recalibrating their expectations for aggressive U.S. rate cuts, given signs of a resilient economy. The focus is now on the Federal Reserve’s upcoming statement and Chair Jerome Powell’s news conference, which could significantly influence market movements.

At 07:41 GMT, XAU/USD is trading $2036.97, up $0.135 or +0.01%.

Reduced Expectations for Rate Cuts

Traders have moderated their bets on the Federal Reserve’s rate cuts for 2024, with the likelihood of a March rate cut now reduced. This shift in expectations follows strong U.S. economic data and signals from central bankers, suggesting a less dovish stance than previously anticipated.

US Dollar and Treasury Yields

The dollar index is tracking its best month since September, buoyed by the adjusted expectations on rate cuts. Concurrently, U.S. Treasury yields have dipped slightly this week but remain higher than at the year’s end, reflecting the market’s anticipation of the Fed’s monetary policy direction.

Middle East Tensions and Gold Market

Amidst these economic developments, the Middle East tensions, particularly the Israel-Hamas conflict and its expansion into a naval conflict in the Red Sea, have influenced the gold market. However, the possibility of a ceasefire in Gaza and the broader geopolitical landscape’s impact on gold prices remains uncertain.

Short-Term Market Forecast

In the short term, gold prices may continue to face pressure as the market adjusts to the Fed’s rate decision and the evolving geopolitical situation.

If the Fed adopts a hawkish stance, indicating fewer or no rate cuts, gold could face downward pressure due to a stronger dollar. Conversely, a more dovish Fed, signaling deeper rate cuts, could bolster gold prices as a hedge against potential currency devaluation.

The anticipation of less aggressive rate cuts by the Fed, coupled with ongoing Middle East tensions, suggests a cautious yet reactive outlook for gold in the near future.

Technical Analysis

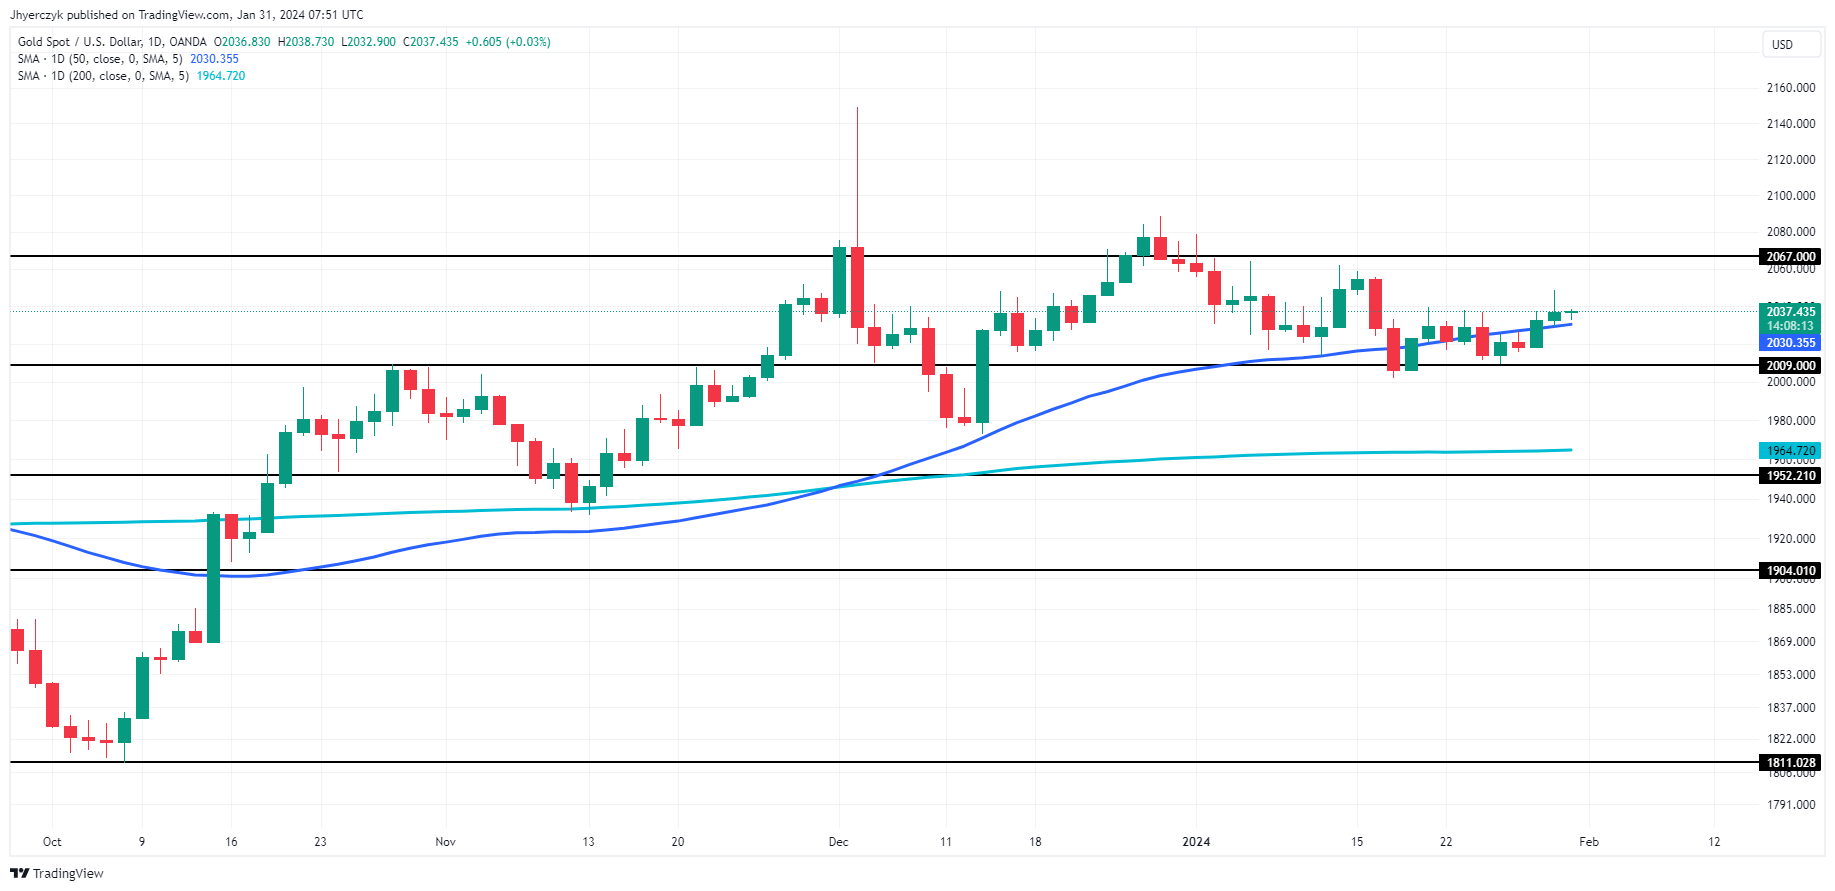
Daily Gold (XAU/USD)Gold (XAU/USD) is holding steady on below average volume early Wednesday, with most of the major players sitting on the sidelines ahead of the key Federal Reserve rate announcement at 19:00 GMT.

Nonetheless, bullion remains on the strong side of both the 50-day moving average at $2030.34 and the 200-day moving average at $1964.71.

The immediate support is the 50-day MA. Traders straddled this uptrending average since mid-month before decisively crossing to the bullish side earlier this week. If this move continues to generate enough upside mometum then we could see an acceleration into resistance at $2067.00.

Look for the near-term bullish tone to continue as long as prices hold above $2030.34. Crossing to the weak side of this level will signal the return of sellers. This could trigger a break into the pivot at $2009.00.

German Retail Sales Slide by 1.6% in December

German Retail Sales Slide by 1.6% in December

German Retail Sales

German retail sales unexpectedly declined by 1.6% month-on-month in December. In November, retail sales slid by 2.4% month-on-month. Economists forecast retail sales to rise by 0.7% in December month-on-month.

ECB Impact Analysis

Last week, the ECB left interest rates unchanged. However, ECB President Lagarde refrained from indicating when the ECB will cut interest rates. Instead, the ECB President focused on wage growth. The focus on wage growth highlighted concerns about consumer spending and demand-driven inflation trends.

The retail sales figures from Germany signal a weakening demand-driven inflation environment. Significantly, the slump in retail sales supports expectations of a Q1 recession and bets on an April ECB rate cut. German private consumption contributes over 50% to the economy.

EUR/USD Reaction to German Retail Sales

Before the German retail sales figures, the EUR/USD rose to a high of $1.08482 before falling to a low of $1.08158.

However, in response to the data, the EUR/USD fell to a low of $1.08148 before rising to a high of $1.08206.

On Wednesday, the EUR/USD was down 0.23% to $1.08203.


A graph on a white background

Description automatically generated

Up Next

German unemployment and inflation figures warrant investor attention. Softer-than-expected inflation numbers could fuel bets on an April ECB rate cut. Economists forecast the German annual inflation rate to soften from 3.7% to 3.0% in January.

However, tighter labor market conditions could support wage growth, an ECB bugbear. Economists expect the German unemployment rate to remain at 5.9% in January.

From the US, ADP employment change numbers for January and Q4 employment costs also need consideration. Tighter labor market conditions and better-than expected wage growth figures could ease bets on a March Fed rate cut.

The stats will draw investor attention. However, the Fed interest rate decision, rate statement, and press conference will be the main events of the session. Economists expect the Fed to leave interest rates at 5.50%, placing the focus on the rate statement and press conference.

How Do Politics and Central Banks Impact FX Markets?

How Do Politics and Central Banks Impact FX Markets?

MARKETS HAVE PASSED THE POLITICAL EVENT HORIZON

For foreign exchange (“forex” or “FX”) traders, the constant background noise that politics represents is an inescapable blackhole. Traditional media drowns in punditry, while social media drowns in puns. It doesn’t matter what asset class you’re trading either.In recent years, even a single tweet from a politician has had the capacity to move not only currencies but also bonds,commodities, and equities.

In an increasingly fractious landscape, traders need a framework by which to interpret information and understand political developments as they happen. After all, politics can become policy after enough time and effort. To this end, FX traders need a way to interpret information and political developments in the context of how fiscal policy could change and how that might impact their portfolios.

Market participants need to pay attention to more than just fiscal policy, however. With central bank activity having gained considerable traction during the Great Recession and thereafter, monetary policy looks to be a powerful lasting influence on markets. Therefore, FX traders need a viable framework to analyze both fiscal and monetary policy in tandem.

ECONOMISTS HAVE A SOLUTION BEYOND THE IS-LM MODEL

Fortunately, one such framework exists: IS-LM-BP model, or what’s known colloquially as the Mundell-Fleming model. Through this framework, FX traders can analyze how directional changes in fiscal policy (e.g. changes in taxes or government spending) and monetary policy (e.g. changes in interest rates) interact to produce various market outcomes.

Before we delve into the framework, a bit of background history on the Mundell-Fleming model.

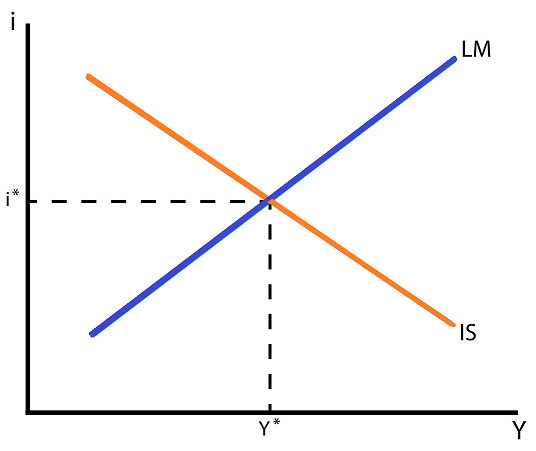
Mundell-Fleming is an extension of IS-LM, which itself is an equilibrium model used by economists to look at the relationship between interest rates (the real interest rate, “i” on the vertical axis of the chart below) and economic growth (real gross domestic product, “Y” on the horizontal axis).

IS-LM Curve – Interest Rates and Economic Growth (Chart 1)
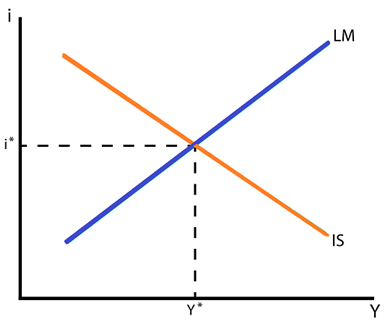
Chart showing IS-LM Curve

Without going too far down the academic rabbit hole, there are two takeaways of the IS-LM model that carryover into understanding the Mundell-Fleming model.

First, that the downward sloping IS curve demonstrates that as the level of interest rates fall, the level of economic activity rises. This is intuitive: the more readily credit is available, the more economic activity will flourish.

Second, the upward sloping LM curve demonstrates that as economic activity rises, the level of interest rates rise too. This is also intuitive: stronger economic activity provokes inflation and higher bond yields in response.

THE IS-LM MODEL IS INAPPROPRIATE FOR MODERN ECONOMIES

Why is the IS-LM model insufficient for traders? The IS-LM model is a foundational concept that ultimately leads to the classic AS-AD supply-demand model. But the IS-LM model is applicable for self-sufficient and/or closed economies; such a framework is not appropriate for a globalized world where open economies co-dependent on one another are the norm. We need to move beyond for a more complete framework.

THE MUNDELL-FLEMING MODEL WORKS BETTER FOR OPEN ECONOMIES

In the early-1960s, economists Robert Mundell and J. Marcus Fleming each produced improvements on the incomplete IS-LM model. Developed independently from one another but eventually synthesized into one unified idea, the IS-LM-BP model incorporates capital flow into the equation.

There are two different capital flow constraints within the IS-LM-BP, or Mundell-Fleming model. Countries either seehigh or lowcapital mobility. Depending upon which it is, different policy mixes lead to divergent reactions in the markets.

As a rule of thumb, developed countries and their currencies (e.g. the US, UK, Eurozone, Japan, etc.) have high capital mobility. On the other hand, emerging markets and their currencies (e.g. Brazil, China, South Africa, Turkey, etc.) have low capital mobility.

For the sake of this discussion, we will look at the Mundell-Fleming model through the lens of high capital mobility economies only, and as a result, attempt to set forth a framework to understand how different fiscal and monetary policy mixes impact the major currencies like the US Dollar, Euro, British Pound and Japanese Yen.

In a follow-up report, we will show the implications of the Mundell-Fleming model through the lens of low capital mobility economies and the resulting impact of policy changes for emerging market currencies.

DIFFERENT POLICY MIXES LEAD TO DIVERGENT REACTIONS IN MARKETS

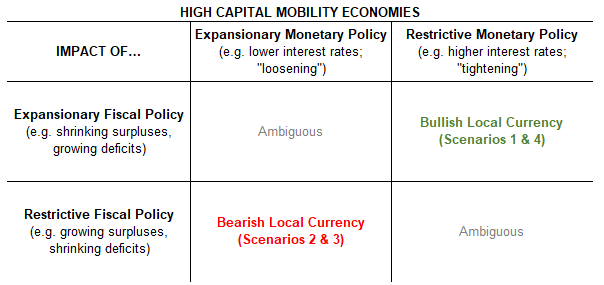
For high capital mobility economies, there are effectively four different sets of policy shifts that can provoke a reaction in FX markets. They are:

  • Scenario 1: Fiscal policy is already expansionary + monetary policy becomes more restrictive (“tightening”) = Bullish for the local currency
  • Scenario 2: Fiscal policy is already restrictive + monetary policy becomes more expansionary (“loosening”) = Bearish for the local currency
  • Scenario 3: Monetary policy already expansionary (“loosening”) + fiscal policy becomes more restrictive = Bearish for the local currency
  • Scenario 4: Monetary policy is already restrictive (“tightening”) + fiscal policy becomes more expansionary = Bullish for the local currency

It is important to note that for an economy like the United States and a currency like the US Dollar, whenever fiscal policy and monetary policy start trending in the same direction, there is often an ambiguous impact on the currency.

In other words, when viewed through the framework of the Mundell-Fleming model, when both fiscal and monetary policy are expansionary, or when both fiscal and monetary policy are restrictive, that currency is unlikely to see a significant directional move in the nearfuture.

Instead, armed with this insight, traders expecting a period of trendless oscillation in a given currency may be encouraged to set aside momentum- and trend-based strategies to adopt an approach optimized for range-bound conditions.

Mundell-Fleming Model Framework for High Capital Mobility Economies (Table 1)
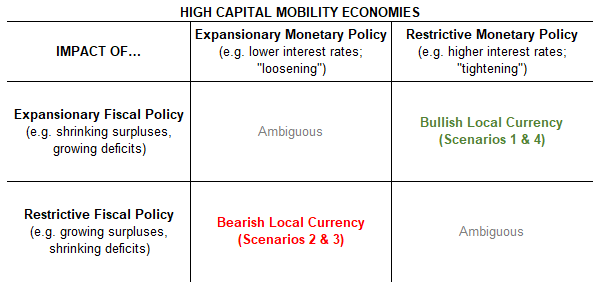
Chart showing Capital Mobility in Economies

Here are four examples in in the past decade from various high capital mobility economies from around the world that illustrate how using the Mundell-Fleming model as a framework for understanding politics and central banks would have given a trader an analytical edge.

Scenario 1 – FISCAL POLICY LOOSE; MONETARY POLICY BECOMES TIGHTER

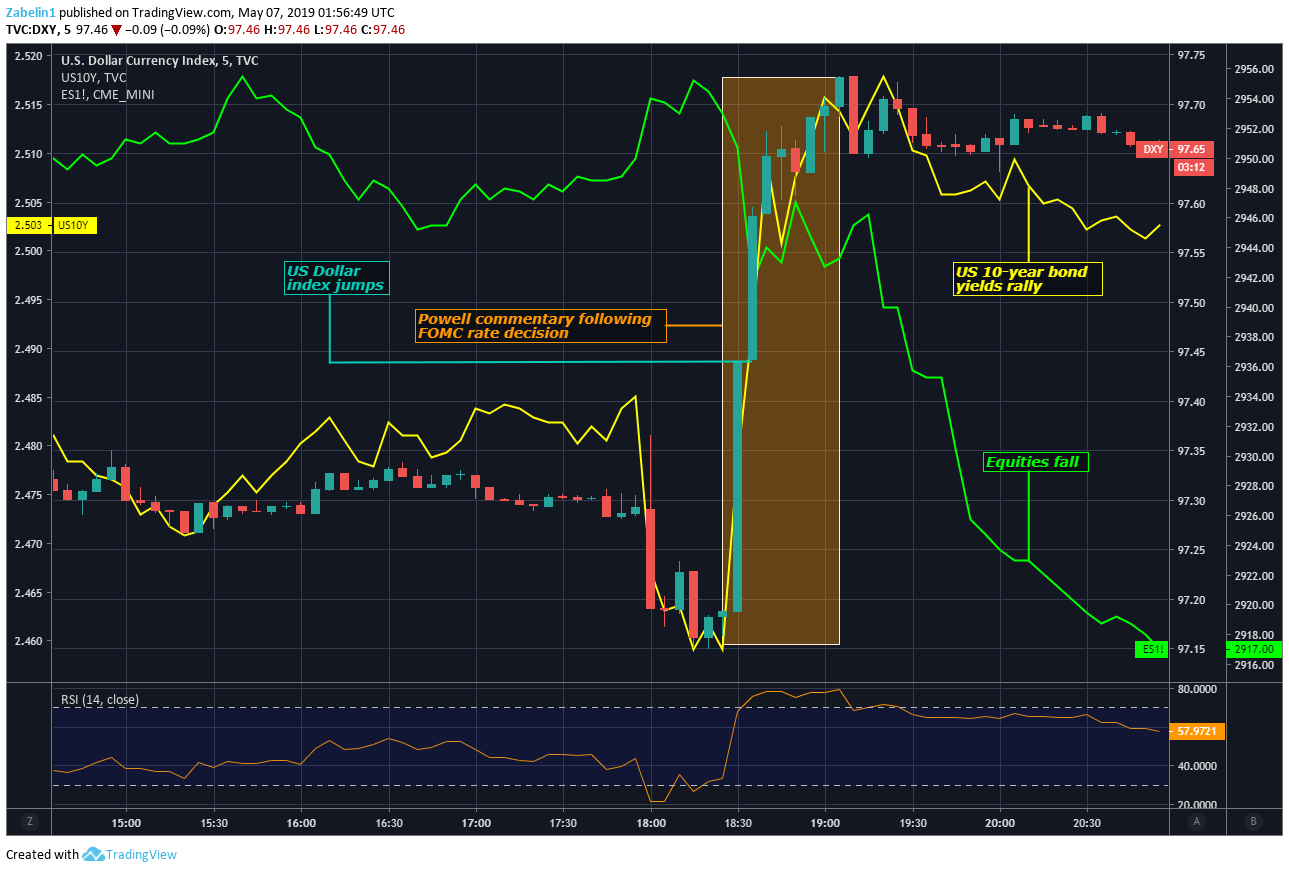
On May 2, 2019 – following the FOMC decision to hold rates at the 2.25-2.50 range – Fed Chairman Jerome Powell said that the relatively soft inflationary pressure in the economy was “transitory”. The implication behind this was that while price growth was below what central bank officials were hoping for, it would soon accelerate.

The implicit message was then a reduced probability of a cut in the future, given that the fundamental outlook was judged to be solid and the overall trajectory of US economic activity seen to be on a healthy path. The neutral tone struck by the Fed was comparatively less dovish than what markets had anticipated. This might then explain why overnight index swaps for a Fed rate cut by the end of the year fell from 67.2 percent down to 50.9 percent after Powell’s comments.

Meanwhile, the Congressional Budget Office (CBO) is forecasted an increase in the deficit over the next three years, overlapping the central bank’s tightening cycle. This also came against the backdrop of speculation about a bipartisan fiscal stimulus plan. In late April, key policymakers announced plans for a US$2 trillion infrastructure program.

The combination of expansionary fiscal policy and monetary tightening made the case for a bullish outlook for the US Dollar. The fiscal package was expected create jobs and boost inflation, thereby nudging the Fed to raise rates. As it happened, the Greenback added 6.2 percent against an average of its major currency counterparts over the subsequent four months.

Scenario 1: DXY, 10-Year Bond Yields Rise, S&P500 Futures Fall (Chart 2)
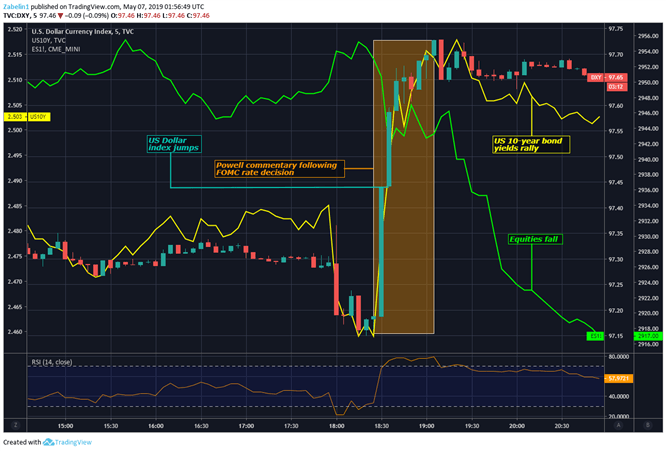
Chart showing DXY, S&P 500 Futures

Scenario 2 – FISCAL POLICY TIGHT; MONETARY POLICY BECOMES LOOSER

Theglobal financial crisis in 2008 and the Great Recession that followed rippled out worldwide and destabilized Mediterranean economies. This stoked worries about a region-wide sovereign debt crisis as bond yields in Italy, Spain and Greece climbed to alarming levels.

Investors began to lose confidence in the ability of these governments to service their debt and demanded a higher yield for incurring what appeared to be a higher risk of default. The Euro was in pain amid the chaos and suffered as doubtsemerged about its very existence in the event that the crisis would force the unprecedented departure of a member state from the Eurozone.

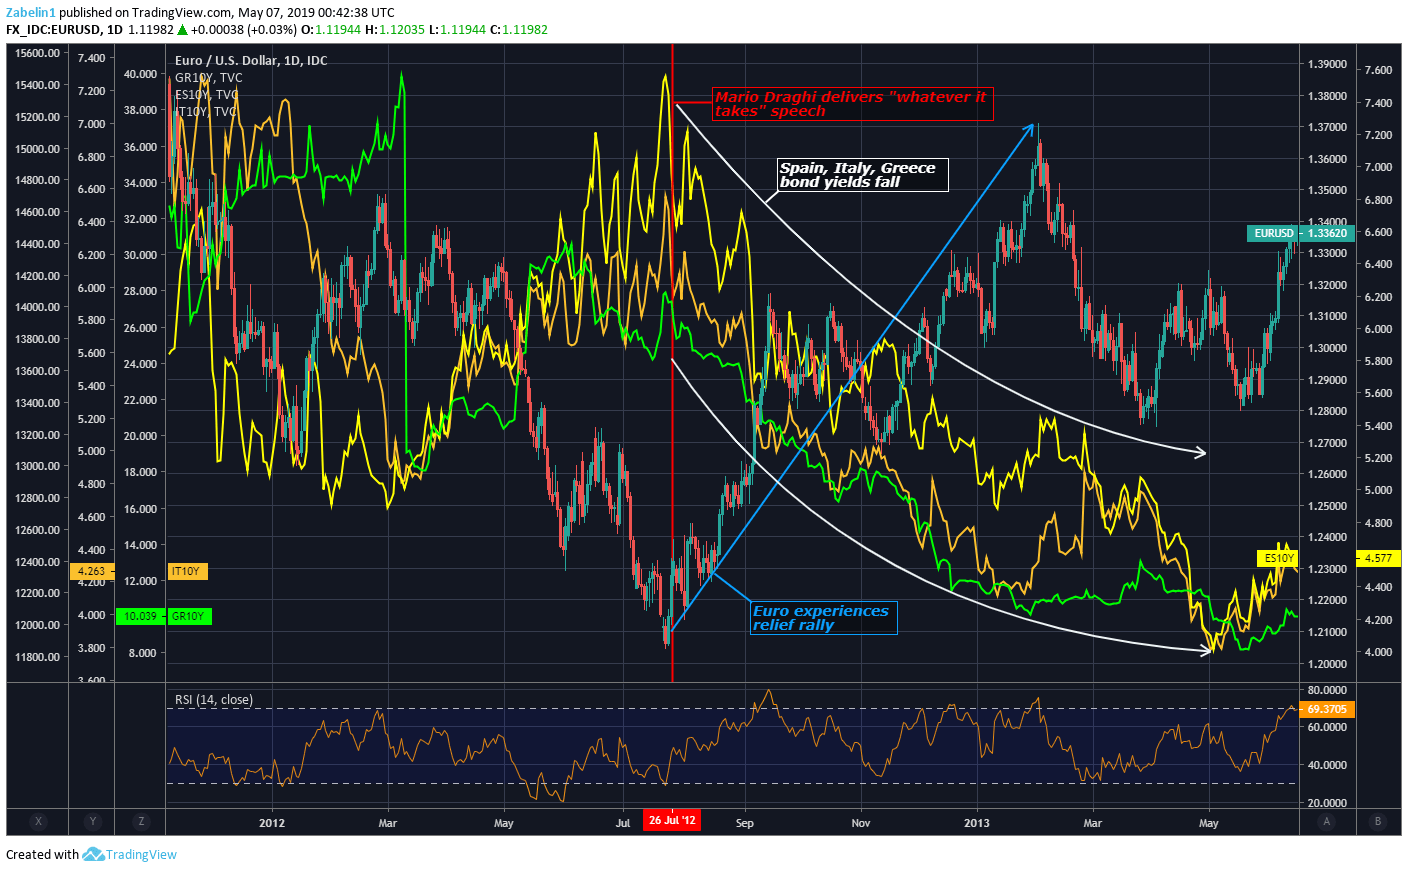
In what is considered to be one of the most famous moments in financial history, European Central Bank (ECB) President Mario Draghi delivered a speech in London on July 26, 2012 which many would come to see as the pivotal moment that saved the single currency. He said that the ECB is “ready to do whatever it takes to preserve the Euro. And believe me,” he added,“it will be enough.” This speech calmed European bond markets and helped bring yields back down.

 The ECB alsocreated a bond-buying program called OMT (for “Outright Monetary Transactions”). It was aimed at reducing stress in sovereign debt markets, offering relief to distressed Eurozone governments. While OMT was never used, its mere availability helped becalm jittery investors.At the same time, many of the troubled Euro area states adopted austerity measures to stabilize government finances.

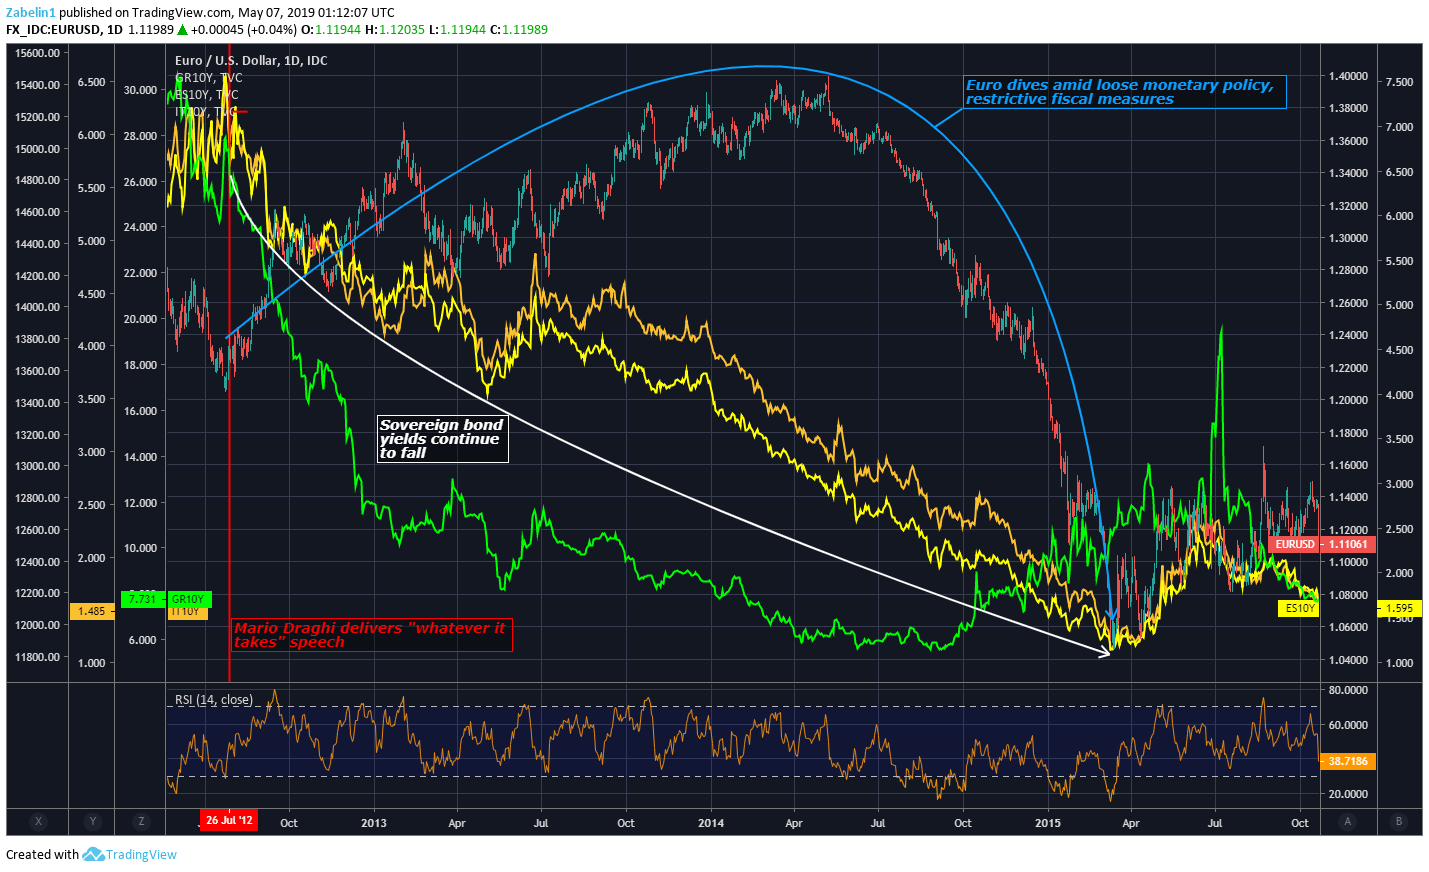
While the Euro initially rose as worries about its collapse receded, the European currency would depreciate substantially against the US Dollar over the course of the following three years. By March 2015, it had lost over 13 percent of its value. When examining the monetary and fiscal set up, it becomes quite clear why.

Scenario 2: Euro Sighs Relief – Sovereign Bond Yields Fall as Insolvency Fears are Quelled (Chart 3)
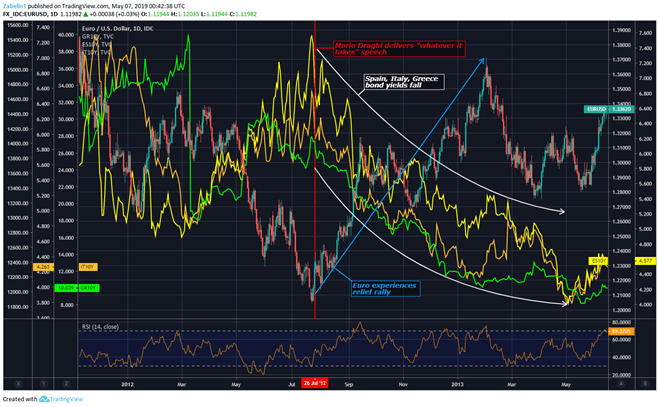
Chart showing EUR/USD

Austerity measures in many Eurozone countries limited their governments’ ability to provide fiscal stimulus that might have helped create jobs and boost inflation. At the same time, the central bank was easing policy as a way to alleviate the crisis. Consequently, this combination pressured the Euro lower against most of its major counterparts.

Scenario 2: Euro, Sovereign Bond Yields Fall (Chart 4)
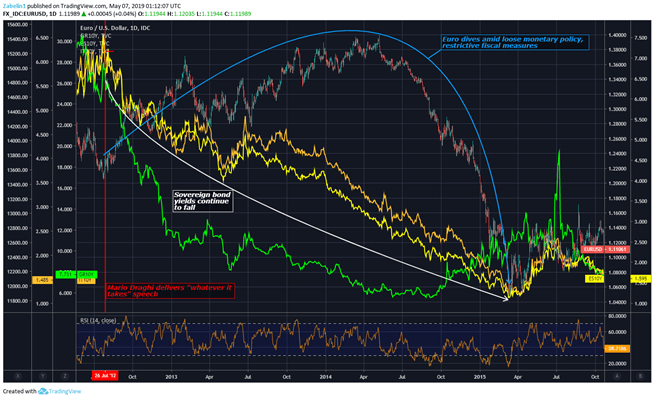
Chart showing EUR/USD

Scenario 3 – MONETARY POLICY LOOSE; FISCAL POLICY BECOMES TIGHTER

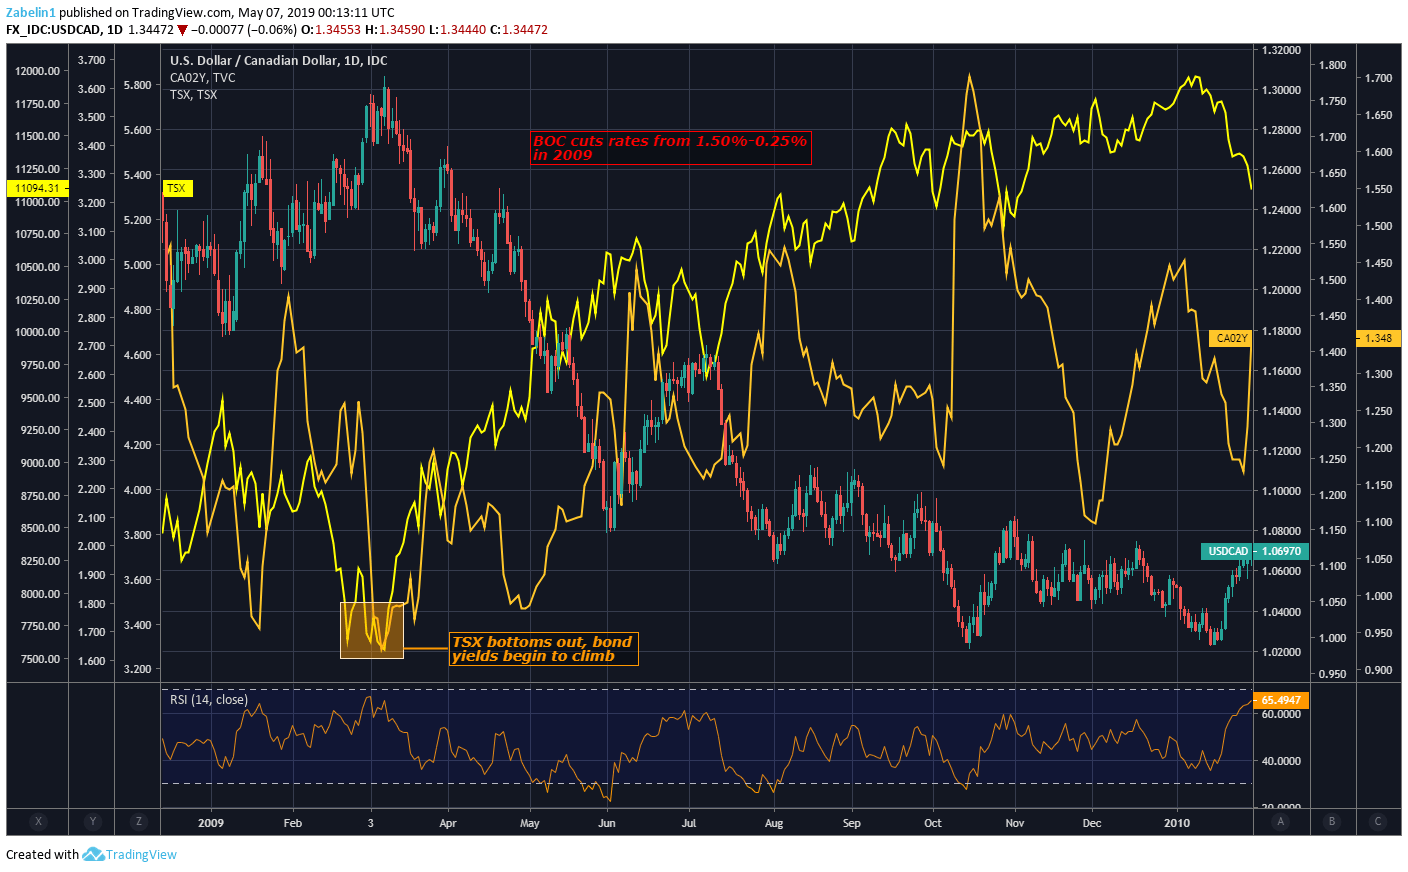
At the early stages of the Great Recession, the Bank of Canada (BOC) cut its benchmark interest rate from 1.50 to 0.25 percent as a way to ease credit conditions, restore confidence and revive economic growth. Counter-intuitively, the yield on 10-year Canadian government bonds began to rise. This rally came right around the same time as Canada’s benchmark TSX stock index established a bottom.

Scenario 3: USD/CAD, TSX, Canadian 2-Year Bond Yields (Chart 5)
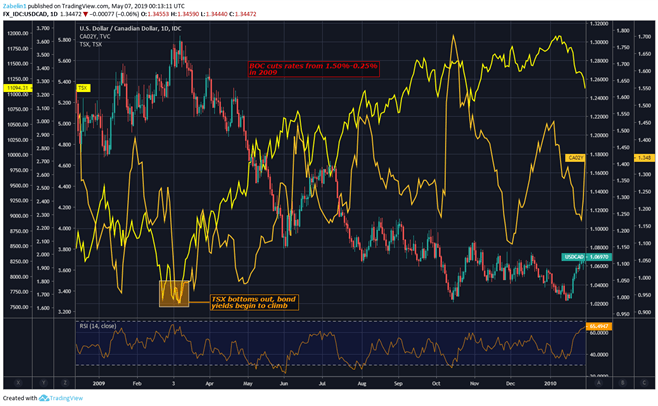
Chart showing USD/CAD, TSX

The subsequent restoration of confidence and recovery in share prices was reflected investors’ shifting preference for riskier, higher-returning investments (like stocks)from comparatively safer alternative (like bonds). This reallocation of capital sent yields higher despite the central bank’s monetary easing. The BOC then began to raise rates anew and brought them up to 1.00 percent, where they remained for the subsequent five years.

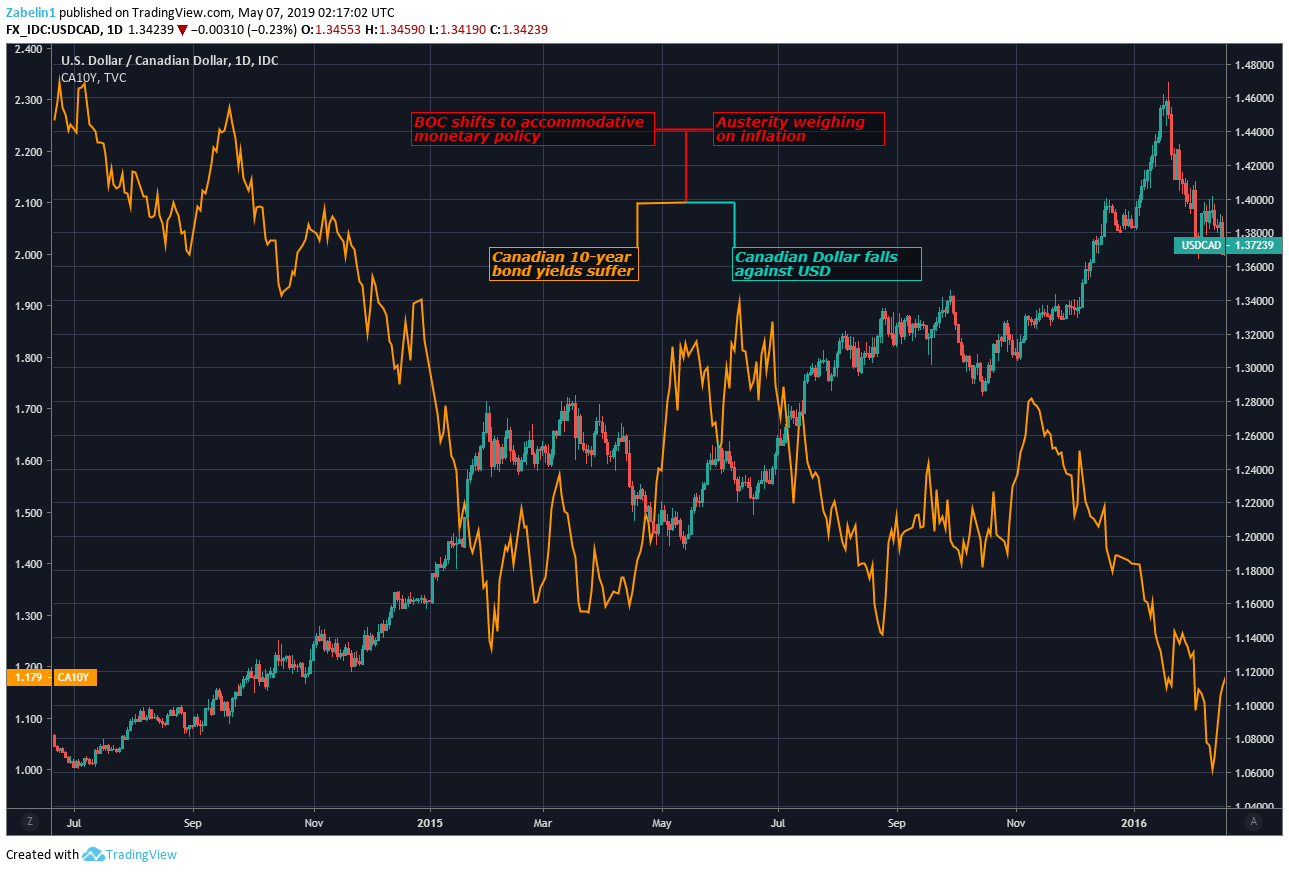
During this time, Prime Minister Stephen Harper implemented austerity measures to stabilize the government’s finances amid the global financial crisis. The central bank then reversed course and cut rates back to 0.50 percent by July 2015. Both CAD and local bond yields suffered as monetary policy was loosened while the capacity for fiscal policy support was constrained. As it happens, cutting back government spending at this difficult time ended up costing Mr Harper his job. Justin Trudeau replaced him as Prime Minister following a victory in the 2015 general election.

Scenario 3: USD/CAD, Canada 2-Year Bond Yields (Chart 6)
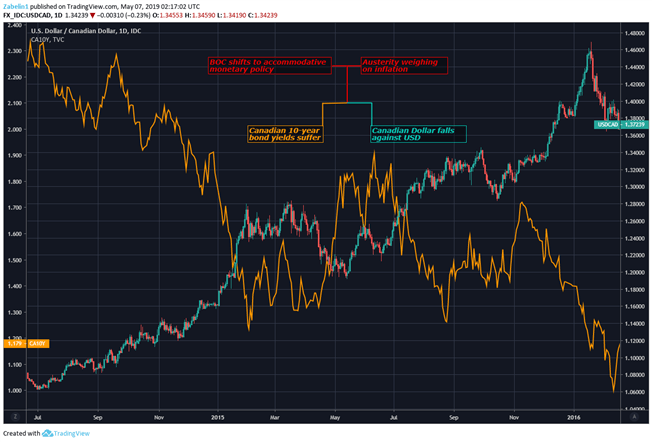
Chart showing USD/CAD

Scenario 4 – MONETARY POLICY TIGHT; FISCAL POLICY BECOMES LOOSER

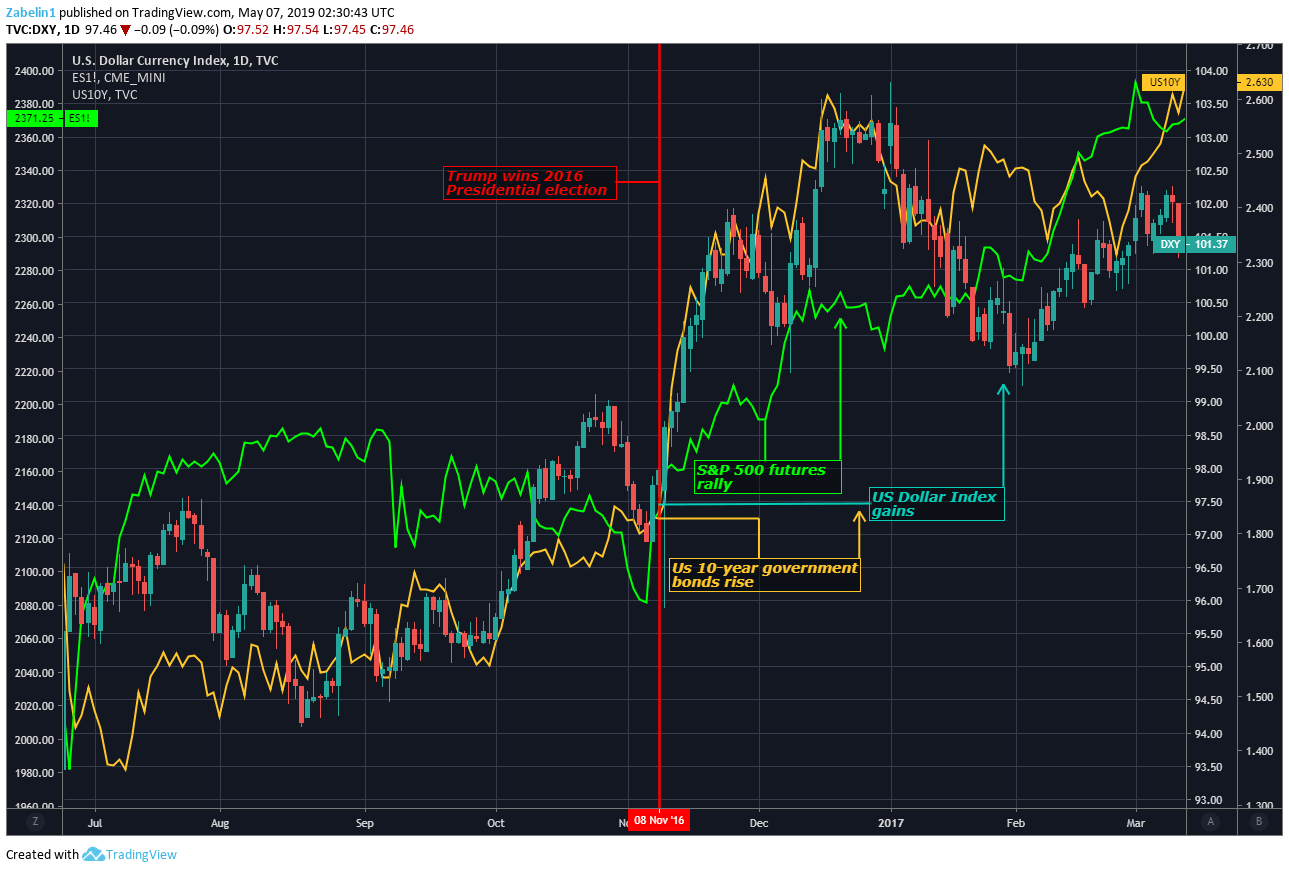
After Donald Trump was proclaimed the victor in the 2016 USpresidential election, the political landscape and economic backdrop favored a bullish outlook for the US Dollar. With the the Oval Office and both houses of Congress thus controlled by the Republican Party, the markets appeared to conclude that scope for political volatility had was substantially reduced.

This made the market-friendly fiscal measures proposed by candidate Trump during the electionappear more likely to be implemented. These included tax cuts, deregulation and infrastructure building. Investors appeared to overlook threats to launch trade wars against top trading partners such as China and the Eurozone, at least for the time. On the monetary side, central bank officials raised rates at the tail end of 2016 and were looking to hike again by at least 75 basis points through 2017.

With scope for fiscal expansion and monetary tightening in sight, the US Dollar rallied alongside local bond yields and equities. This came as corporate earnings expectations strengthened alongside the outlook for broader economic performance, which likewise stoked best on firmer inflation and thereby on a hawkish response from the central bank.

Scenario 4) US Dollar Index (DXY), S&P 500 Futures, 10-Year Bond Yields (Chart 7)
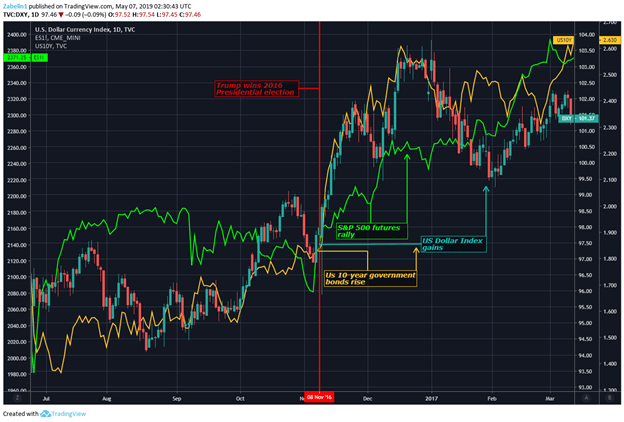
Chart showing S&P 500 Futures, US Dolla

LIMITATIONS OF THE MUNDELL-FLEMING MODEL

For many years, the IS-LM-BP or Mundell-Fleming model was a way to measure the impact of changes in policy for small open economies. In turn, many economists suggest that economies with significant enough scale may not adhere to the “rules” that “normal” economies have to contend with, and as a result, the IS-LM model was deemed preferable.

But in the past decade, new research has showed that the framework presented in IS-LM-BP in fact captures the state of the contemporary globalized economy better than the IS-LM model alone. Needless to say, opinions on the subject abound across the spectrum of economists.

Ultimately, there is no ‘Holy Grail’ analytical framework that will yield the proper insight every single time, regardless of the political context or the status of the monetary system. There may be times that events produce market reactions that can’t be readily understood or explained.

And yet, not having a framework for how to interpret how politics and central banks are moving FX markets would be irresponsible. Using the Mundell-Fleming model as a guide may help traders filter out the noise of the day-to-day news cycle, helping them better understand and practically react to information shaping FX market price trends.


Trading with Confidence in the Forex Market

Trading with Confidence in the Forex Market

Know Your Trading Style

The first of several facets to trading with confidence is having an analytical methodology and strategies which fit the trader’s personality. Each trader has a different view on how things work and what resonates when it comes to analysis. Having a firm understanding of what works is extremely important as well as being consistent in application. Whichever type of analysis is selected, traders should not overcomplicate matters by adding components which could lead to confusion. Simple and consistent application of indicators – support and resistance, trend-lines, Elliot wave theory will lead to traders trading with confidence.

Pin Down A Trading Time-Frame

Time frame filters down from the trading style or strategy employed by the trader. Different trading styles generally relate to specific time horizons. For example, a position trader will target long-term time frames for each trade. Time-frames completely depend on the trader’s mentality and the amount of time they can dedicate per day. 4-hour time frames can be a good place to start off as it avoids market noise and does not require constant monitoring. This comes back to sticking to a trading style which will prevent traders from jumping around between time frames.

Focus on a few currency pairs

Know the markets or currency pairs which are being traded as per the strategy. Keeping the pool of instruments/markets small is always a good idea. Not all asset classes or even instruments within an asset class move the same, they have their own characteristics. Knowing the behavior of this small universe of symbols will give you more confidence when trading.

Calculate Your Risk Tolerance

Trading with confidence has strong links to risk management and understanding tolerance for risk. This is perhaps the most important facet, as it keeps traders steered towards taking the proper amount of risk per trade to prevent traders overriding analysis with emotion based on a lack of acceptance of the risk per trade. Risk management trumps analysis.

Focus on Process Not Outcomes

Focusing on the process, not the results will allow traders to gain greater confidence whilst trading. This requires patience to refrain from primarily focusing on the end goal. One way to do this is to keep a checklist, whether on paper or mentally. This will help steer traders towards the trades which suit the trading plan and prevent traders from entering harmful trades. It also helps deviate focus on the profit/loss (result) and maintain objectivity. In addition to the above, focusing on process-orientated goals will aid traders in remaining organized in relation to the trading goals.

When Your Trading Confidence is Hit, Reflect and Repair

Drawdowns can take a trader out of the proper mindset to trade with confidence. In Paul’s video above, it was discussed how to handle a drawdown, which is an inevitable occurrence from time to time. The first step noted was to ‘get out of the fire’, and effectively hit the reset button. Secondly, review trades that were unsuccessful – market not conducive to trading style etc. It is important to note that the market is always right. Choosing not to trade is essentially a trade in itself. Once issues are identified, returning to the market slowly is a prudent approach until confidence is restored.

Avoid Trading Overconfidence

Handling periods of success and identifying when those periods might be drawing towards a pause is also key to maintaining confidence. Constantly reminding yourself to stay humble during times of success is paramount, if not, the market will make sure to humble you. Handling winning periods properly can be just as important as handling losing periods.

Trading Confidence: A Summary

This article has outlined several pointers that assist traders in building trading confidence. Traders need to recognize these different aspects of the trading process and should not disregard their impact. Controlling every aspect of the trading process is unrealistic, however making a concerted effort to manage the aspects you can control can provide you with a psychological advantage in the market.

Fibonacci in the Forex Market

Fibonacci in the Forex Market

Fibonacci in the Forex Market

Forex traders utilize Fibonacci retracements to aid in identifying possible key levels of support and resistance. These levels are used as guidelines for traders looking to enter or exit the market along with appropriate risk management techniques.

How to Create a Fibonacci Retracement on a Forex Pair

Before delving deeper into practical examples, traders need to have a basic view of the overall market being analyzed (EUR/USD or USD/ZAR etc.). This starts by identifying the trend; this can be long, medium or short-term depending on trading style. Various methods can be used to identify the trend such as simple price action, indicators like Moving Averages (MA) , as well as other methods. The reason why identifying the trend is important is because the Fibonacci tool itself does not determine a trend bias, rather it identifies key support and resistance levels.

Further your knowledge on trend trading

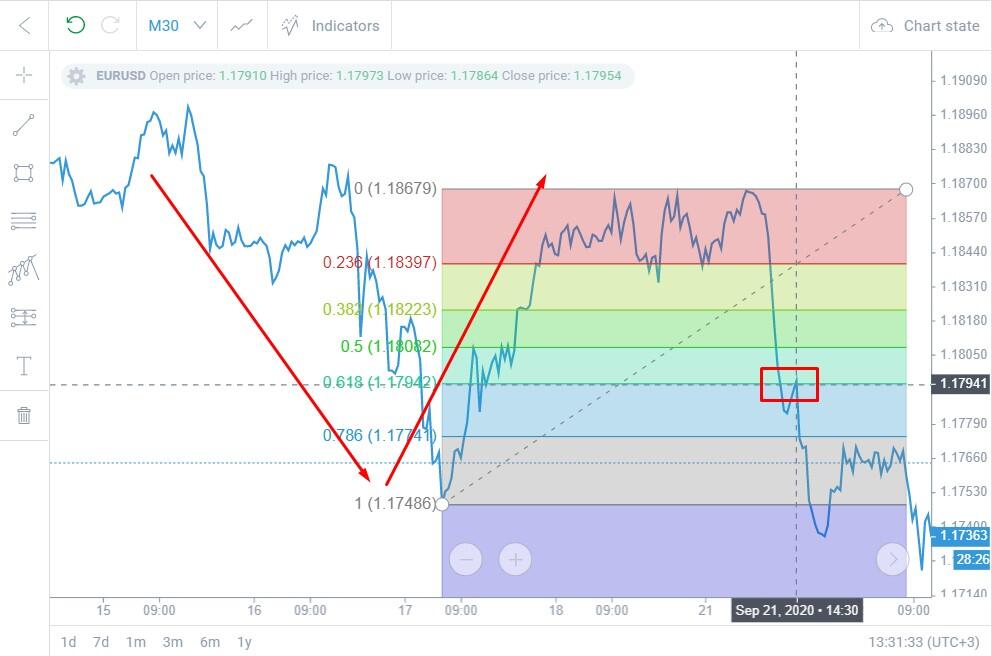
Implementing the Fibonacci retracement requires identifying a large move either up/down on the forex price chart. This will produce key levels using Fibonacci metrics. The dueling nature of a forex pair has the tendency for mean reversion, which can produce major moves from which Fibonacci retracements can be drawn.

The key levels to look out for are 38.2% and 61.8% respectively. The 50% level is not technically a Fibonacci level but is often included in charting packages and regarded as an important threshold. This level simply marks half the market move between the initial high and low or vice versa. The chart below shows a simple implementation of the Fibonacci retracement on a GBP/ZAR daily chart. Highlighted in black are the respective low to high points which are used to plot the Fibonacci levels.

GBP/ZAR daily chart – uptrend:

GBP/ZAR daily chart with Fibonacci

Traders may also utilize the Fibonacci retracement from a high to low price level as expressed on the USD/SGD chart below.

USD/SGD daily chart – downtrend:

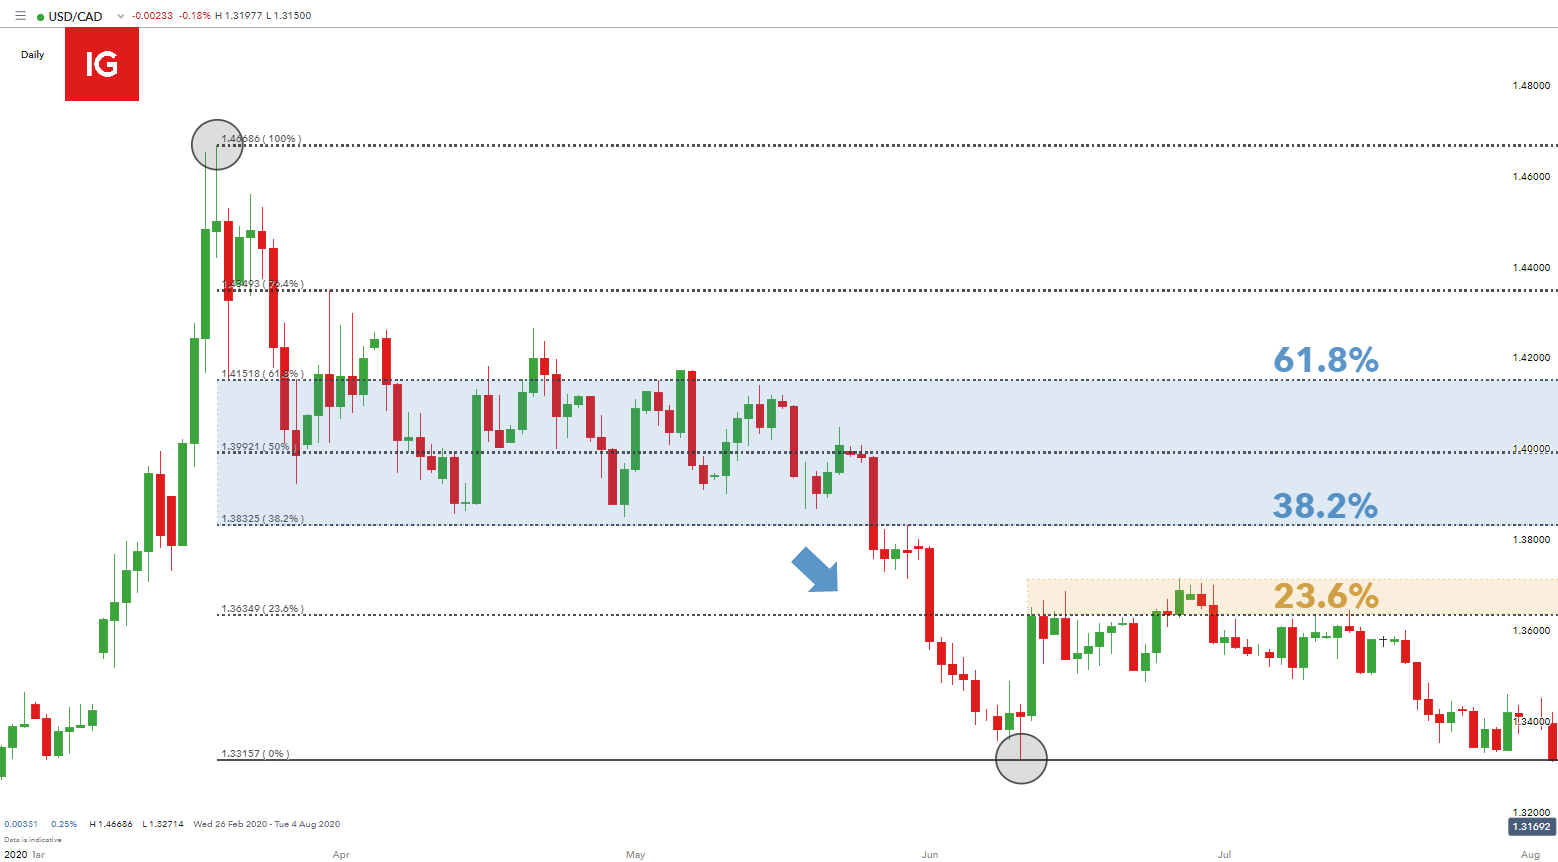
Once the Fibonacci retracement is drawn, traders can use these price levels for possible entry and exit signals. The USD/CAD example below shows how price action tends to revert to the various Fibonacci levels. The blue rectangle highlights the area between the 61.8% and 38.2% Fibonacci levels. It is evident that price respects these two key support and resistance points. Traders may look to enter into short positions at the 61.8% – as a result of the preceding downward trend, with initial support coming from the 38.2% level.

It is important to note that the Fibonacci points should not be seen as concrete levels but rather guidelines or reference points. Price will not always trade at these exact levels. It is common to see price just falling short or pushing passed a level which can frustrate traders who look at exact levels. With reference to stop and limit orders, traders should give themselves some leeway for potential price fluctuations around the Fibonacci level. The chart below shows an example of this above the 23.6% level (yellow) where bulls are seen pushing price up but quickly reverting back down below the 23.6% level.

USD/CAD daily chart:

USD/CAD Daily chart with Fibonacci

Chart prepared by Warren Venketas, IG Charts

This is the most simplistic form of the Fibonacci retracement within forex markets. The versatility of the Fibonacci retracement function means that it is not limited to one time frame as seen above. A more complicated approach involves several Fibonacci retracements across different time frames. Instituting multiple time frame analysis can allow for multiple Fibonacci retracements drawn from major moves. The next article in the Fibonacci series will go into more depth with and practical examples to show how exactly traders can implement this strategy.

The Federal Reserve Bank: A Forex Trader’s Guide

The Federal Reserve Bank: A Forex Trader’s Guide

What is the Federal Reserve?

The Federal Reserve is the central bank of the United States. It was founded to create a stable, flexible monetary and financial system for the nation. Its general duties are to set monetary policy and oversee effective economic operation, ultimately serving the public interest.

To meet these top-level directives, the Fed performs five general functions:

  1. Promote maximum employment, stable pricing and moderate interest rates long term
  2. Reduce risk where possible to create a stable financial system
  3. Develop safety within financial institutions
  4. Champion safety within payment and settlement systems
  5. Advocate consumer protection through a supervisory stance.

To execute day-to-day operations, the nation is divided up into 12 Federal Reserve Districts, each of which is served by a separately incorporated Reserve Bank. These districts and member banks operate independently while being supervised by the Federal Reserve Board of Governors.

Who owns the Fed?

The Fed is both a private and public institution. The Board of Governors is a government agency, while the banks themselves are structured like private corporations – member banks hold stock and earn dividends.

Who is the Federal Reserve chairman?

As of August 2019, the chairman of the Federal Reserve is Jerome Powell, who has served in this office since February 5, 2018. He is the 16th person to have held the position and will serve a four-year term. Before his appointment, Mr Powell served as a member of the Board of Governors from May 25, 2012. He also currently serves as Chairman of the Federal Open Market Committee, which looks after monetary policy.

Which banks make up the Fed?

The 12 Federal Reserve Districts, each with their own Reserve Bank, are:

  • Boston
  • New York
  • Philadelphia
  • Cleveland
  • Richmond
  • Atlanta
  • Chicago
  • St. Louis
  • Minneapolis
  • Kansas
  • Dallas
  • San Francisco

How is the Fed held accountable to its functions?

The Fed is accountable to the public, as well as to the US Congress. The Chair and Federal Reserve officials testify in front of Congress, while the system of setting monetary policy is designed to be clear and transparent. In the interests of accountability, the Federal Open Market Committee (FOMC) will publish statements following all annual meetings. All financial statements are audited independently once a year to ensure financial accountability as well.

Key Economic Mandates of the Federal Reserve System

US monetary policy is the core mandate of the Federal Reserve bank. The statutory objectives of this monetary policy are outlined by the Congress and are:

  • Maximum employment: The monetary policy set out by theFOMC should ensure unemployment remains low, working to boost the economy where needed so that businesses thrive, make a profit and hire more staff to grow
  • Price stability: The Fed defines price stability as an inflation rate of 2% in the long term
  • Moderate long-term interest rates: This works alongside price stability – when an economy is stable, long-term interest rates remain at a moderate level

The Fed aims to achieve its monetary policy through its influence over interest rates and the general financial climate. This can lead to volatility of the US Dollar, ahead of Fed announcements and changes to policies.

Federal Open Market Committee

Monetary policy is set by the Federal Open Market Committee (FOMC), which oversees the open market operations of the Federal Reserve System. They set a target for the federal funds rate at FOMC meetings; this is the interest rate that they want banks to offer to each other for overnight loans. While the FOMC doesn’t control the rate, it can influence it in three main ways:

  • Open market operations. This means the buying and selling of government bonds on the open market – selling bonds decreases monetary supply with the aim of increasing interest rates. Buying bonds puts money back into the economy, with the aim of decreasing interest rates
  • Discount rate. This is the rate that banks pay to borrow money from the Fed. When this rate is lower, then it is also more likely the federal funds rate will be lower too
  • Reserve requirements. Banks need to hold a certain percentage of customers’ deposits to cover withdrawals – this is the reserve requirement. When these are raised, banks can’t loan as much money and must ask for higher interest rates. When lowered, banks can loan more money and ask for lower interest rates.
 How Does the Federal Funds Rate Affect the US Dollar?

The Fed’s interest rate, also known as the Fed funds rate, is set by the Board of Governors of the Federal Reserve System. The current interest rate and the expectations of future interest rate changes can both affect the value of the US Dollar. If traders anticipate a change in interest rates based on announcements from the Board of Governors, this can cause the Dollar to appreciate or depreciate in value against other currencies.

This table sets out the way in which market expectations and rate changes can affect the value of the dollar:

Market expectations Actual Results Resulting FX Impact
Rate Hike Rate Hold Depreciation of currency
Rate Cut Rate Hold Appreciation of currency
Rate Hold Rate Hike Appreciation of currency
Rate Hold Rate Cut Depreciation of currency

Find out more about the impact of interest rates on the foreign exchange market.

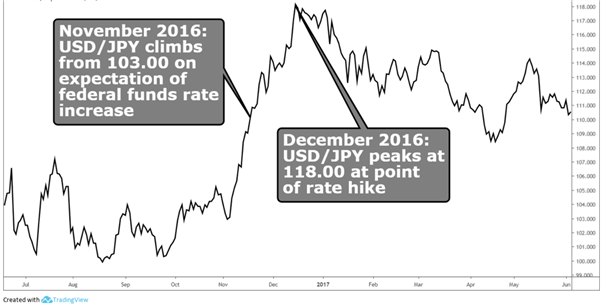
As you can see in the chart below, the Dollar strengthened against the Yen in the leadup to the Fed’s interest rate announcement in December 2016 because it was widely expected that the fed funds rate would increase. The pair peaked at around 118.371 on the day of the announcement, December 14, 2016.

USD/JPY chart before and after Fed hikes in 2016

Chart to show the impact of Fed hikes on USD/JPY

How to Trade the Fed Monetary Policy Decisions

In order to prepare for Fed rate change decisions, traders should follow these two key steps:

  1. Keep up with news from the Fed. The FOMC holds eight regular meetings a year, where policies and interest rates are discussed and agreed upon. Keeping up with news ahead of these meetings is the best way to make predictions about interest rates, and whether to buy or sell the US dollar
  2. Keep with news from the markets. Rest assured that it won’t just be you speculating on interest rates – ahead of Federal Reserve meetings and announcements, many forex traders will be watching what happens very closely. Keep an eye out for others’ predictions and forecasts, and stay well informed enough that you can have your own opinions and add your own logic to that of others

No method of predicting interest rate decisions can ever be completely accurate and surprises do occur. It’s always important to protect yourself when trading forex, so make sure you place stops in advance to ensure you keep your losses to a minimum should the markets move against you.

Remember to stick to your trading plan and never place a trade where you wouldn’t be able to afford the losses. Trades can go both ways. No matter how sure you feel that they will work in your favour, there’s always the chance that they might not.

Nasdaq Index, Dow Jones, S&P 500 News: GM’s Earnings Set Tone Before Bell, Tech Giants to Follow

Nasdaq Index, Dow Jones, S&P 500 News: GM’s Earnings Set Tone Before Bell, Tech Giants to Follow

Major Stock Indexes Mostly Lower

The major U.S. stock indexes are trading mixed but most lower in Tuesday’s pre-market trade, as investors shift their focus to the latest corporate earnings and the Federal Reserve’s policy meeting. General Motors (GM) is set to report before the bell with the spotlight on Alphabet and Microsoft after the closing bell.

At 10:46 GMT, blue chip Dow Jones futures are trading 38446.00, down 42.00 or -0.11%. Benchmark S&P 500 Index futures are at 4952.25, down 2.25 or -0.05% and tech-weighted Nasdaq-100 Index futures are trading 17709.00, up 3.00 or +0.02%.

Recent Market Performance

The market is trying to build on a successful previous session that saw the Dow and S&P 500 achieving their sixth record closes of the year. The Nasdaq Composite led the gains among major indexes, climbing over 1%. This rally was partly fueled by the U.S. Treasury Department’s announcement of lower-than-expected borrowing needs for the first quarter, boosting investor sentiment.

January Trading Month Analysis

As January’s trading month nears its end, all three major indexes are set to report gains, with the Nasdaq Composite leading with a 4.1% rise. The blue-chip Dow and the broad S&P 500 have also seen increases of 1.7% and 3.3%, respectively.

Individual Stock Movements

F5 and Sanmina stocks are seeing an increase following robust earnings reports. Meanwhile, Whirlpool is facing a downturn due to a less optimistic full-year outlook. Post-market hours also showed notable activity, with Woodward shares climbing on strong financial performance and guidance.

Earnings Week and Key Companies

This week is crucial for corporate earnings, with significant contributions from the tech sector. Investors are particularly focused on the results from Alphabet and Microsoft on Tuesday. Outside of tech, GM and UPS are among the prominent names reporting earnings, with GM’s fourth-quarter earnings and 2024 guidance under scrutiny.

Federal Reserve Meeting and Economic Outlook

The spotlight is also on the Federal Open Market Committee’s two-day policy meeting, with the market largely expecting the Fed to maintain current rates. Economic data on housing, the labor market, and consumer confidence are also key factors that investors are monitoring closely.

Market Forecast with Key Earnings Insight

As the market navigates a crucial week, General Motors (GM) is set to report its earnings before Tuesday’s bell, while tech giants Alphabet and Microsoft will announce theirs after the bell. These reports, combined with the Federal Reserve’s policy decisions, are expected to significantly influence the market’s short-term direction, fostering a cautiously optimistic outlook.

Technical Analysis

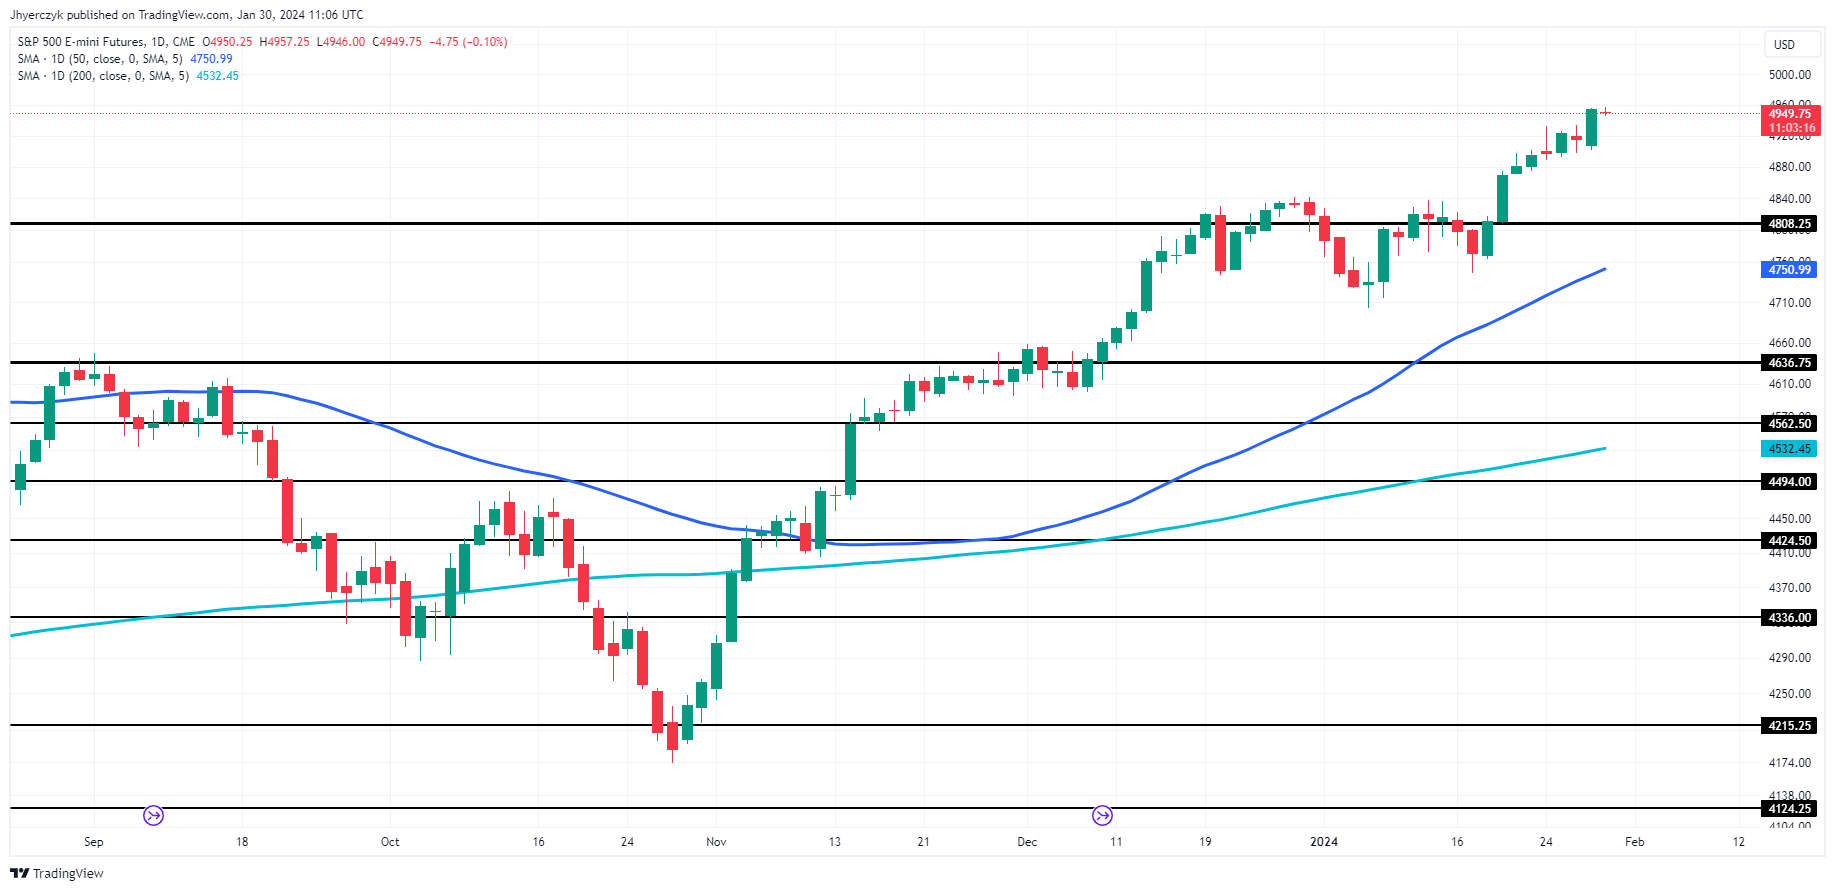
Daily E-mini S&P 500 IndexE-mini S&P 500 Index futures are struggling during the pre-market session on Tuesday as traders await earnings news from GM before the opening bell and Alphabet and Microsoft after the close. Nonetheless, the index is in a position to post its seventh record close of the year.

Without any true resistance levels to impede its progress, investors expect the uptrend to continue. However, we believe the index is running too hot with the distance between its current price and the 50-day moving average at 4750.95, widening at a pace that cannot be sustained.

This doesn’t necessarily mean the trend is getting ready to turn lower but the index is susceptible to a meaningful short-term correction.

Gold Prices Forecast: XAU/USD Steadies as Fed Rate Policy Decision Looms

Gold Prices Forecast: Higher as Safe-Haven Appeal Rises Amid Mideast Tensions

Gold Market Analysis

Gold prices are slightly higher on relatively light volume early Tuesday, influenced by a combination of lower U.S. Treasury yields, a slight decline in the U.S. Dollar, and increasing geopolitical tensions in the Middle East. The upcoming Federal Reserve’s two-day meeting is eagerly anticipated by the market for potential cues.

At 08:16 GMT, XAU/USD is trading $2038.16, up $5.63 or +0.28%.

Influences on Gold Prices

The recent drop in Treasury yields, reaching a two-week low, coupled with a 0.1% fall in the U.S. Dollar Index (DXY), are key factors contributing to gold’s rise. These elements are making gold more appealing by reducing the opportunity cost of holding non-yielding assets. Moreover, the intensifying tensions in the Middle East are heightening gold’s appeal as a safe-haven asset, although the extent to which this is impacting market positioning ahead of the Fed’s meeting remains uncertain.

Federal Reserve’s Impact

The market is closely observing the U.S. central bank’s upcoming decision on key policy rates and statements from Chair Jerome Powell. These are expected to significantly steer gold’s future direction. The current state of anticipation is keeping gold prices stable, with a slight uptick expected owing to the geopolitical uncertainties.

Economic Data and Rate Outlook

Crucial economic data, including the personal consumption expenditures price index (PCE) and upcoming labor market figures, are essential in assessing the economy’s status and the influence of interest rates. The prevailing expectation in the market is for the Fed to maintain current rates, with attention directed towards future rate cut guidance. Traders have virtually eliminated the chances of the Fed’s first rate hike in March and are now pegging May for the dovish move.

Market Forecast

In the short term, gold’s outlook appears bullish with an air of caution. The combination of lower Treasury yields, a softer dollar, and geopolitical tensions, along with the Fed’s forthcoming policy decision, are likely to underpin gold prices. However, traders should keep a close watch on the Fed’s statements and key economic data, as these could lead to market volatility in the gold sector. Post-Fed statement remarks on Wednesday by Fed Chair Jerome Powell are expected to be the near-term catalyst for movement.

Technical Analysis

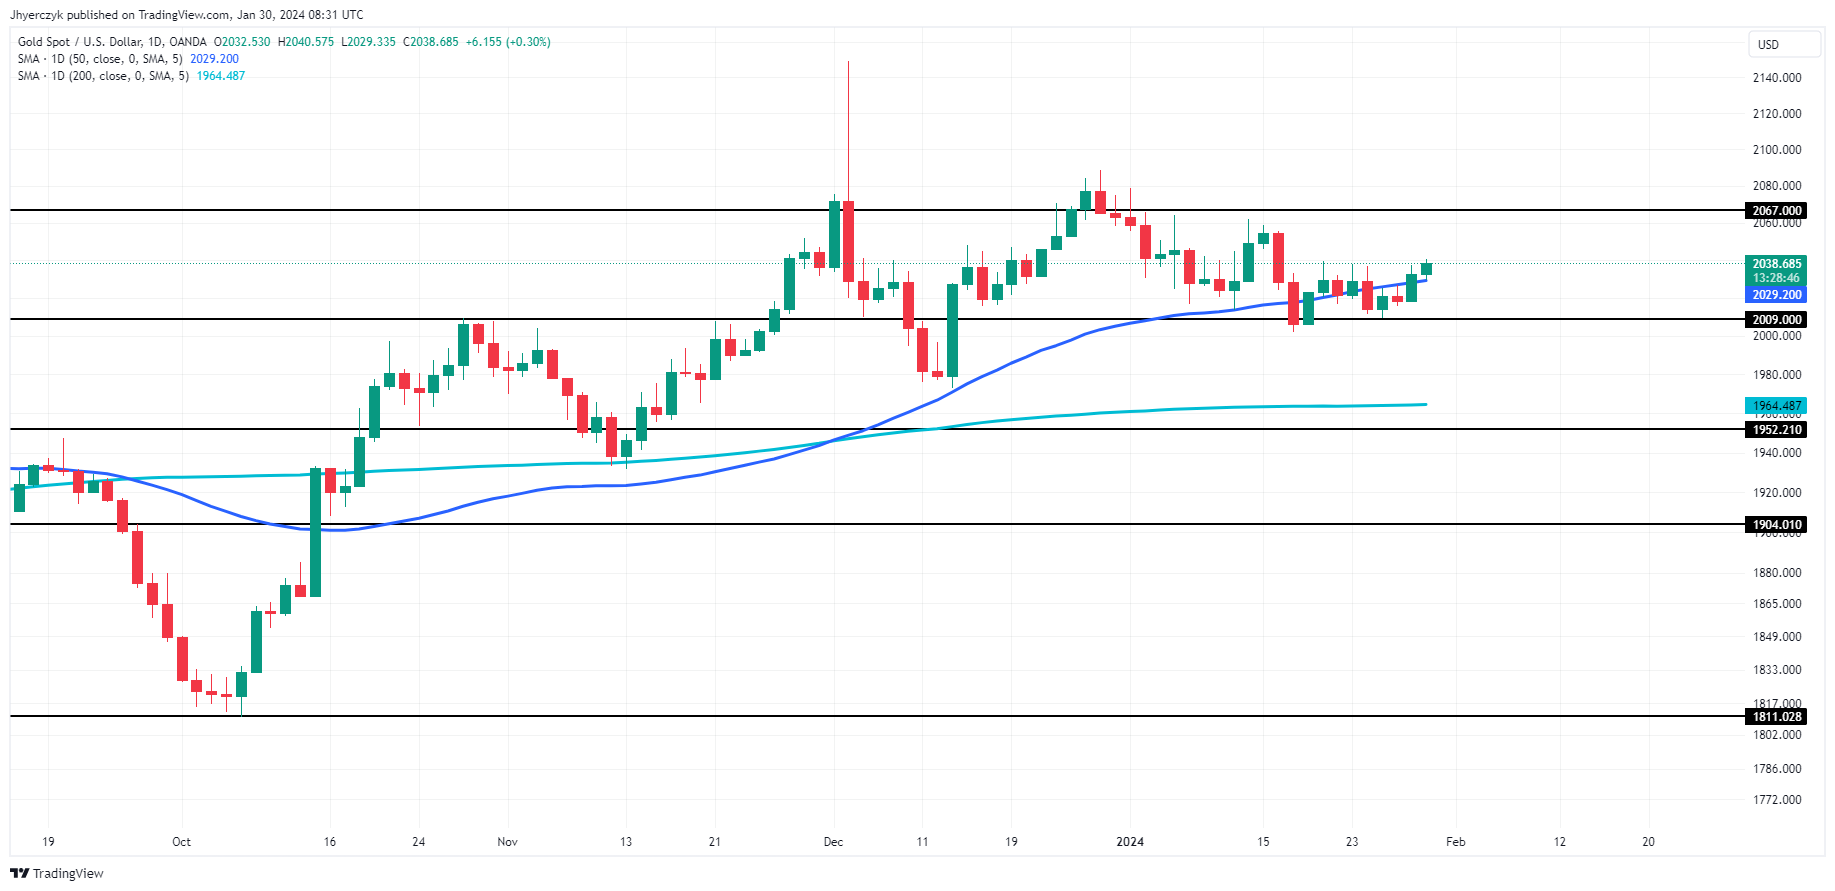
Daily Gold (XAU/USD)Gold (XAU/USD) is rising early Tuesday after decisively crossing to the strong-side of the uptrending 50-day moving average at $2029.19. This is helping to bolster the intermediate trend.

With bullion holding above this new support level, the market may experience renewed momentum, putting its next upside target at $2067.00 on the radar.

A failure to hold the 50-day MA will change the short-term trend back to down with $2009.00 the next support level. If this area fails to draw the attention of buyers then the 200-day MA at $1964.48 will become the next target.