US Dollar Price Forecast: European GDP, US CB Consumer Confidence in Focus

US Dollar Price Forecast: European GDP, US CB Consumer Confidence in Focus

Shifting Dynamics in Forex: Key Economic Indicators Ahead

The US Dollar witnessed an uptick of 0.12% during the Asian session, trading at 103.583, setting the tone for the day’s market dynamics. For the EUR/USD pair, recent data releases have painted a mixed economic picture. French Consumer Spending showed a modest increase of 0.3%, slightly underperforming against the forecast of 0.6%. The French Flash GDP remained stagnant at 0.0%, aligning with expectations but showing no growth from the previous quarter’s -0.1%.

The GBP/USD is mostly unchanged as BRC Shop Price Index year-over-year marked a rise to 2.9%, indicating a softer increase compared to the previous 4.3%.

Events Ahead

Looking ahead, pivotal data releases are lined up, including the Spanish Flash CPI year-over-year and GDP quarter-over-quarter, with expectations set at 3.0% and 0.2% respectively. The Italian Prelim GDP and German Prelim GDP data are also due, with forecasts pointing towards a contraction in the German economy.

Furthermore, the broader Eurozone’s Prelim Flash GDP is anticipated to mirror the previous quarter’s figure of -0.1%, suggesting continued economic challenges.

Additionally, significant attention is drawn towards the German Buba President Nagel’s speech at the New Economy Forum in Berlin, which could impart crucial insights affecting the Euro.

In the UK, attention is focused on the M4 Money Supply, Mortgage Approvals, and Net Lending to Individuals, with Mortgage Approvals expected to show an increase.

Furthermore, significant US economic data is on the horizon, with the CB Consumer Confidence index projected at 114.2, up from 110.7, and JOLTS Job Openings anticipated at 8.73 million, slightly down from 8.79 million.

US Dollar Index (DXY)
Dollar Index

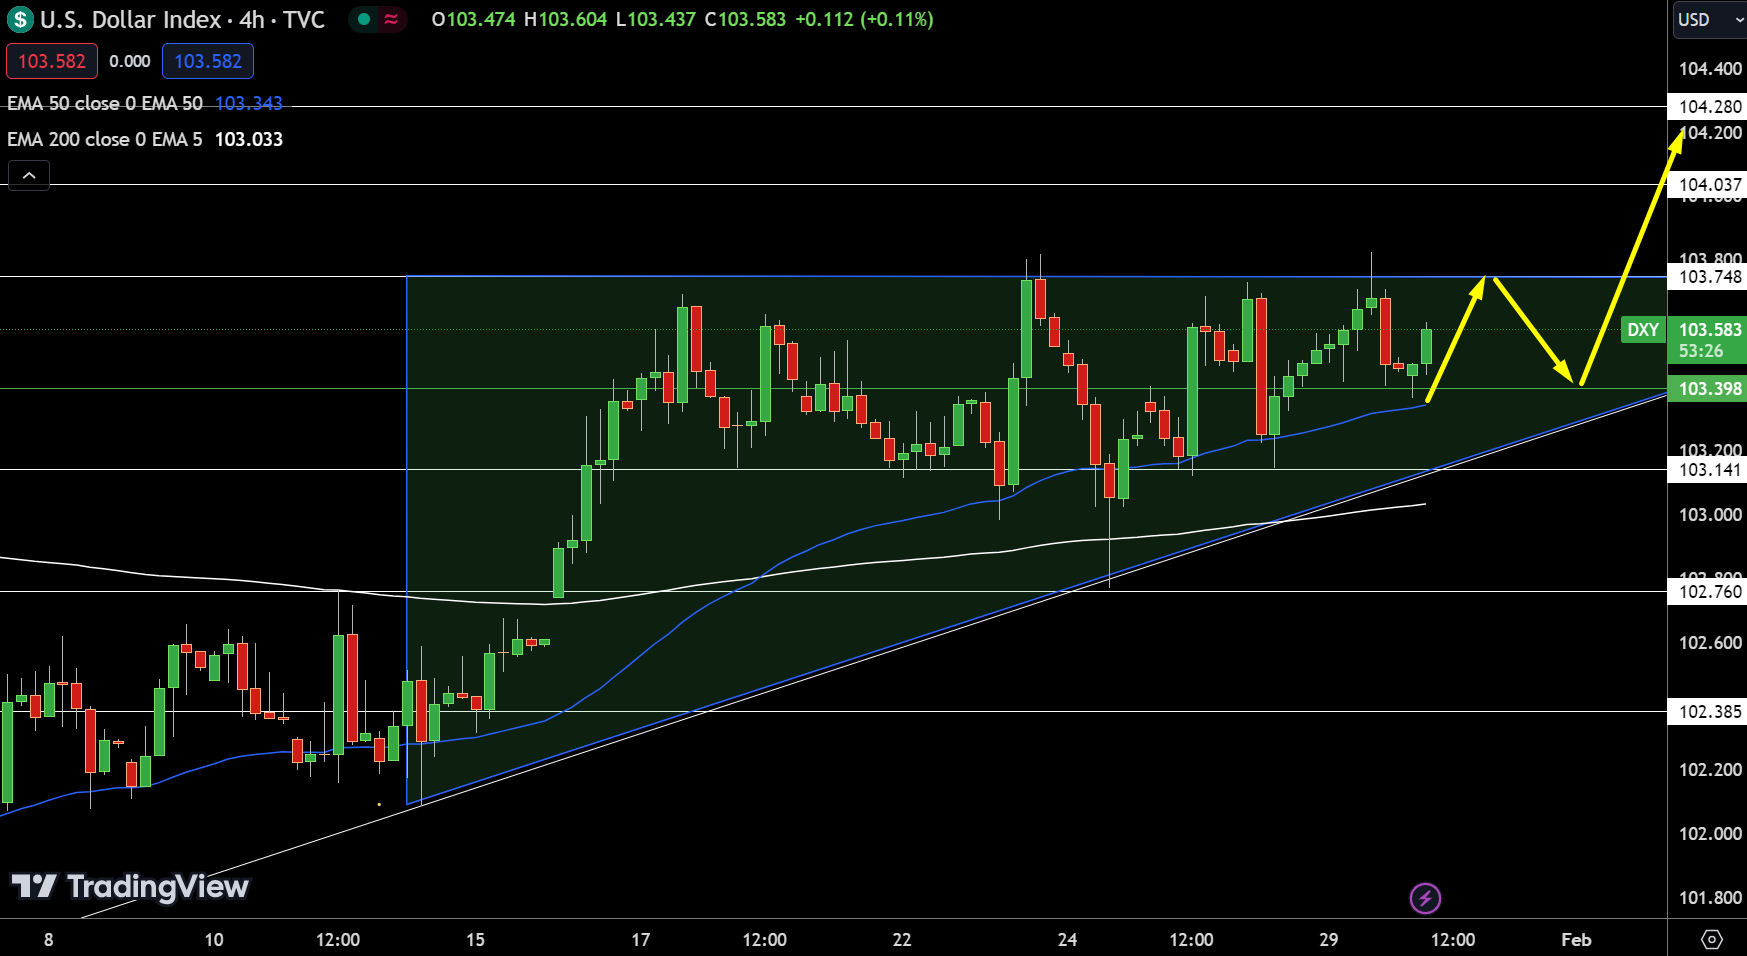
Dollar IndexIn the 4-hour chart, Dollar Index’s pivot point stands at 103.398 along with resistance levels that is observed at 103.748, extending to 104.037 and 104.280, while support levels are situated at 103.141 and further down at 102.760 and 102.385.

The 50-Day and 200-Day EMAs at 103.343 and 103.033, coupled with an ascending triangle pattern, suggest a bullish outlook. However, a double-top formation near 103.748 poses a challenge, with a breakthrough potentially intensifying the bullish momentum.

Overall, the trend for the Dollar index remains bullish, particularly if it stays above 103.398.

EUR/USD Technical Forecast
EUR/USD Price Chart - Source: Tradingview

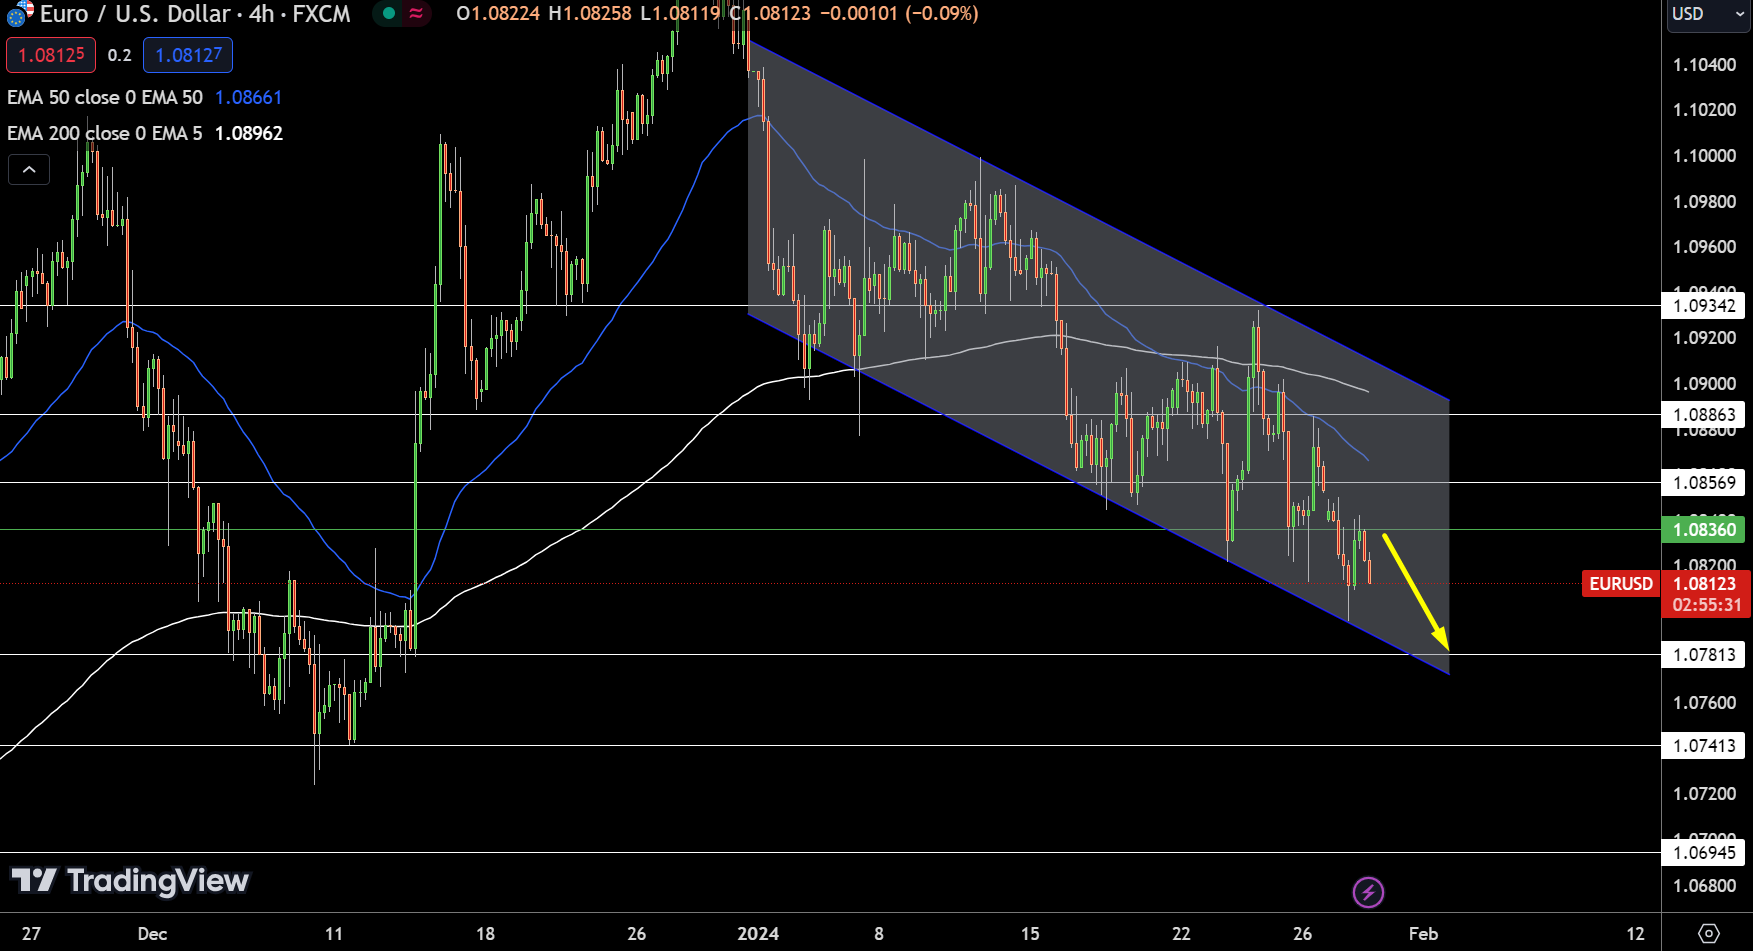
EUR/USD Price Chart – Source: TradingviewAs of January 30, the EUR/USD pair is demonstrating a continued decline, trading at 1.08138, a drop of 0.16%. The 4-hour chart indicates a critical juncture with the pivot point at 1.08360. The pair faces resistance at 1.08569, 1.08863, and 1.09342, each presenting a potential ceiling to upward movements.

On the downside, support is noted at 1.07813, followed by 1.07413 and 1.06945, offering potential relief points against the downtrend. The 50-Day and 200-Day EMAs, at 1.08661 and 1.08962 respectively, are positioned above the current price, reinforcing the bearish sentiment. The prevailing downward channel pattern suggests a sustained selling trend.

Consequently, a sell trade below $1.0836 could be advantageous for traders. Overall, the trend for EUR/USD is bearish, especially below the $1.0836 threshold.

GBP/USD Technical Forecast
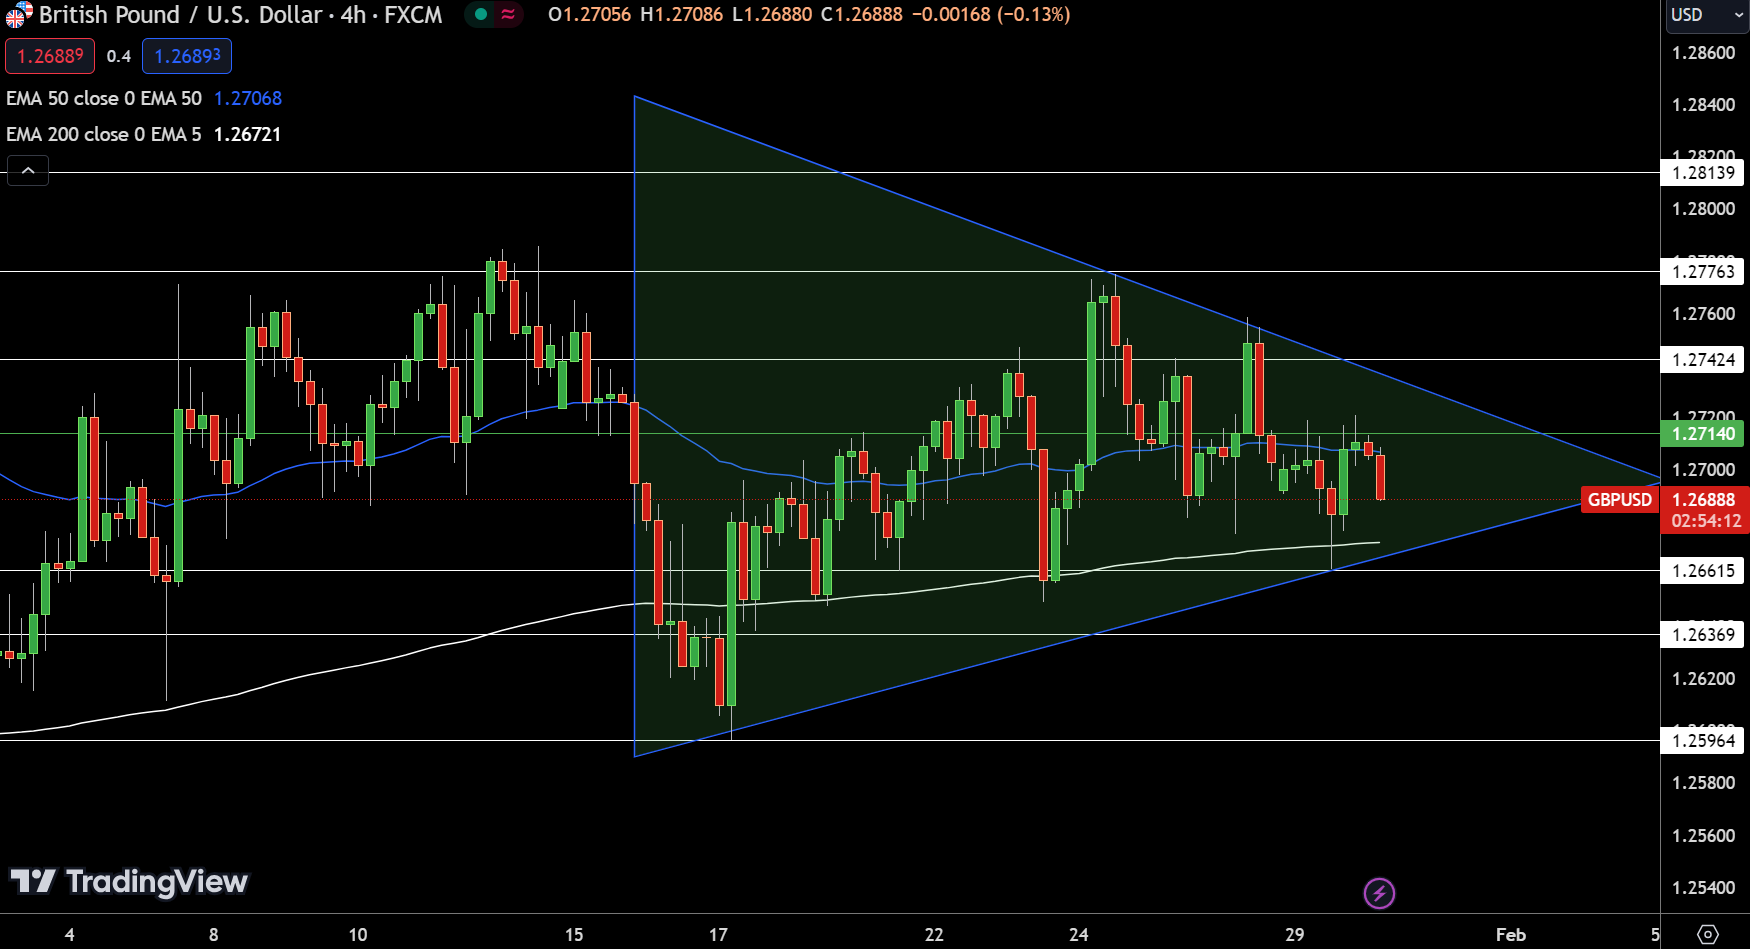
GBP/USD Price Chart - Source: Tradingview

GBP/USD Price Chart – Source: TradingviewThe GBP/USD pair is currently navigating a downward path, trading at 1.26846, which translates to a 0.20% decrease. Analyzing the 4-hour chart, the currency pair is facing a pivotal point at 1.27140. It encounters resistance at 1.27424, 1.27763, and 1.28139, where selling pressures are likely to intensify. Conversely, support levels are found at 1.26615, 1.26369, and 1.25964, potentially offering a buffer against further downward movement.

The technical perspective is shaped by the 50-Day and 200-Day Exponential Moving Averages (EMAs) at 1.27068 and 1.26721, respectively. The positioning of the 50 EMA above the current price indicates a neutral to bearish outlook, while the 200 EMA below the price level gives a slightly bullish signal.

The chart reveals a symmetrical triangle pattern, suggesting a balanced market sentiment. However, the recent appearance of a tweezer top candlestick pattern in the 4-hour chart could foreshadow a potential decline. This observation may lead to considering a sell trade if the GBP/USD pair dips below the $1.2714 level.

Overall, the trend for GBP/USD leans towards bearish, particularly if it remains below the $1.2714 threshold.

XRP News: Coinbase Victory Could End SEC Plans to Appeal XRP Ruling

XRP News: Coinbase Victory Could End SEC Plans to Appeal XRP Ruling

The Monday Overview

On Monday, XRP gained 2.10%. Reversing a 1.26% loss from Sunday, XRP ended the session at $0.5351.

BTC-Spot ETF-Related Updates Fuel XRP Demand

BTC-spot ETF market updates drove buyer demand for BTC and the broader crypto market. Downward trends in Grayscale Bitcoin Trust (BTC) outflows contributed to the gains.

However, XRP continued to sit below the $0.60 handle, with the SEC v Ripple case leaving XRP trailing BTC and the broader crypto market.

Investors await the court ruling on the SEC Motion to Compel. The SEC filed the Motion to Compel on January 11, requesting 2022/23 financial statements and post-complaint contracts governing XRP sales to institutional investors. Ripple and the SEC are progressing toward the February 12 deadline to complete remedies-related discovery.

There were no SEC v Ripple case-related updates since Judge Analisa Torres granted the Ripple Motion to file a Sur-Reply letter.

While investors await a court ruling, the SEC v Coinbase case could have more significance.

SEC v Coinbase: Motion to Dismiss Ruling Pivotal for the Crypto Market

Investors also await the court ruling on the Coinbase (COIN) motion to dismiss (MTD). Coinbase filed a Motion to Dismiss in August, arguing the SEC lacks the statutory authority to regulate crypto exchanges.

If Judge Katherine Failla grants the Motion to Dismiss, the ruling could force the SEC to end its reign of regulation by enforcement. Judge Failla heard oral arguments for and against the Motion to Dismiss on January 17.

On Monday, Amicus Curiae attorney John E. Deaton considered the SEC v Coinbase case, saying,

“In 2021, Gary Gensler testified that exchanges like Coinbase and Kraken fell outside the jurisdictional purview of the SEC and CFTC. In fact, in April 2021, the SEC made a determination that it was in the public’s best interest to grant acceleration for a Coinbase IPO. Two years later, acting as a political operative, Gensler changed his mind and declared Coinbase’s entire business model as illegal and in violation of U.S. securities laws.”

As background, the SEC filed charges against Coinbase in June 2023 for allegedly operating as an unregistered securities exchange, broker, and clearing agency. Additionally, the SEC charged Coinbase for the unregistered offering and selling of securities in connection with its staking-as-a-service program.

The outcome of the SEC v Coinbase case could dictate the direction of the SEC v Ripple case. A Coinbase victory could end SEC plans to appeal the Programmatic Sales of XRP ruling. In July 2023, Judge Torres ruled that programmatic sales of XRP do not satisfy the third prong of the Howey Test. A favorable end to the SEC v Ripple case would be a boon for Ripple and XRP.

XRP Price Action

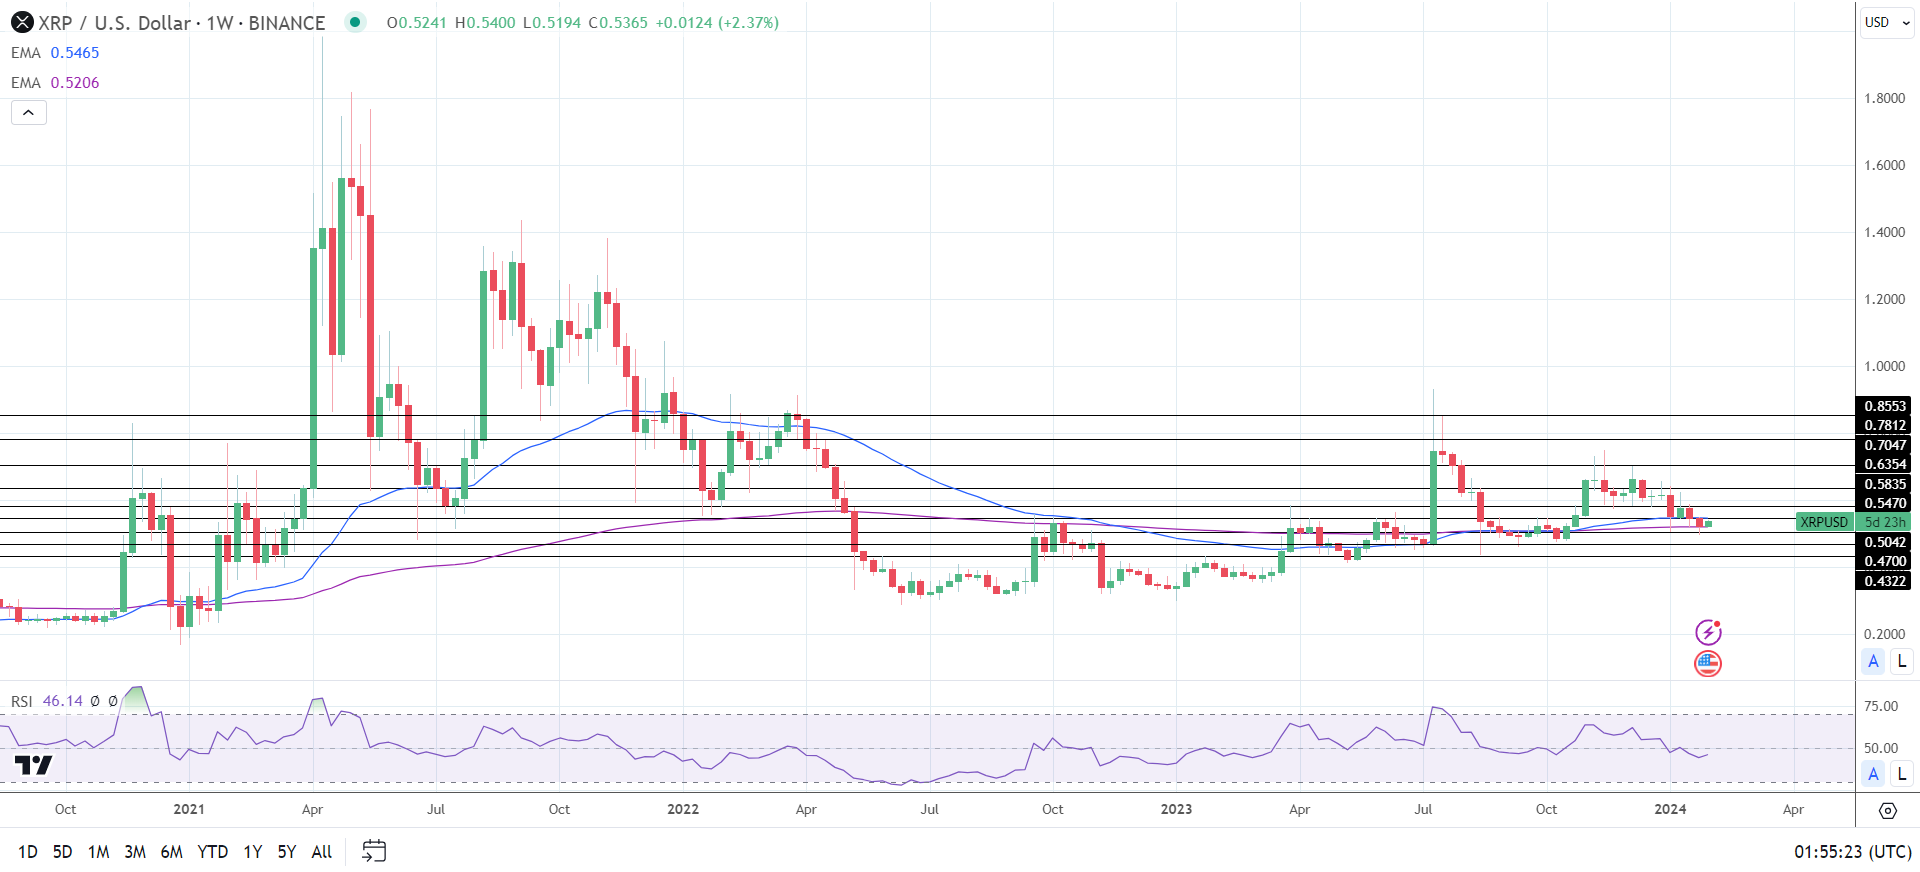
Weekly Chart sends bearish near-term price signals.
XRPUSD 300124 Weekly Chart

Daily Chart

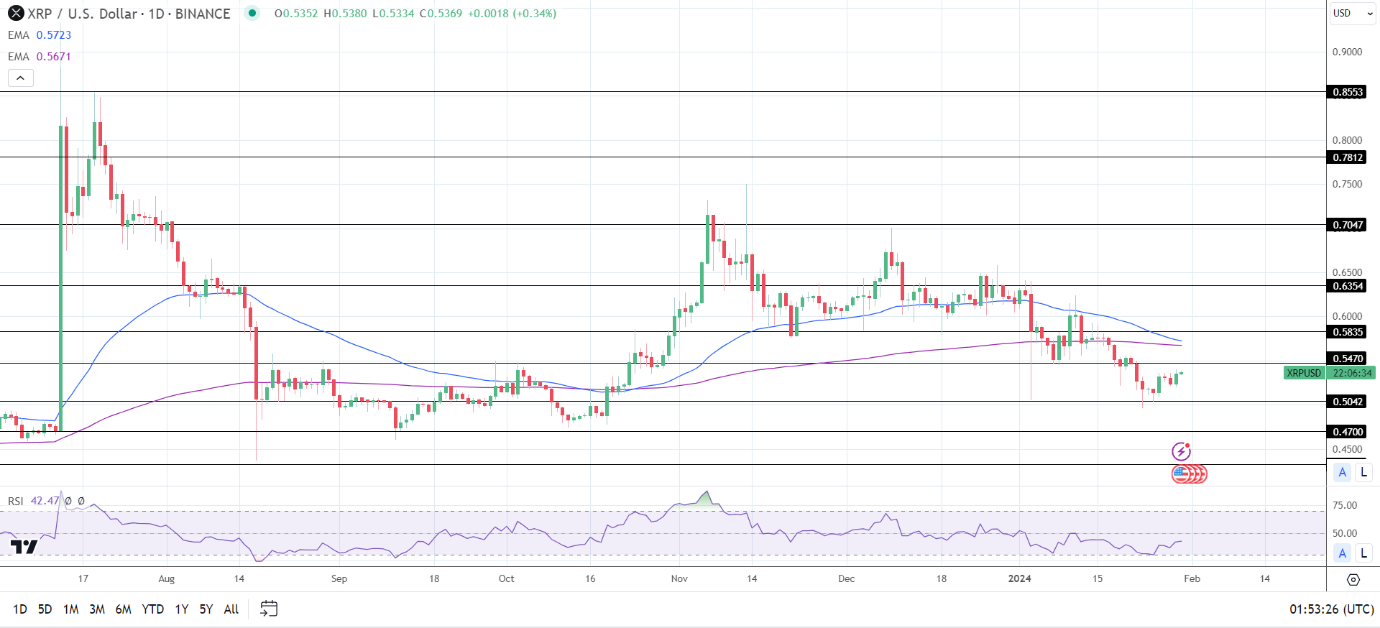
XRP remained below the 50-day and 200-day EMAs, affirming bearish price signals.

An XRP move through the $0.5470 resistance level would give the bulls a run at the 200-day and 50-day EMAs. A break above the 50-day EMA would bring the $0.5835 resistance level into play.

Investors must consider US lawmaker chatter, SEC v Ripple, and SEC v Coinbase case-related updates.

However, a break below the $0.52 handle would support a fall to the $0.5042 support level.

The 14-day RSI reading, 42.47, indicates an XRP fall through the $0.5042 support level before entering oversold territory.

XRP Daily Chart sends bearish price signals.
XRPUSD 300124 Daily Chart

4-Hourly Chart

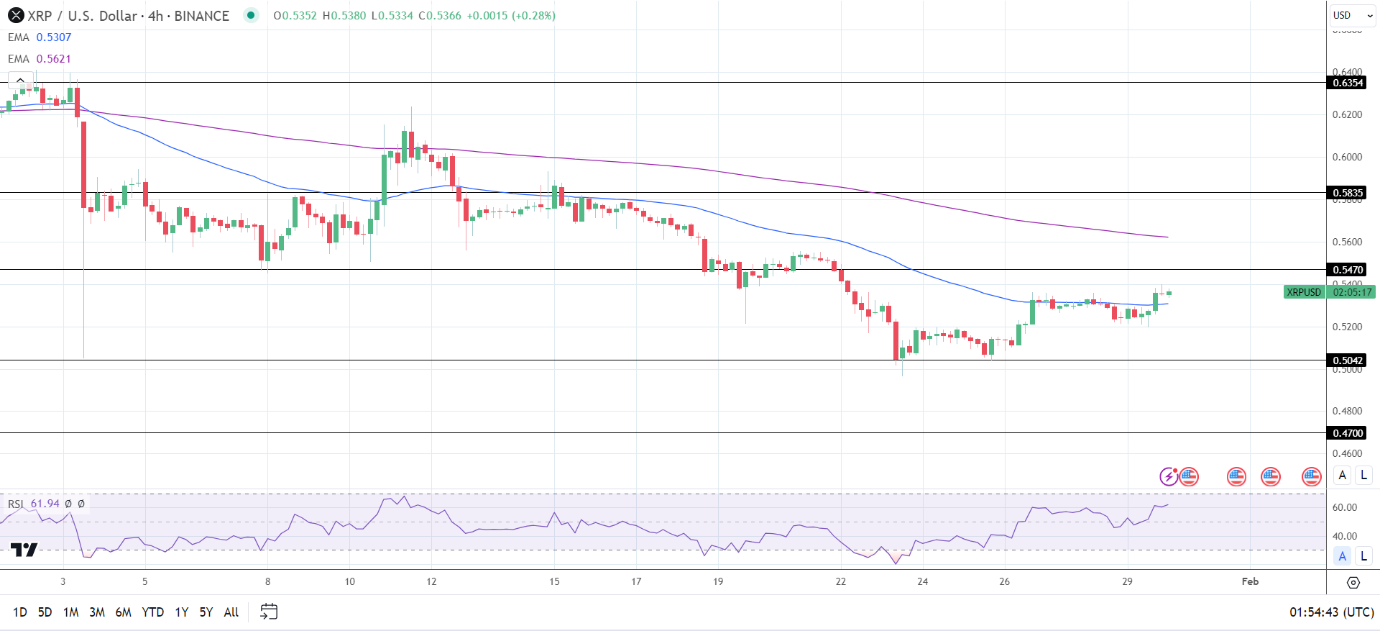
On the 4-hourly, XRP sat above the 50-day EMA while remaining below the 200-day EMA. The EMAs send bearish near-term but bullish longer-term price signals.

An XRP return to the $0.54 handle would give the bulls a run at the $0.5470 resistance level. Conversely, a break below the 50-day EMA would support a fall toward the $0.5042 support level.

The 4-hourly RSI, with a reading of 61.94, suggests an XRP move to the $0.5470 resistance level before entering overbought territory.

XRP 4-Hourly Chart sends bullish near-term price signals.
XRPUSD 300124 4-Hourly Chart
Fed Preview – What’s Ahead for Gold Prices, the U.S. Dollar, Yields and Stocks?

Fed Preview – What’s Ahead for Gold Prices, the U.S. Dollar, Yields and Stocks?

The Federal Reserve will announce on Wednesday its first monetary policy decision of 2024. This event has the potential to create attractive trading opportunities, but it may also bring heightened volatility and unpredictable price movements, so traders should be prepared to navigate the complex market conditions later this week.

In terms of expectations, the FOMC is seen holding its key benchmark interest rate unchanged in its current range of 5.25% to 5.50%. The central bank may also drop language indicating a likelihood of additional policy firming from the post-meeting statement – a move that would mark a de facto shift toward an easing stance.

While the strong performance of the U.S. economy argues in favor of maintaining a tightening bias for the time being, policymakers may start embracing a more dovish posture for fear that that waiting too long to pivot may cause unnecessary damage to the labor market. In a sense, acting early minimizes the risk of having to implement more extreme accommodative measures later on when hell has already broken loose.

Interested in understanding where gold is headed in the short term? Uncover the insights in our complimentary quarterly trading guide. Don’t wait; request your copy now!

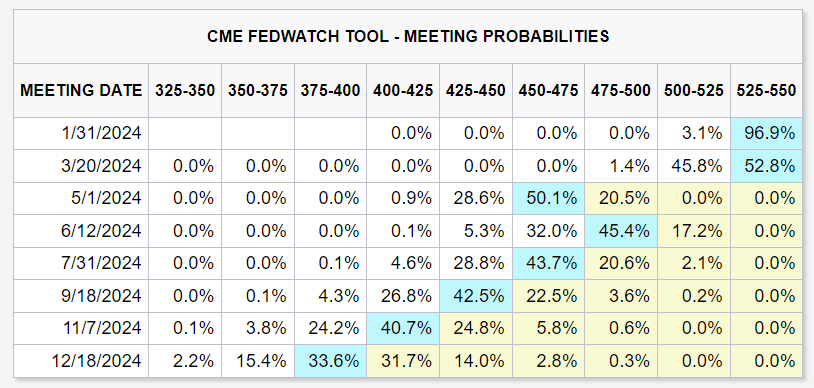
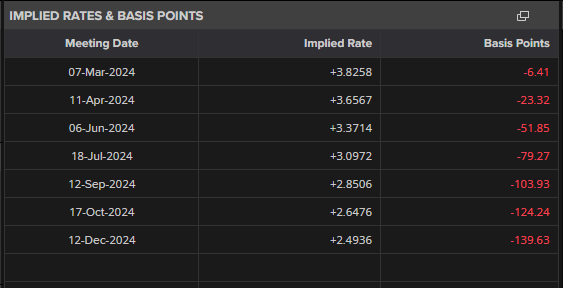
FOMC MEETING PROBABILITIES

image1.pngFor a complete overview of the U.S. dollar’s technical and fundamental outlook, grab a copy of our free Q1 trading forecast!

It’s still unclear whether the Fed will tee up the first-rate cut for the March meeting, but if it subtly greenlights that course of action, we could see a broad-based drop in U.S. Treasury yields, as traders try to front-run the upcoming move. This would be a bullish outcome for the stocks and gold prices, but would exert downward pressure on the U.S. dollar.

In the event of the FOMC leaning on the hawkish side and pushing back against expectations of deep rate cuts for the year and an early start to the easing cycle, nominal yields and the U.S. dollar should rise sharply in tandem. This scenario would create a hostile environment for the equity market as well as precious metals in the near term.

If you’re looking for an in-depth analysis of U.S. equity indices, our first-quarter stock market forecast is packed with great fundamental and technical insights. Get the full trading guide now!

Euro (EUR/USD) Pares Recent Losses After German and Euro Area Q4 GDP Releases

Euro (EUR/USD) Pares Recent Losses After German and Euro Area Q4 GDP Releases

The German economy missed slipping into a technical recession by the smallest of margins after the country’s Q3 GDP was upgraded to flat from -0.1%. The first look at German Q4 GDP came in line with market forecasts at -0.3%.

image1.png

According to The Federal Statistical Office (Destatis),

‘The gross domestic product (GDP) fell by 0.3% in the fourth quarter of 2023 compared with the third quarter of 2023 after adjustment for price, seasonal and calendar variations. After the German economy more or less stagnated in the first three quarters, economic performance decreased in the fourth quarter of 2023. Compared with the previous quarter, there was a marked decline, in particular, in gross fixed capital formation in construction and in machinery and equipment after price, seasonal and calendar adjustment.’

The Euro Area also missed slipping into a recession after growth flatlined in Q4, beating forecasts of -0.1%, after the economy contracted by 0.1% in Q3.

image2.png

For all market-moving economic data and events, see the real-time DailyFX Economic Calendar

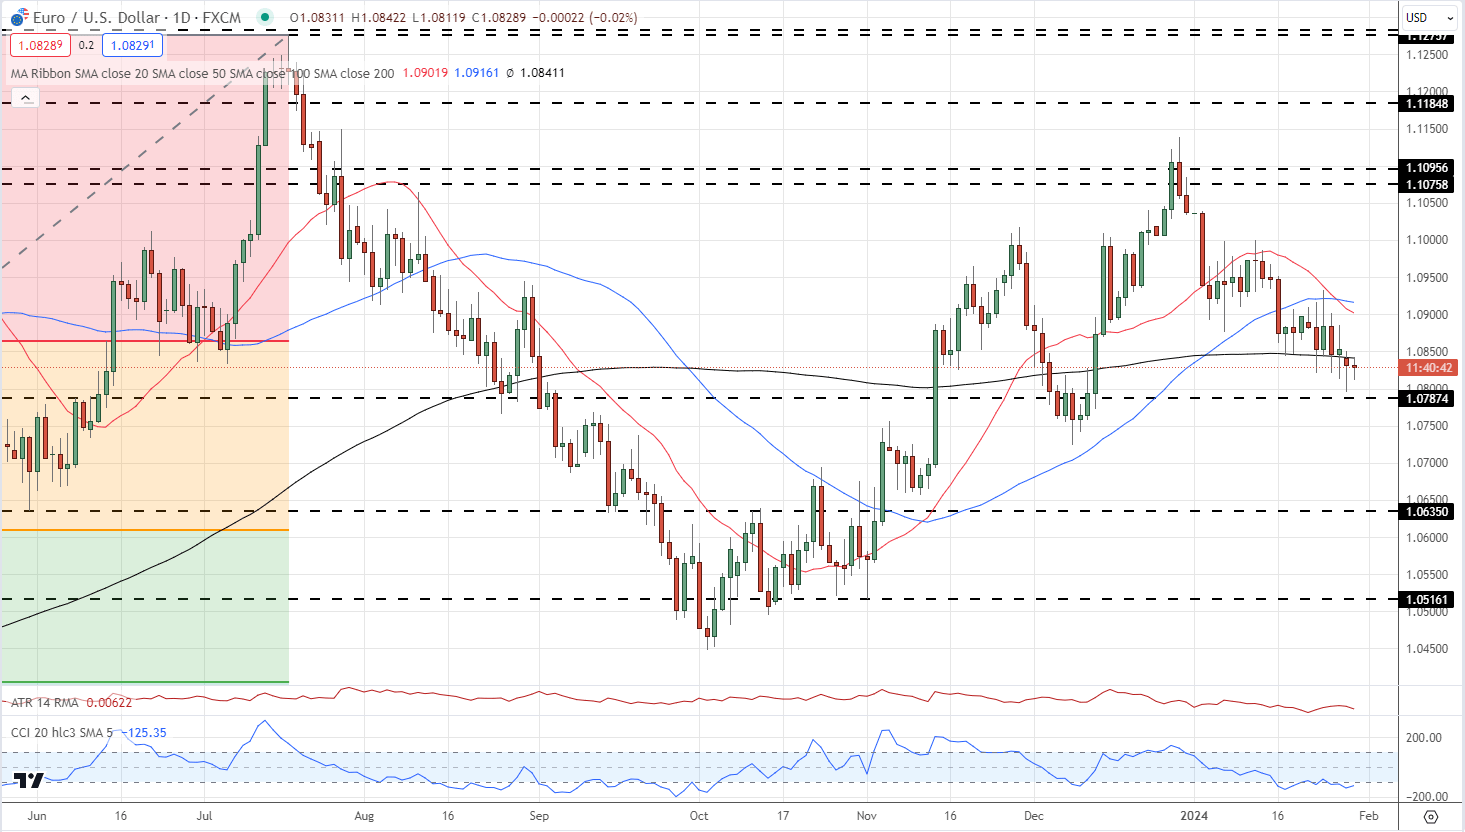
The Euro is currently trying to stabilize around the 1.0825 level after touching a low of 1.0796 on Monday. The single currency has weakened since the end of last year as expectations that the ECB may cut interest rates earlier, and by more than originally expected, weigh on the Euro. According to the latest market forecasts, there is a 75% chance that the ECB will begin its rate-cutting cycle at the April 11th meeting and will force the Deposit Facility rate down to 2.50% by the end of the year from a current level of 4%.

image3.png

Initial support for EUR/USD is seen at 1.0787 ahead of a cluster of prior lows down to 1.0724. EUR/USD is now below the 200-day simple average and if this remains the case then the above support levels are likely to be tested.

The latest Federal Reserve Monetary Policy decision will be released tomorrow and traders are hoping that Chair Powell will give at least a nod towards when the Fed will start cutting rates. Financial markets are currently pricing a 50/50 chance of a rate cut in March, while the May 1st meeting is now fully priced in.

EUR/USD Daily Chart

image4.png

Charts Using TradingView

IG retail trader data show 55.69% of traders are net-long with the ratio of traders long to short at 1.26 to 1.The number of traders net-long is 3.86% higher than yesterday and 16.12% higher than last week, while the number of traders net-short is 0.63% higher than yesterday and 16.84% lower than last week.

Oil Prices Pullback Sharply after Oil Tanker Strike, Caution Grows

Oil Prices Pullback Sharply after Oil Tanker Strike, Caution Grows

Brent Crude Oil Backs Off After Houthi Strike

Brent crude oil was making a marvelous recovery since it consolidated in the early days of 2024 but such upward momentum has not only stalled, but cut back somewhat. After breaching the $83.50 mark, UK oil trade softened, closing around $82 flat yesterday and opening this morning a tad below yesterday’s close as markets continue to tread with caution.

Prior targeted vessels in the Red Sea had not included oil or refined products, meaning the strike over the weekend marked the first of its kind, potentially altering the flow of oil through the Red Sea if other carries heed the warning.

The 200-day simple moving average is the immediate level of support currently being tested, where a further decline could test the 50 SMA around $78.70. The MACD is yet to see a flip in momentum to the downside, holding out for some stability in prices ahead of US API data and EIA storage data tomorrow.

Brent Crude Oil (UK Oil) Daily Chart

Oil prices enjoyed a spate of increases as a result of extreme weather conditions. Icy conditions befell the Dakota and Texas oil fields, adversely impacting crude output by around 1 million barrels per day (bpd) in the week ending January the 19th. Adding to the bullish wave of support for oil prices was the positive surprise in US GDP for the fourth quarter (3.3% vs 2% expected)

WTI Oil Breaches Long-Term Trend Marker to the Downside

WTI oil turned lower, passing beneath the 200 SMA and the long-term level of significance $77.40. The next level of potential support is the 50 SMA around $73.63 and $72.50. The RSI had neared overbought levels but fell short as prices turned lower but positive upside momentum remains intact for now.

Major economic news and data awaits as this week the Fed provide an update on monetary policy and US jobs data trickles in until NFP on Friday.


What is Crude Oil? A Trader’s Primer to Oil Trading

What is Crude Oil? A Trader’s Primer to Oil Trading

WHAT IS CRUDE OIL AND WHAT IS IT USED FOR?

Crude oil, or petroleum, is a naturally-occurring fossil fuel and currently the world’s primary energy source. It is made from ancient organic matter and can be distilled into component fuels such as gasoline, diesel, and lubricants, each of which have a multitude of industrial applications.

The commodity is usually extracted from underground reservoirs through drilling, and the countries that produce the greatest volume of crude oil, as of 2019, are the USA, Russia, and Saudi Arabia.

To understand how crude oil relates to other energy resources and assets, as well as how to trade them, visit our Major Commodities page.

BRENT AND WTI CRUDE OIL EXPLAINED

The composition of crude oil varies by source, but two types are used to benchmark global prices. They are the United States’ West Texas Intermediate (WTI) and United Kingdom’s Brent crude. The differences between them are based on factors such as composition, extraction location and prices, but for more details, as well as how to trade each asset, see our WTI vs Brent comparison.

POWER PLAYERS IN THE CRUDE OIL MARKET

The Organization for Petroleum Exporting Countries (OPEC) was established in 1960. This body sets production quotas for its members, with the aim of reducing competition and keeping prices at profitable levels. OPEC is dominated by Kuwait, Qatar, Saudi Arabia (which controls the Strait of Hormuz), and the United Arab Emirates. While OPEC generally controls a large percentage of the oil supply, the US, as of 2019, is the world’s largest producer of oil.

Institutions that supply oil to the global market are made up of international oil companies, or IOCs, such as ExxonMobil, BP and Royal Dutch Shell. These are investor-owned and look to increase shareholder value through private interests. However, national oil companies, or NOCs, such as Saudi Aramco and Gazprom, are fully or majority-owned by a national government.

HISTORY OF CRUDE OIL

The history of crude oil has seen many changes since the beginning of the century, when global supply was largely controlled by OPEC, but demand was driven by the US. With OPEC calling the shots and Asian demand rising rapidly, prices went from a cost per barrel of $25 for Brent and $27 for WTI in March 2001, to $140 for both types by June 2008, representing a price bubble.

However, the last decade has seen technological advancements and deregulation facilitate increased US shale oil production, leading to shift in power from OPEC to the US. Prices fell from $112 for Brent and $105 for WTI in June 2014, to under $36 for both by January 2016. OPEC responded by colluding with several countries – including Russia – to implement ‘production quotas’ designed to stabilize prices. These brought the cost per barrel back above $70 for Brent, and $65 for WTI, by April 2018.

The below chart shows some key landmarks in the price of US Crude this century and the reasons for the swings.

WTI CRUDE OIL (2000-2019)

WHAT AFFECTS CRUDE OIL PRICES?

Crude oil prices are affected mostly by supply and demand, which in turn are influenced by factors such as outages, OPEC production cuts, seasonality, and changing consumption patterns. For more on these and why they are essential fundamental factors to understand when trading the asset, see our guide to trading crude oil.

USD AND THE PRICE OF OIL

The US Dollar and oil have historically had an inverse relationship. When USD is weak, the price of oil has traditionally been higher in dollar terms. Since the US was for long periods a net importer of oil, rising oil price has meant the US trade balance deficit has risen since more dollars are required to be sent abroad. However, some believe this relationship follows less reliable patterns in modern times.

There is a more predictable link between the Canadian Dollar and oil prices. For example, as of 2019, Canada exports some three million barrels of oil and petroleum products per day to the US, meaning a huge demand for Canadian dollars is created. If US demand rises, more oil is needed, which often means oil prices rise, and could accordingly mean a fall in USD/CAD. Conversely, if US demand falls, oil prices may fall too, meaning demand for CAD drops in turn.

Reasons to Trade Crude Oil

Oil is a dynamic, volatile and liquid market – and stands as the most traded commodity in the world. Here’s more on the benefits of engaging with this asset.

  1. The volatile nature of trading this asset makes it a favorite of swing and day traders, who react to the latest oil pricing news. While the trading can be risky, some see the oil market as an opportunity in its purest form.
  2. Crude oil is a liquid market, traded in huge volume. This means trades can be opened and closed at the price points you want and at lower trading cost.
  3. Oil can be traded as part of a hedging strategy to mitigate against the effects of the asset’s volatility.
  4. Trading oil can be part of a diversified portfolio of commodities, stocks and bonds.

HOW TO GET STARTED TRADING CRUDE OIL

We offer an in-depth guide to trading crude oil and publish daily news and analysis articles reviewing the latest crude oil prices, among other assets. You can also download our free quarterly oil forecasts which will equip you with the knowledge to make informed decisions in the oil market.

A Guide to Floor-Trader Pivots

A Guide to Floor-Trader Pivots

What’s on this page
Floor-Trader Pivots assist traders in identifying areas in a chart where price is likely to approach and can be used to set appropriate targets, while effectively managing risk. It is one of many types of pivot points traders can use to determine key levels, but the concept of support and resistance is well entrenched in all of them.

What are floor trader pivots?

Floor-Trader Pivots, also known as ‘Classical Pivots’, denote areas on a chart where future price is likely to encounter support or resistance. The pivot points are calculated according to a specific formula that takes into account past price data; and projects three levels of support and resistance based around the ‘pivot’ itself.

Floor tradingThe name ‘Floor-Trader Pivots’ comes from a time before online trading where ‘floor trader’s’ needed an easy formula to determine whether a price was relatively cheap or expensive before shouting bids and offers across the room.

Modern day traders looking to emulate the floor traders can do so with ease as most charting packages have pivot points included in the selection of indicators.

How to calculate floor trader pivots

The default time frames include daily, weekly or monthly pivot points and they can be calculated as follows:

The Pivot: (Previous high + previous low + previous close) / 3

Pivot location relative to price Direction bias
Price above pivot Bullish bias
Price below pivot Bearish bias

R1: (Current pivot Value X 2) – Previous Low

R2: Current pivot + (R1 – S1)

R3: Current pivot – (R2 – S2)

S1: (Current pivot value X 2) – Previous High

S2: Current pivot value – (R1 – S1)

S3: Current pivot value – (R2 – S2)

Many traders scour the internet searching for Floor-Trader Pivot calculators to calculate the values for each market of interest. DailyFX removes this hassle with our dedicated page on pivot points; outlining R1, R2, R3, pivot, S1, S2, S3 for all top markets. The page can be tailored to show hourly, daily, weekly and monthly data and can be applied to Classical, Camarilla and Woodie Pivots.

Using Floor-Trader Pivots: Top Tips

1. Filter trades in the direction of the trend

In well-established downtrends, there are more pips to benefit from in the direction of the trend as opposed to pips on offer against the trend. Traders can use the support and resistance points to look for breakout trades in the direction of the trend. The concept is simple, although the chart can be somewhat cluttered.

As you can see in the chart below (highlighted in blue), the S1 and S2 bands act as resistance points in the current downtrend. Forex traders will look to place entry orders a few pips below these levels to capture further downside movements in price.

NZD/USD daily chart

pivot point breakout2. Floor-Trader Pivots present attractive entries

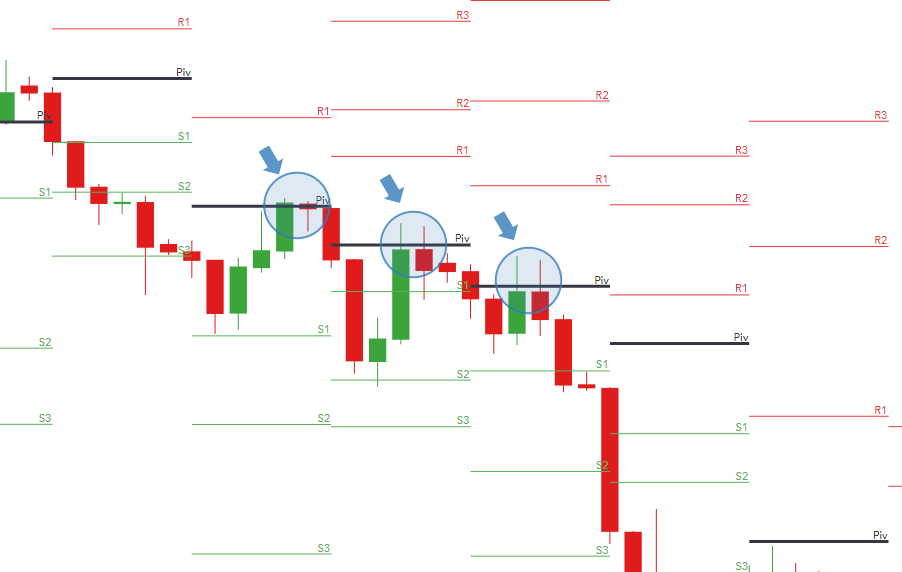
Classical pivots can present attractive entries when trading in the direction of the trend. The chart below zooms into an existing downtrend, showing how price retraces up towards the pivot before continuing down. Traders can set working orders at these levels or simply enter short after price has reached the pivot and moved back down.

GBP/USD daily chart

Using floor-trader pivots for suitable entries3. Using Floor-Trader Pivots as dynamic support and resistance

Traders can use the levels of support provided by the Floor-Trader Pivots as dynamic support or dynamic stops.

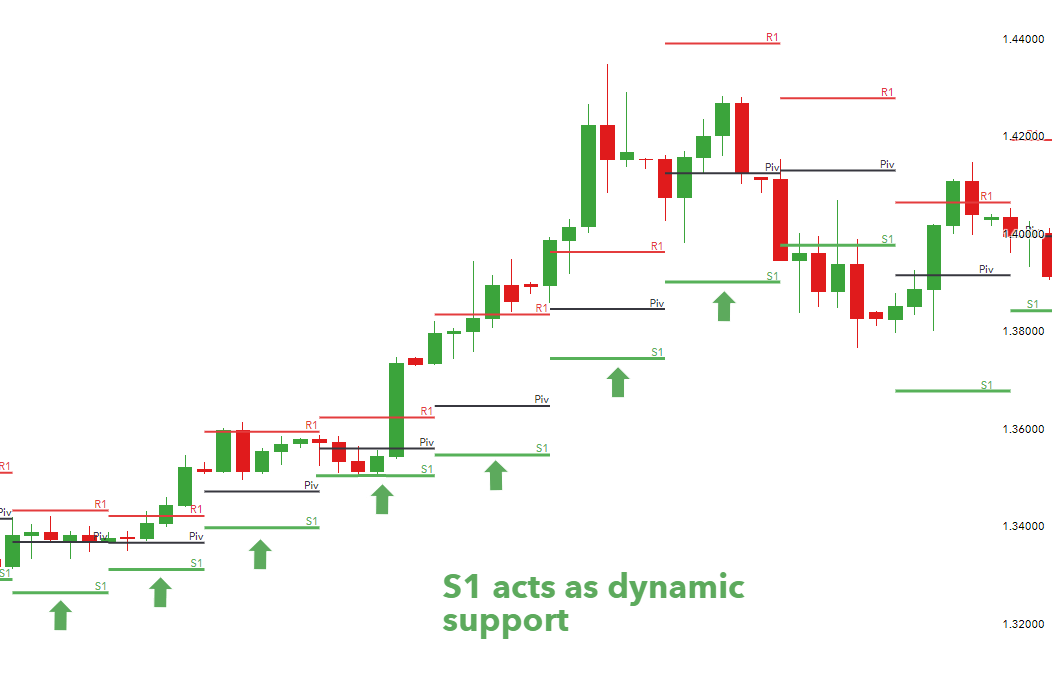
This becomes clear when observing the below GBP/USD chart below. As price moves up, the S1 level moves up too and traders can trail their stops in line with this level to lock in profits if the market reverses. Tighter stops will trail the S1 in an uptrend and stops placed at the S2 and S3 can be used in more volatile markets provided a smaller trade size is utilized.

S1 acting as dynamic support

The Week Ahead: China, the Fed, and the Bank of England in Focus

The Week Ahead: China, the Fed, and the Bank of England in Focus

The US Dollar

On Monday, the Dallas Fed Manufacturing Index will garner investor interest. Recent US economic indicators, including private sector PMI and Q4 GDP numbers, raised expectations of a soft landing. A larger-than-expected decline could impact buyer demand for the US dollar.

However, consumer confidence and JOLTs Job Openings will likely have more influence on Tuesday. Strong consumer confidence and an upward trend in job openings could reduce bets on a March Fed rate cut.

On Wednesday, ADP employment figures for January warrant investor interest ahead of the Fed interest rate decision. The US labor market remains a focal point for the Fed. Tight labor market conditions support wage growth and disposable income. Upward disposable income trends fuel consumer spending and demand-driven inflation.

However, the Fed interest rate decision, Rate Statement, and Press Conference will be the main event. Economists expect the Fed to leave interest rates at 5.50%, putting the focus on the Rate Statement and Press Conference.

On Thursday, US jobless claims, nonfarm productivity, and unit labor costs need consideration. Softer labor market conditions could influence bets on a March Fed rate cut. Other stats include ISM Manufacturing PMI numbers. However, barring a slump in manufacturing sector activity, the numbers will likely play second fiddle to the labor market data.

On Friday, the US Jobs Report will wrap up a busy week for the US dollar. Wage growth, nonfarm payrolls, and the US unemployment rate will influence bets on a March Fed rate cut.

Other stats include finalized Michigan Consumer Sentiment numbers for January. Revisions to preliminary numbers and inflation expectation numbers also need consideration.

The EUR

On Tuesday, French, German, and Eurozone GDP numbers for Q4 will influence buyer appetite for the EUR/USD. An increasing threat of a Eurozone economic recession could influence the timing of ECB discussions about rate cuts.

On Wednesday, the German economy will be in the spotlight. German retail sales, unemployment, and inflation numbers warrant investor attention. A deteriorating macroeconomic environment could drag the Eurozone into a recession.

However, preliminary inflation numbers from Germany and France may influence the ECB rate path more.

Manufacturing PMI numbers from Italy, France, Germany, and the Eurozone will be in focus on Thursday. However, preliminary Eurozone inflation figures for January will be the focal point for investors.

Beyond the numbers, ECB commentary also needs monitoring. ECB Chief Economist Philip Lane (Tues/Thurs), Vice President Luis de Guindos (Mon), and Executive Board member Anneli Tuominen (Tues) are on the calendar to speak.

The Pound

On Wednesday, the Pound will be in the hands of the UK housing market. A larger-than-expected fall in UK house prices could impact consumer confidence, spending, and inflation trends.

However, the Bank of England interest rate decision is the main event. Economists expect the BoE to leave interest rates at 5.25% on Thursday. A hold on interest rates would put the focus on the MPC Meeting Minutes and BoE Governor Andrew Bailey.

Governor Bailey will speak later in the Thursday session. In December, two MPC members voted for a rate hike. A hawkish BoE would drive buyer demand for the Pound.

On Friday, BoE Chief Economist Huw Pill will close out a busy week for the Pound.

Other stats include finalized Manufacturing PMI numbers for January (Thurs). However, the markets will likely brush aside the numbers, with the BoE in the spotlight.

The Loonie

On Wednesday, GDP numbers for November will provide direction to the Loonie. A pickup in economic activity could delay Bank of Canada plans to cut interest rates.

Last week, the Bank of Canada left interest rates at 5.25%.

The Australian Dollar

On Tuesday, finalized retail sales figures for December will influence buyer appetite for the Aussie dollar. An upward revision to preliminary numbers could influence bets on an RBA rate hike in February.

However, Q4 inflation figures (Wed) will be the focal point for the RBA and the markets. Hotter-than-expected inflation figures could cement an RBA rate hike.

On Friday, producer price figures for Q4 also need consideration. Economists consider producer prices a leading indicator of consumer price inflation.

From elsewhere, private sector PMIs from China and stimulus chatter from Beijing warrant investor attention.

The Kiwi Dollar

The Kiwi dollar will be in the hands of private sector PMI numbers from China. A pickup in private sector activity would be a boon for the New Zealand economy and the Kiwi dollar.

NBS Private sector PMIs (Wed) and the all-important Caixin Manufacturing PMI (Thurs) will move the dial.

There are no economic indicators from New Zealand to consider.

The Japanese Yen

On Wednesday, industrial production numbers for December will put the Japanese Yen in the focus. A pickup in industrial production could support bets on a Bank of Japan pivot from negative rates.

The BoJ recently raised concerns about the macroeconomic environment, delaying discussions about exiting negative rates.

Beyond the numbers, investors must track BoJ chatter throughout the week.

Out of China

On Wednesday, NBS Manufacturing and Non-Manufacturing PMIs for January warrant investor attention. A pickup in private sector activity would drive buyer demand for riskier assets.

However, the Caixin Manufacturing PMI (Thurs) will likely have more impact. An unexpected contraction would pressure Beijing to deliver more stimulus measures to bolster the economy.

EUR/USD and GBP/USD Price Forecast: Dollar Index Steady Near 103.125, Is it Calm Before the Storm?

EUR/USD and GBP/USD Price Forecast: Dollar Index Steady Near 103.125, Is it Calm Before the Storm?

Global Markets Brace for Upcoming Economic Data

With Monday presenting a light schedule in terms of economic events, the Dollar Index remains steady ahead of key events including the Fed’s monetary policy, the FOMC, and the US Non-Farm Payrolls (NFP). This stability can be seen as the calm before a potentially volatile storm ahead in the currency markets.

The past week saw pivotal economic data releases shaping market sentiment. In the US, the Core PCE Price Index remained stable at 0.2%, aligning with projections, while Pending Home Sales surged to 8.3%, far exceeding expectations. The Federal Funds Rate was maintained at 5.50%, as confirmed by the latest FOMC statement and press conference.

In Europe, economic indicators painted a mixed picture. Germany’s GfK Consumer Climate deteriorated more than expected, reflecting ongoing economic challenges. The Spanish Unemployment Rate held steady at 11.8%, while the Eurozone saw modest changes in M3 Money Supply and Private Loans. Notably, the Bundesbank reported a weaker than anticipated German economy, signaling potential delays in recovery.

Events Ahead

Looking ahead, the market focus shifts to the USD Loan Officer Survey, though it’s not deemed significant. Key attention is on the US economic data releases on Friday, including Average Hourly Earnings, Non-Farm Employment Change, and Unemployment Rate.

Simultaneously, the GBP market will react to the Bank of England’s Monetary Policy Report and Rate Votes on Thursday, setting the stage for potential shifts in GBP/USD trends. These events collectively prepare traders for a week of strategic decision-making, influenced by these critical economic indicators.

US Dollar Index (DXY)

Dollar Index
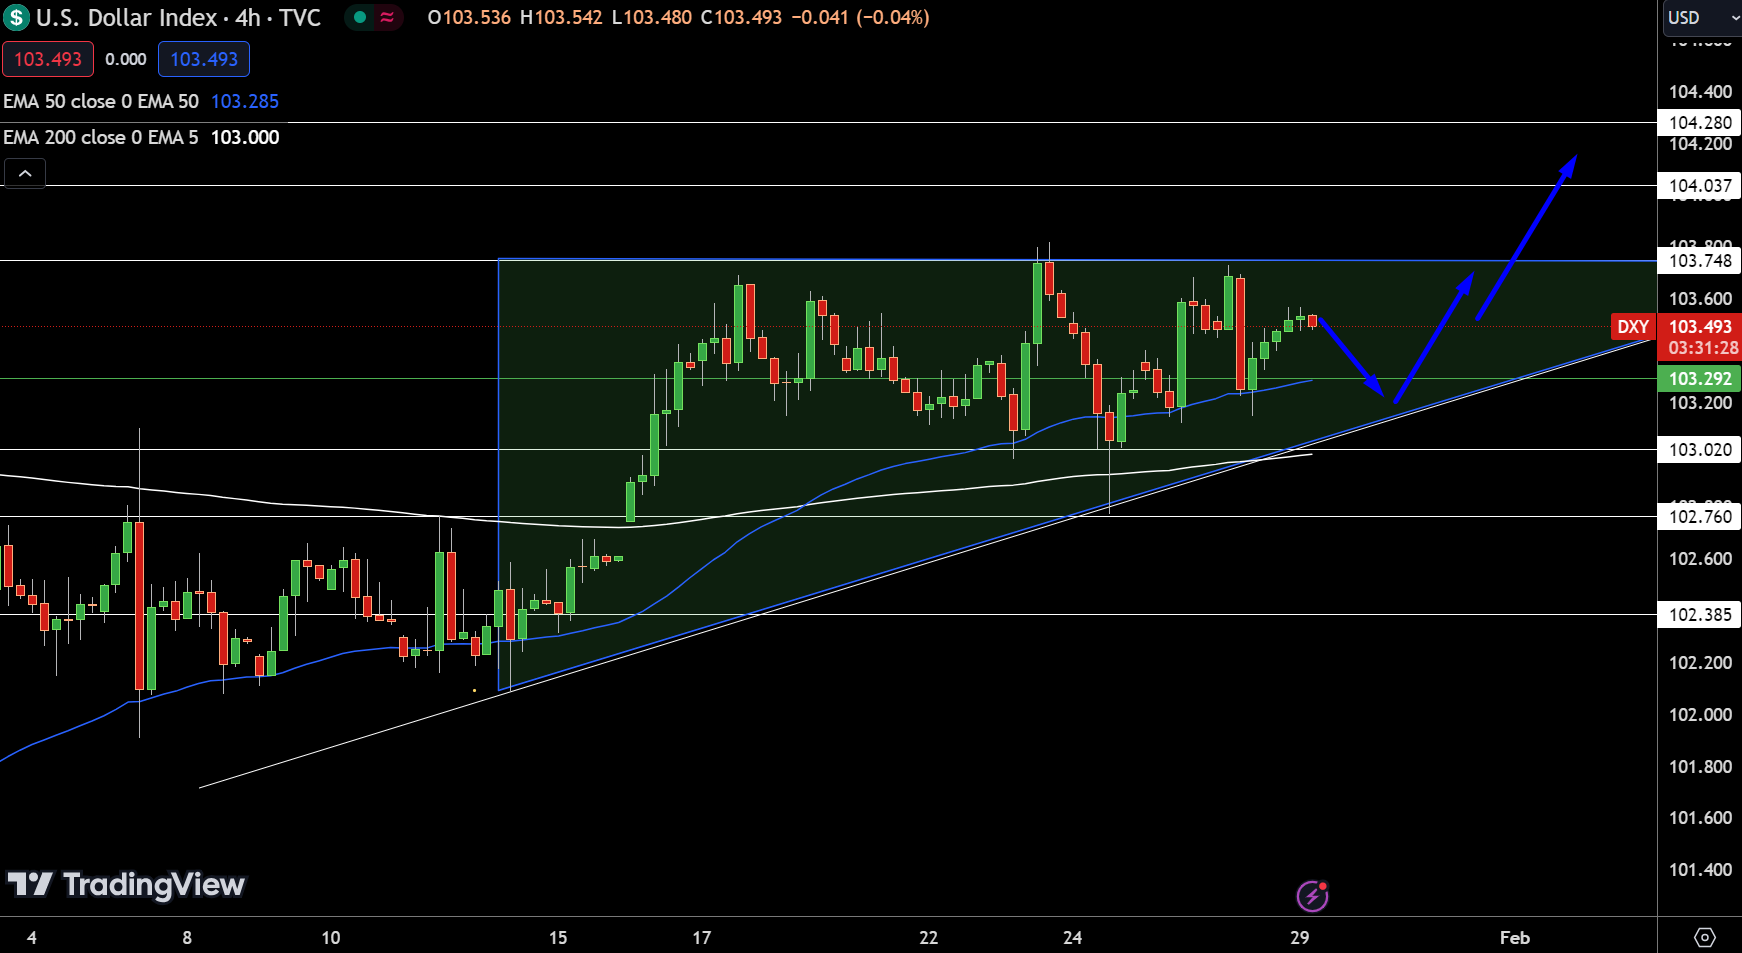
Dollar IndexAs of January 29, the Dollar Index slightly declines to 103.124, a 0.01% drop. Key resistance levels are at 103.748, 104.037, and 104.280, while support lies at 103.020, 102.760, and 102.385. The 50-day and 200-day EMAs are at 103.285 and 103.000, respectively. An ascending triangle pattern suggests a bullish bias, with potential for a breakout above the 103.292 pivot point, though slight bearish corrections may occur.

EUR/USD Technical Forecast

EUR/USD Price Chart - Source: Tradingview
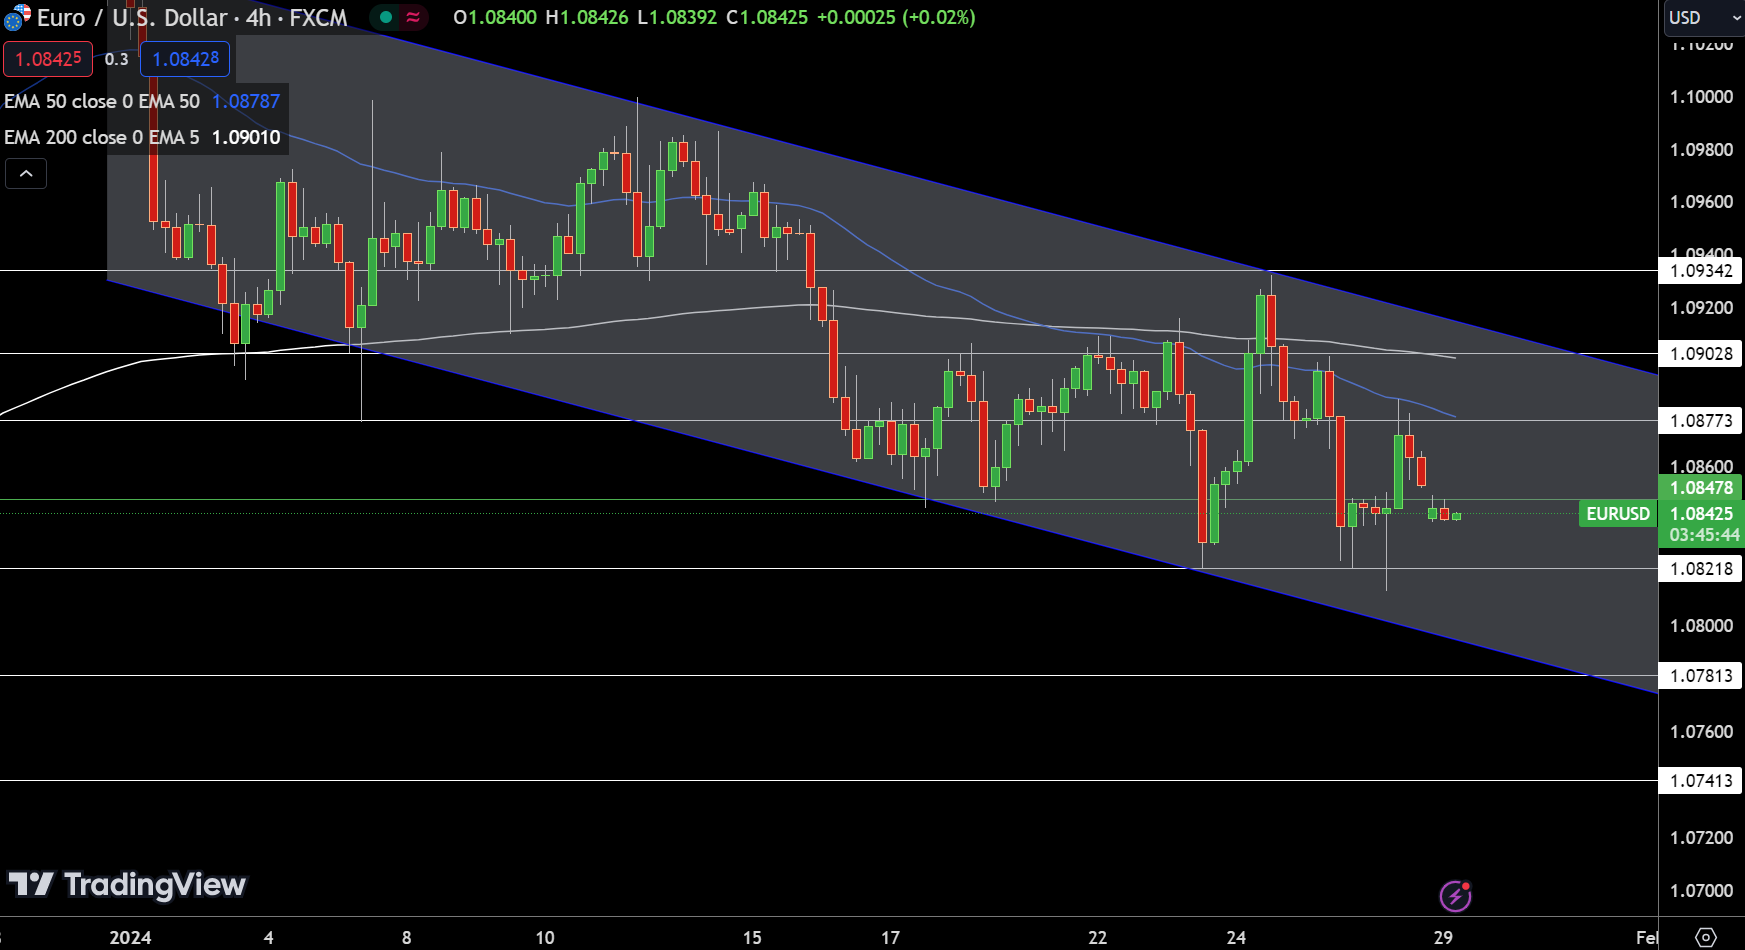
The EUR/USD pair, as of January 29, is exhibiting a subtle downtrend, currently priced at $1.08448, marking a decrease of 0.09%. On the 4-hour chart, the pivot point sits at $1.08478, serving as a critical junction for the currency pair. Resistance levels are identified at $1.08773, $1.09028, and $1.09342, which could hinder any bullish progression. Conversely, support levels at $1.08218, $1.07813, and $1.07413 provide potential areas for a rebound.Technical indicators suggest a bearish sentiment below the pivot point. The 50-day and 200-day Exponential Moving Averages (EMAs) are positioned at $1.08787 and $1.09010, respectively, reinforcing the resistance levels.

The current chart pattern shows a downward channel, indicating a bearish trend. However, there’s a notable consolidation around the $1.08425 area, as the market seems to be in a holding pattern, awaiting substantial fundamental developments expected later in the week.

GBP/USD Technical Forecast

GBP/USD Price Chart - Source: Tradingview
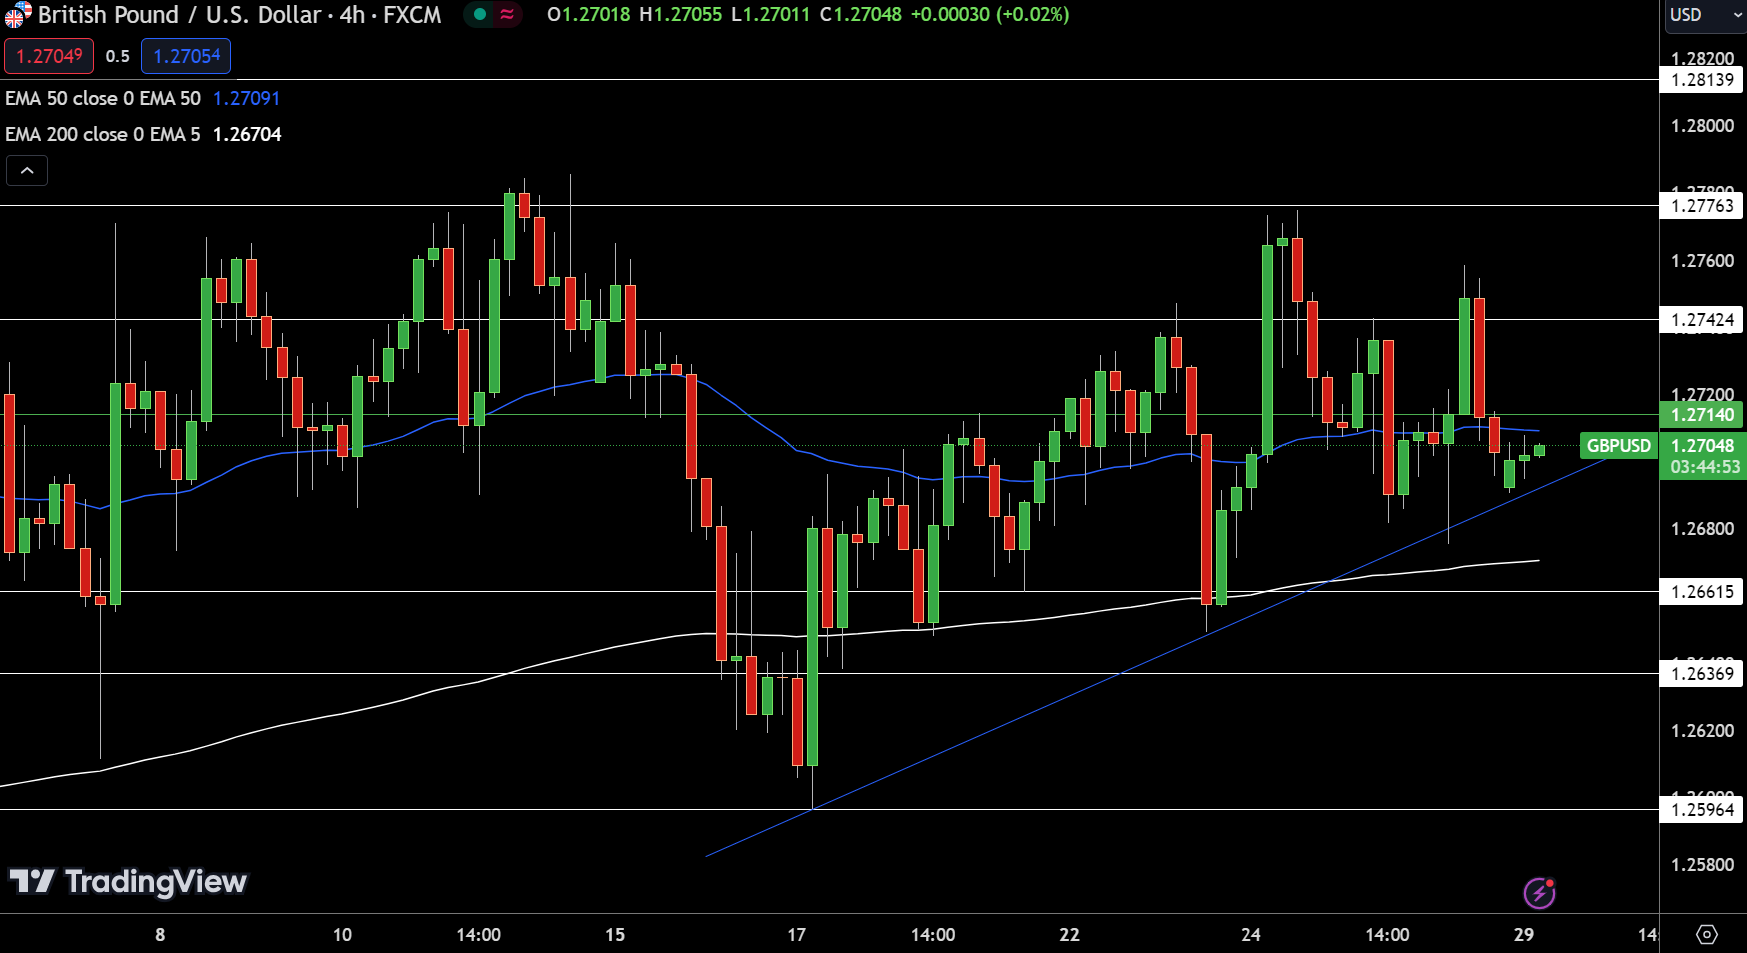
As of January 29, the GBP/USD pair exhibits a modest upward movement, currently trading at $1.27062, marking a slight increase of 0.03%. The 4-hour chart analysis reveals a pivot point at $1.27140, critical in determining the pair’s immediate direction. Above this level, the pair faces resistance at $1.27424, $1.27763, and $1.28139. These points could act as barriers to further upward movement.Conversely, support levels are observed at $1.26615, $1.26369, and $1.25964, where the Pound may find a footing to counter potential declines. The 50-day Exponential Moving Average (EMA) stands at $1.27091, closely aligning with the current trading price, while the 200-day EMA is positioned at $1.26704, offering additional support. The presence of an upward trendline suggests support for Sterling around the $1.2700 area, indicating a potential bullish stance.

In conclusion, the GBP/USD pair’s trend appears bullish above the pivot point of $1.27140.

Hang Seng Index, ASX 200, Nikkei 225: China Stimulus and the Bank of Japan

Hang Seng Index, ASX 200, Nikkei 225: China Stimulus and the Bank of Japan

On Friday, the Hang Seng Index ended a three-day winning streak, with the Nikkei joining the Hang Seng Index in negative territory. The Australian markets were closed for Australia Day.

Overnight US economic indicators and corporate earnings from Thursday influenced the investor appetite for riskier assets.

US Q4 GDP beat forecast, raising expectations of a soft landing. The economy grew by 3.3% in Q4 after expanding by 4.9% in the previous quarter. US initial jobless claims increased from 189k to 214k in the week ending January 20.

On Thursday, the Nasdaq Composite Index gained 0.18%. The Dow and S&P 500 rose by 0.64% and 0.53%, respectively.

However, Intel Corp. (INTC) released earnings results after the US market close. The outlook for Q1 2024 disappointed, sending the stock price into an after-hours tailspin. Investors also responded to Tesla Inc. (TSLA) earnings results from Wednesday. Tesla ended the Thursday session down 12.13%.

The Asian economic calendar influenced investor risk sentiment.

On Friday, Tokyo inflation softened by more than expected. The annual inflation rate eased from 2.4% to 1.6%, with core inflation down from 2.1% to 1.6%.

US Economy, Corporate Earnings, and China in Focus

On Monday, US economic indicators and corporate earnings from Friday will set the tone for the Asian session. US inflation softened in December, supporting bets on a March Fed rate cut.

The Core PCE Price Index increased by 2.9% year-over-year vs. 3.2% in November. Personal income and spending supported expectations of a soft landing. Personal spending and income increased by 0.7% and 0.3% month-on-month, respectively.

On Friday, the Dow gained 0.16%, while the Nasdaq Composite Index and S&P 500 declined by 0.36% and 0.07%, respectively. Intel Corp. slid by 11.91%.

There are no Asian economic indicators to influence the market trends on Monday. However, investors must consider tensions in the Middle East, Bank of Japan commentary, and stimulus chatter from Beijing.

On Monday, the futures sent mixed signals. The ASX 200 was down 9 points while the Nikkei was up 230 points.

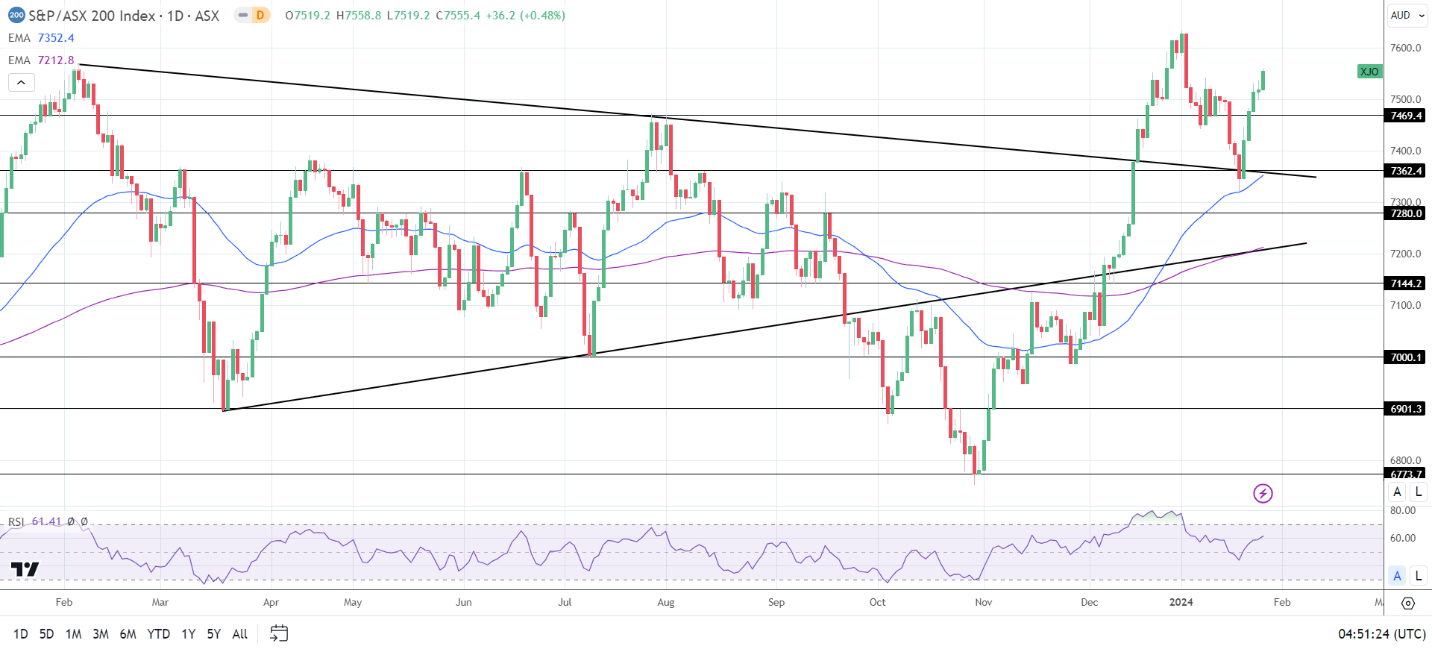
ASX 200

ASX 200 was closed for trading on Friday.
ASX200 290124 Daily ChartThe Australian markets were closed on Friday for Australia Day.

Hang Seng Index

Hang Seng Index hit reverse on Friday.
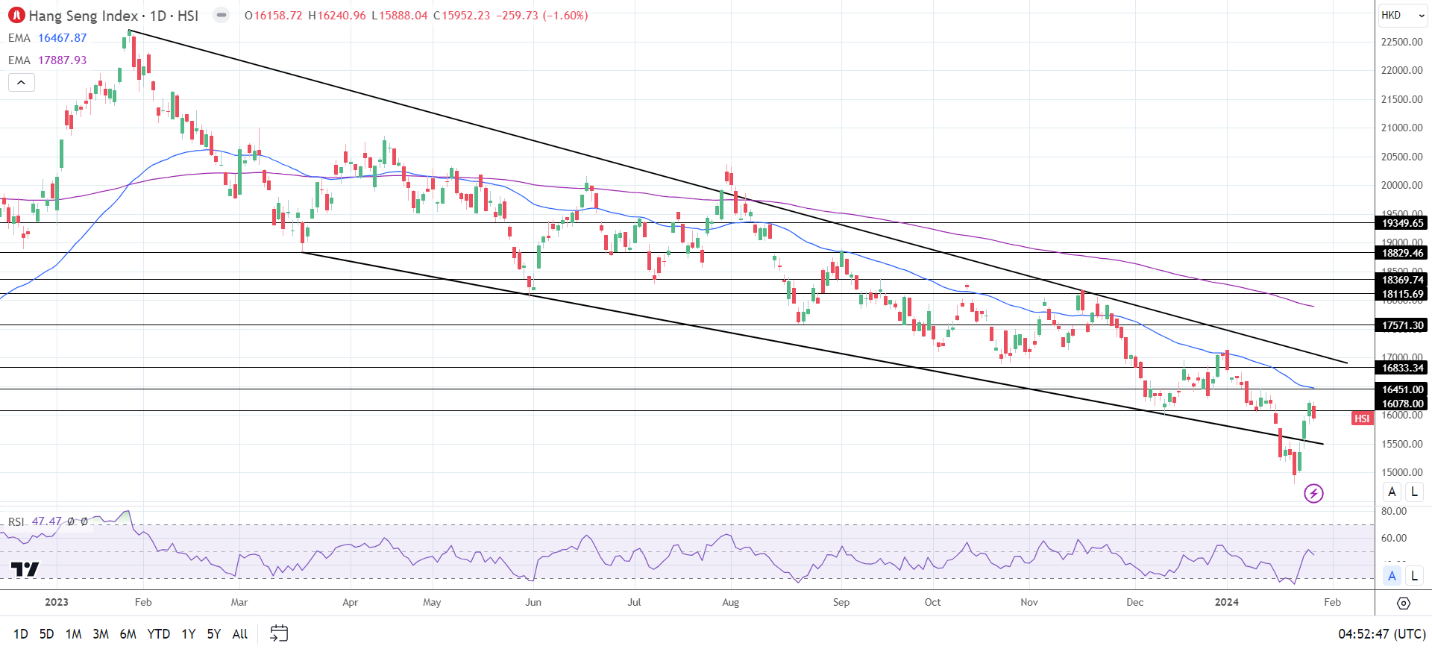
HSI 290124 Daily ChartThe Hang Seng Index slid by 1.60% on Friday. Uncertainty about stimulus measures from Beijing contributed to the losses.

Tech and real estate stocks pressured the Hang Seng Index. The Hang Seng Mainland Properties Index (HSMPI) and the Hang Seng Tech Index (HSTECH) ended the session down 1.18% and 3.75%, respectively.

Alibaba (9988) and Tencent (0700) slid by 3.34% and 2.75%, respectively.

However, bank stocks had a mixed session. HSBC (0005) gained 0.50%, while China Construction Bank (0939) ended the session flat. Industrial Commercial Bank (1398) declined by 0.26%.

The Nikkei 225

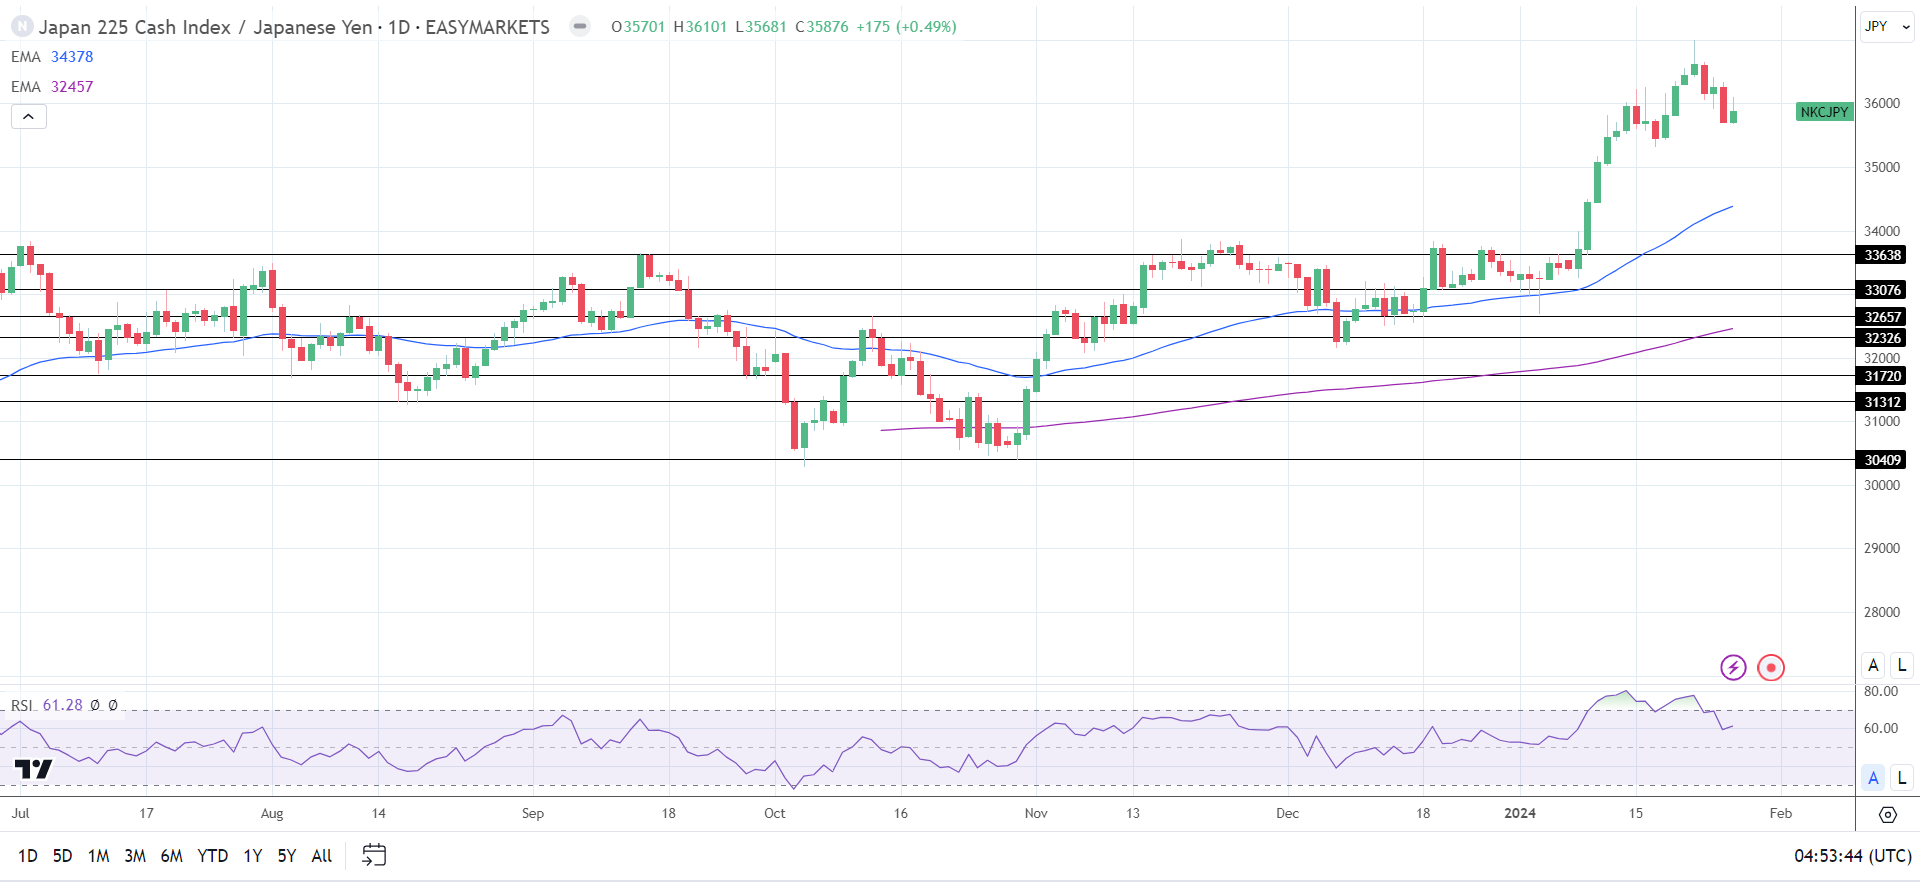
Nikkei ended the Friday session in negative territory.