XRP News: Court Rulings, Case Law, and SEC Plans to Appeal

XRP News: Court Rulings, Case Law, and SEC Plans to Appeal

The Sunday Overview

On Sunday, XRP fell by 1.26%. After a 0.19% loss on Saturday, XRP ended the session at $0.5241.

SEC v Ripple: Case Law Favors Ripple

There were no SEC v Ripple case-related updates on Sunday. However, the SEC and Ripple are progressing through remedies-related discovery. Following this phase, the SEC will submit a remedy-related brief on March 13, advocating for a punitive penalty. Ripple’s deadline for filing its remedy-related brief is April 12, and the SEC must respond by April 19.

Judge Analisa Torres could rule on the SEC Motion to Compel this week. Ripple opposed the motion to obtain 2022/23 financial statements and post-complaint contracts governing XRP sales to institutional investors.

The SEC will likely want to ascertain if Ripple continued breaking Section 5 of the 1933 Securities Act after the July 13, 2023, court ruling. Judge Torres ruled that Ripple broke Section 5 of the 1933 Securities Act for failing to register XRP as a security when sold to institutional investors.

If Judge Torres denies the Motion to Compel, the SEC may return its attention to pre-complaint facts. However, case law favors a less punitive penalty for breaking securities laws.

The SEC will push for a punitive penalty, but Ripple could cite three cases to argue against a punitive disgorgement.

In Morrison v NAB, the US Supreme Court ruled the SEC only has jurisdiction over US-based sales. Pre-complaint proceeds from XRP sales to institutional investors totaled $770 million. However, Ripple will show total sales to US institutional investors that could significantly lower the target number.

In Liu v SEC, the court ruled a disgorgement award cannot exceed the net profits of the wrongdoer. The court ruling allows Ripple to show expenses relating to XRP sales to US institutional investors and net profit.

The court would consider a penalty based on the net profit of XRP sales to US institutional investors.

Finally, in SEC v Govil, the court ruled that the SEC cannot ask for a punitive disgorgement without demonstrating investors suffered financial losses. Ripple could demonstrate the value of XRP at the time of each sale to a US institutional investor and whether any investors suffered financial loss.

Although case law may favor Ripple, the SEC’s intention to appeal the Programmatic Sales ruling is an XRP headwind. In July 2023, Judge Torres ruled that programmatic sales of XRP failed to meet the third prong of the Howey Test.

XRP Price Action
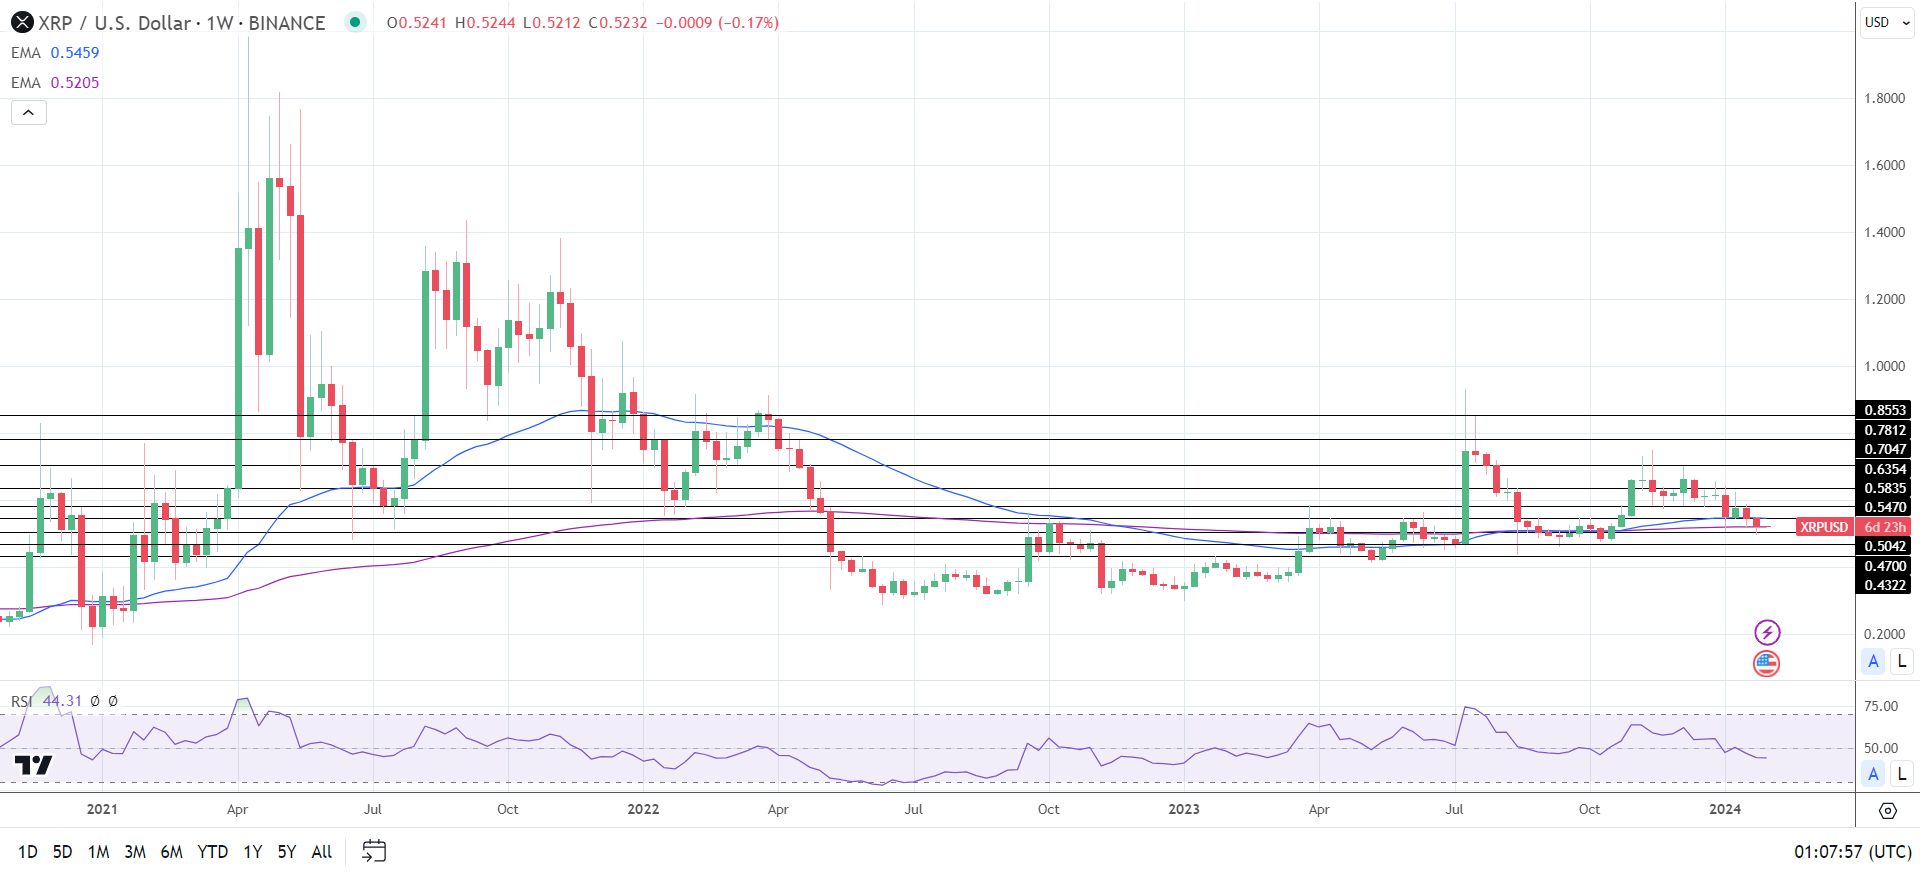
Weekly Chart sends bearish price signals.

XRPUSD 290124 Weekly Chart

Daily Chart

XRP sat below the 50-day and 200-day EMAs, sending bearish price signals.

An XRP break above the $0.5470 resistance level would support a move to the 200-day and 50-day EMAs.

SEC v Ripple case-related updates need consideration.

However, a drop below the $0.5042 support level would give the bears a run at the $0.4700 support level.

The 14-day RSI reading, 36.15, suggests an XRP break below the $0.5042 support level before entering oversold territory.
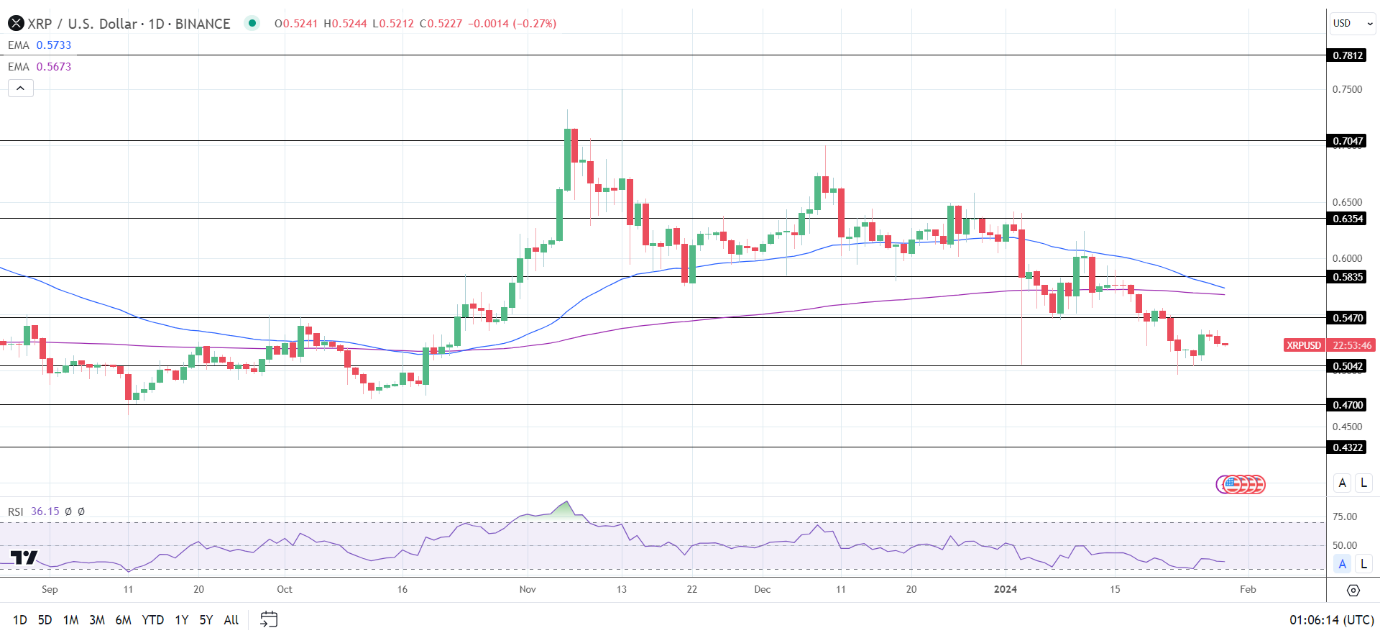
XRP Daily Chart affirms bearish price signals.

XRPUSD 290124 Daily Chart

4-Hourly Chart

On the 4-hourly, XRP remained below the 50-day and 200-day EMAs. The EMAs reaffirmed the bearish price signals.

If XRP breaks above the 50-day EMA, it could test the $0.5470 resistance level. Conversely, a drop below the $0.52 mark might lead to bears targeting the $0.5042 support level.

The 4-hourly RSI, with a reading of 45.23, indicates an XRP fall to the $0.5042 support level before entering oversold territory.
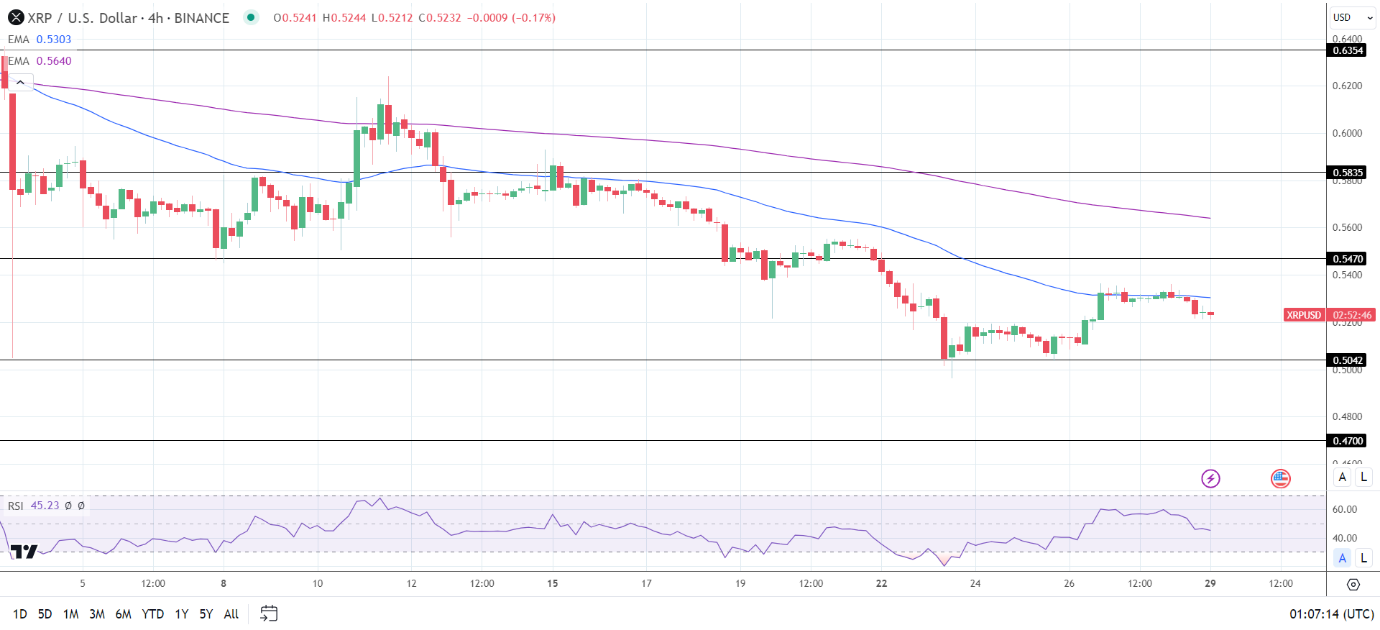

XRP 4-Hourly Chart reaffirms bearish price signals.
Euro (EUR/USD) Weekly Outlook: Important GDP, Jobs and Inflation Data on the Docket Next Week

Euro (EUR/USD) Weekly Outlook: Important GDP, Jobs and Inflation Data on the Docket Next Week

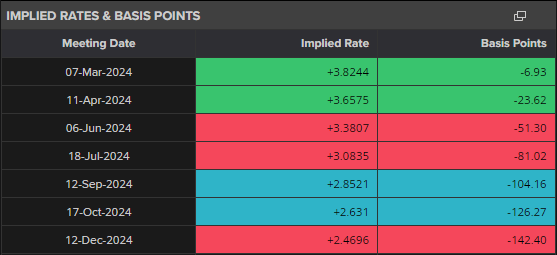
Thursday’s uneventful ECB meeting left traders with little to go on as President Christine Lagarde held the central bank line saying any upcoming moves in monetary policy remain data dependent. Going into the meeting the official talk was that rates may come down at the end of H1, data-dependent, but the market sees a more aggressive timetable with current pricing showing a rough 75% probability of the first 25 basis point cut being announced at the April 11th meeting. The ECB will likely push back against this market forecast, as the Fed has done over the last few weeks so that they can control the narrative and rein back market expectations if needed.

ECB Implied Rates and Basis Points

image1.png

The upcoming week is full of high-importance EU and German economic data that will help steer the Euro in the weeks ahead. The first look at Q4 GDP in Germany and the Euro Area is set to show the two economies contracting further, while January inflation is set to fall further. With price pressures seemingly on their way to the central bank’s target, the ECB will need to cut rates soon the economy falling into a technical recession.

In addition, the latest FOMC and BoE policy decisions, and next Friday’s US Jobs Report will add a dose of volatility to both EUR/USD and EUR/GBP.

image2.png

After touching a 1.0932 high on Wednesday, EUR/USD has slipped back below 1.0900 after markets changed their view on the path of ECB rate cuts. The 200-day simple moving average is currently propping up the pair but a confirmed break below this indicator will leave a cluster of recent lows on with side of 1.0750 as the next target.

EUR/USD Daily Chart

image3.png

IG retail trader data show 58.93% of traders are net-long with the ratio of traders long to short at 1.43 to 1.The number of traders net long is 22.58% higher than yesterday and 17.36% higher than last week, while the number of traders net short is 15.04% lower than yesterday and 15.65% lower than last week.

Gold Price Forecast: Fed Decision to Guide Trend, Critical Levels For XAU/USD

Gold Price Forecast: Fed Decision to Guide Trend, Critical Levels For XAU/USD

Gold has displayed limited volatility in recent trading sessions and hasn’t really gone anywhere for the past two weeks or so, with prices moving up and down with no discernable trend. Things, however, could change in the coming days, courtesy of a high-impact event on the U.S. economic calendar: the Federal Reserve decision on Wednesday.

In terms of expectations, the U.S. central bank is seen holding borrowing costs unchanged but could drop its tightening bias from the post-meeting policy statement.

While strong economic growth, as reflected in the latest GDP report, argues in favor of policymakers retaining a hawkish tilt, progress on disinflation makes the case to start laying the groundwork for a shift toward an easing stance. It is for this reason that a dovish outcome should not be entirely ruled out.

Eager to gain insights into gold’s future path? Discover the answers in our complimentary quarterly trading guide. Request a copy now!

In the event of Chair Powell embracing a softer position and signaling that deliberations on the broad parameters for rate cuts are well-advanced and have progressed further compared to the previous meeting, traders should prepare for the possibility of a sharp pullback in bond yields. This should support gold prices.

The opposite is also true. If the FOMC chair chooses to push back against market pricing for deep rate reductions and the timing of the first cut, yields should continue to recover, boosting the U.S. dollar and weighing on precious metals. However, given Powell’s pivot last month, this scenario is less likely to materialize.

Wondering how retail positioning can shape gold prices? Our sentiment guide provides the answers you are looking for—don’t miss out, download the guide now!

GOLD PRICE OUTLOOK – TECHNICAL ANALYSIS

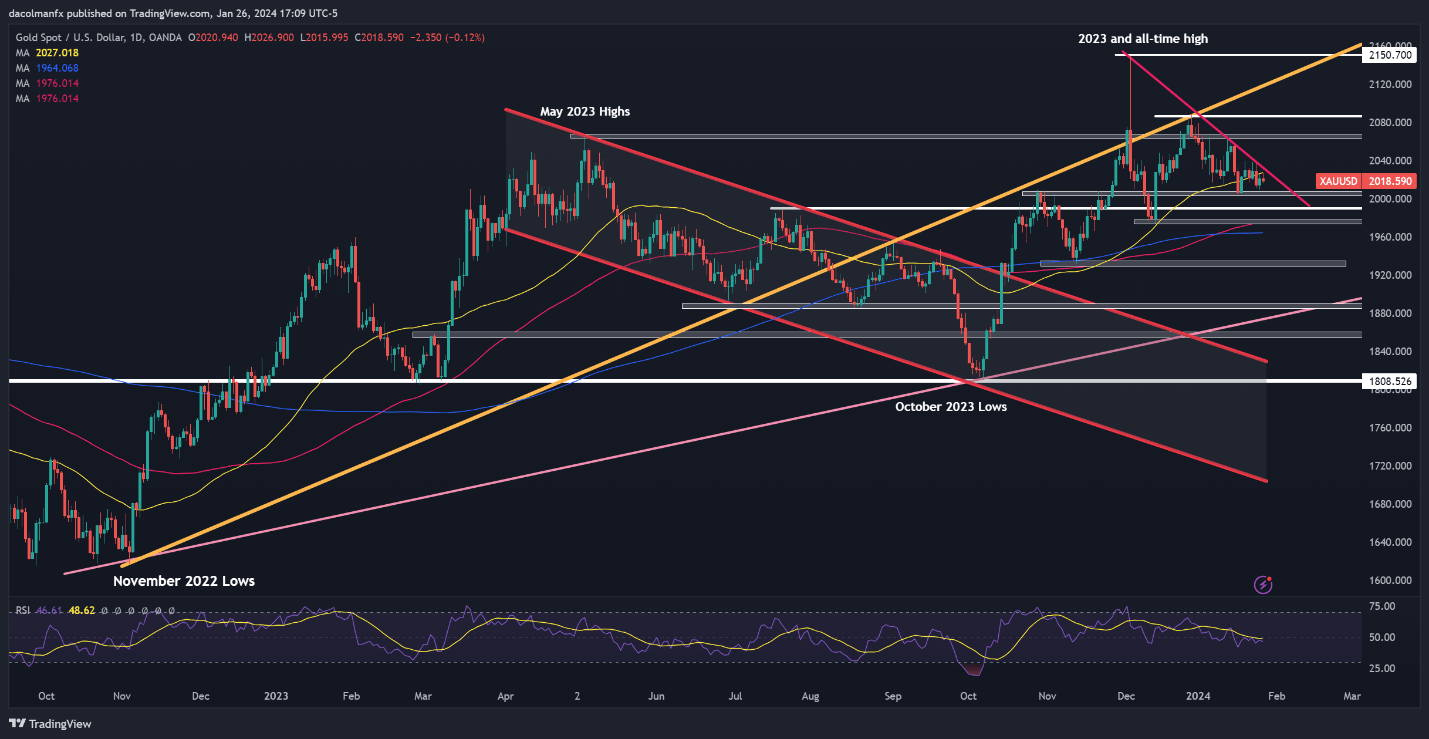
After dipping to multi-week lows last week, gold has rebounded modestly, but it continues to exhibit a consolidation-oriented bias, with prices trapped between trendline resistance at $2,030 and horizontal support at $2,005. For significant directional moves to occur in the coming days, either of these two thresholds will need to be taken out.

Assessing possible outcomes, a resistance breakout could propel XAU/USD towards $2,065. On further strength, the bulls may initiate an assault on $2,080. Conversely, in the event of a support breach, we could see a retracement toward $1,990, followed by $1,975. Continued weakness from this point onward may bring the 200-day moving average into play.

GOLD PRICE TECHNICAL CHART

A screen shot of a graph  Description automatically generated

US Dollar Forecast: USD at the Mercy of the Fed, BoE and NFP Ahead

US Dollar Forecast: USD at the Mercy of the Fed, BoE and NFP Ahead

The Dollar May Find Temporary Support Before the Fed Builds its Case for Rate Cuts

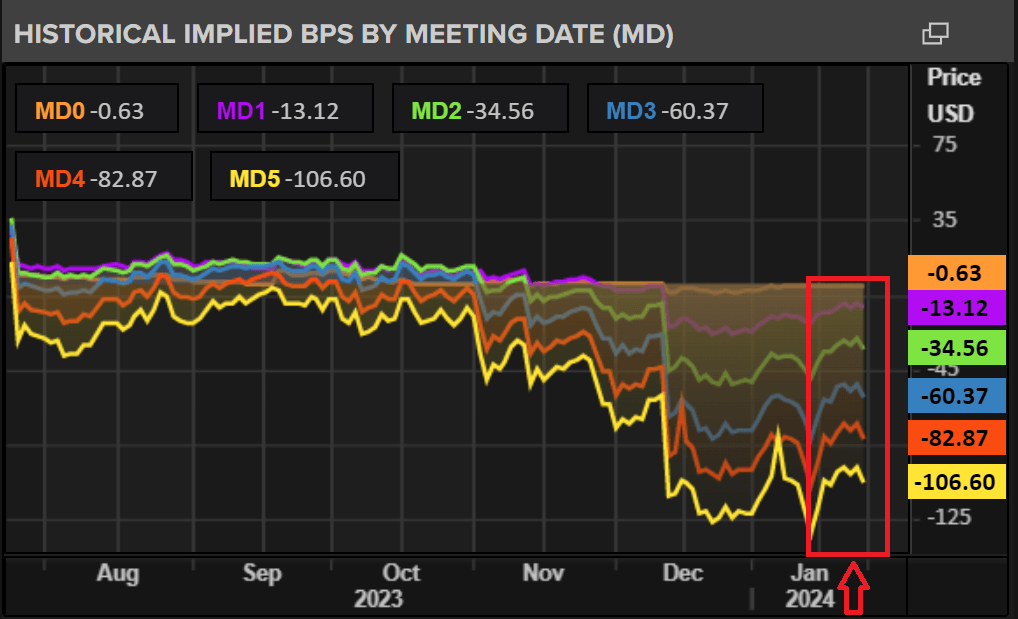
In the days and weeks leading up the next week’s FOMC meeting, prominent Fed members warned that overzealous expectations around future rate cuts were too optimistic and that the Fed does not intend to cut the benchmark rate as quickly as markets anticipated.

The chart below shows how future rate expectations for all 2024 Fed funds futures contracts have been tapered back since. The coloured lines have moved higher, signalling a reduced probability of rate cuts across the board since the end of last year. Reduced rate cut odds support the dollar, but the bar for an extended bullish move is very high.

image1.png

Accompanying data has helped drive the Fed’s message home as hotter than expected December CPI revealed lingering price pressures, although a lot of that was influenced by base effects which are mostly behind us now.

Additionally, January’s flash PMI data was strong as was the Q4 GDP print despite falling from the 4.9% growth in Q3. Equity markets soar and the unemployment rate is well below 4% now, meaning the ‘soft landing’ or ‘golden path’ gains favour once again. If the Fed sees upside risks to services inflation as a result of the strong data, it will continue to proceed with caution but the statement in general is expected to move towards a more neutral tone which we could see as early as next week.

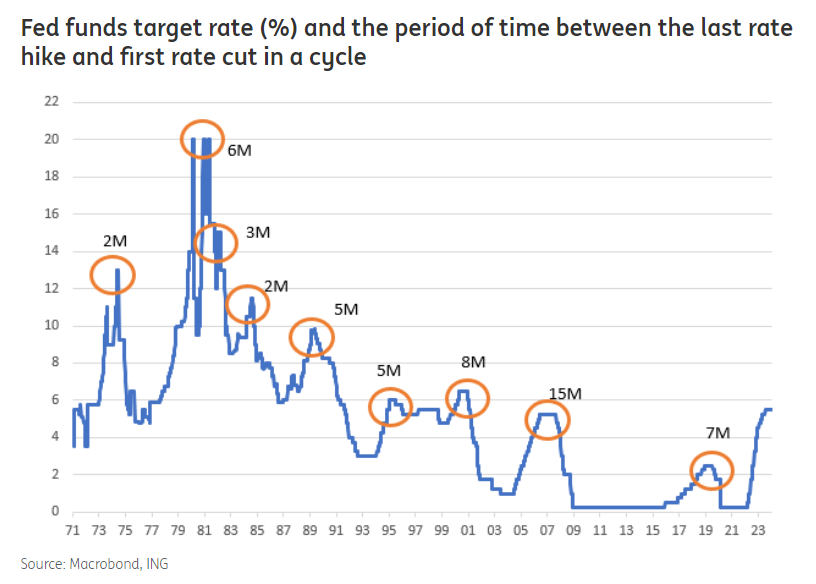
Moving from rate hikes to rate cuts is a lot like trying to turn around a massive freight ship. You first have to reduce speed, then turn before proceeding in the opposite direction. I anticipate we’ll see more of a reduction in speed next week. The chart below shows the duration between the last rate hike and first rate cut since the 1970s. Interestingly, the average of these plateaus can be rounded up to 6 months. Today marks exactly 6 months since the Fed last hiked the Fed funds rate.

image2.png

Euro Appears Vulnerable Heading into Next Week

The EU has received lacklustre economic data recently and even sentiment indicators have lost a bit of the recent momentum. PMI data continued to contract while positive developments were seen in the US. Next week, EU and German GDP data could finally confirm a technical recession, but based off comments from ECB members today, it would appear stagnation is seen as more realistic than a recession. That is according to the ECB’s Vujcic.

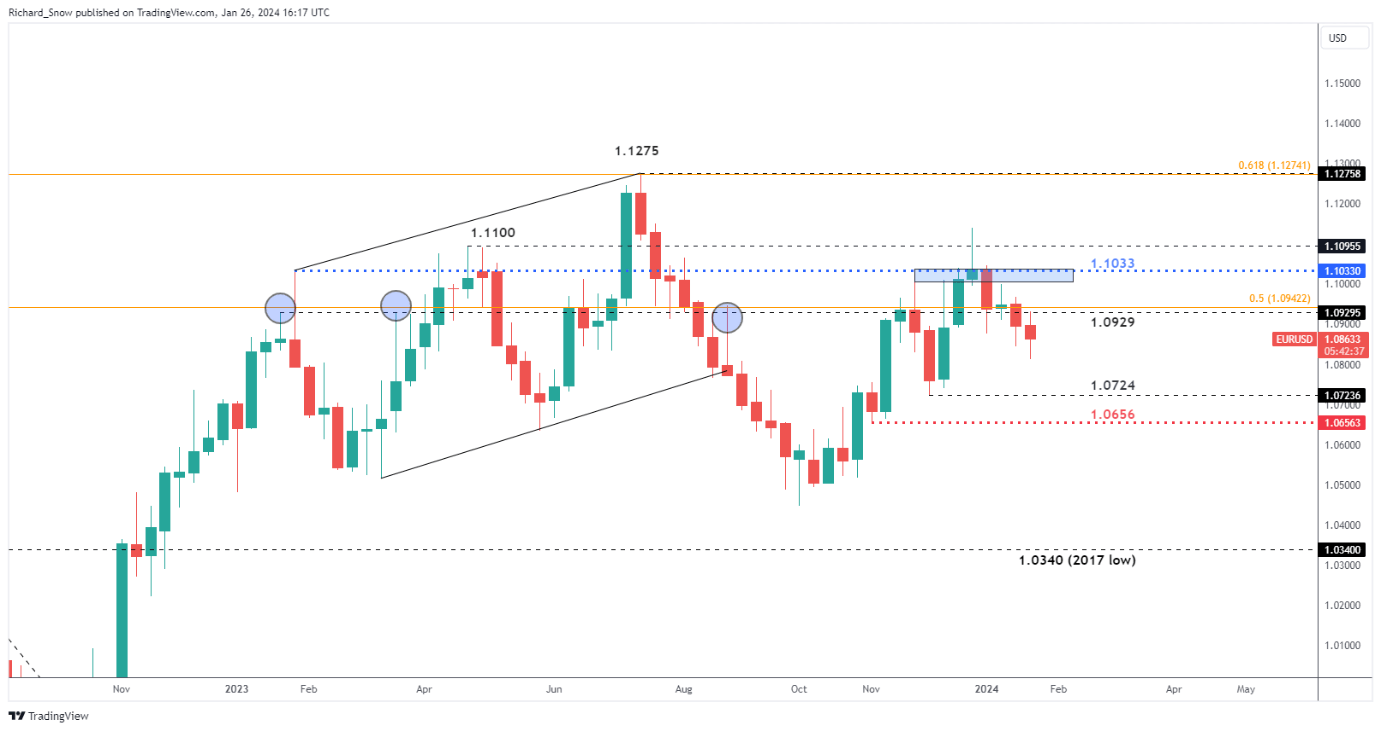
The weekly EUR/USD chart is on track for a second weekly close lower, extending the downtrend since the late December swing high. This week’s high failed to close above 1.0929, seeing the pair on track to close in the red.

EUR/USD Weekly Chart

image3.png

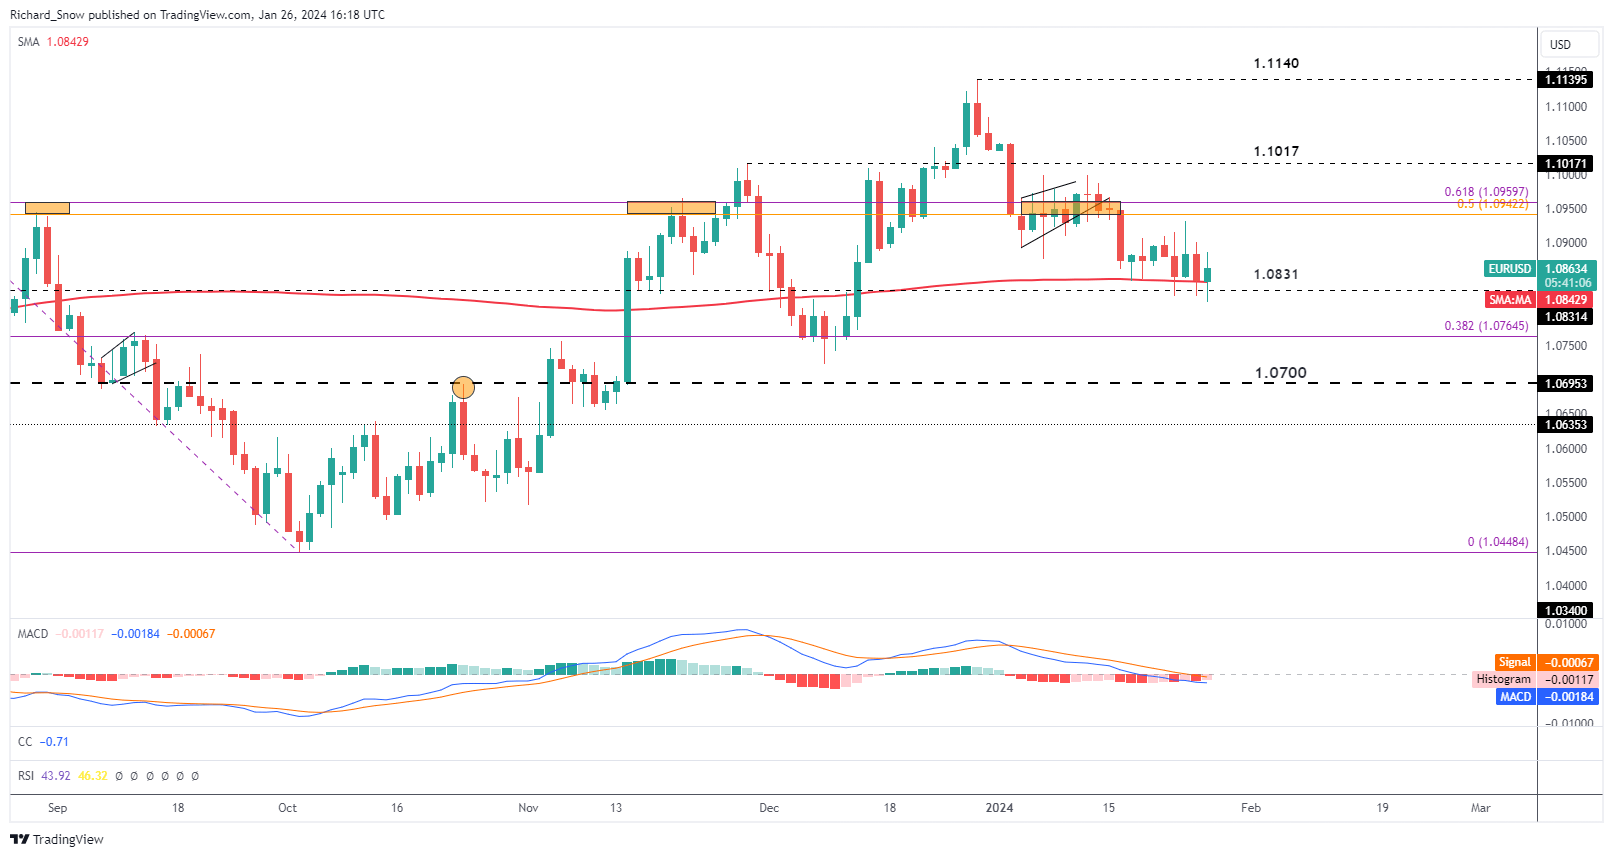
The daily EUR/USD chart found dynamic resistance at the 50-day simple moving average (SMA), restricting price action between the 50 and 200-day SMAs. The pair was unable to post a directional move in either direction as momentum appeared to be lacking.

In the coming week, I expect the 200 SMA to come under pressure again, especially if EU data disappoints again. Immediate support remains at the 200 SMA, followed closely by 1.0830 with 1,0765 next up (the 38.2% Fibonacci retracement of the 2023 decline).

Resistance remains at the 50-day SMA, followed by the zone of resistance around 1.0950.

EUR/USD Daily Chart

image4.png

Cable (GBP/USD) Range Likely to be Tested due to Anticipated Lift in Volatility

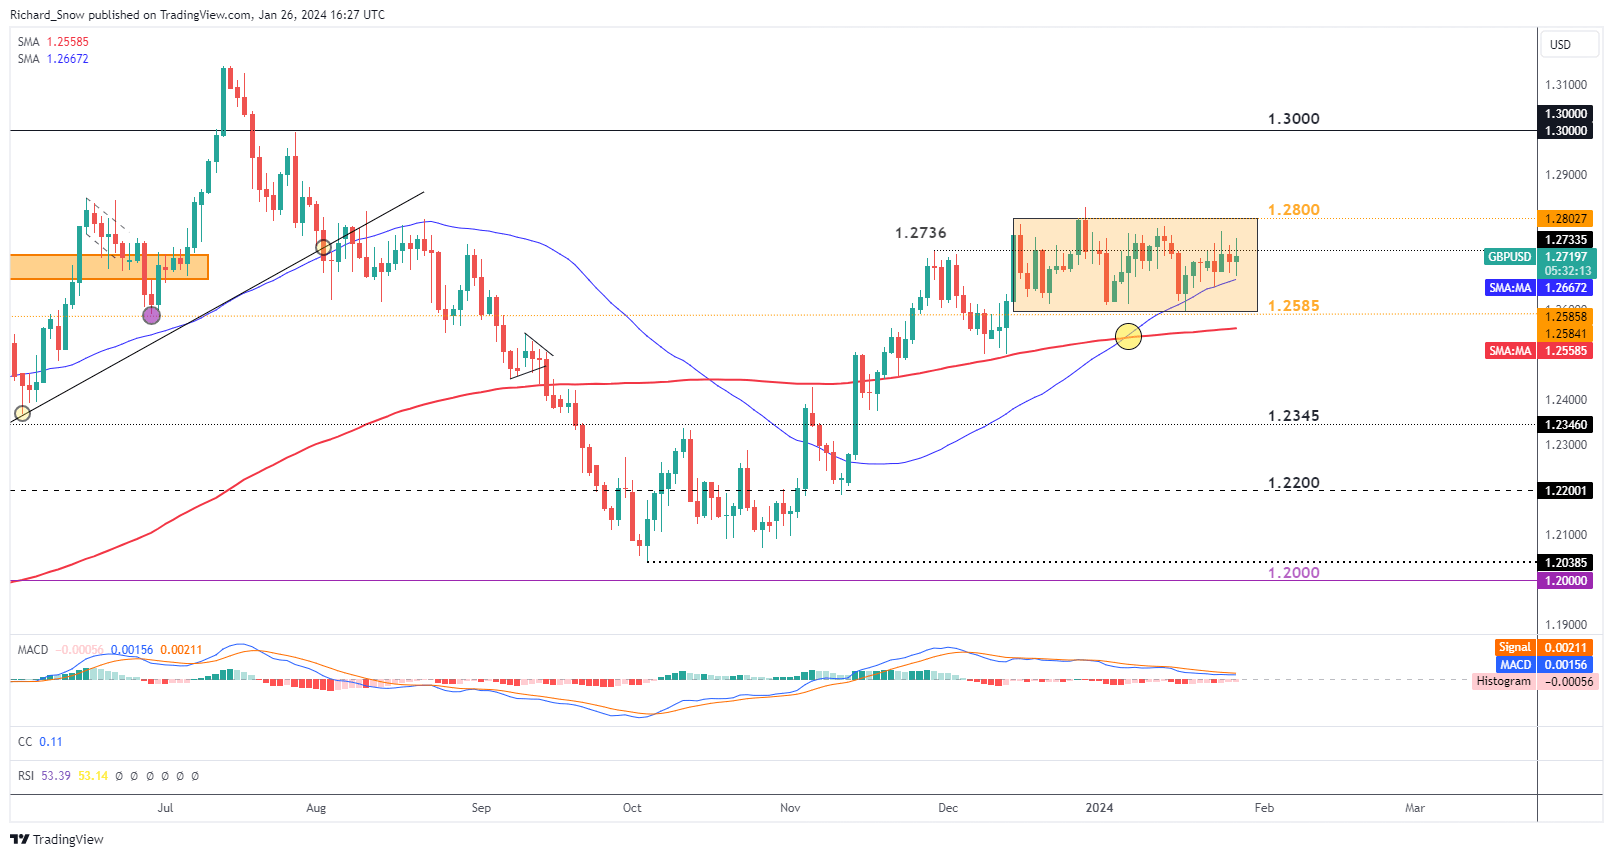
GBP/USD has traded within a broad range for a number of weeks now with the little sign of sufficient momentum either to the upside or the downside. The 50-day simple moving average has tracked price action closely, acting as dynamic support.

The prior swing high at 1.2736 has repelled bulls, particularly on a daily closing basis evidenced via multiple extended upper wicks. Volatility is anticipated to rise towards the middle of next week around the Bank of England and Fed meetings but that doesn’t promise there’ll be a concerted directional move. In fact, given recent directional uncertainty, the pair may experience an uptick in volatility but revert to trading sideways once the dust settles.

The assumption behind the continued lack of direction is based on the January meetings perhaps not providing much, if any, new information. The January meetings seem like a moment too soon to make drastic changes to policy, allowing central banks the time to more seriously consider changes at later meetings after analysing more data. There will be a lot of new data between the January meeting and the 20th and 21st of March meetings for the Fed and BoE respectively.

GBP/USD Daily Chart

image5.png

USD/JPY Shows Sign of Fatigue after Strong Bull Run

USD/JPY made a strong and swift recovery after the late December swing low, rising over 6% since then as the markets tapered aggressive rate cut bets which provided broad support for the greenback. The bullish move was helped in part by a more bearish view of the yen which became vulnerable after recent inflation data showed signs of easing.

Japanese CPI has declined over the last two months at a time when the Bank of Japan is closely watching price trends and rising wage growth as the two preconditions for a policy shift. However, after the BoJ meeting, Governor Ueda’s comments continued to focus on what seemed like an inevitable policy shift and crucially admitted that “the probability of reaching the bank’s 2% target is rising gradually” – something that could see the yen reclaiming some lost ground.

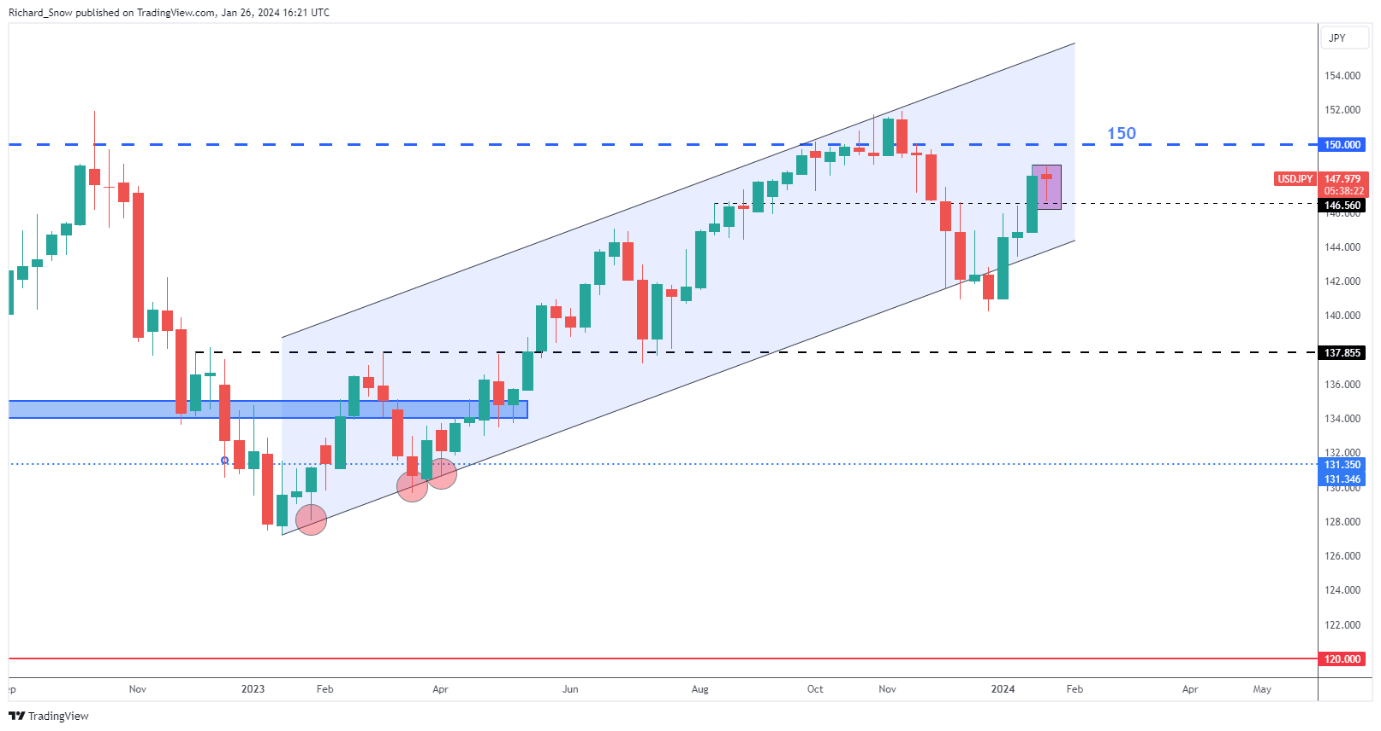
The weekly chart reveals a hanging man candle, which is typically viewed as a bearish continuation pattern. Since price was unable to surpass or even retest the prior high, another move lower cannot be disregarded. The major psychological level of 150 appears some distance away but one level to note to the downside is 146.56. A close below this level could see another test of channel support thereafter. While the other pairs reveal a susceptibility to dollar strength, USD/JPY may struggle to rally if broader yen appeal grows.

USD/JPY Weekly Chart

image6.png

Markets Week Ahead: Fed and BoE Decisions, US Jobs Data, Microsoft, Apple, Amazon Report

Markets Week Ahead: Fed and BoE Decisions, US Jobs Data, Microsoft, Apple, Amazon Report

In addition to the economic calendar, a raft of US big tech companies release their latest Q4 results. On Tuesday, Alphabet (GOOG) and the world’s largest company Microsoft (MSFT) open their books, while on Thursday, three more of the Magnificent Seven, Amazon (AMZN), Apple (APPL), and Meta Platform (META) release their earnings after the market has closed.

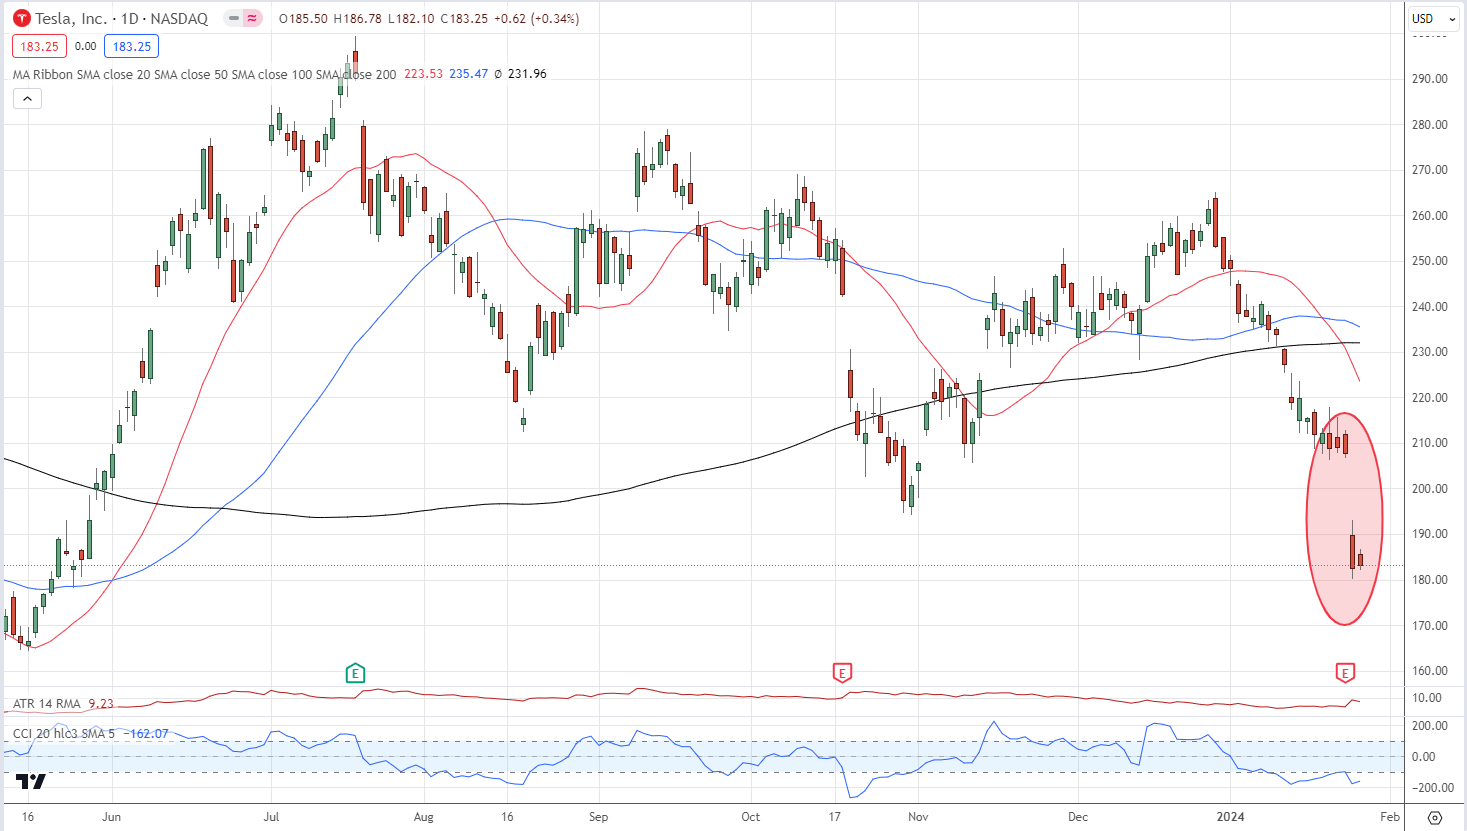
US equity markets continue to make fresh multi-year/decade/all-time records as investors remain firmly risk-on. The upcoming Big 7 earnings release will weigh on the indices, due to their heavy weighting, leaving markets at risk. Last week Tesla (TSLA) disappointed the market and slumped by around 12% after their earnings were released.

Tesla Daily Price Chart

image1.png

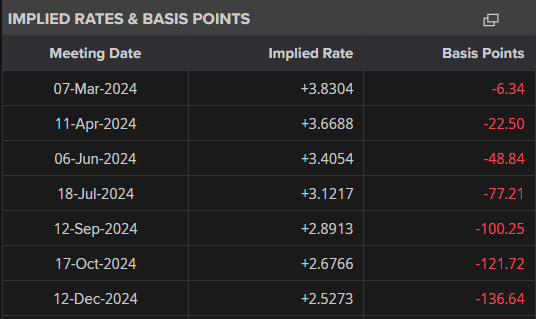
The Euro came under pressure last week despite the ECB leaving all monetary policy settings untouched. The markets are looking at Germany and the Euro Area and are now aggressively pricing in a series of interest rate cuts as economic growth in the region flatlines. Next week’s Euro Area and German GDP data will be closely monitored by the ECB and the market.

 Euro Rate Probabilities – Are Six 25bp ECB cuts on the cards?

image2.png

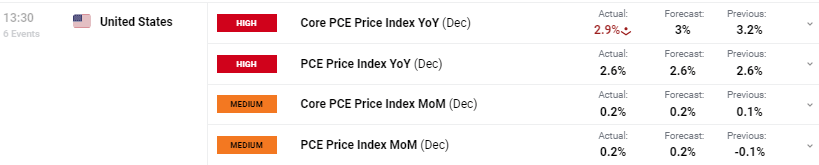
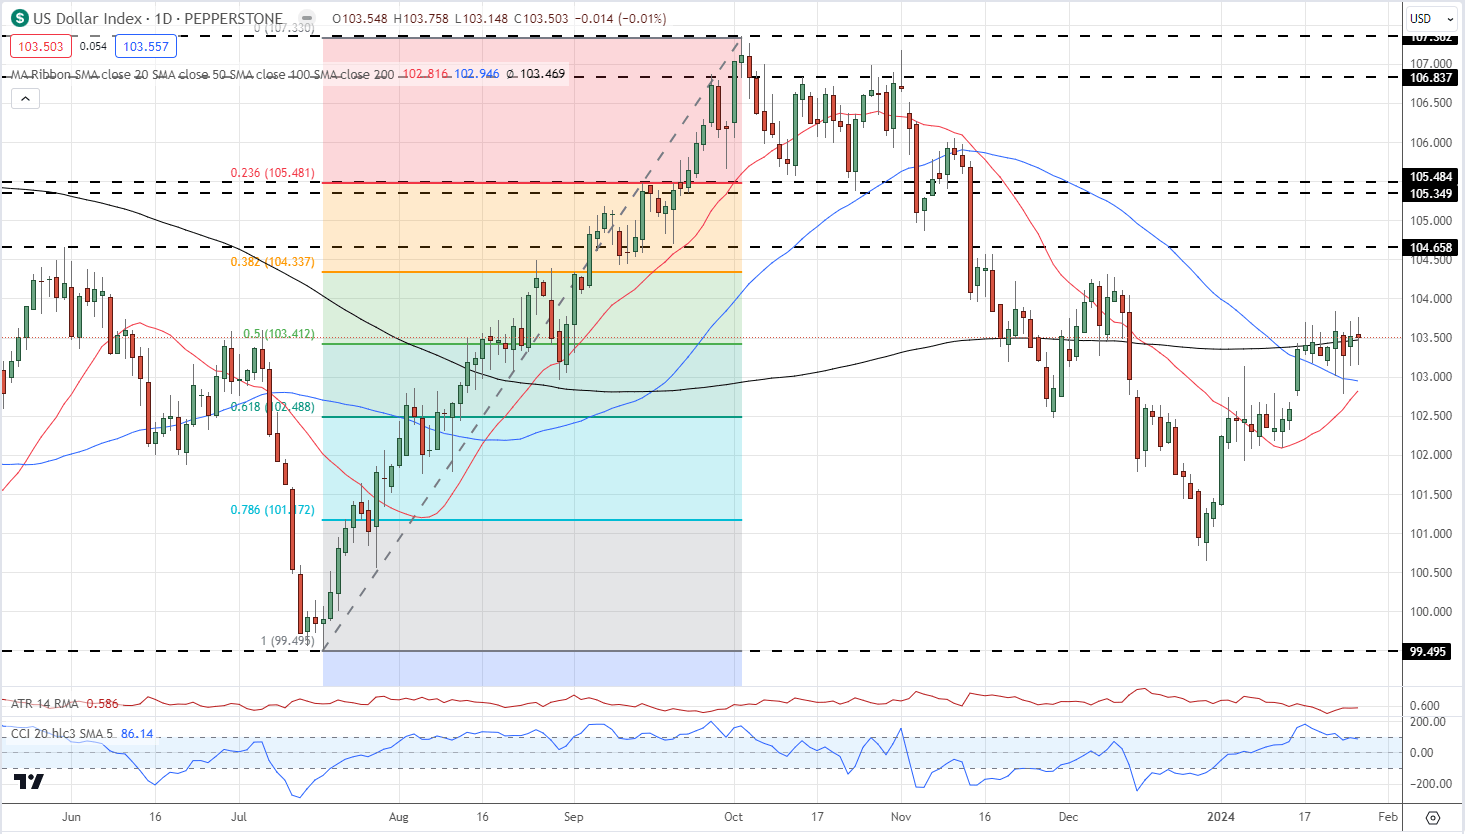
The US dollar remains in focus but last week’s price action was listless. The US dollar index closed within a handful of pips of where it opened the week, despite a slightly better-than-expected US Core PCE report, and a robust advanced Q4 GDP release.

image3.pngimage4.png

US Dollar Index Daily Chart

image5.png

Oil Prices Forecast: China’s Diplomatic Efforts Seek to Calm Middle East Tensions

Oil Prices Forecast: China’s Diplomatic Efforts Seek to Calm Middle East Tensions

Geopolitical Influence on Market Performance

Oil prices experienced a slight downturn in Friday’s trading but are on track for a net weekly increase, bolstered by strong economic data from the United States and China and a notable decrease in U.S. crude inventories.

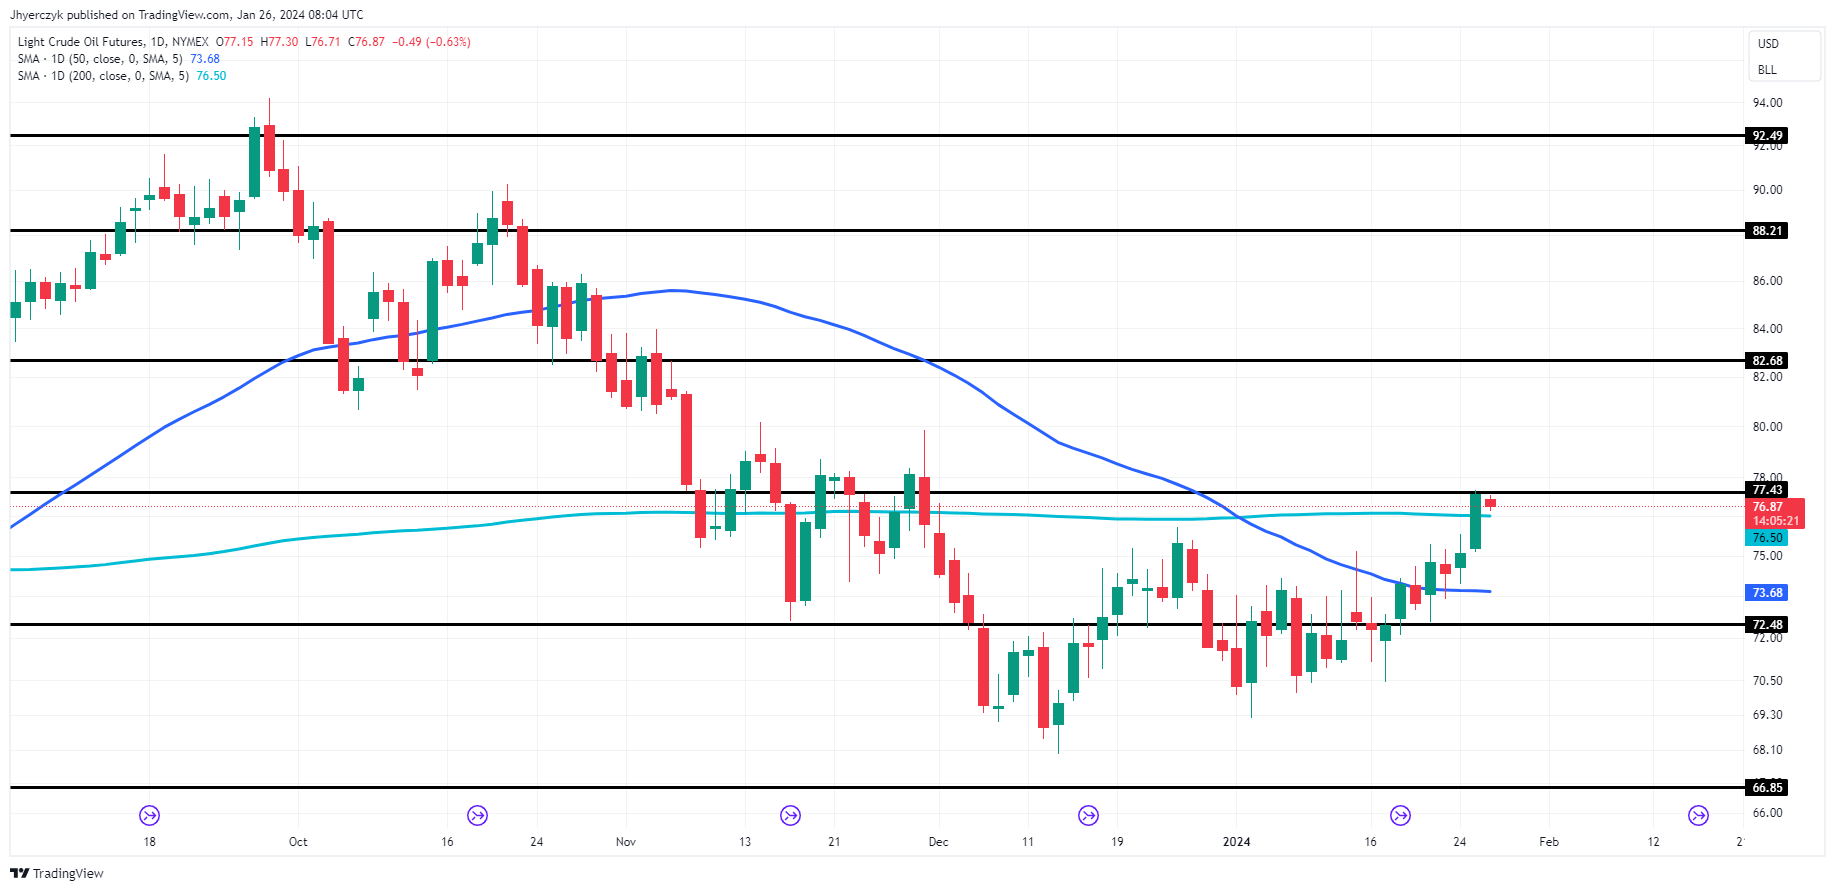
At 07:52 GMT, Light Crude Oil Futures are trading $76.78, down $0.58 or -0.75%. The U.S. benchmark was poised for a second week of gains, up over 4% for the period.

A key factor influencing the price action on Friday is the easing of tensions in the Red Sea, primarily driven by China’s diplomatic efforts to reduce Houthi militia attacks through its influence on Iran.

This development not only underscores China’s significant role in shaping global oil trade trends but also highlights the oil market’s acute responsiveness to geopolitical shifts alongside key economic indicators. The combination of reduced geopolitical risk and the drawdown in U.S. oil stockpiles has set a positive tone for the week’s market performance.

China-Iran Trade Equation

The trade relationship between China and Iran is a key factor in the market. China’s significant consumption of Iranian oil is a major component of Iran’s exports, yet it represents a small segment of China’s total oil imports. This imbalance grants China considerable leverage over Iran, although Iran’s regional alliances and broader strategic interests complicate this dynamic.

Supply and Demand Outlook

On the supply side, the recent decrease in U.S. crude stockpiles and the potential normalization of Red Sea shipping routes are mitigating supply concerns. Meanwhile, demand is underpinned by robust economic growth in the U.S. and China, pointing towards sustained demand for oil.

Short-Term Market Forecast

The short-term forecast for the oil market leans bullish, driven by a blend of positive economic data and reduced geopolitical risks. However, the market remains vigilant to shifts in Middle Eastern geopolitics, which could rapidly alter supply conditions and impact price trends.

Technical Analysis

Daily Light Crude Oil FuturesLight crude oil futures are easing on Friday after crossing to the strong side of the 200-day moving average the previous session. This makes $76.50 a pivotal price today.

Should buyers successfully defend $76.50 and overtake resistance at $77.43 then we could see an acceleration to the upside with the next major resistance coming in at $82.68.

On the downside, the inability to hold above the 200-day MA will be a sign of weakness, setting up a potential correction into the 50-day MA at $73.68.

EUR/USD and GBP/USD Price Forecast: Strong US GDP Lifts Dollar, Eurozone Consumer Climate Dips

EUR/USD and GBP/USD Price Forecast: Strong US GDP Lifts Dollar, Eurozone Consumer Climate Dips

US Dollar Rises Amid Strong GDP, Eurozone and UK Consumer Sentiments Diverge

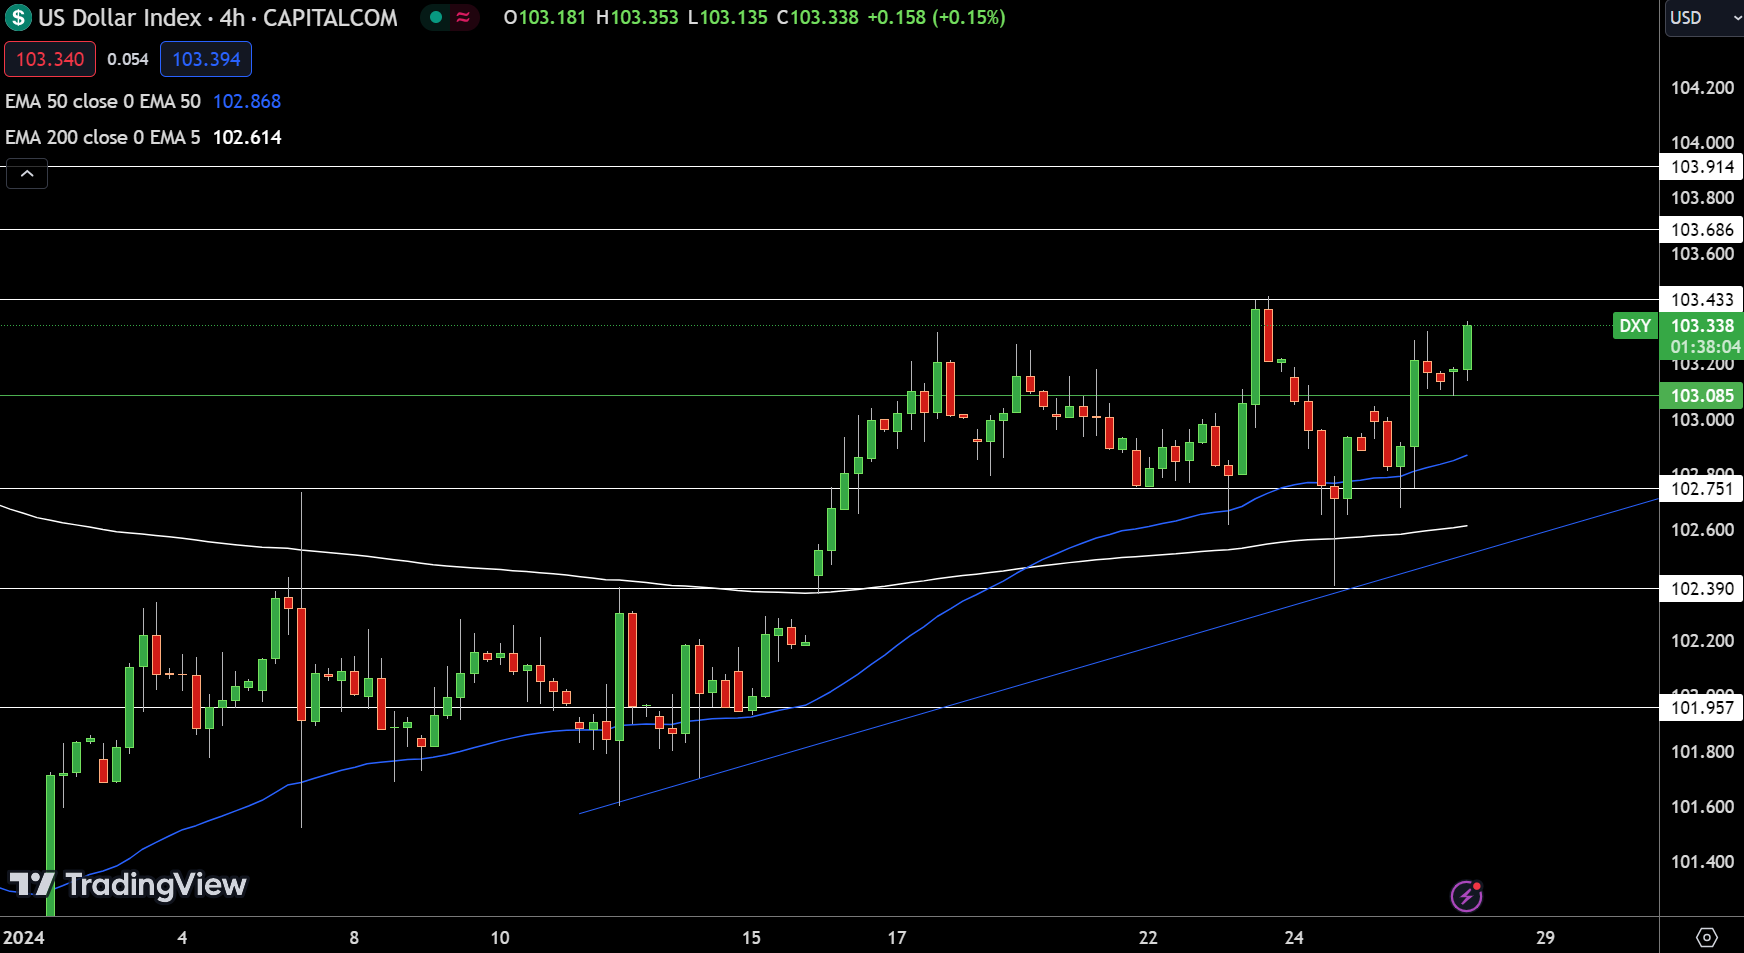
The US Dollar Index exhibited bullish behavior on January 26, climbing 0.18% to 103.321, buoyed by U.S. economic data. The Advance GDP growth at 3.3% surpassed the 2.0% forecast, underscoring a strong U.S. economy. Meanwhile, Unemployment Claims were slightly above expectations at 214K but still indicate a stable job market.

In contrast, the Eurozone’s outlook appears less optimistic. The German GfK Consumer Climate plummeted to -29.7, suggesting growing consumer pessimism and potentially impacting the EUR/USD pair negatively. Conversely, the UK’s GfK Consumer Confidence index showed less pessimism at -19, potentially lending some support to the GBP/USD pair.

Events Ahead

Looking forward, key U.S. indicators such as the Core PCE Price Index and Pending Home Sales could further drive the dollar’s momentum. In Europe, upcoming reports like the Spanish Unemployment Rate and insights from the German Buba Monthly Report are expected to influence the EUR/USD, especially if they diverge from the ECB’s outlook.

US Dollar Index (DXY)

Dollar Index
Dollar IndexThe US Dollar Index exhibits a bullish trend, trading above the pivot point of $103.085. The currency faces immediate resistance levels at $103.433, $103.686, and $103.914, each potentially challenging further upward movements.

On the downside, support levels are positioned at $102.751, $102.390, and $101.957. The 50-day and 200-day Exponential Moving Averages, at $102.868 and $102.614 respectively, reinforce this bullish sentiment.

EUR/USD Technical Forecast

EUR/USD Price Chart - Source: Tradingview
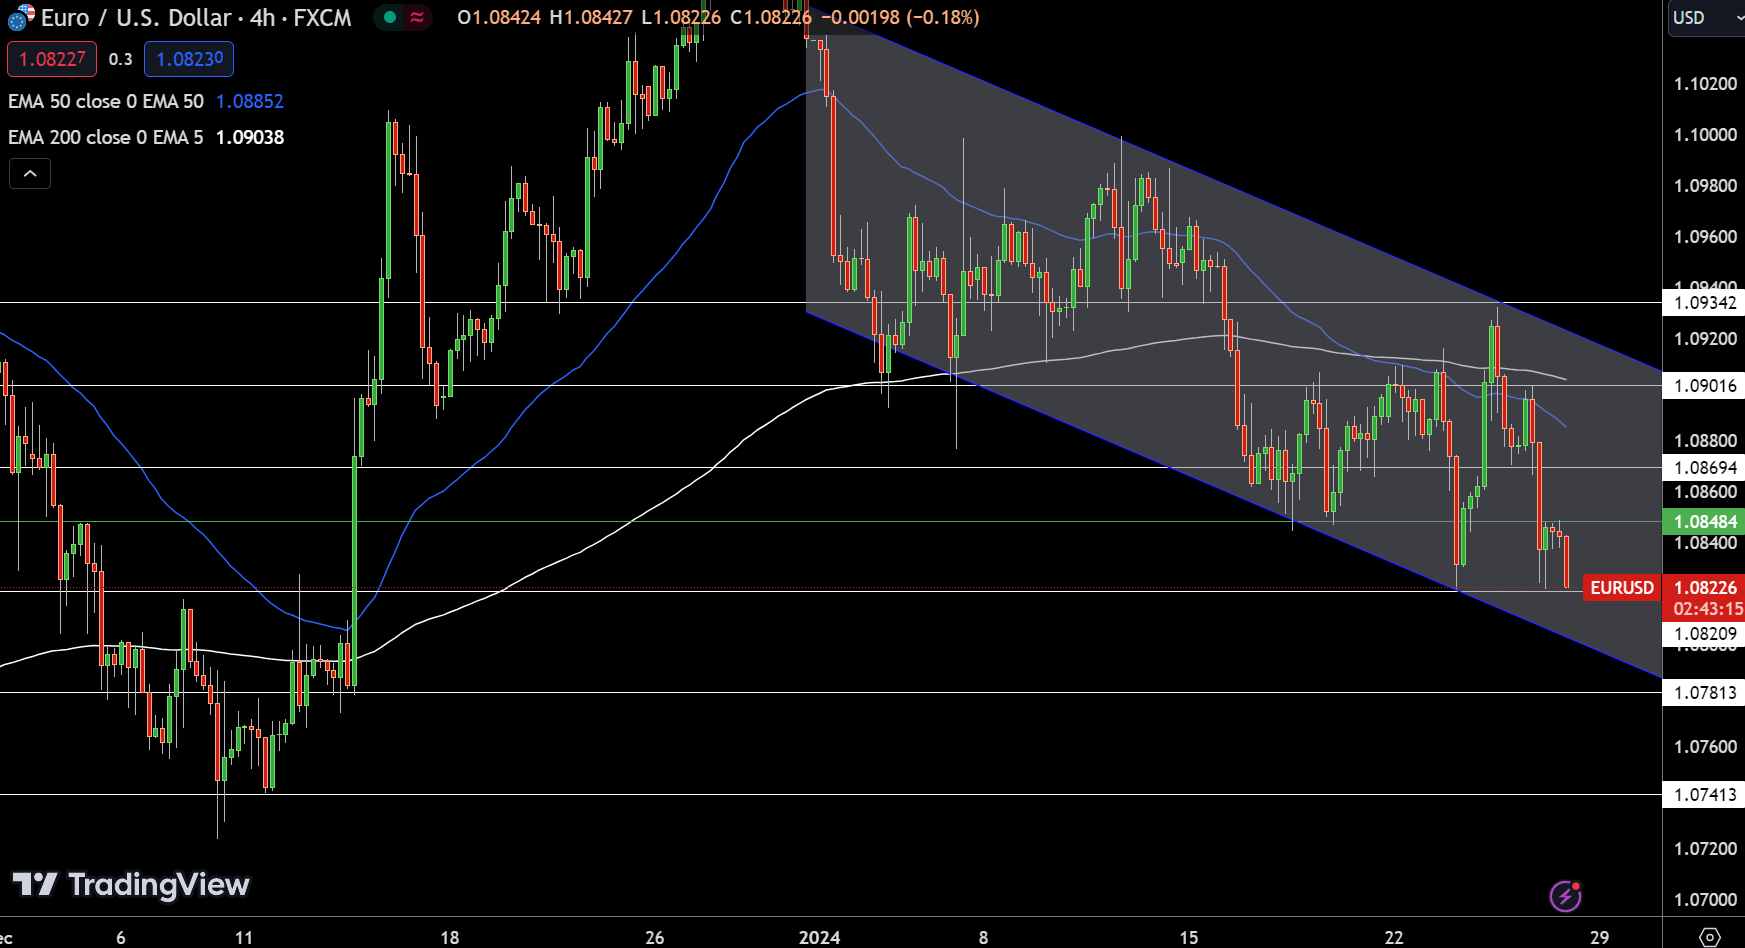
EUR/USD Price Chart – Source: TradingviewOn January 26, the EUR/USD pair trades at a cautious 1.08226, marking a 0.27% decline. Positioned below the pivot point of $1.08484 in a four-hour chart, the pair faces resistance at $1.08694, $1.09016, and $1.09342.

Surpassing these levels is crucial for reversing the current downward trend. Support lies at $1.08209, with subsequent levels at $1.07813 and $1.07413, potentially stabilizing further drops.

Technical analysis shows the 50-day and 200-day Exponential Moving Averages (EMAs) at $1.08852 and $1.09038, respectively, both reinforcing the downward trend.

A bearish engulfing candlestick pattern on the 4-hour chart, combined with a downward channel, further suggests a bearish outlook. Consequently, the current trajectory for EUR/USD remains bearish, particularly below the pivotal $1.08484 mark.

GBP/USD Technical Forecast

GBP/USD Price Chart - Source: Tradingview
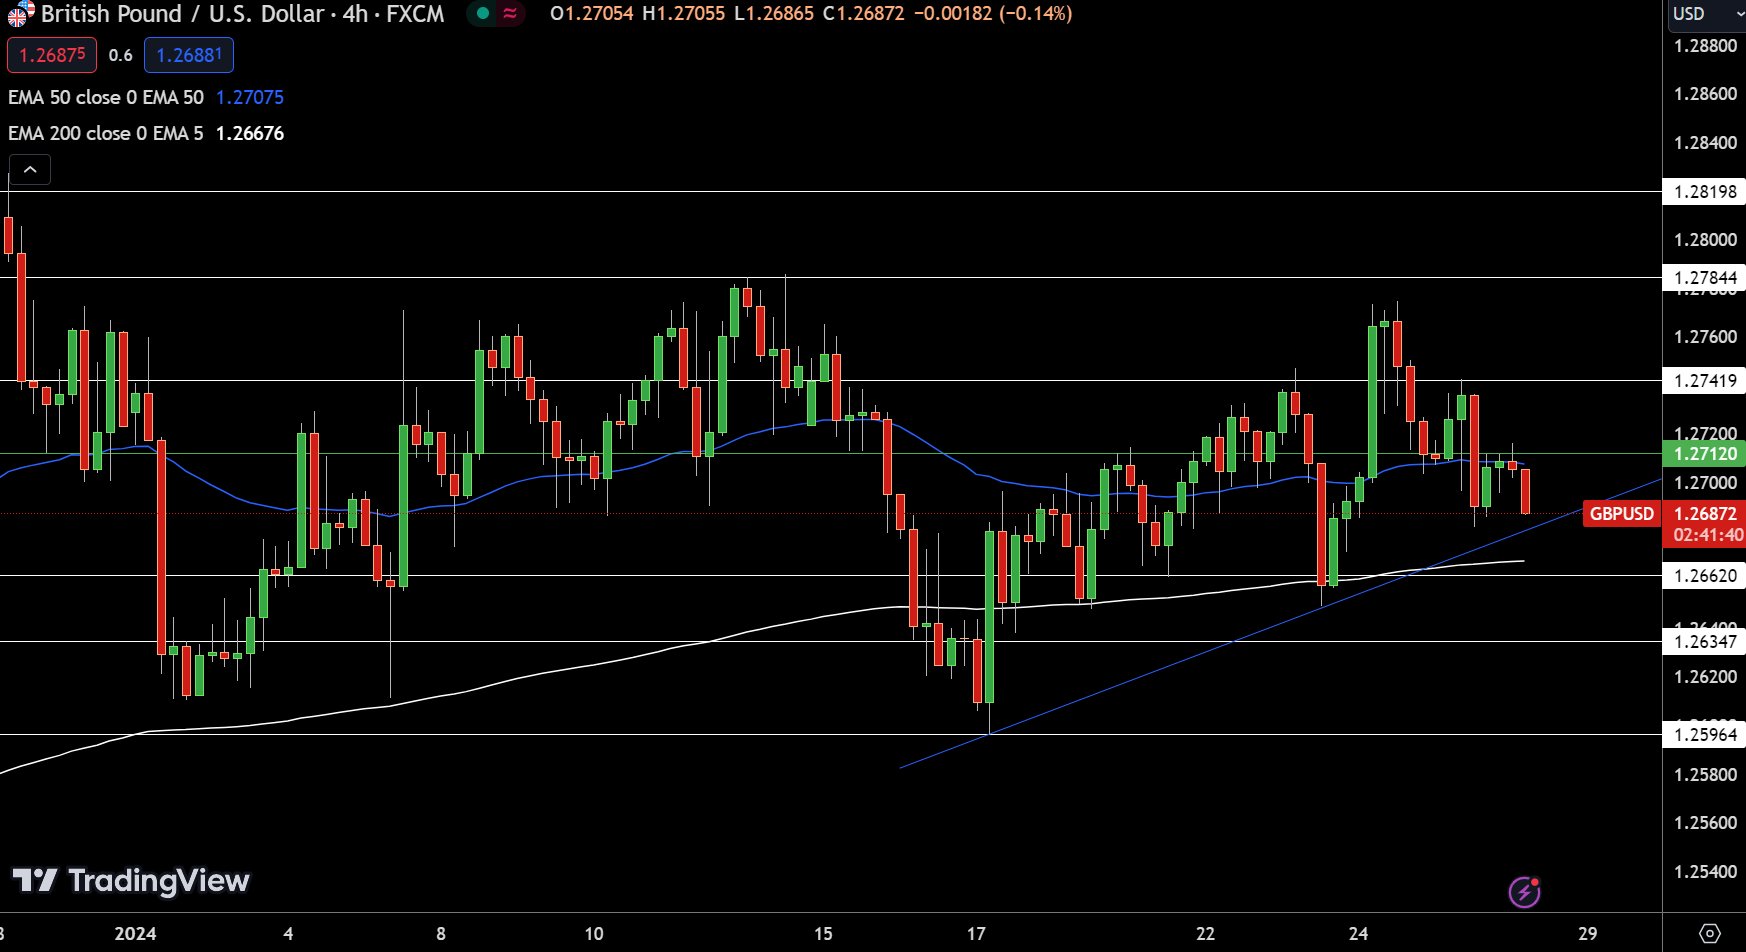
GBP/USD Price Chart – Source: TradingviewThe GBP/USD pair on January 26th leans towards a bearish trend, trading at 1.26872, a decrease of 0.16%. Within a four-hour chart frame, it lingers below the pivot point of $1.27120, indicating a challenging environment for bullish momentum.

Resistance levels are set at $1.27419, $1.27844, and $1.28198, each serving as potential barriers to upward movements. Support levels are established at $1.26620, followed by $1.26347 and $1.25964, which are critical for preventing further declines.

Technical indicators show the 50-day Exponential Moving Average (EMA) at $1.27075, just above the current rate, and the 200-day EMA at $1.26676, both validating the downward trend.

The chart pattern, including a tweezers top formation near the 50 EMA line and an evening star candlestick, further signals potential bearishness. Notably, the GBP/USD pair’s future could hinge on the support around $1.2675; a fall below this mark might intensify selling.

Overall, the pair displays a bearish tendency below the $1.27120 pivot, calling for caution in trading strategies.


Markets Week Ahead: Fed and BoE Decisions, US Jobs Data, Microsoft, Apple, Amazon Report

German GfK Consumer Climate Indicator Slides to -29.7 for February

German GfK Consumer Climate Indicators Slide

On Friday, German consumer confidence was in the spotlight amidst expectations of a German recession through Q1 2024. The German GfK Consumer Climate Indicator declined from -25.4 to -29.7 for February. Economists forecast an increase to -24.5.

According to the January survey,

  • Income expectations slid by 13.1 points to -20, the lowest since March 2023.
  • The GfK attributed the fall in income expectations to the recent inflation trends. In December, the annual inflation rate accelerated from 3.2% to 3.7%, with the reintroduction of regular VAT contributing.
  • Willingness to buy declined by 6 points to -14.8.
  • High food and energy prices impacted consumer plans to purchase large items.
  • In contrast, the willingness to save indicator rose by 6.7 points to 14 points, the highest since August 2008.
  • Economic expectations for the next 12 months fell by 6.2 points to -6.6 points, the lowest since December 2022 (-10.3 points).

Impact on Sentiment Toward ECB Interest Rate Goals

On Thursday, the ECB left interest rates at 4.50%. During the ECB Press Conference, President Christine Lagarde focused on wage growth. Lagarde also warned that it was too early to discuss interest rate cuts.

The weaker consumer income expectations and slide in consumer willingness to buy painted a grim picture of the German economy. Similar trends across the euro area could force the ECB to rethink its stance on interest rates.

EUR/USD Reaction to German GfK Consumer Climate Survey

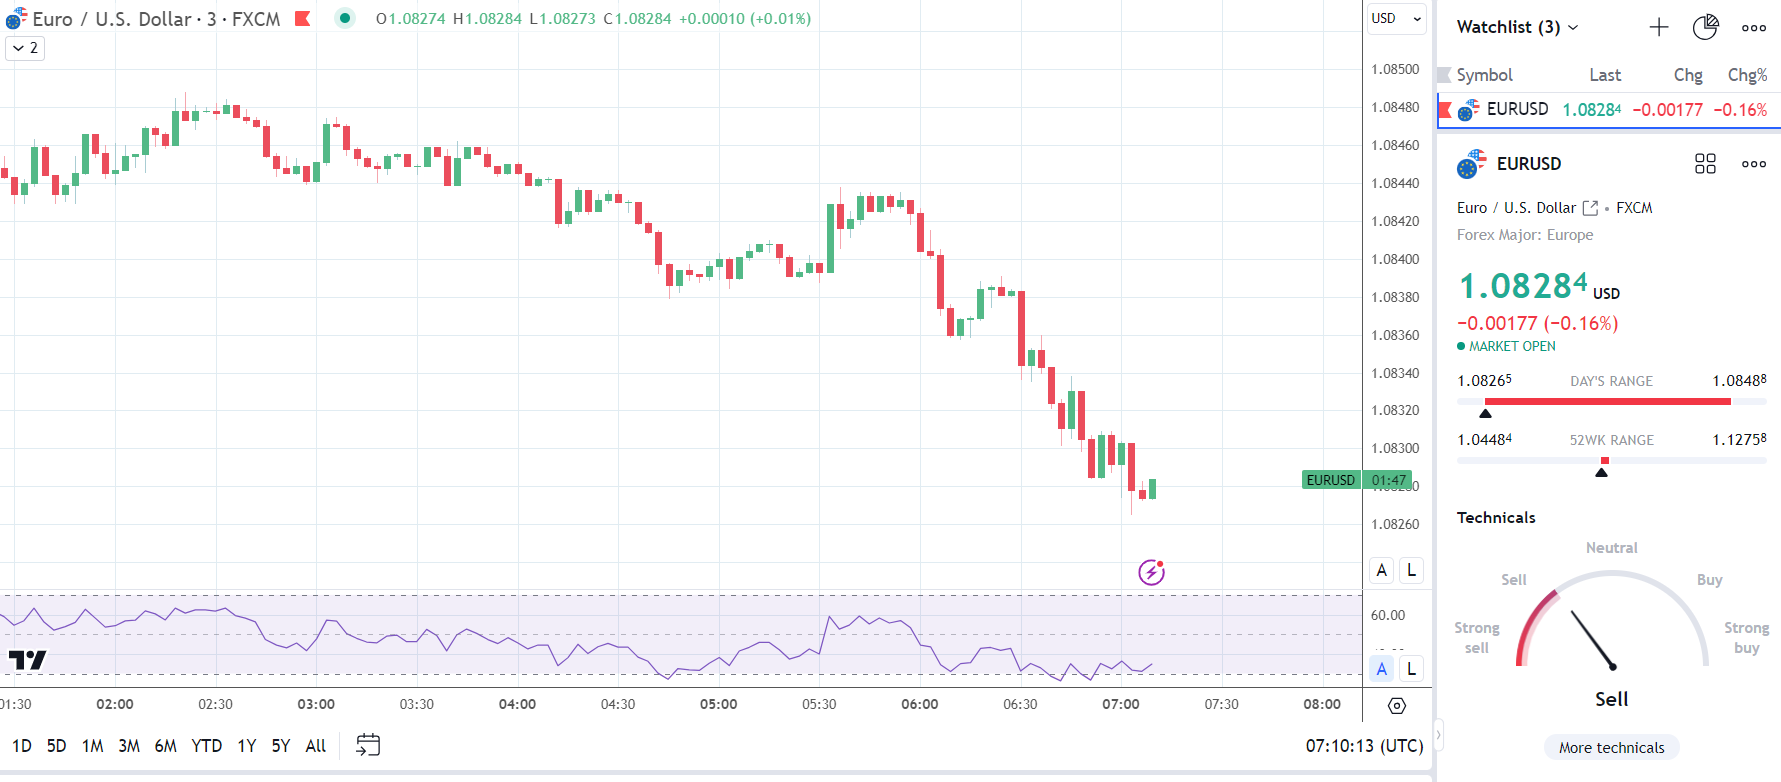
Before the German GfK Consumer Climate numbers, the EUR/USD rose to a high of $1.08488 before falling to a low of $1.08284.

However, in response to the numbers, the EUR/USD rose to a high of $1.08304 before falling to a low of $1.08265.

On Friday, the EUR/USD was down 0.16% to $1.08284.

EUR/USD reacts to German GfK Consumer Climate slide.
260124 EURUSD 3 Minute Chart

Up Next

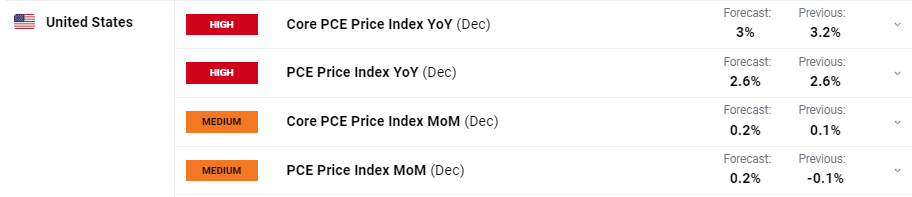
Later today, the US economic calendar will garner investor interest. US Core PCE Price Index and personal income/spending figures need consideration.

Economists forecast personal income to increase by 0.3% month-on-month in December and personal spending by 0.4%. Significantly, economists expect the Core PCE Price Index to increase by 3.00% year-over-year versus 3.20% in November.

Recent economic indicators have raised expectations of a US soft landing. However, investors remain divided on whether the Fed will cut interest rates in March.

According to the CME FedWatch Tool, the probability of a 25-basis point March rate cut increased from 40.4 to 51.0% on Thursday. Hotter-than-expected US inflation and personal income/spending numbers could reduce bets on a March rate cut.

Euro (EUR/USD) Under Pressure as Markets Push the ECB to Start Cutting Rates Earlier

Euro (EUR/USD) Under Pressure as Markets Push the ECB to Start Cutting Rates Earlier

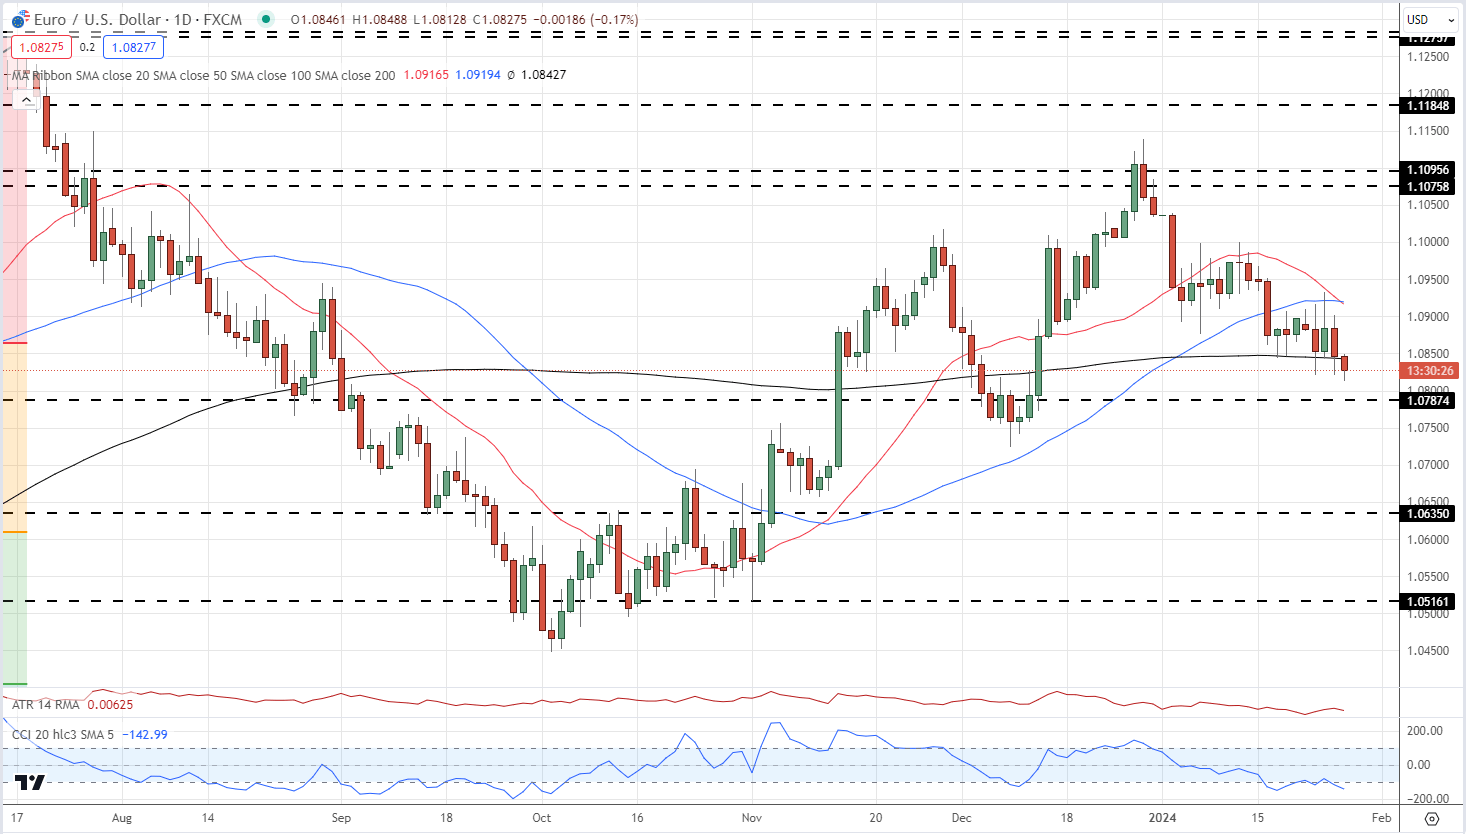
The Euro weakened after Thursday’s ECB press conference despite President Lagarde giving little away. The central bank left all policy levers untouched yesterday, repeated that any change in monetary policy is data dependent, and gave no hint of any timetable for future action. The markets however are now the ECB to cut rates earlier, and by more, with weak Euro Area growth and falling inflation the drivers behind the move. Both before and straight after the central bank meeting, the market was forecasting 125 basis points of cuts in the Euro Area this year with the first move seen at the end of H1. The market is now looking for more than 142 basis points of cuts with a 76% probability of the first cut being announced in April.

ECB Implied Rates and Basis Points

image1.png

The latest bout of Euro weakness has seen EUR/USD slip to a fresh multi-week low and continue a short-term series of lower highs and lower lows. The 200-day simple moving average is also being tested a close and open below this indicator will likely see EUR/USD slip below 1.0800 and head towards a cluster of prior lows on either side of 1.0750. Later today see the release of the latest US Core PCE data. This is the Federal Reserve’s preferred measure of inflation and any deviation from expectations will steer the US dollar, and EUR/USD, going into the weekend.

image2.png

EUR/USD Daily Chart

image3.png

Death Cross: What is it and How to Identify it When Trading?

Death Cross: What is it and How to Identify it When Trading?

Death cross: What is it and How to Identify it when Trading?

The ‘death cross’ is a term often mentioned in trading circles due to its usefulness in spotting changes in trends while also being incredibly easy to use. This article will explain the concept of the death cross and how to identify it on price charts. Furthermore, read our article on the Golden Cross to discover complementary indicators to use alongside the simple moving averages when analyzing changing trends.

What is a Death cross?

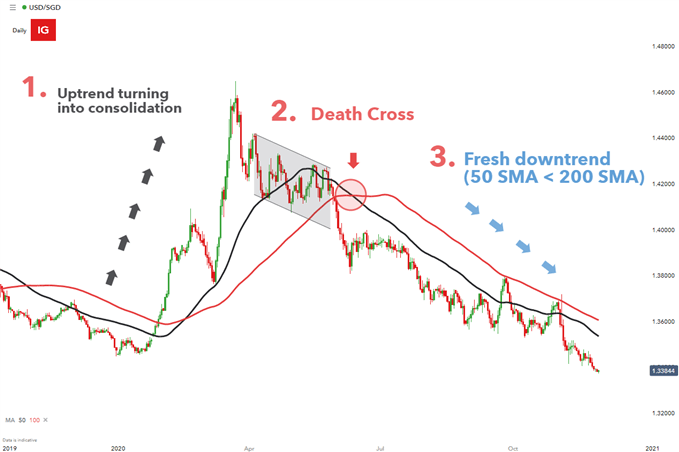
A death cross occurs when the 50 simple moving average (SMA) crosses below the 200 SMA. The death cross provides a bearish backdrop to the market as short-term price momentum advances lower, with the potential to evolve into a new long-term trend (downtrend).

The 50 SMA is an arithmetic average of closing price levels over the last 50 periods or days, if you are using the daily chart for example. Therefore, the 50 SMA is more reactive to more recent price movement than the 200 SMA, which averages out the last 200 closing prices and tends to create a smoother line, less reactive to recent prices than the 50 SMA.

Learn how to calculate simple moving average in our article, ‘Moving Average Explained for Traders’

How to Identify a Death cross

There are three main stages to the formation of the death cross:

1. The lead up: Price action consolidates or, in some scenarios, turns sharply lower after trending higher for a considerable period of time. A period of consolidation provides the initial clue that the uptrend may be starting to lose momentum and could even result in an eventual trend reversal. The 50 SMA remains above the 200 SMA during this stage.

2. The death cross: This is the exact moment the 50 SMA crosses below the 200 SMA, providing the bearish backdrop for the market known as the death cross. The death cross is often interpreted as a trigger to look for entries into the market.

3. Continued downward momentum: Price action advances lower after the death cross is observed, often creating a fresh new trend (downtrend). Ideally, in this stage you may observe the shorter 50 SMA acting as dynamic resistance for price action and price continues to trade below the 50 SMA for some time.

Death cross on Daily USD/SGD Chart 2019-2020

The Simple Moving Average as a Lagging Indicator

By its very nature the simple moving average is a lagging indicator, meaning that it relies on past price action to provide assistance when analyzing current market conditions. Inherently, the SMA has a lag period, resulting in the signal being produced some time after the move has occurred.

Some may view this as a lost opportunity while others may appreciate the delayed signal as it may provide a greater level of conviction that the trend has indeed changed and we aren’t simply witnessing a short term retracement. Shorter-term traders like scalpers and day traders, seeking to capitalize on smaller moves, can make the indicator more responsive by simply reducing the short-term and longer-term moving averages when adjusting the input criteria.