Copper Trading: Copper Trading Tips and Strategies

Copper Trading: Copper Trading Tips and Strategies

Copper is a global commodity that has several key uses throughout industry and is highly correlated to economic growth. Copper trading is often used by hedgers and speculators as protection or exploitation of future price movements. Both individuals and institutions are able to gain exposure to copper and copper trading, making this metal popular choice within the commodity trading spectrum.

Why Trade Copper and How Does Copper Trading Work?

One advantage of copper trading is accessibility. Copper is traded through a variety of avenues like futures, options, equities and CFDs. You can also gain exposure to copper via copper ETFs (exchange traded funds) like CPER (United States Copper Index Fund) or JJCB (iPath Series B Bloomberg Copper Subindex Total Return ETN).

Copper is a soft malleable metal with properties like gold and silver. It derives most of its demand from building construction, transportation equipment and electronic products. It is a strong conductor of electricity and heat, and therefore has a wide range of industrial uses which also leads it to trade in high volumes – a good thing for traders because it can lead to reduced spreads and potentially cleaner chart patterns.

Movements in the price of copper are heavily dependent on demand from emerging market economies like China and India. During times of economic growth, these nations demand large quantities of copper, the demand of which helps to increase the metal’s price. Alternatively, during economic downturns demand for copper drops, price tends to fall as well. Traders should be aware of this dynamic when trading copper.

Many copper traders use technical and/or fundamental analysis to inform their trading strategy which helps a trader forecast whether the price of copper will rise or fall. Once a trader is confident in their forecast, he/she can buy or sell copper in an attempt to profit from price movements. In this way, a trading strategy can also help a trader to manage their risk, identify buy and sell signals in the market and set reasonable take-profit and stop-loss levels with aim of positive risk to reward ratios.

What Factors Affect the Price of Copper?

US Dollar

Like many other metals, copper is inversely correlated (see chart below) to the US Dollar which means that when the US Dollar depreciates, copper prices generally rise and vice versa. It is important to note that this relationship is not one-to-one (delta 1) but does carry a high degree of correlation.

The reason why the US Dollar is an influencing factor on copper is because copper is priced in USD. For example, when the Dollar falls, a buyer will have to pay fewer of his/her domestic currency to purchase a specified amount of copper. Therefore, the commodity (copper) becomes cheaper to buy. This tends to cause an increase in demand and ultimately a rise in the price of copper.

Copper and USD chart inverse correlation representation:

Oil

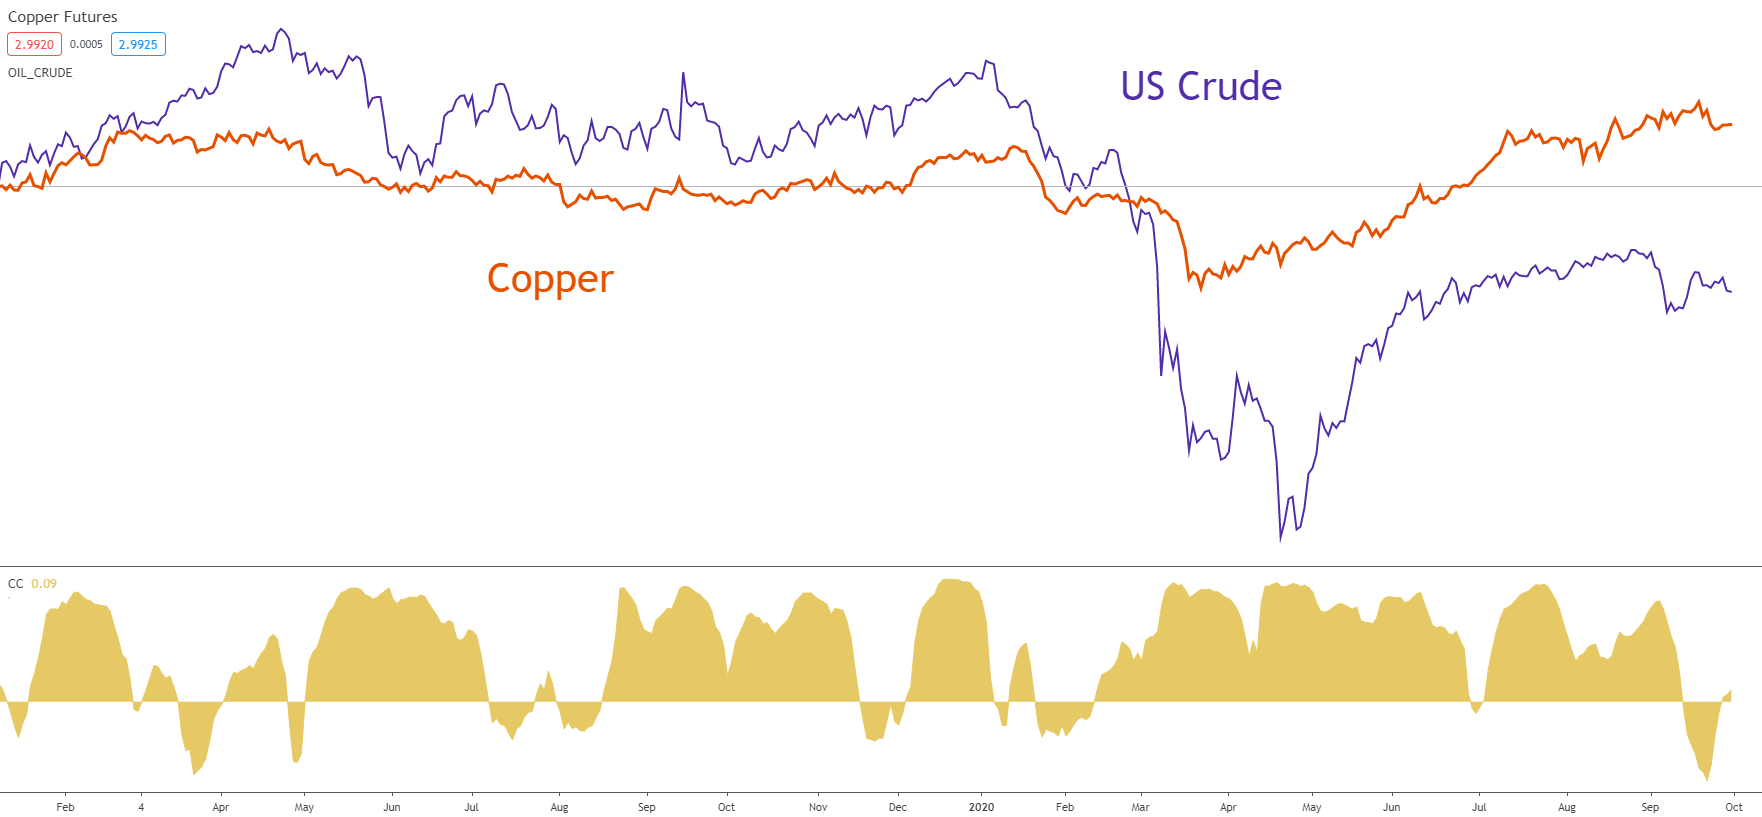
The refining of copper involves melting down the metal to remove impurities. This process is extremely energy exhaustive and accounts for a large portion of overall cost. Oil prices tend follow a similar trajectory to copper (see chart below). This being said, oil prices are affected by many of the same factors as copper which could support the traditional positive relationship. Regardless of specifics it is clearly noticeable that a relationship exists between both copper and oil, which could provide valuable insight into the copper market. Renewable energy sources are growing in popularity which could interrupt the historical price dynamic between copper and oil.
Copper as a Barometer for Global Growth

Copper is often linked to industrial growth and therefore overall economic growth. Infrastructure, manufacturing and construction now play a huge role in economic expansion which heavily relies on copper. Consumption (demand) for copper tends to reflect in the price of copper as an increase in demand is generally followed by an increase in copper price and vice versa. Copper is broadly regarding as the king amongst base metals as it is the most widely used metal in growing both emerging market and established economies.

The general economics of supply and demand are observed which can be used as a rule of thumb when trading copper:

  • Increase in supply ↔ Lesser demand
  • Decrease in supply ↔ Higher demand

A major influence on the demand/supply of copper comes via China. China is the single biggest buyer of copper in the world. Although China has mines of its own, Chinese demand requires additional supply which is sourced from other major copper producing countries. This is why the Chinese economy is such an important factor to consider when trading copper. If China continues on its growth trajectory, one can expect sustained demand for copper (see chart below). It is important to note that China is determined on being self-sufficient in the long-term which could disrupt future supply/demand dynamics.

Copper and FTSE China A50 chart positive correlation representation:

Copper supply and production costs

Copper mining is primarily focused within South America which can have a large bearing on the price of copper. Shortage of supply, quality of copper and the variations in production costs can all have resultant impacts on price. This leads on to country specific risk which can affect supply due to political instability or work related issues.

In mid 2018, Chilean (worlds largest copper producer) copper workers declared they would strike unless their increased wage demands were met. This significantly manipulated copper prices as the threat of a supply shortage may ensue, causing a surge to multi-year highs at the time (see chart below).

Copper price reaction to Chilean copper strike:

Copper as an Investment

Copper has historically been regarded as a commodity without many investment benefits. The majority of copper trading was executed as a hedge against future price fluctuations to lock in a specific price. This has changed over the past few decades as speculative traders have increased their impact on copper prices. Large institutions and hedge funds have increased their stake in copper as an investment which is highly correlated to economic growth. For example, a fund manager bullish on economic growth may also be bullish on copper. There may be some cyclicality to this, and could be a good diversification tool away from traditional alternatives.

Trading Copper: Strategies

Copper’s versatility and dependency on various fundamental factors create a diverse combination in terms of trading strategies. Trading strategies can be purely technical, fundamental or a combination of both. Understanding how the technical and fundamental components work both individually and in unison with one another can lead to a comprehensive copper trading strategy.

Technical Strategy example:

The example below incorporates several technical analysis techniques to derive a trading decision. It is important to note that this is only one of various approaches that can be implemented into a technical strategy.

To learn more on alternative technical trading strategies, visit our DailyFX education center!

The weekly copper chart above uses price action, support and resistance and a technical indicator to determine a possible setup in copper. The Fibonacci retracement drawing is taken from the January 2016 low to the June 2018 high. This drawing has resulted in several support and resistance zones. It is clear that several of these zones are areas of confluence to which price adheres/respects.

The $1.93 per pound low (black) was a significant level of support as price approached in March 2020. From a technical perspective, as price moved toward the 2016 low the inclination would be to buy if price did not break through the $1.93 support zone.

The Relative Strength Index (RSI) supported this rationale with an oversold signal below the 30 level (blue). Combining these two simple techniques gave a stronger motivation for a long position. In this case, a long trade would have been successful as price reversed into the current medium-term upward trend.

Fundamental Strategy example:

Becoming familiar with the fundamental levers involved in copper trading will allow for appropriate trading strategies to follow. The daily chart above shows the impact of the global COVID-19 pandemic and its influence on copper.

Reverting back to the factors affecting copper, it is well-known that copper is highly correlated (positive) with economic growth. Therefore, a disruption in economic growth should in theory, disrupt supply and demand subtleties. With the global pandemic ensuing at the start of 2020, it is sensible to forecast a slump in economic growth as the virus spreads around the globe.

 As expected, a decline in economic growth was realized with copper following suit. From January 2020 to mid March 2020, copper prices fell roughly 30% due to the COVID-19 pandemic. This is one such scenario whereby understanding the dynamics of fundamentals in copper trading can result in prudent decision-making.

Fundamental and Technical Strategy example:

Utilizing both fundamental and technical analysis in a trading strategy requires more time but this extra effort may produce a superior model as it will include more input data. At the beginning of 2019 copper prices were trading at a one and a half year low due to trade tensions between the US and China along with a decrease in import volume by the Chinese. However, as trade tensions fizzled out with support from a weaker US Dollar copper prices appreciated over the next few months.
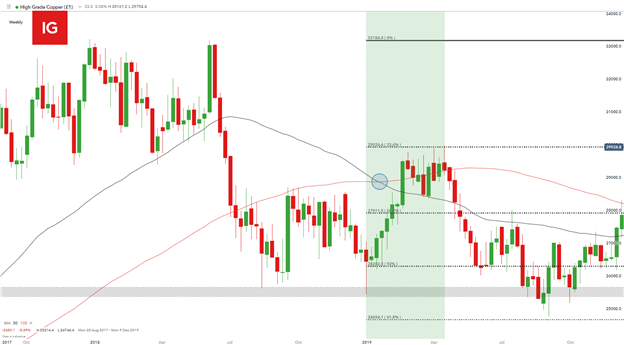
Managing these complexities from a trading perspective may start with a basic technical set up beginning with a simple Fibonacci retracement. The Fibonacci drawing above was taken from the January 2016 low to the June 2018 high as used in the prior technical example. Using the Fibonacci alone reveals that the 50% $2.62 per pound zone is a key area of support at the start of January. At this point, there is no directional bias as fluctuates around this support zone.

This is where fundamental factors play an integral role in trading copper. Market participants who follow macroeconomic events such as the US-China trade talks would be aware of decreased volatility and intensity around the topic as it slowly dissolved. With this knowledge supplemented by a dwindling USD, the likelihood of copper prices rising in the near term would gain more traction. With prices respective of the 50% $2.62 per pound Fibonacci level, and the bullish macroeconomic environment, a copper trader may look to enter into a long position from this support zone in anticipation of an upward price move.

Stop losses could have been placed at the recent swing low around the $2.54 – $2.56 support zone (black) for more risk seeking traders or the 50% $2.62 level for more risk averse traders. Risk management is key to any strategy and should be practiced consistently and appropriately to ensure sensible trading.

The next level of resistance would have been the 38.2% $2.79 per pound Fibonacci level whereby traders may look to exit long positions and look for possible reversals or an extension of the already strong bullish move. In this case, the Moving Average (MA) indicator was useful as the 50-day MA (red) crossed above the 100-day MA (black) which is suggestive of a bullish price movement. This crossover appeared in mid January 2019 and with sustained supportive macroeconomic conditions, copper prices extended further. Additional data inputs such as the bullish MA crossover can give traders the information required to select a focused trade.

3 Things I Wish I Knew When I Started Trading Forex

3 Things I Wish I Knew When I Started Trading Forex

Everyone comes to the forex market for a reason, ranging between solely for entertainment to becoming a professional trader. I started out aspiring to be a full-time, self-sufficient forex trader. I had been taught the ‘perfect’ strategy. I spent months testing it and backtests showed how I could make $25,000-$35,000 a year off of a $10,000 account. My plan was to trade forex for a living and let my account compound until I was so well off, I wouldn’t have to work again in my life. I was dedicated and I committed myself to the plan 100%.

Sparing you the details, my plan failed. It turns out that trading 300k lots on a $10,000 account is not very forgiving. I lost 20% of my account in three weeks. I didn’t know what hit me. Something was wrong. Luckily, I stopped trading at that point and was fortunate enough to land a job with a forex broker. I spent the next couple of years working with traders around the world and continued to educate myself about the forex market. It played a huge role in my development to be the trader I am today. Three years of profitable trading later, it’s been my pleasure to join the team at DailyFX and help people become successful or more successful traders.

The point of me telling this story is because I think many traders can relate to starting off in this market, not seeing the results that they expected and not understanding why. These are the three things I wish I knew when I started trading Forex.

1) Forex is not a get rick quick opportunity

Contrary to what you’ve read on many websites across the web, Forex trading is not going to take your $10,000 account and turn it into $1 million. The amount we can earn is determined more by the amount of money we are risking rather than how good our strategy is. The old saying “It takes money to make money” is an accurate one, Forex trading included.

But that doesn’t mean it is not a worthwhile endeavor; after all, there are many successful Forex traders out there that trade for a living. The difference is that they have slowly developed over time and increased their account to a level that can create sustainable income.

I hear about traders all the time targeting 50%, 60% or 100% profit per year, or even per month, but the risk they are taking on is going to be pretty similar to the profit they are targeting. In other words, in order to attempt to make 60% profit in a year, it’s not unreasonable to see a loss of around 60% of your account in a given year.

“But Rob, I am trading with an edge, so I am not risking as much as I could potentially earn” you might say. That’s a true statement if you have a strategy with a trading edge. Your expected return should be positive, but without leverage, it is going to be a relatively tiny amount. And during times of bad luck, we can still have losing streaks. When we throw leverage into the mix, that’s how traders attempt to target those excessive gains. Which in turn is how traders can produce excessive losses. Leverage is beneficial up to point, but not when it can turn a winning strategy into a loser.

2) Leverage can be a winning strategy to lose money

This is a lesson I wish I had learned earlier. Excessive leverage can ruin an otherwise profitable strategy.

Let’s say I had a coin that when heads was hit, you would earn $2, but when tails was hit, you would lose $1. Would you flip that coin? My guess is absolutely you would flip that coin. You’d want to flip it over and over. When you have a 50/50 chance between making $2 or losing $1, it’s a no-brainer opportunity that you’d accept.

Now let’s say I have the same coin, but this time if heads is hit, you would triple your net worth; but when tails was hit, you would lose every possession you own. Would you flip that coin? My guess is you would not because one bad flip of the coin would ruin your life. Even though you have the exact same percentage advantage in this example as the example above, no one in their right mind would flip this coin.

The second example is how many Forex traders view their trading account. They go “all-in” on one or two trades and end up losing their entire account. Even if their trades had an edge like our coin flipping example, it only takes one or two unlucky trades to wipe them out completely. This is how leverage can cause a winning strategy to lose money.

3) Using sentiment as a guide can tilt the odds in your favor

The 3rd lesson I’ve learned should come as no surprise to those that follow my articles… using the IG client sentiment tool (IGCS). I’ve written many articles about this topic. It’s the best tool I’ve ever used and is still a part of almost every trading strategy I am using, present day.

IGCS is a free tool that tells us how many traders are long compared to how many traders are short each major currency pair. It’s meant to be used as a contrarian index where we want to do the opposite of what everyone else is doing. Using it as a direction filter for my trades has turned my trading career completely around.

 Learn from my mistakes

If I could tell my younger self three things before I began trading forex, this would be the list I would give. Utlimately though, if you are just starting out in the forex market, the best thing you can do is take time to learn as much as you can, starting with the basics. Read guides, keep up to date with the latest news and follow market analysts on social media.

DAX Index: German Business Confidence and the ECB Press Conference

DAX Index: German Business Confidence and the ECB Press Conference

Overview of the DAX Performance on Wednesday

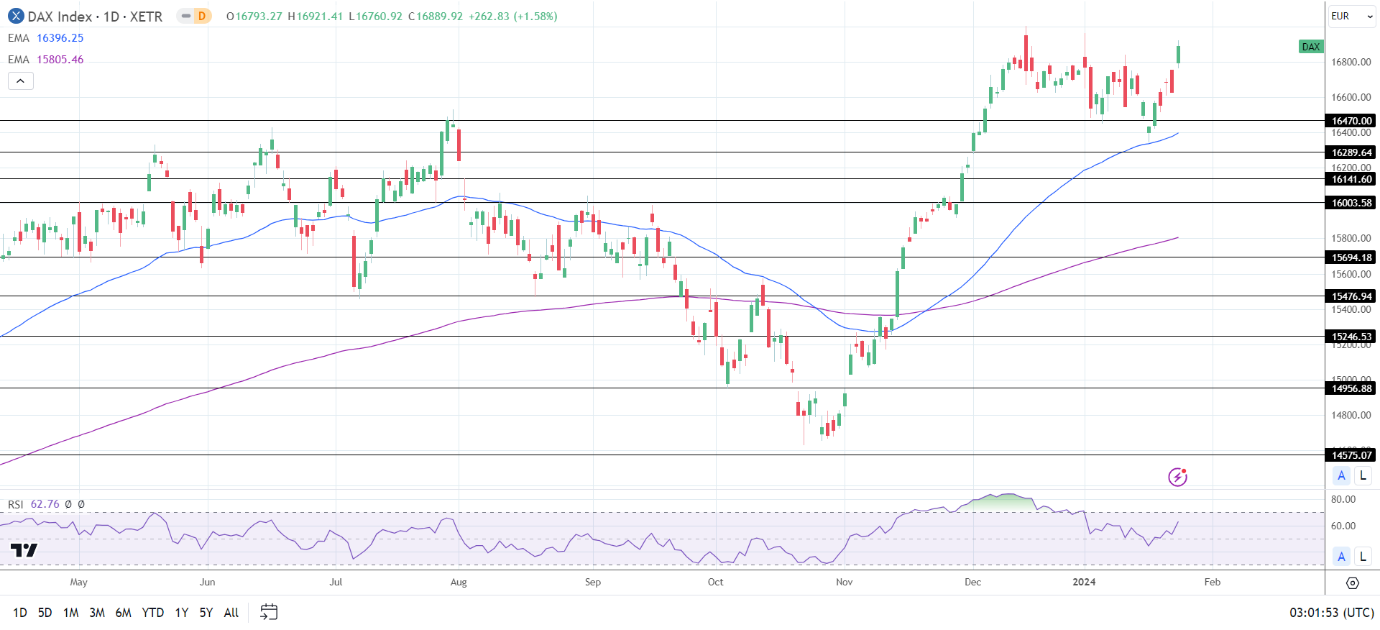
The DAX rallied 1.58% on Wednesday. Reversing a 0.34% loss from Tuesday, the DAX ended the session at 16,890.

German and Eurozone Private Sector PMIs and Corporate Earnings Impress

Ahead of the European session, news of the PBoC announcing a 0.5 percentage point cut to the Reserve Requirement Ratio set the tone. Beijing also said more stimulus measures are likely.

Improving manufacturing sector conditions across Germany and the euro area also supported the appetite for riskier assets.

The German Manufacturing PMI increased from 43.3 to 45.5, with the Eurozone Manufacturing PMI up from 44.4 to 46.6 in January.

German corporate earnings results supported the positive sentiment. Siemens Energy AG and SAP delivered strong results, fueling investor appetite for DAX-listed stocks.

US Services PMI Signals a Robust US Economy

On Wednesday, US private sector PMIs supported buyer appetite for DAX-listed stocks. The all-important US services PMI increased from 51.4 to 52.9 in January.

The US equity markets responded to the US economic indicators. On Wednesday, the Nasdaq Composite Index and S&P 500 ended the day up 0.36% and 0.08%, respectively. The Dow fell by 0.26%.

The Wednesday Market Movers

Siemens Energy AG and SAP led the way, surging 8.62% and 7.63%, respectively.

However, the auto sector had a mixed session with Tesla Inc. (TSLA) earnings in focus. Volkswagen gained 1.95%, with Porsche rising by 1.29%. Mercedes Benz Group ended the day up 0.85%, while BMW slipped by 0.01%.

Adidas ended the day in negative territory, falling 0.68%. Investors reacted to Puma warning of the effects of the Argentina currency devaluation on earnings. Puma shares plummeted 10.45% on Wednesday.

German Business Sentiment and the ECB

On Thursday, the German Ifo Business Climate Index will draw interest early in the European session. Economists forecast the Index to increase from 86.4 to 86.7 in January.

An improving business sentiment environment would support the buyer appetite for DAX-listed stocks. However, investors may wait for the ECB monetary policy decision and press conference before making decisive moves.

Economists expect the ECB to leave interest rates at 4.5%. However, there is market uncertainty about ECB plans to cut interest rates, putting the press conference in focus. We expect investors to react to forward guidance on the economy, inflation, and interest rates. A more hawkish-than-expected ECB rate path could impact buyer demand for DAX-listed stocks.

US Economic Calendar: Q4 GDP, Jobless Claims, and Corporate Earnings

On Thursday, US Q4 GDP and labor market numbers warrant investor attention. Better-than-expected GDP numbers and tighter labor market conditions could ease bets on a March Fed rate cut.

Economists forecast the US economy to expand by 2.0% in Q4 after growing by 4.9% in the third quarter. However, investors must consider contributions from consumer spending and trends in disposable income and inflation. Upward trends in disposable income and inflation could force the Fed to delay rate cuts. A delay to Fed rate cuts could affect the buyer appetite for riskier assets.

Amidst fluctuating bets on a March Fed rate cut, the weekly jobless claims could pressure the Fed to delay cutting rates. Economists forecast US initial jobless claims to increase from 187k to 200k in the week ending January 20.

Beyond the numbers, corporate earnings also need consideration. Visa Inc. (V) and Intel Corp. (INTC) are among the big names to release earnings results.

Short-term Forecast

Near-term trends for the DAX hinge on the ECB press conference and US inflation. A higher-for-longer ECB rate path and sticky inflation could pressure the DAX. However, investors must consider corporate earnings. Upbeat earnings results could counter immediate concerns about monetary policy and the economic outlook.

In the futures, the DAX and the Nasdaq mini were down 44 and 15 points, respectively. Investor apprehension about the ECB press conference likely influenced pre-European session trends.

DAX Technical Indicators

Daily Chart

The DAX held well above the 50-day and 200-day EMAs, sending bullish price signals.

A DAX break above the Wednesday high of 16,921 would give the bulls a run at the all-time high of 17,003.

On Thursday, German business sentiment, the ECB, the US economic calendar, and earnings need consideration.

However, a drop below the 16,750 handle would support a fall toward the 16,470 support level.

The 14-day RSI at 62.76 indicates a DAX return to the 17,000 handle before entering overbought territory.

DAX Daily Chart sends bullish price signals.
DAX 250124 Daily Chart

4-Hourly Chart

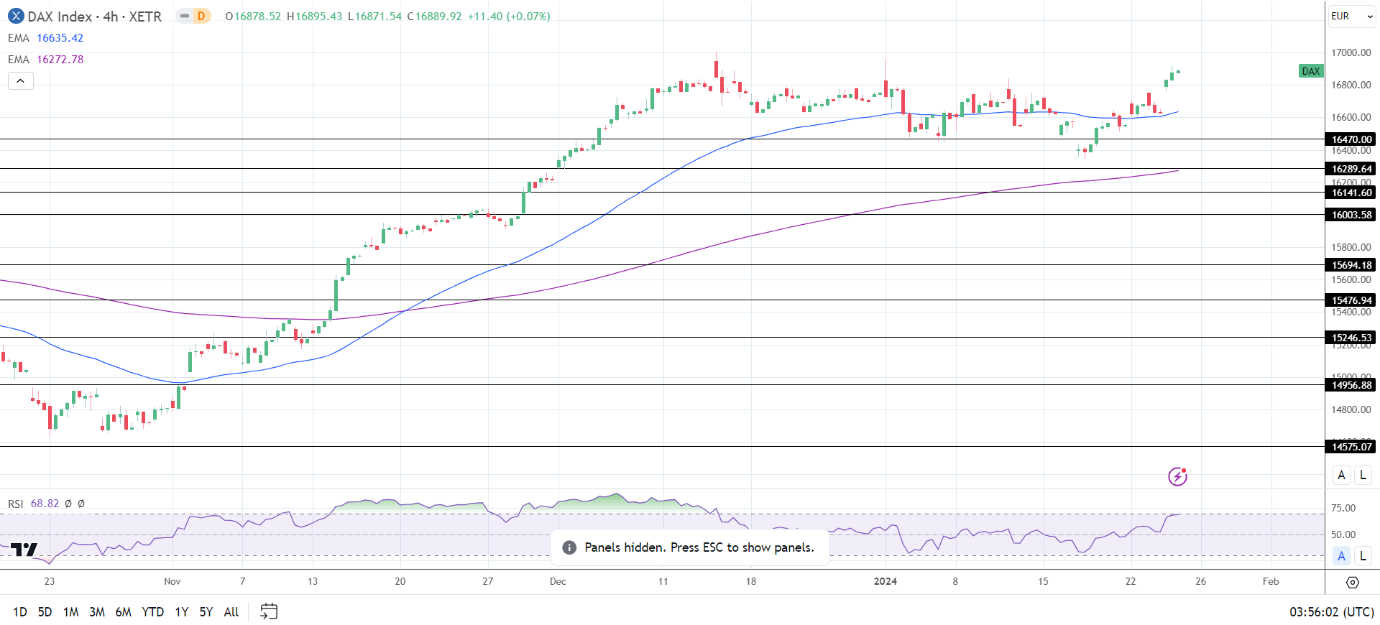
The DAX sat above the 50-day and 200-day EMAs, affirming the bullish price signals.

A DAX return to the 16,900 handle would bring the January high of 16,964 and the ATH 17,003 into play.

However, a break below the 16,800 handle would support a fall toward the 50-day EMA.

The 14-period 4-hour RSI at 68.82 indicates a DAX return to the 16,900 handle before entering overbought territory.

4-Hourly Chart affirms bearish price signals.
DAX 250124 4-Hourly Chart
Oil Prices Forecast: Boosted by US Stockpile Drop, China Stimulus

Oil Prices Forecast: Boosted by US Stockpile Drop, China Stimulus

Oil Market Gains Momentum

Crude oil is trading higher on Thursday, primarily driven by a significant drop in U.S. crude stockpiles the previous session.

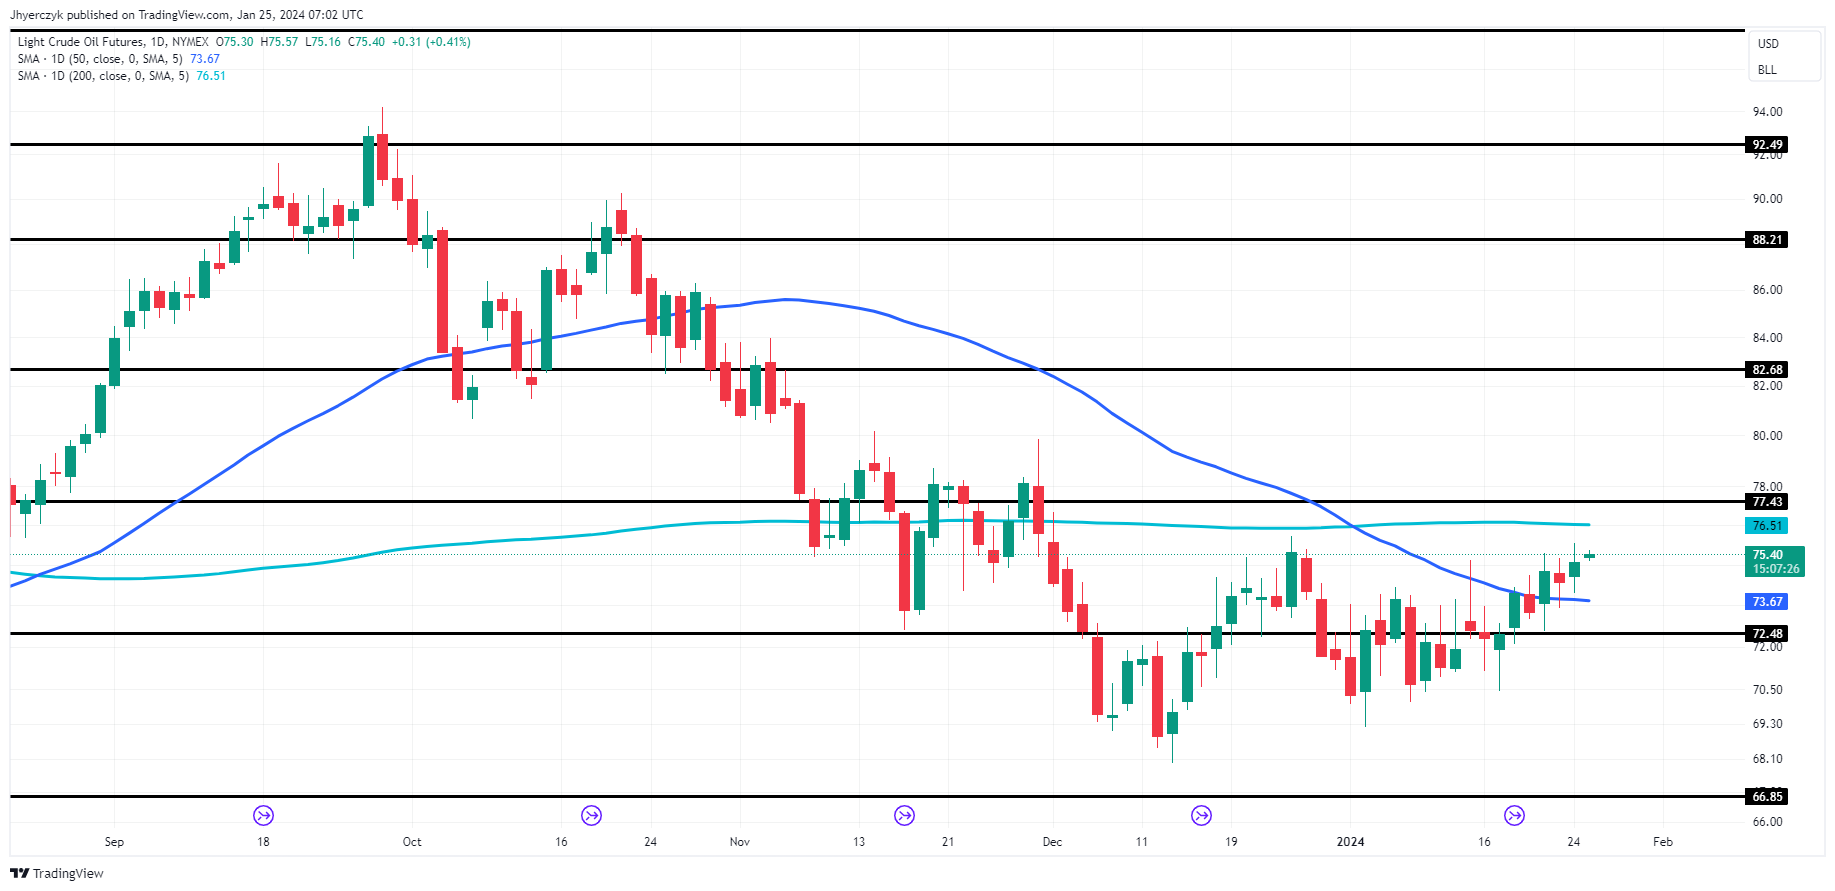
At 06:50 GMT, Light Crude Oil Futures are trading $75.40, up $0.31 or +0.41%.

US Stockpile Decline Fuels Rally

Data revealed by the Energy Information Administration (EIA) showed a staggering fall of 9.2 million barrels of crude oil last week. This figure substantially exceeded analysts’ expectations of a 2.2 million-barrel draw, as per a Reuters poll. The reduction in stockpiles was attributed to a decrease in U.S. crude imports and reduced output, which dipped to a five-month low of 12.3 million barrels per day, impacted by severe winter weather.

China’s Economic Measures Boost Confidence

Further bolstering the oil market was the optimism surrounding China’s economic recovery. The Chinese central bank’s recent decision to cut banks’ reserve ratios is expected to inject approximately $140 billion into the banking system. This move, coupled with China’s expanded scope for commercial property lending, is seen as a robust support measure for the economy and the struggling real estate sector, sparking hopes for increased oil demand.

Geopolitical Tensions and Middle East Uncertainty

Geopolitical dynamics in the Middle East continue to be a critical factor. While recent U.S. military actions in Yemen have heightened tensions, there has been no direct impact on crude oil supplies. Market analysts note that the anticipation of potential disruptions in oil flow has already been factored into prices.

Weak US Dollar and Economic Indicators

A dip in the U.S. Dollar also played a role in the oil price surge, as it makes the dollar-denominated commodity more attractive to foreign buyers. However, the focus now shifts to upcoming U.S. economic data, including the first reading of the fourth quarter GDP and the personal consumption expenditure (PCE) data, which are expected to influence the Federal Reserve’s interest rate decision and, by extension, crude oil demand.

Short-Term Outlook

Given the current market conditions, including the U.S. inventory draw, China’s economic policy measures, and the geopolitical landscape, the short-term outlook for oil markets appears bullish. However, traders will be closely monitoring the upcoming U.S. economic data and Federal Reserve decisions for further market direction.

Technical Analysis

Daily Light Crude Oil FuturesLight Crude Oil futures are up, riding the momentum from a solid close above the 50-day MA at $73.67. The focus now shifts to the 200-day MA, where sellers might step in on the initial test. A break above this, coupled with a push past $77.43 resistance, could fuel further upside activity.

The reaction at the 200-day MA will be crucial, as it may either pave the way for a stronger bullish trend or halt the current ascent. Traders are watching these levels closely for the next significant move in Light Crude Oil futures.

EUR/USD and GBP/USD Price Forecast: Focus on ECB Policy and US GDP Amid Market Fluctuations

EUR/USD and GBP/USD Price Forecast: Focus on ECB Policy and US GDP Amid Market Fluctuations

Dollar Index Steady as Markets Await US GDP and ECB Policy

On Thursday, the Dollar Index (DXY) is trading at 102.890, remaining mostly steady, as forex traders show hesitancy in taking positions ahead of the US GDP and ECB’s monetary policy decision.

In the Eurozone, recent PMI data presents a varied economic landscape. France’s Flash Manufacturing PMI at 43.2 and Services PMI at 45.0 suggest a contracting economy.

Germany mirrors this trend with its Manufacturing PMI at 45.4 and Services PMI at 47.6. The broader Eurozone Manufacturing PMI stands at 46.6, and Services PMI at 48.4, indicating ongoing challenges.

For the GBP, the Flash Manufacturing PMI reads at 47.3, while the Services PMI is more encouraging at 53.8. This data suggests a divergence in sectoral performance, with services outpacing manufacturing.

Events Ahead

The day ahead is packed with events that could sway currency markets. The German ifo Business Climate index, ECB’s refinancing rate, monetary policy statement, and press conference are critical for the EUR.

During the US session, focus will be particularly on the U.S. Advance GDP, which is anticipated at 2.0%, marking a slowdown from the previous 4.9%. These will likely shape the short-term trajectories of EUR/USD and GBP/USD.

US Dollar Index (DXY)

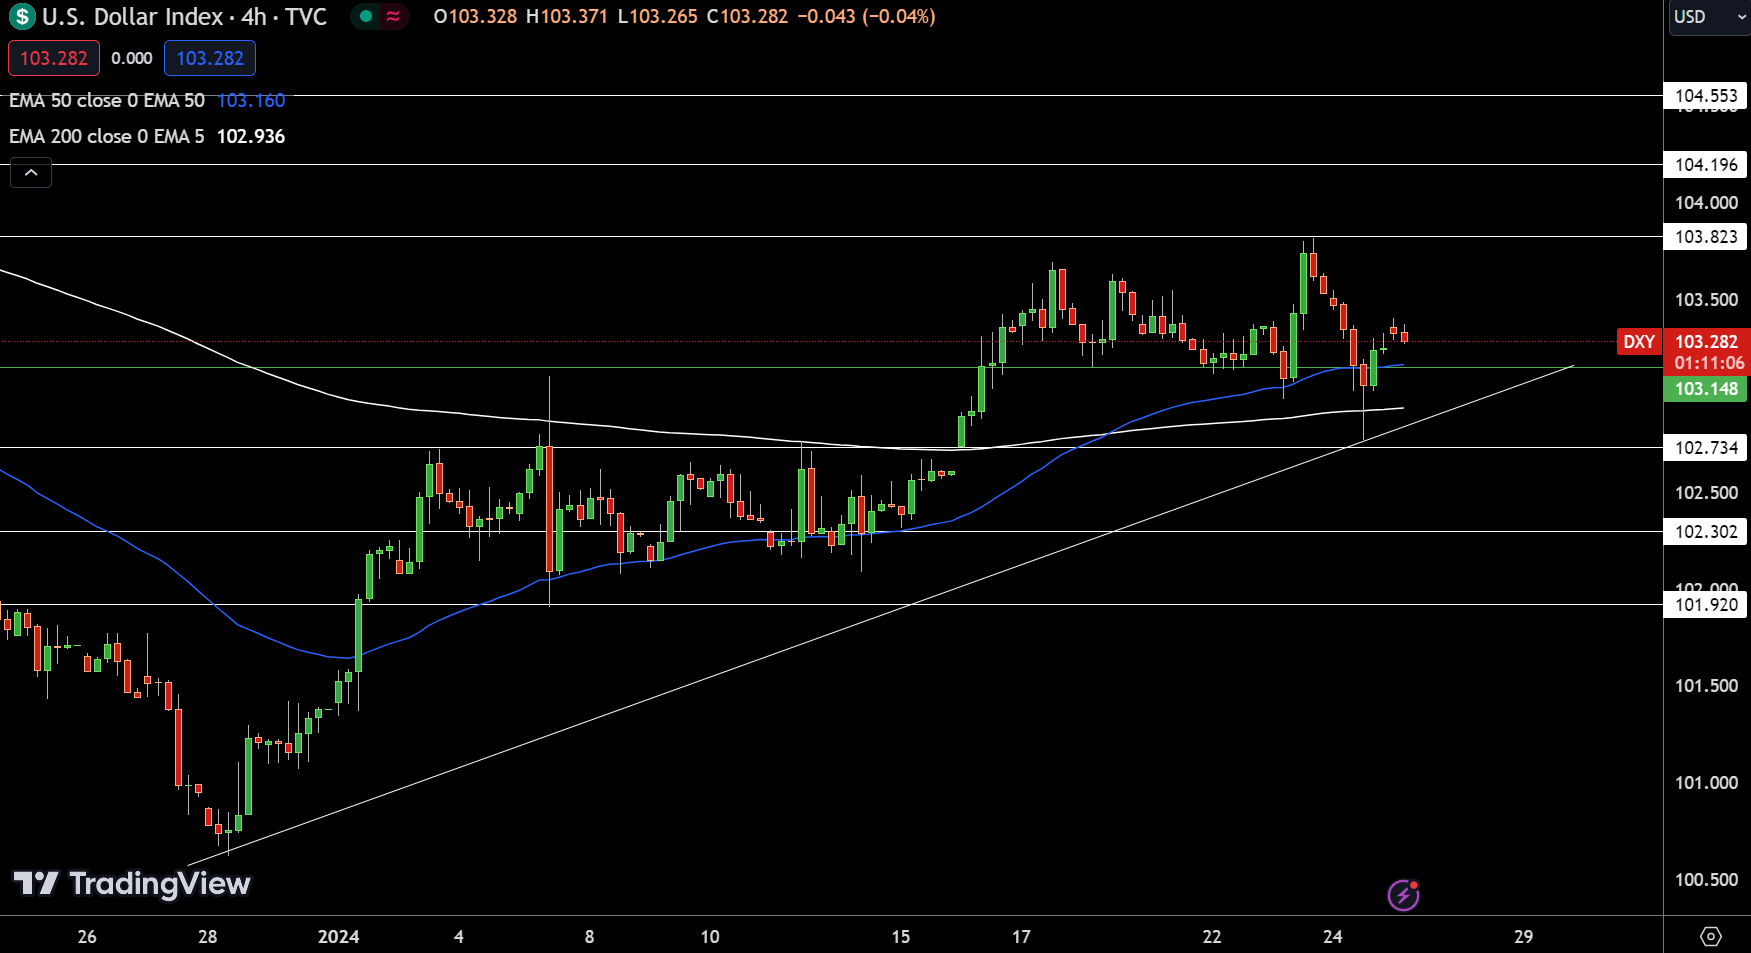
Dollar Index
Dollar IndexThe US Dollar Index is stable at 103.282, closely hovering around the pivot point of 103.148. It faces resistance at 103.823, 104.196, and 104.553, while support lies at 102.734, 102.302, and 101.920. The index’s alignment near the 50-Day and 200-Day EMAs suggests a balanced sentiment. Currently, the trend appears cautiously bullish above the pivot, but overall market signals remain mixed, awaiting further developments.

EUR/USD Technical Forecast

EUR/USD Price Chart - Source: Tradingview
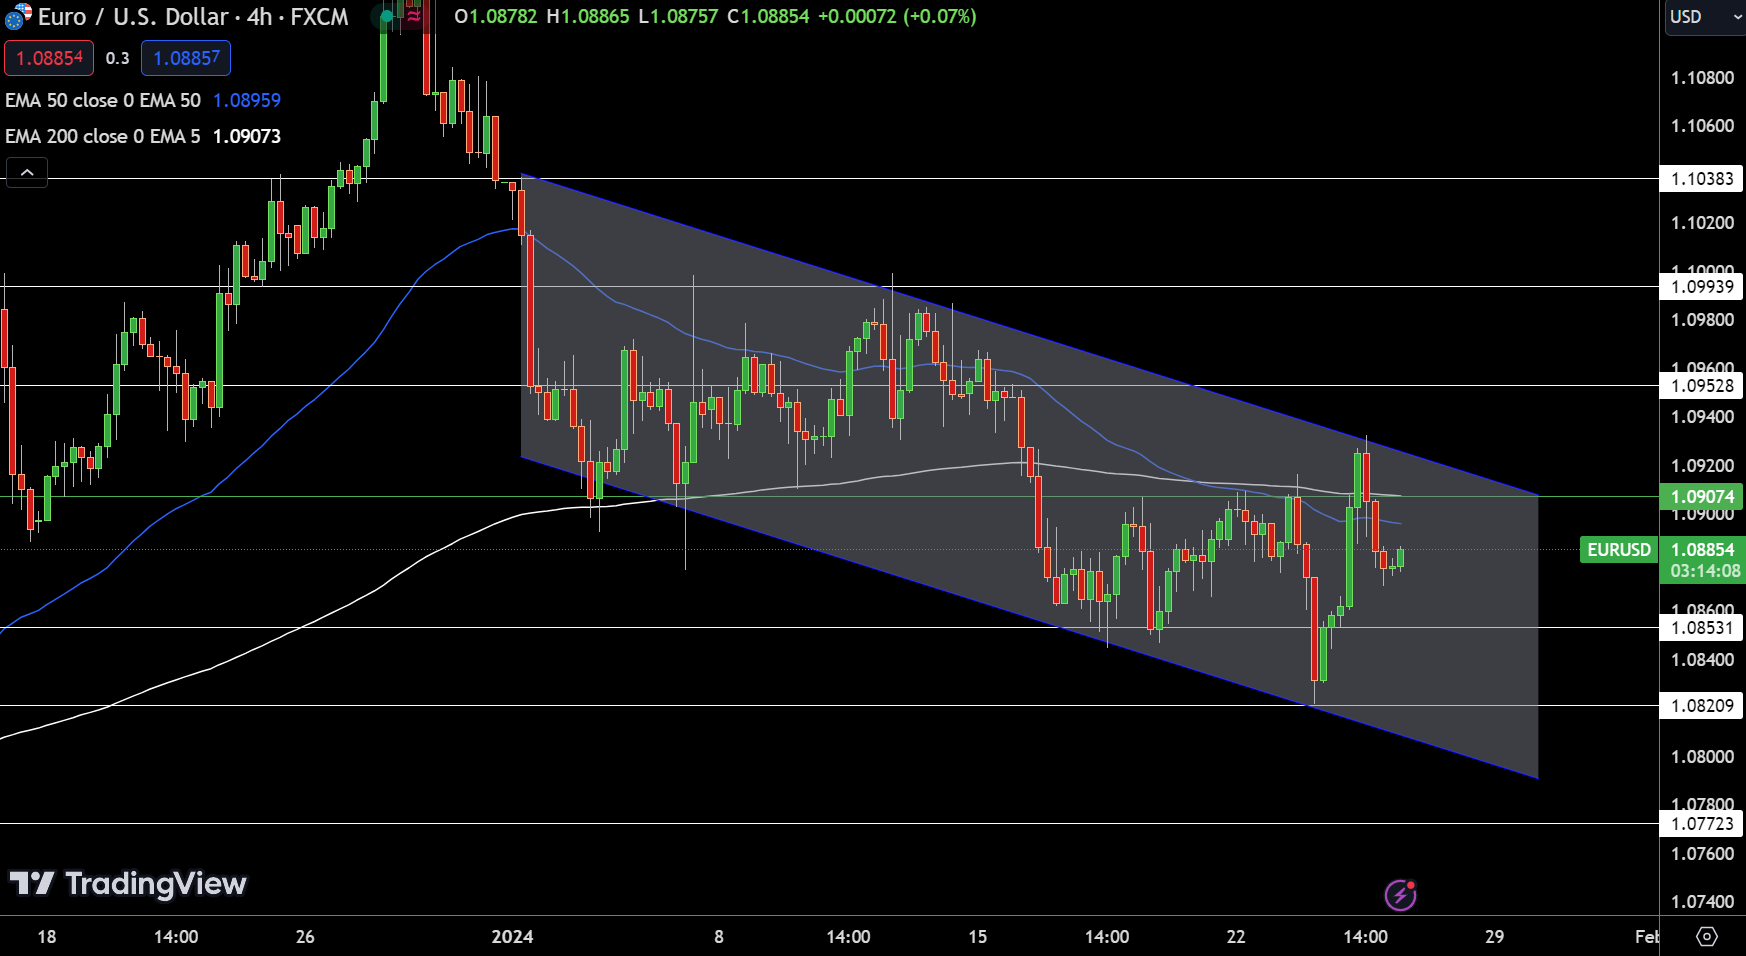
EUR/USD Price Chart – Source: TradingviewAs of January 25, the EUR/USD is experiencing a slight uptick, trading at 1.08854, marking a 0.04% increase. The currency pair orbits a pivot point at 1.09074, indicative of a potential shift in market direction.

Resistance levels are poised at 1.09528, 1.09939, and 1.10383, creating ceilings that may restrain any bullish momentum. Support levels, conversely, lie at 1.08531, 1.08209, and 1.07723, offering potential buffers against downward movements.

The pair’s positioning below both the 50-Day and 200-Day Exponential Moving Averages, at 1.08959 and 1.09073 respectively, suggests a bearish undertone. However, a morning star pattern on the 4-hour chart hints at possible buying interest.

Overall, the EUR/USD trend appears cautiously optimistic above 1.0870, yet remains susceptible to shifts influenced by external market factors and technical indicators.

GBP/USD Technical Forecast

GBP/USD Price Chart - Source: Tradingview
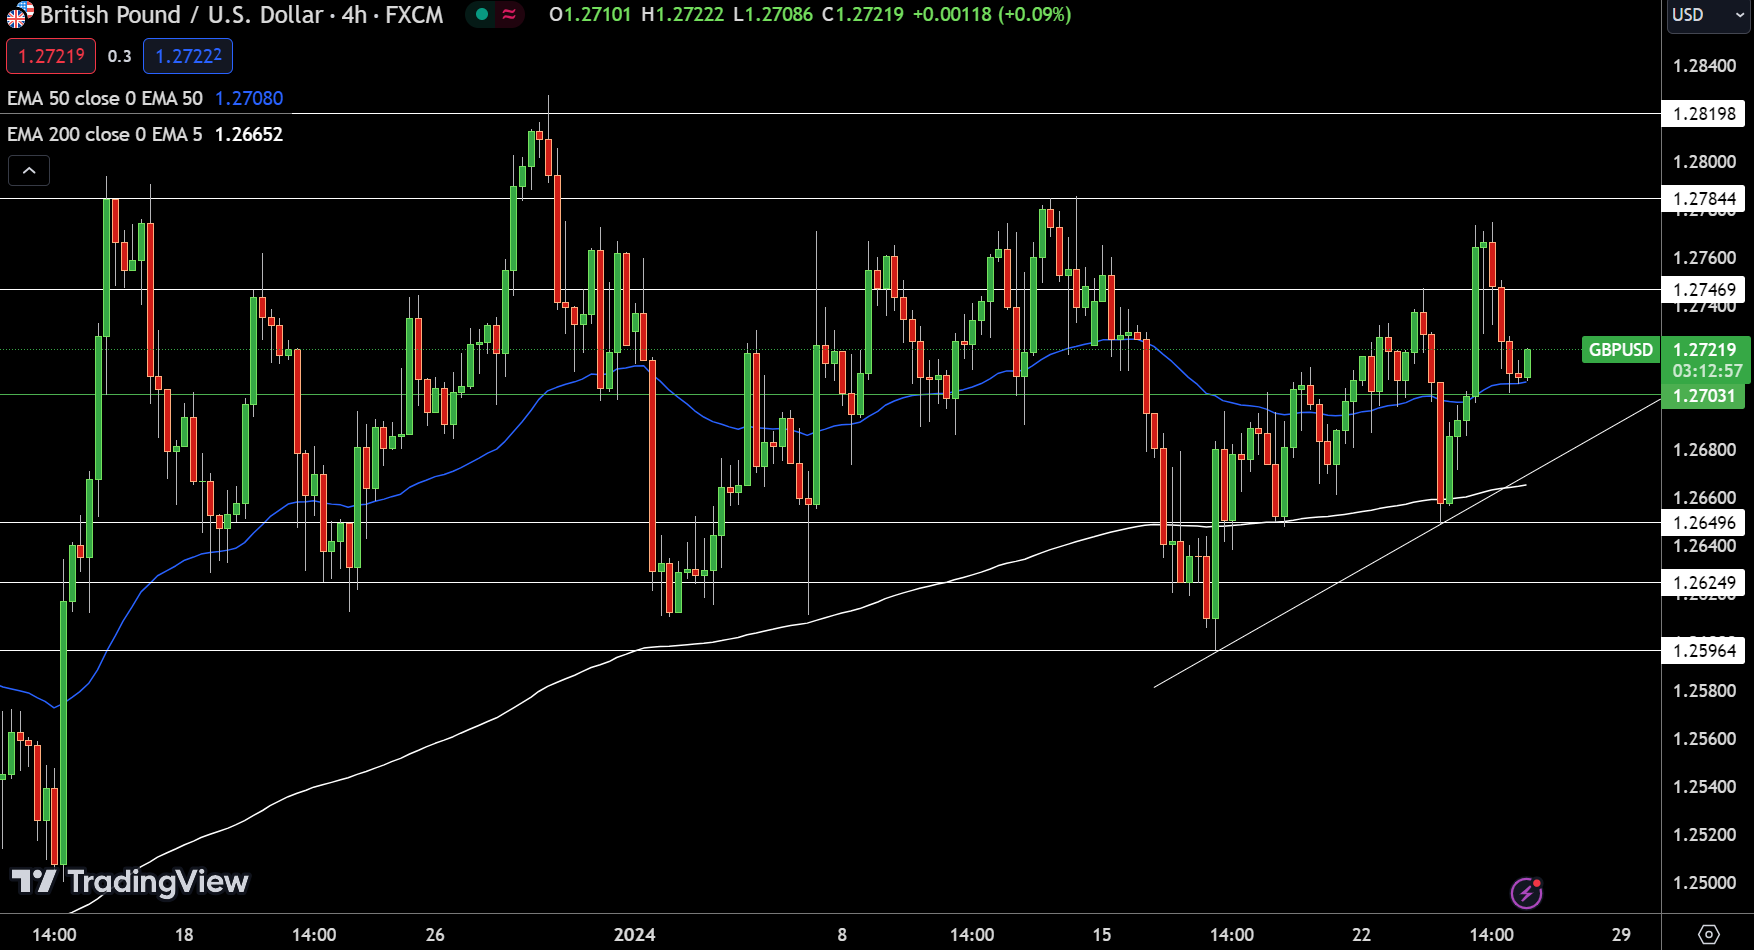
GBP/USD Price Chart – Source: TradingviewOn January 25, the GBP/USD pair saw a slight increase of 0.02%, trading at 1.27219. Currently hovering around the pivot point at 1.27031, the pair shows potential for further movement. The key resistance levels are set at 1.27469, 1.27844, and 1.28198, marking potential barriers for upward price action.

On the downside, support can be found at 1.26496, followed by 1.26249 and 1.25964, which could offer a buffer against any declines. Technical analysis reveals that the GBP/USD is garnering support near the 50-Day Exponential Moving Average (EMA) of 1.27080, slightly above the 200-Day EMA of 1.26652.

Notably, the pair has formed a morning star candlestick pattern on the four-hour timeframe, suggesting a bullish trend may be on the horizon, particularly if it stays above the pivot point. In conclusion, the technical outlook for GBP/USD appears to be bullish above the pivot point of $1.27031.

Hang Seng Index, ASX 200, Nikkei 225: Hang Seng Index Eyes 3-Day Winning Streak

Hang Seng Index, ASX 200, Nikkei 225: Hang Seng Index Eyes 3-Day Winning Streak

Overview of the Wednesday Session

On Wednesday, the Hang Seng Index enjoyed a two-day winning streak for the first time since December. The ASX 200 also ended the day in positive territory, while the Nikkei ended the session in negative territory.

Overnight US corporate earnings from Tuesday and gains for the Nasdaq Composite Index and S&P 500 set the tone for the Wednesday Asian session.

Johnson & Johnson (JNJ), Procter & Gamble Company (PG), Verizon Communications Inc. (VZ), General Electric (GE), and Netflix (NFLX) released earnings results. Netflix beat Q4 subscriber estimates, supporting an 8.18% rally in after-hours trading.

Corporate earnings countered an unexpected fall in the Richmond Fed Manufacturing Index.

On Tuesday, the Nasdaq Composite Index and S&P 500 rose by 0.43% and 0.29%, respectively. However, the Dow ended the session down 0.25%.

The Asian economic calendar influenced market risk sentiment.

Australia’s private sector PMI numbers showed a better economic environment in January. The Manufacturing PMI increased from 47.6 to 50.3, and the Services PMI rose from 47.1 to 47.9.

However, numbers from Japan sent mixed signals. The trade balance rose from a ¥780.4 billion deficit to a ¥62.1 billion surplus. Exports increased by 9.8% year-over-year in December, while imports declined by 6.8%. Service sector activity picked up in the New Year. The Jibun Services PMI increased from 51.5 to 52.7, supporting bets on an April Bank of Japan pivot from negative rates.

Away from the economic calendar, stimulus measures from Beijing supported buyer appetite for Hang Seng-listed stocks and Australian mining stocks. On Wednesday, the PBoC stated it would cut the Reserve Requirement Ratio by 0.5 percentage points on February 5.

However, a weaker USD/JPY pressured the Nikkei Index.

US Earnings, China, and the RBA in Focus

On Thursday, overnight US corporate earnings, US private sector PMIs, and the US equity markets will likely influence the Asian session.

Tesla Inc. (TSLA) was among the big names to release earnings results on Wednesday. Tesla reported revenue and earnings misses but record deliveries. The missed revenue and earnings and governance issues left Tesla Inc. down 3.99% in after-hours trading.

US private sector PMIs beat forecasts, with the manufacturing sector returning to expansion. Significantly, the Services PMI unexpectedly increased from 51.4 to 52.9 in January.

On Wednesday, the Nasdaq Composite Index and S&P 500 gained 0.36% and 0.08%, respectively. The Dow declined by 0.26%.

However, the Asian economic calendar also warrants investor consideration. The RBA Bulletin will garner investor interest. The Bulletin could influence sentiment toward the RBA’s interest rate trajectory and the ASX 200. Beyond the economic calendar, BoJ chatter and stimulus updates from Beijing also need consideration.

On Thursday, the ASX 200 futures was up 18 points, while the Nikkei futures was down 20 points.

ASX 200

ASX 200 ended Wednesday in positive territory.
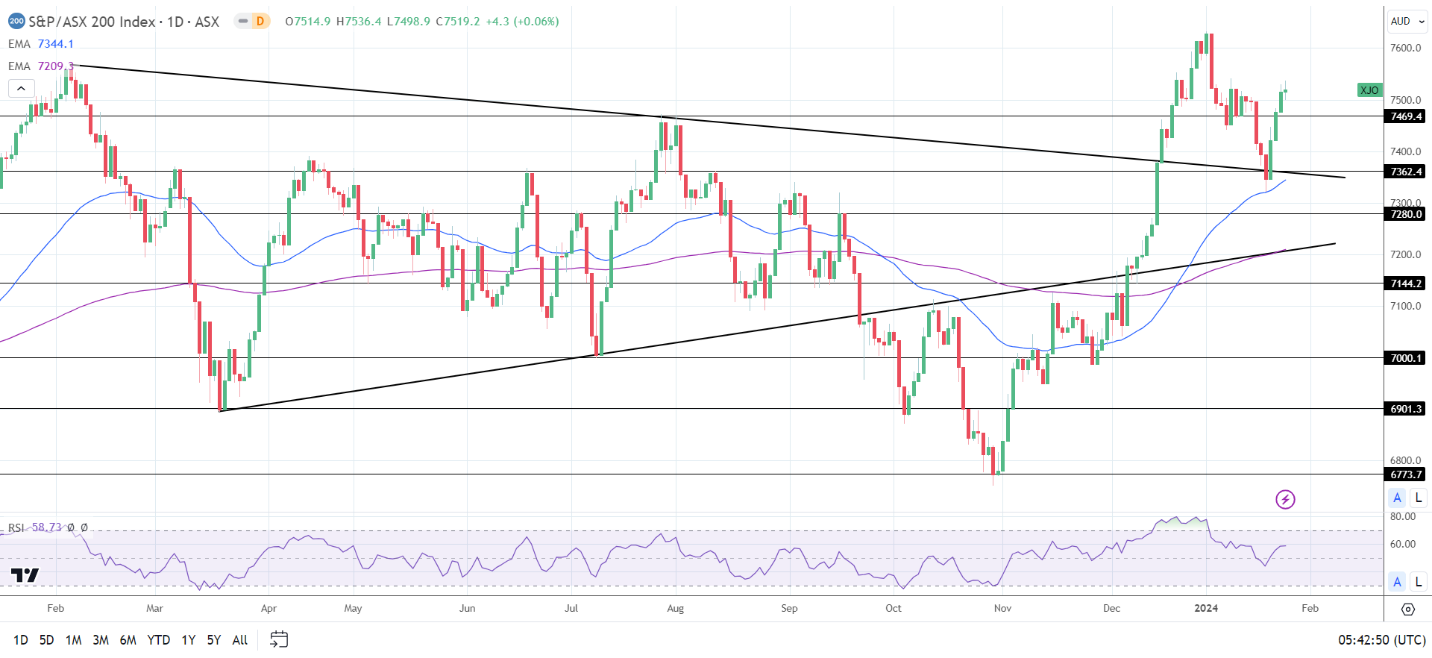
ASX200 250124 Daily ChartThe ASX 200 gained 0.06% on Wednesday. Gold and mining contributed to the gains. However, bank, oil, and tech stocks limited the upside. On Wednesday. the S&P ASX All Technology Index (XTX) declined by 0.72%.

Gold (XAU/USD) and mining stocks ended the session in positive territory.

Northern Star Resources Ltd. (NST) and Evolution Mining Ltd. increased by 6.04% and 1.96%, respectively. Fortescue Metals Group Ltd. (FMG) rose by 1.21%. BHP Group Ltd (BHP) and Rio Tinto Ltd. (RIO) ended the day up 1.21% and 0.95%, respectively.

However, bank and oil stocks ended the session in negative territory.

Commonwealth Bank of Australia (CBA) and Westpac Banking Corp. (WBC) fell by 0.83% and 0.34%, respectively. ANZ Group Holdings Ltd (ANZ) and National Australia Bank Ltd. (NAB) declined by 0.11% and 0.19%, respectively.

Woodside Energy Group Ltd (WDS) and Santos Ltd (STO) ended the day down 0.39% and 0.52%, respectively.

Hang Seng Index

Hang Seng Index rallied on Wednesday.
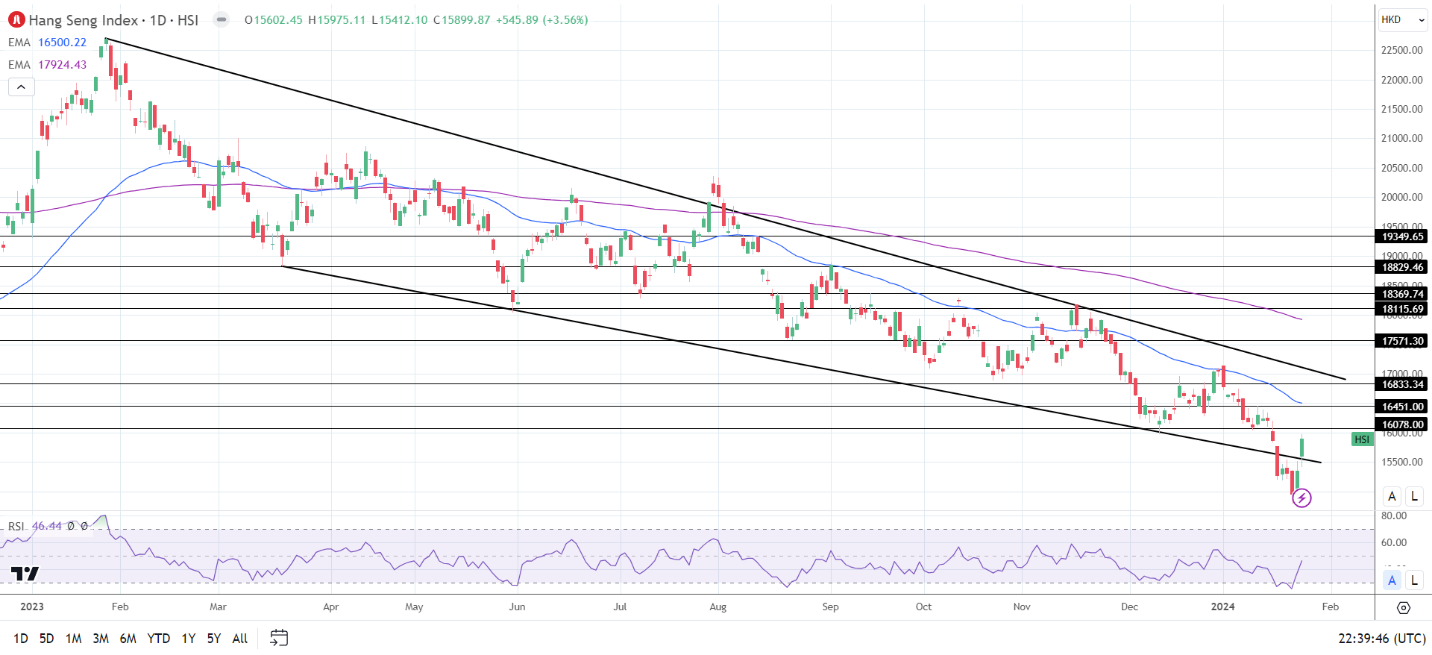
HSI 250124 Daily ChartThe Hang Seng Index rallied 3.56% on Wednesday. Real estate and tech contributed to the gains. The Hang Seng Mainland Properties Index (HSMPI) and the Hang Seng Tech Index (HSTECH) ended the day up 3.64% and 4.24%, respectively.

Alibaba (9988) surged 7.32% on news of co-founders Jack Ma and Joe Tsai acquiring over $200 million in shares. Tencent (0700) ended the day up 3.60%.

Bank stocks also ended the session in positive territory. HSBC (0005) gained 1.27%. China Construction Bank (0939) and Industrial Commercial Bank (1398) rallied 3.85% and 3.60%, respectively.

The Nikkei 225

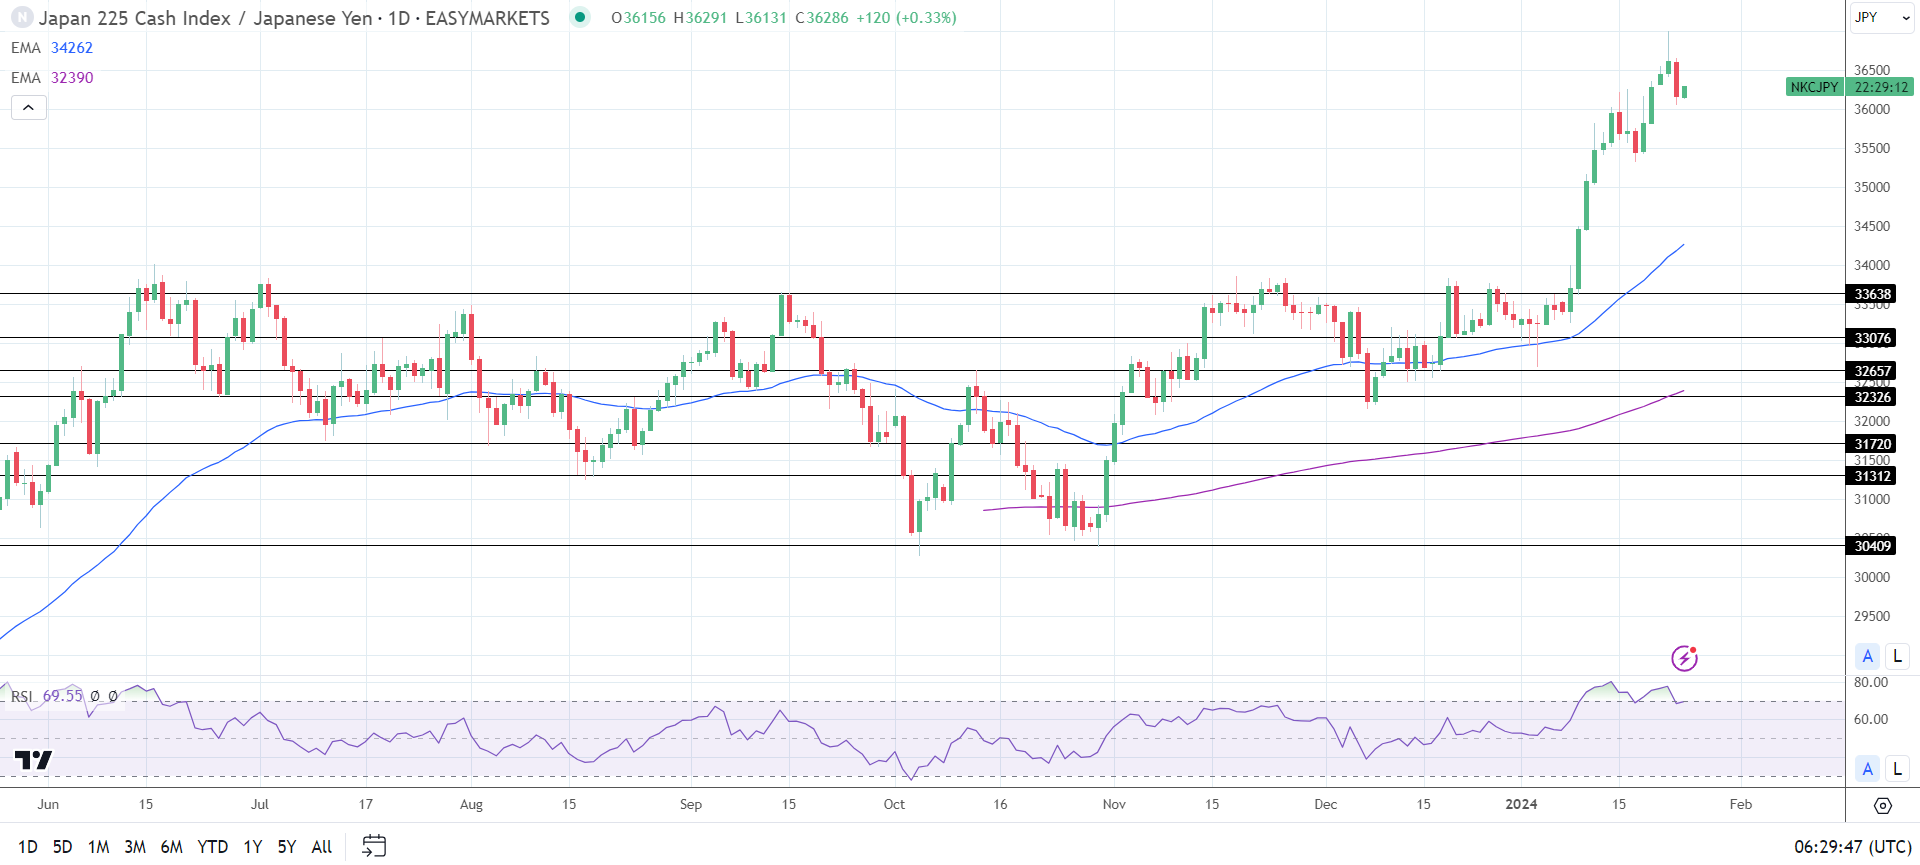
Nikkei saw red on Wednesday.
Bank stocks ended the session in positive territory. Sumitomo Mitsui Financial Group Inc. (8316) and Mitsubishi UFJ Financial Group Inc. (8306) rallied 4.01% and 5.25%, respectively.However, the main components of the Nikkei had a mixed session. KDDI Corp. (9433) and Fast Retailing Co. Ltd. (9983) fell by 1.42% and 1.56%, respectively.

Sony Group Corp. (6758) declined by 1.09%, while Softbank Group Corp. (9948) and Tokyo Electron Ltd. (8035) bucked the trend, gaining 0.36% and 0.62%, respectively.

XRP News: Ripple Files a New Motion in the Ongoing Legal Battle with the SEC

XRP News: Ripple Files a New Motion in the Ongoing Legal Battle with the SEC

The Wednesday Overview

On Wednesday, XRP gained 0.06%. Partially reversing a 1.63% loss from Tuesday, XRP ended the session at $0.5184. Significantly, XRP ended the day in positive territory for only the second time in eight sessions.

SEC v Ripple Case: Ripple Files Motion to File a Sur-Reply

Activity in the ongoing SEC v Ripple case drew investor interest overnight. On Wednesday, Ripple filed a motion to file a Sur-Reply relating to the SEC’s Motion to Compel.

The SEC filed a Motion to Compel on January 11, asking the court to order Ripple to provide,

Ripple opposed the Motion to Compel on January 19. The Sur-Reply is an additional response to the SEC’s Motion to Compel. Ripple will have further arguments to persuade the court to deny the SEC’s Motion to Compel.

If Judge Torres grants the motion for a Sur-Reply, investors must wait longer for the court ruling on the SEC’s Motion to Compel. Judge Torres could call for a court session to hear oral arguments about the motions before delivering a court ruling.

The Motion to Compel relates to Ripple breaching Section 5 of the 1933 Securities Act by selling unregistered securities to institutional investors. In July, Judge Analisa ruled that Ripple should have registered XRP as a security when selling to institutional investors.

The SEC v Ripple case is in its final stages. After completing remedies-related discovery, the SEC and Ripple must file remedy-related briefs. Ripple and the SEC must complete remedies-related discovery by February 12.

After remedies-related discovery, the parties will present arguments for and against a punitive penalty for breaking US securities laws. According to the Court Briefing Schedule,

After losing to Ripple in the Programmatic Sales ruling, the SEC will want Ripple to face a punitive penalty.

US Case Law and SEC Plans to Appeal Against the Programmatic Sales Ruling

The SEC may have requested the documents to ascertain if Ripple continued breaching Section 5 of the 1933 Securities Act after filing charges in December 2020. A continued breach of securities laws could sway Judge Torres to deliver a more punitive penalty.

However, US case law could limit the damages. In Morrison v NAB, the Supreme Court ruled the SEC only has jurisdiction over XRP sales to US institutional investors. Additionally, Ripple can deduct expenses related to XRP sales to US institutional investors from the proceeds from XRP sales to US institutional investors.

If the total proceeds from the sale of XRP to all institutional investors was $770 million, the penalty could be less than Ripple’s legal bill.

The immediate focus remains on the final stages of the SEC v Ripple case. However, SEC plans to appeal against the Programmatic Sales of XRP ruling remains a headwind. Notably, the SEC v Terraform Labs ruling impacted confidence in the court upholding the Programmatic Sales ruling.

XRP Price Action

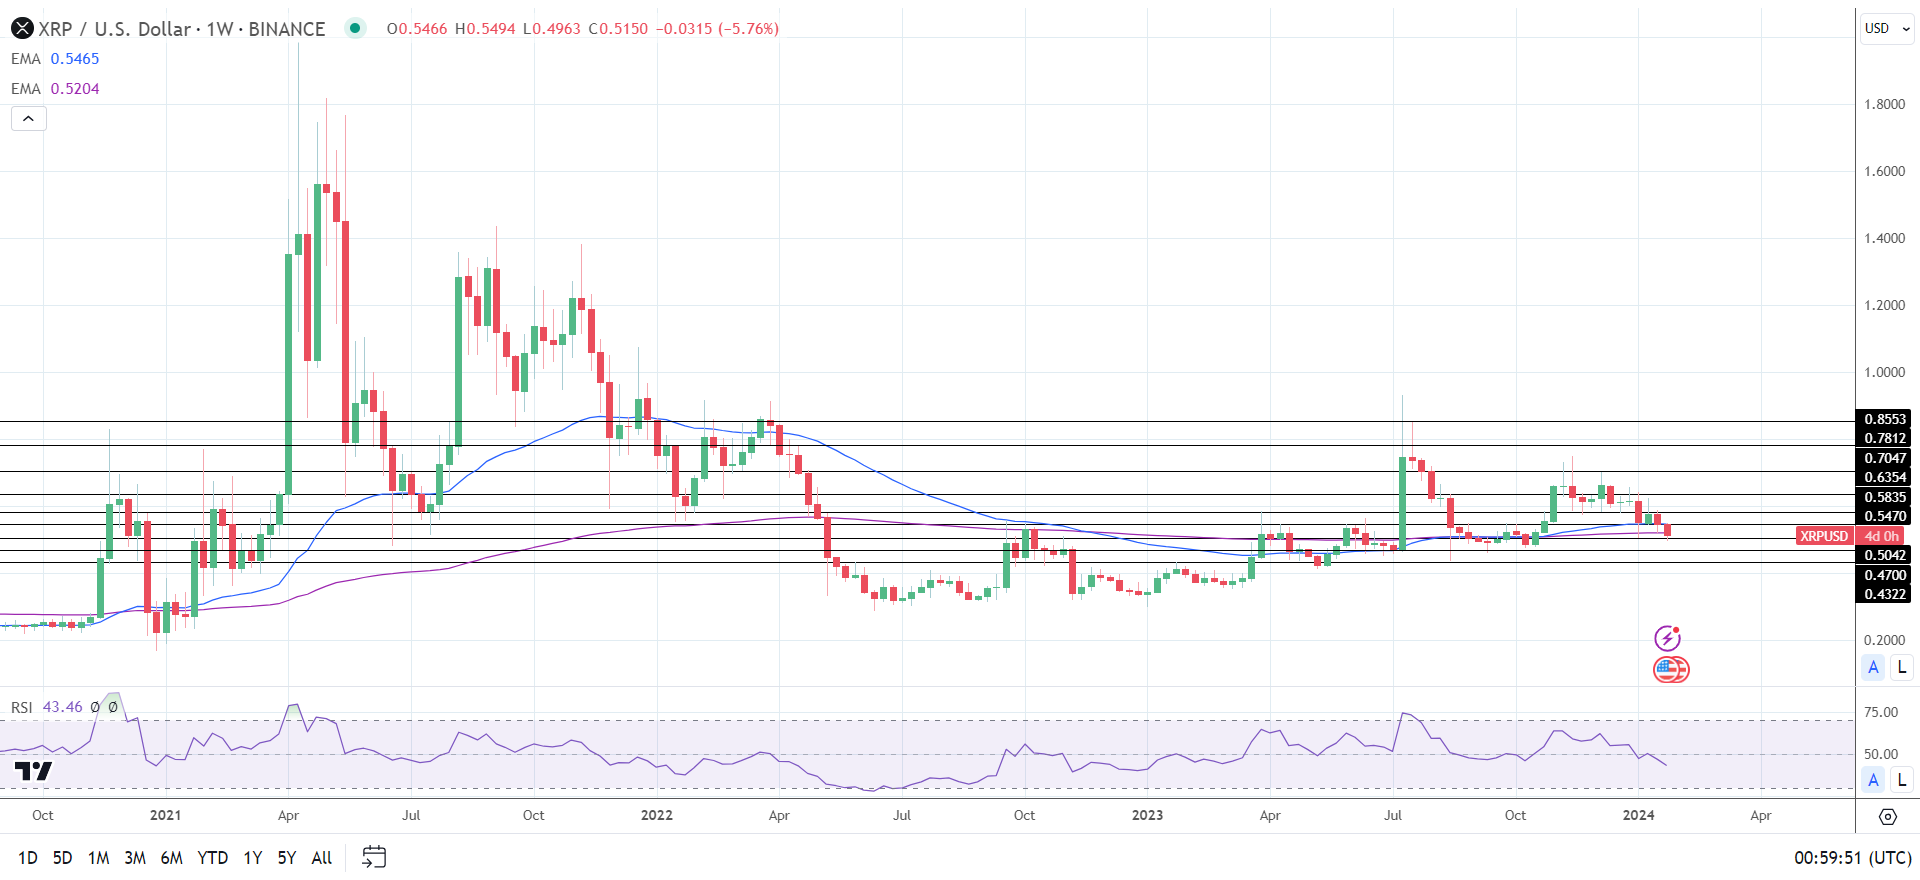
Weekly Chart sends a bearish price signal.
XRPUSD 250124 Weekly Chart

Daily Chart

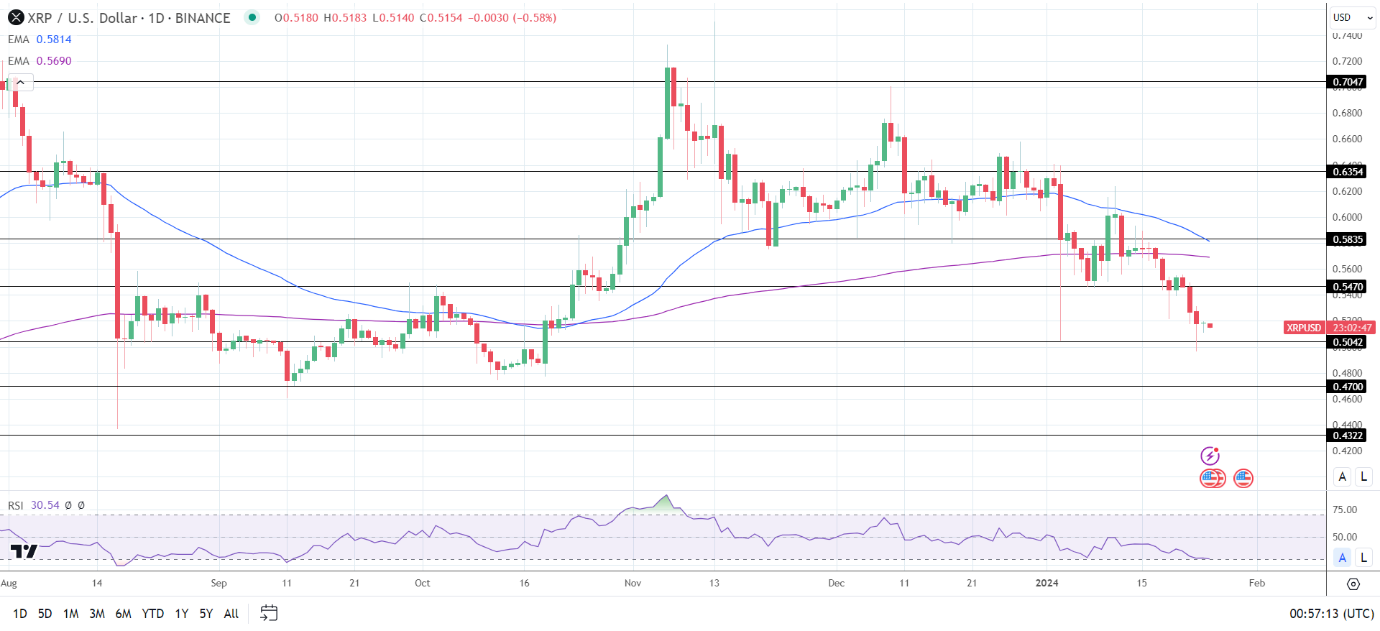
XRP remained below the 50-day and 200-day EMAs, affirming bearish price signals. Significantly, the 50-day EMA narrowed further on the 200-day EMA, another bearish sign.

An XRP breakout from the $0.52 handle would give the bulls a run at the $0.5470 resistance level. A move through the $0.5470 resistance level would bring the 200-day EMA into play.

SEC v Ripple and Coinbase case-related updates and US lawmaker chatter warrant investor attention.

However, a fall through the $0.5042 support level would give the bears a run at the $0.4700 support level.

The 14-day RSI reading, 30.54, shows XRP on the border with oversold territory. Buying pressure may intensify at the $0.5042 support level.

XRP Daily Chart affirms bearish price signals.
XRPUSD 250124 Daily Chart

4-Hourly Chart

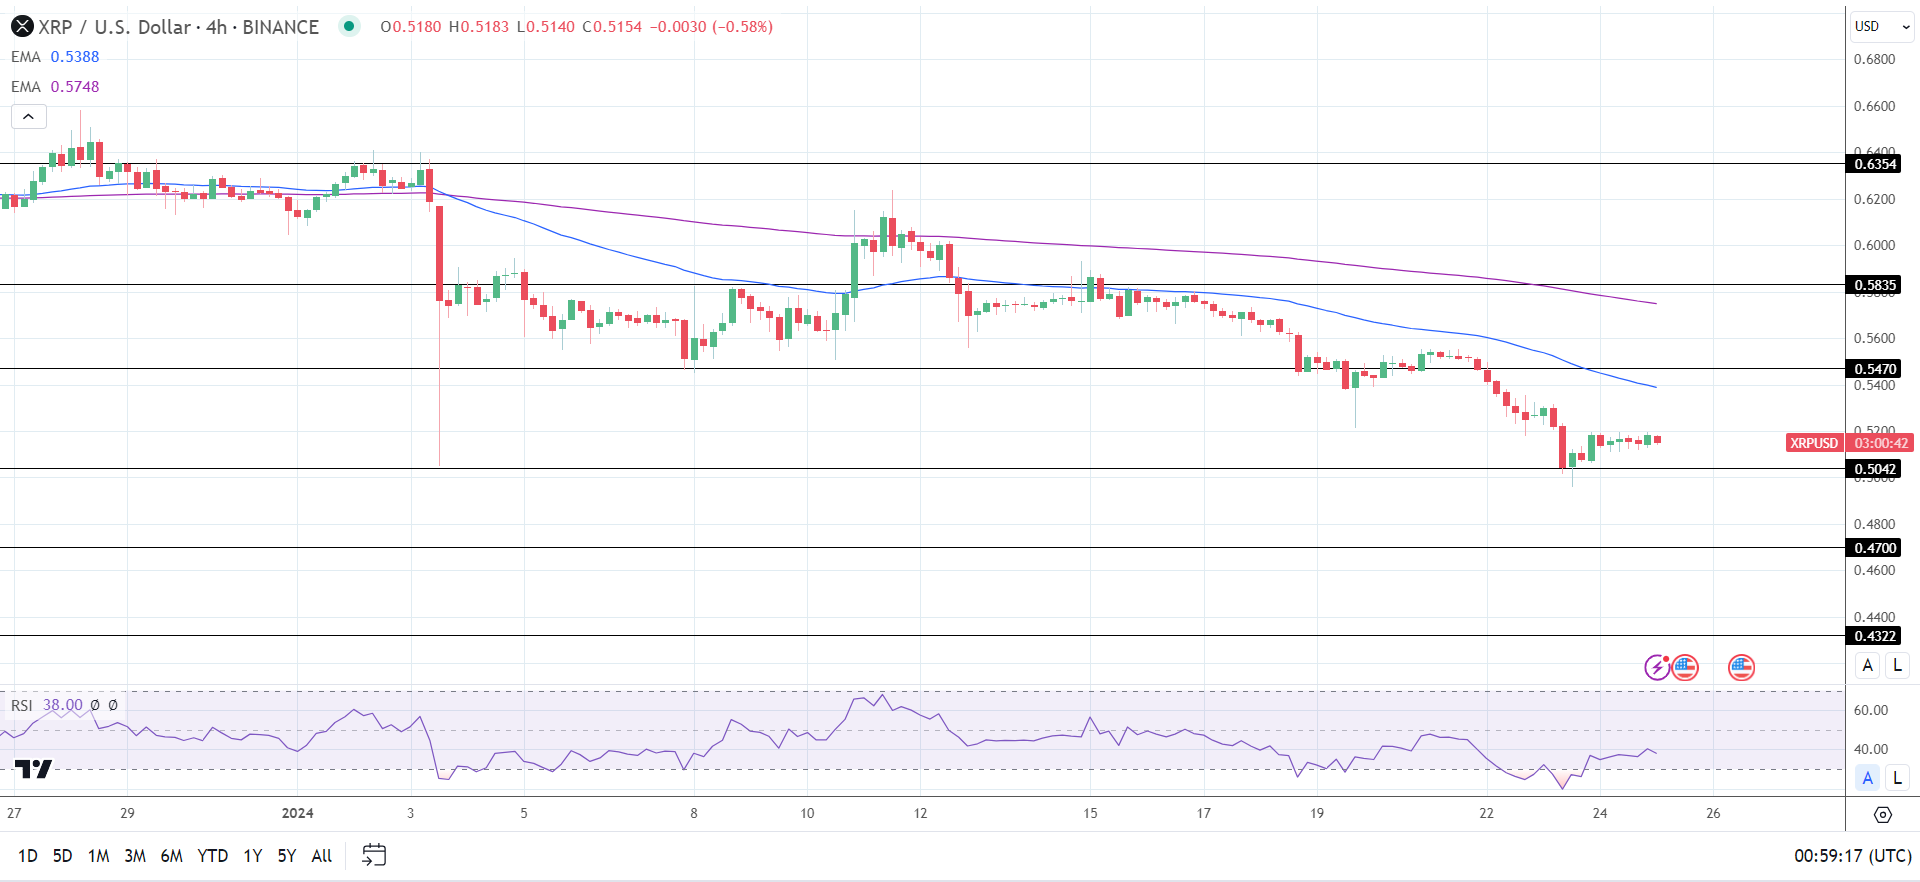
On the 4-hourly, XRP sat below the 50-day and 200-day EMAs, reaffirming the bearish price signals.

An XRP return to the $0.52 handle would support a move to the 50-day EMA. A break above the 50-day EMA would bring the $0.5470 resistance level into play.

However, a drop below the $0.5042 support level would support a fall toward the $0.4700 support level.

The 4-hourly RSI, with a reading of 38.00, indicates an XRP break below the $0.5042 support level before entering oversold territory.

XRP 4-Hourly Chart reaffirms bearish price signals.
What is a Short Squeeze and How to Trade It?

What is a Short Squeeze and How to Trade It?

What is a short squeeze?

The definition of a short squeeze can be termed as the strain experienced by short sellers to cover (by buying to close) their respective positions due to a sharp rise in stock prices.

For example, Investor A borrows 10 shares of Company Z at $5 per share. A few days later, Company Z shares rise to $10 per share which means that Investor A is currently running a $50 loss. The logic behind a short squeeze is that when short sellers (individuals forecasting share price declines) run losing negative positions due to price appreciation, the domino effect of these investors buying back shares to close positions as to not incur further loss causes an exponential rise in stock prices.

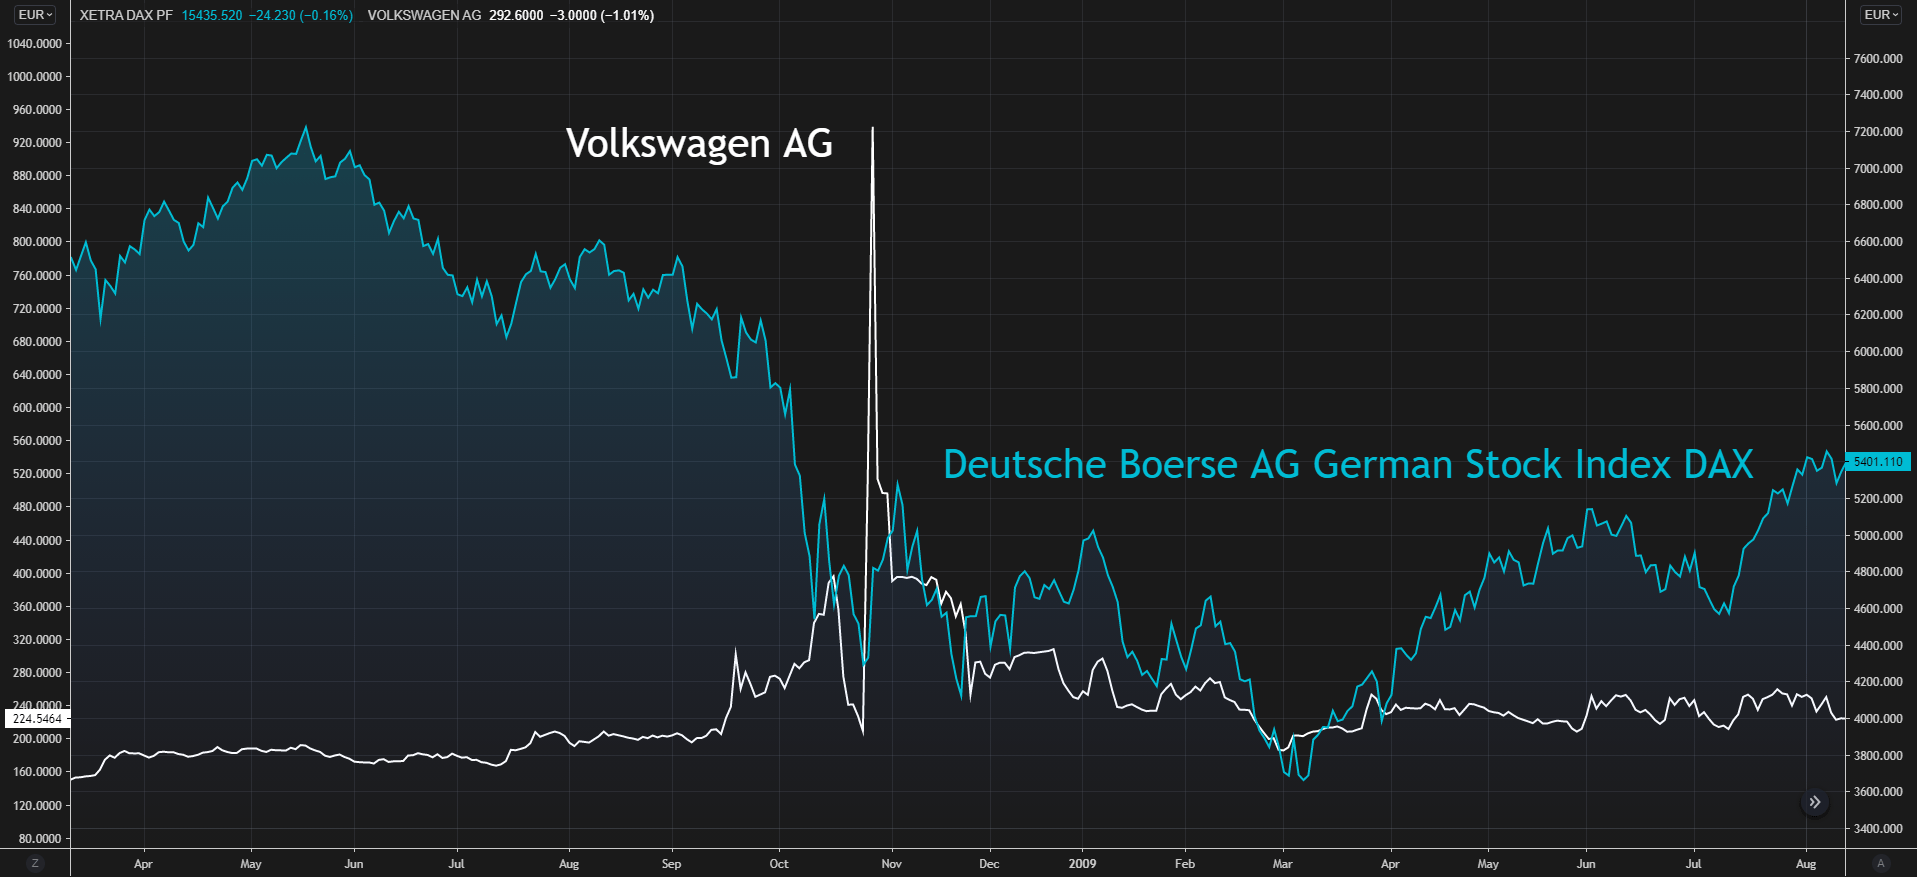
A good example is the Volkswagen AG (VOW.DE) short squeeze of 2008 whereby Porsche purchased large volumes of Volkswagen shares driving up prices roughly fourfold ultimately causing short sellers to lose billions in the process. The chart below shows the relative price increase between Volkswagen AG and the German DAX index.

Volkswagen AG vs DAX Index:

volkswagen AG short squueze vs DAX

When many short sellers attempt to buy back simultaneously, there is no cap on how high stock prices may rise. This often gives rise to opportunistic investors trying to capitalize on the short squeeze by buying during the price ascension.

What causes a short squeeze?

From the explanation above we can summarize the events leading up to a short squeeze scenario in the list below:

  • Investors identify what they believe to be an overvalued share and take short positions on the particular share – in expectation of a price drop whereby they may buy back the shares at a lower price (sell high, buy low).
  • Share price moves in the adverse direction to investor forecasts causing a rapid price rise.
  • Short sellers then realize that the position is not profitable and try to buy back shares at a minimal loss, thus causing further price escalation.

Is a short squeeze illegal?

According to the Securities and Exchange Commission short selling is illegal as the law states.

“ Selling stock short and failing to deliver shares at the time of settlement with the purpose of driving down the security’s price . This manipulative activity, in general, would violate various securities laws, including Rule 10b-5 under the Exchange Act.”

How to trade a short squeeze

Trading around a short squeeze (often prompted unlawfully by a large external third party) can be extremely dangerous and can result in significant financial loss. However, there are traders who use cautionary signals provided by market movements to forecast potential short squeezes. (To wit: the GameStop saga, which had traders on different sides of the action.) This high risk activity does carry the potential for high reward in certain cases. Some investors attempt to pre-empt an upcoming short squeeze by monitoring several key indicators. Primarily the main indicator would be:

Market Sentiment

Market sentiment reveals the markets inclination toward a specific financial instrument – in this case a share. The below are two potential methods of assessing, timing and interpreting possible signs of an impending short squeeze.

Short interest ratio:

This ratio simply put is a mathematical indicator that tells investors the average number of days it takes for short sellers to buy back borrowed shares. This ratio is calculated by the total number of shorted stocks divided by the average daily trading volume. For example, if there are 10000 shorted stocks on Company A with an average daily trading volume of 1000, then the short interest ratio would equal to 10. As a rule of thumb, a short interest ratio of 10 and higher is regarded as high and therefore the more short positions to cover – higher probability of a short squeeze.

Short interest percentage:

This percentage figure provides investors with a current gauge as to how many short sellers there are on a particular stock. That is, is there are 10000 short sellers on Company A with 1000000 outstanding shares then the short interest percentage figure would be 1%. The higher the figure, the more difficult it would be fore short sellers to buy back shares should prices increase.

How to protect against a short squeeze?

As mentioned, a short squeeze can cause large financial loss however, there are ways to mitigate excessive losses by means of two simple additives.

1. Stop loss: A stop loss is a level whereby a position will be closed should price hit a certain aforementioned level. For example, if a share is shorted at $10 a stop loss may be placed at $15 which means if the share price reaches $15 a purchase will ensue and the position will be closed at a loss of $5.

2. Hedging: This may seem counterintuitive as it is essentially netting off any gains however, purchase orders may be set in at a specified level to curtail losses up to a desired amount. For example, an order to buy the above share at $15 will effectively function as a stop loss.

Note: Traders should be aware of risks to stop loss orders. They are vulnerable to short-term fluctuations in price that could activate the stop price. All stop orders will be filled, though there is no guarantee of the price. What’s more, if your level is reached, your stop order cannot be filled at a better price than your stop, only the same price or worse, and this could impact your original risk-reward ratio.

China as the Economic Engine for ASEAN Economies: SGD, IDR, MYR, PHP

China as the Economic Engine for ASEAN Economies: SGD, IDR, MYR, PHP

The Association of Southeast Asian Nations, also known as ASEAN, orbits the world’s second-largest economy – China. The bloc is aimed at helping to promote economic growth in participating countries such as Indonesia, Malaysia, the Philippines and Singapore. Using the Core-Perimeter model, China functions as the economic powerhouse (core) which ASEAN states strongly rely on as a source of their growth (perimeter).

The Relationship Between China and ASEAN (SGD, IDR, MYR, PHP)

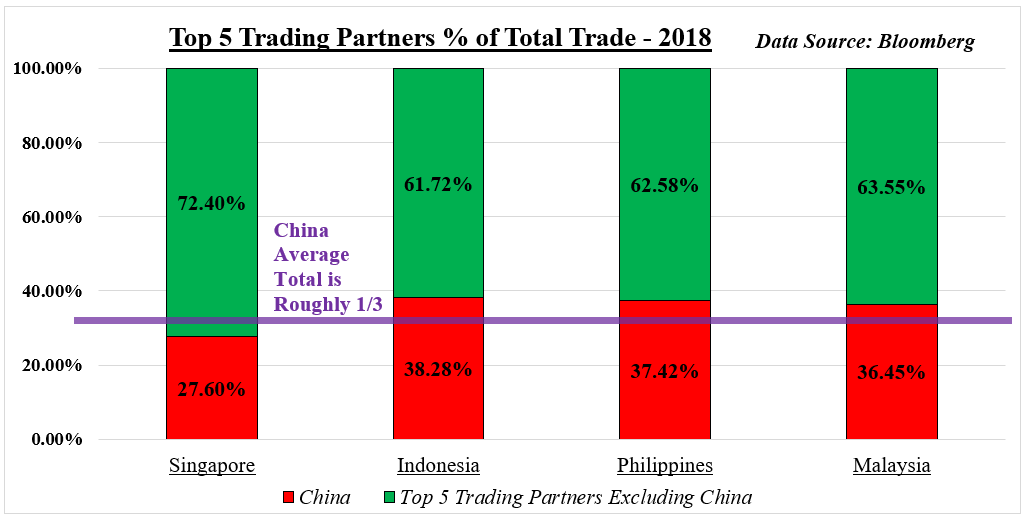
On average in 2018, China accounted for one third of total trade in ASEAN nations, when looking at their top five trading partners. China’s economy has been maturing and gradually shifting away from exportsand towards consumption as the primary source of economic growth. This makes the East Asian giant relativelyless sensitive to external shocks than its ASEAN neighbors.

Significance of ASEAN Trade With China

Chart showing ASEAN trade with China

During the 2008 financial crisis, market mood substantially deteriorated along with the baseline outlook for growth. China’s year-on-year GDP fell from its 2007 high at 14 percent down to around 6 percent in 2009. Over the course of the recession, ASEAN currencies plummeted as capital rushed out of the perimeter amid signs of weaker growth from the core, the source of the regional bloc’s economic vitality.

Chart showing ASEAN FX

This is because those perimeter economies (ASEAN) are more at risk of experiencing external shocks that undermine their growth trajectory than the core (China) due to their cycle-sensitive nature. The latter’s economy has been slowly shifting towards a consumer-based economy, which gives it more insulation to external shocks than outward-facing economies like those in ASEAN.

As Chinese growth began to show signs of stabilization, the prospect of that positive economic reverberation echoing out into its ASEAN neighbors precipitated a rush of capital flowing into the bloc’s assets. TheSingapore Dollar, Indonesian Rupiah, Malaysian Ringgit, Philippine Peso all rose with other growth-oriented instruments as signs of optimism from the core gave a flicker of hope for an economic recovery in the perimeter.

Chart showing ASEAN FX, CSI 300

The China-ASEAN dynamic has another layer of complexity to it when considering how the Yuan performed relative to its Asian neighbors. An assortment of unique circumstances has produced examples where price action deviates from the patterns implied in the Core-Perimeter model. A look at how these dynamics manifested during the 2008 financial crisis, the US-China trade war and the Covid-19 pandemic in 2020 can help investors navigate similar scenarios and be prepared for instances when the assumptions of the Core-Perimeter framework are best set aside.

Key Takeaways on the China-ASEAN Relationship

  • The Core-Perimeter model shows that during times of uncertainty, capital typically flows from the perimeter economies (ASEAN) into the core (China)
  • Conversely, when risk appetite is high, capital flows into perimeter (ASEAN) economies, subsequently strengthening their respective currencies
  • ASEAN countries are export-oriented, making them more vulnerable to economic shocks versus China which is shifting to a model based more on internal dynamics. This helps to insulate them from external economic disruptions
Top 10 Candlestick Patterns To Trade the Markets

Top 10 Candlestick Patterns To Trade the Markets

What are candlestick patterns?

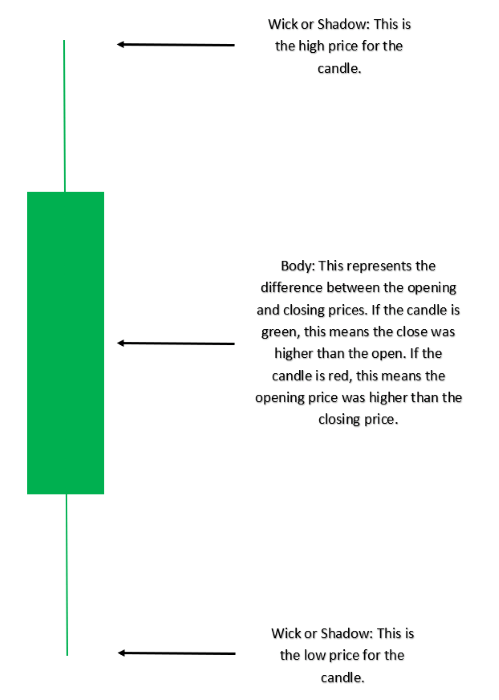
A candlestick is a single bar which represents the price movement of a particular asset for a specific time period. The information it displays includes the open, high, low and close for that time period.

candlestick pattern

Candlestick patterns take into account one or more candlesticks to assist technical traders in developing inferences about future movements and price patterns of the underlying asset. These are displayed graphically on a chart, which is utilized for market analysis. Our guide to reading candlestick charts is a great place to start to learn how to interpret candlesticks for trading.

Candlestick Patterns can be Bullish or Bearish

In order to recognize and apply the most commonly used candlestick patterns to a trading strategy, traders need to understand how the inclination of these patterns can affect the market direction (trend). The tables below summarize the two main categories of price movement that candlesticks can indicate. Many of these patterns are featured in our top 10 list below.

Bullish Candlestick Patterns:

Candlestick Pattern Direction
Morning Star Bullish (Reversal)
Bullish Engulfing Bullish (Reversal)
Doji Bullish/Bearish (Indecision)
Hammer Bullish (Reversal)
Bullish Harami Bullish (Reversal)
Piercing Pattern Bullish (Reversal)
Inside Bars Bullish (Continuation)
Long Wicks Bullish/Bearish (Reversal)

Bearish Candlestick Patterns:

Candlestick Pattern Direction
Evening Star Bearish (Reversal)
Bearish Engulfing Bearish (Reversal)
Doji Bearish/Bullish (Indecision)
Bearish Harami Bearish (Reversal)
Dark Cloud Cover Bearish (Reversal)
Inside Bars Bearish/Bullish (Continuation)
Long Wicks Bearish/Bullish (Reversal)
Shooting Star Bearish (Reversal)

Top 10 Candlestick Patterns Traders Should Know

1 – EVENING STAR AND MORNING STAR

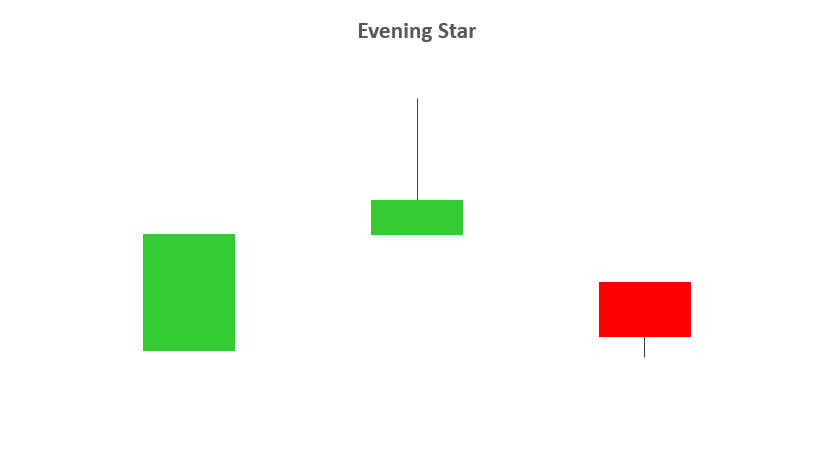
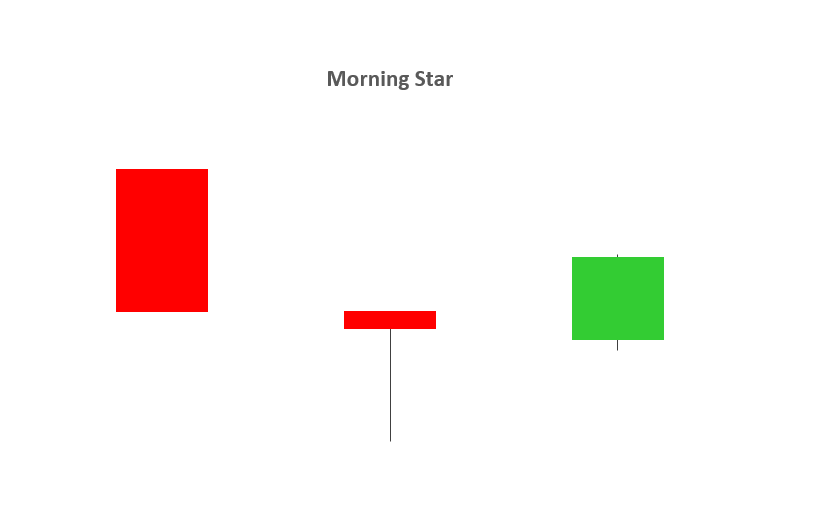
  • The evening and morning star candlestick patterns occur at the end of upwards/downward trends respectively and tend to indicate reversal patterns.
  • The names come from the star shaped formation of the arrangement.
  • As you can see from the image below, the first candlestick is in the direction of the trend, followed by a bullish or bearish candle with a small body. The third candlestick is seen in the direction of the reversal, ideally closing passed the halfway point of the first candlestick.
  • Trading this candlestick pattern will require a confirmation candle in the direction of the respective reversal – for example, traders will look for a bearish candle after the evening star.

evening star candlestickmorning star candlestick

2 – BULLISH & BEARISH ENGULFING

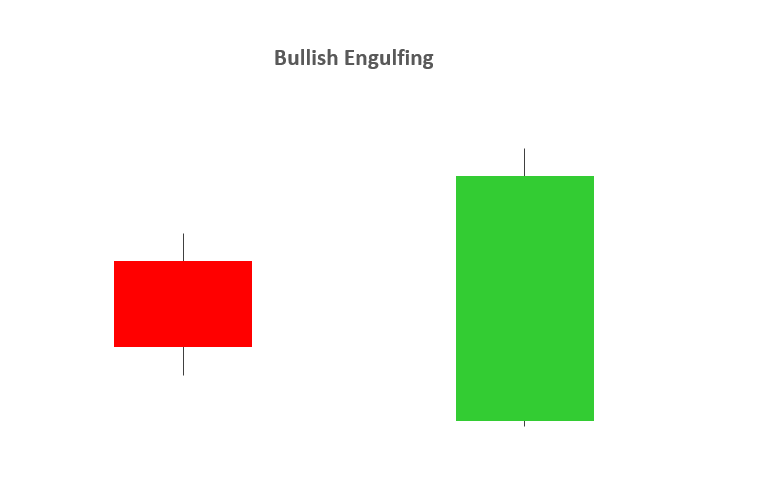
  • A bullish or bearish engulfing candlestick pattern may indicate reversal patterns.
  • A bullish engulfing candlestick formation shows bulls outweigh bears. As the pattern below shows, the green body (bulls) covers completely the first candlestick (bears).
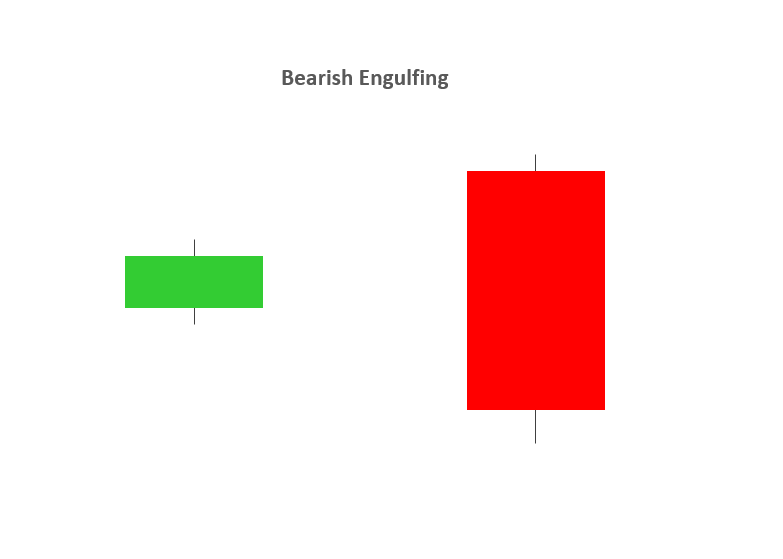
  • A bearish engulfing candlestick pattern is small green (or bullish) candle followed by a larger red (bearish) candle immersing the small green candle.

bullish engulfing candlestickbearish engulfing candlestick

3 – DOJI

  • The Doji candlestick chart pattern is associated with indecision in the market of the underlying asset. This could mean potential reversal of the current trend or consolidation.
  • This pattern can occur at the top of an uptrend, bottom of a downtrend, or in the middle of a trend.
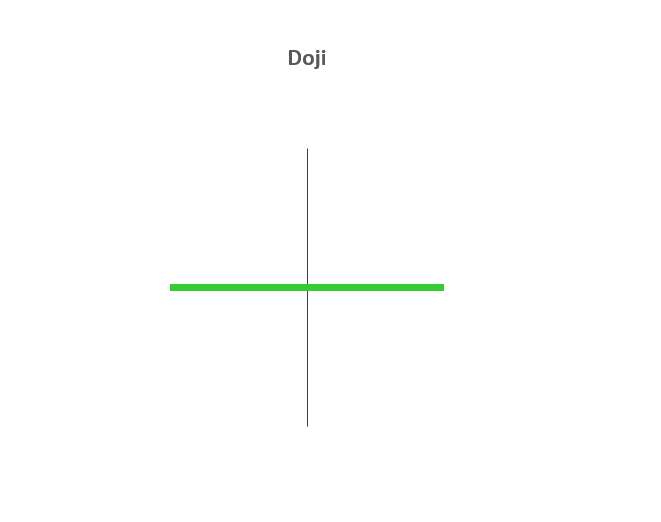
  • The candlestick itself has an extremely small body centered between a long upper and lower wick.

doji candlestick

4 – HAMMER

  • The Hammer candle is viewed as a bullish reversal usually occurring at the bottom of a downward trend.
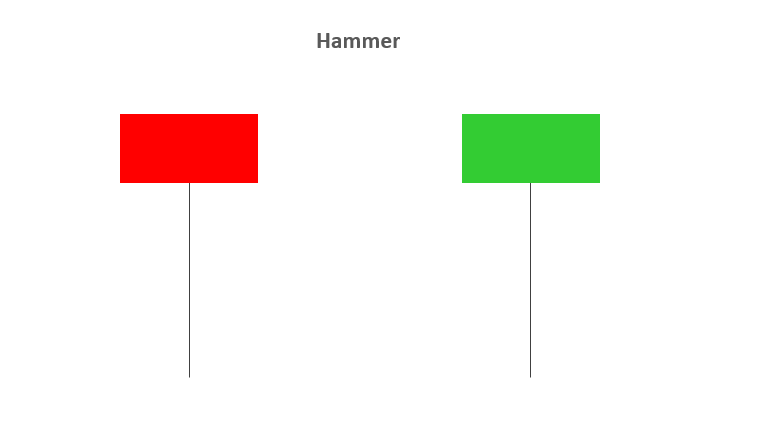
  • This candle formation includes a small body whereby the open, high, low and close are roughly the same. There is a long lower wick beneath the body which should be more than twice the length of the candle body. The body may be bullish or bearish, however bullish is considered more favorable.

hammer candlestick

5 – BULLISH & BEARISH HARAMI

  • A Bullish or Bearish Harami may indicate reversal patterns.
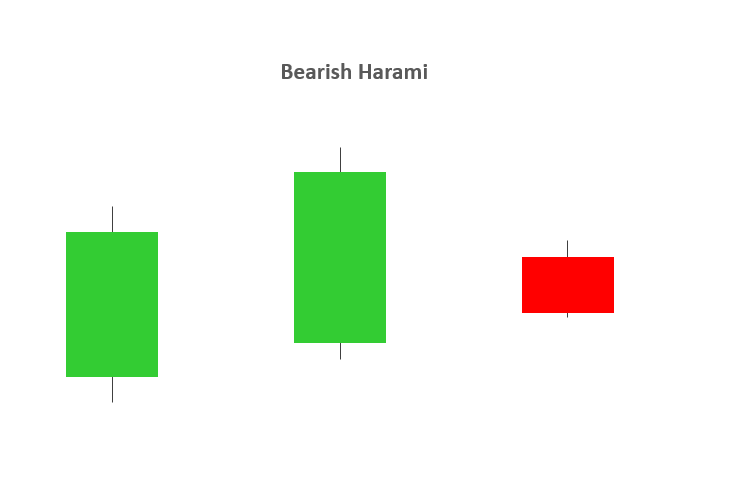
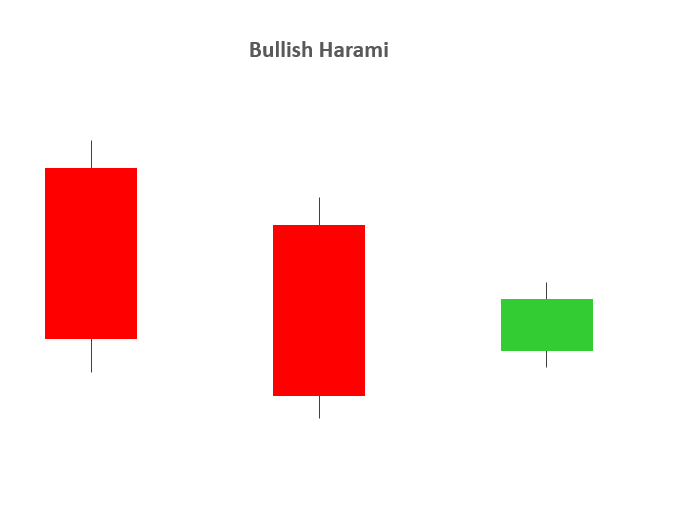
  • The word “Harami” means “pregnant” in Japanese, and the name has been given to this candlestick pattern because it resembles a pregnant woman. The second candle in the pattern must be contained within the body of the first candle as seen in the images below. This holds true for both bullish and bearish Harami’s.
  • A downtrend precedes a bullish Harami and an uptrend precedes that of a bearish Harami.

bullish harami candlestickbearish harami candlestick

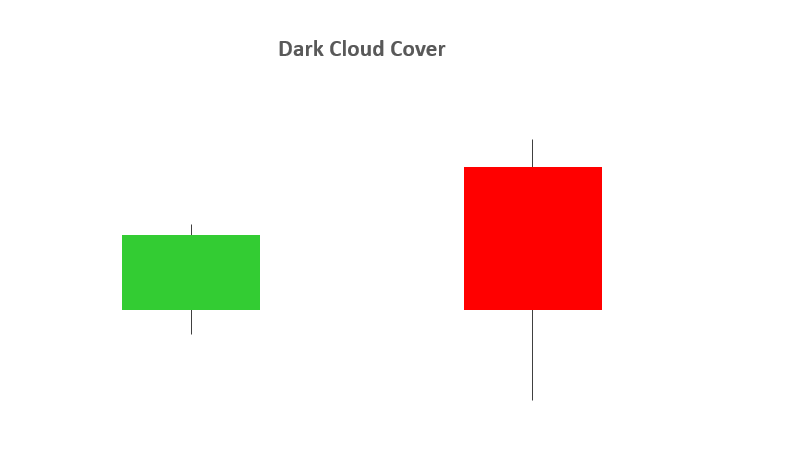
6 – DARK CLOUD COVER

  • The Dark Cloud Cover pattern is seen as a bearish reversal pattern.
  • This candlestick pattern must occur during an uptrend. As seen in the image below, the bullish candle is followed by a bearish candle.
  • This bearish candle must confirm certain criteria to validate the Dark Cloud Cover pattern:

1. The opening price must by higher than the previous days close.

2. The closing price must close below the midpoint of the previous bullish candle.

  • The Dark Cloud Cover pattern looks similar to that of the Bearish Engulfing pattern. The difference between the two relates to the second candlestick. Bearish Engulfing pattern has the second candlestick opening above the close of the first, whilst the Dark Cloud Cover opens above the high of the first candle and closes below the midpoint of the first candlestick body.

dark cloud cover candlestick

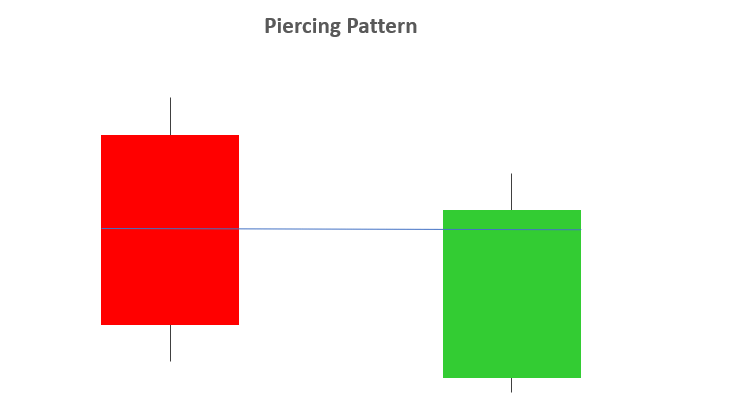
7 – PIERCING PATTERN

  • The Piercing Pattern is viewed as a bullish candlestick reversal pattern, at the end of a downtrend or during a pullback within an uptrend, or at the support.
  • There are two components of a Piercing Pattern formation:

1. Bearish candle

2. Bullish candle

  • A Piercing Pattern occurs when a bullish candle (second) closes above the middle of bearish candle (first) in a downward trending market.
  • The open price of the second candle should gap down at market open and ensue by closing above the mid-point of the previous candle as indicated below.
  • Both the Piercing and Dark Cloud Cover patterns have similar characteristics. The difference is that the piercing line is a bullish reversal pattern as mentioned above, whilst the Dark Cloud Cover pattern is a bearish reversal pattern.

piercing pattern

8 – INSIDE BARS

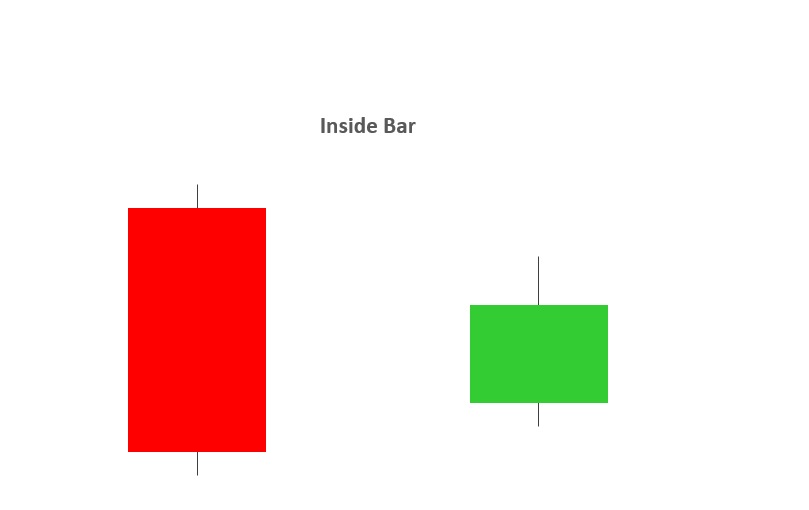
  • The Inside Bar pattern is utilized in trending markets whereby the high and low of the Inside bar is within the parameters of the previous candle or “mother bar”.
  • Inside Bars are traded within the direction of the trend – if the market is in a downtrend, the trader would look to continue with a short position with the presence of an Inside Bar. The same principal is applied in an uptrend.
  • Trading in the direction of the trend is not always a given as key levels of support/resistance can indicate a reversal. Classically, the entry points for traders is positioned above or below the high or low of the mother bar depending on the direction of the trade.
  • An inside bar is also similar to a bullish or a bearish harami candlestick pattern. The main difference being that with an inside bar, the highs and lows are considered while the real body is ignored.

inside bar candlestick

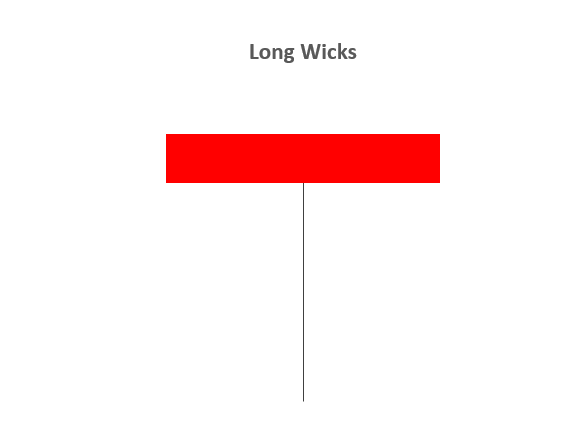
9 – LONG WICKS

  • Long Wicks candlestick patterns often indicate a reversal in the trend.
  • Long Wicks occur when prices are tested and then rejected. The wick indicates rejected prices.
  • Identifying the trend is important to interpret the significance of the Long Wick.
  • Identifying key levels and price action is often used in conjunction with Long Wick patterns.

long wicks candlestick

10 – SHOOTING STAR

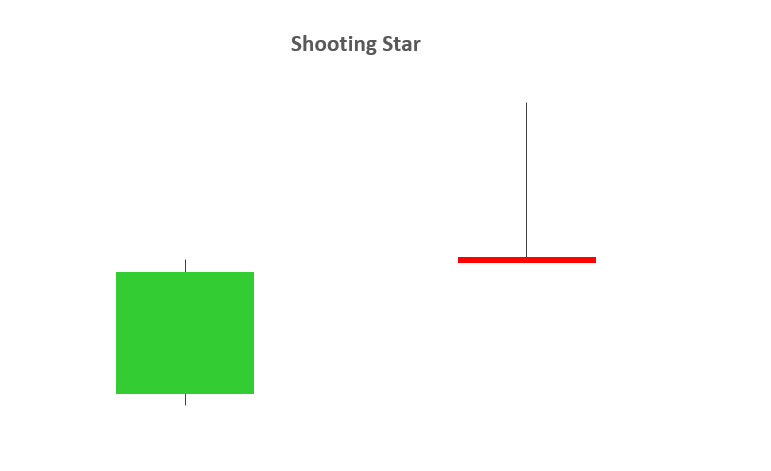
  • A Shooting Star is a bearish candle with a long upper wick, little or no lower wick and a small real body near the day’s low. It comes after an uptrend, and potentially indicates a trend reversal to the downside.
  • The distance between the high and opening price of the candle must be more than twice as large as the Shooting Star’s body. The distance between the lowest price for the day and the closing price must be very small or nonexistent.
shooting star candlestick