Gold Prices Forecast: XAU/USD Surges Amid Lower Treasury Yields, Dollar Weakness

Gold Prices Forecast: XAU/USD Surges Amid Lower Treasury Yields, Dollar Weakness

Gold Prices React to Economic Indicators

Gold prices are trading higher on Tuesday, influenced by a combination of declining U.S. Treasury yields and a softer U.S. dollar. This movement comes as investors eagerly await decisions from various central banks and key U.S. economic data releases scheduled for the week.

AT 07:34 GMT, Gold (XAU/USD) is trading $2031.56, up $9.90 or +0.49%.

Treasury Yields and Economic Data in Focus

The yield on the benchmark 10-year Treasury note is slightly lower on Tuesday are settling around 4.103% the previous session, a notable decrease from last week’s high, which was its best level since December. Similarly, the 2-year Treasury bond yield also declined. These shifts in Treasury yields are critical as they reflect market speculation about the Federal Reserve’s interest rate decisions, which are pivotal for both the economy and market directions in 2023.

Anticipation of GDP and PCE Data

Investors are particularly focused on the upcoming preliminary GDP growth figure for the fourth quarter and the Commerce Department’s personal consumption expenditures (PCE) price index for December. These data points are expected to provide insights into the economy’s health and the potential trajectory of the Fed’s interest rate policy.

Dollar Weakness and Gold’s Appeal

The U.S. dollar index’s overnight decline has enhanced the appeal of gold for holders of other currencies. Despite being close to a recent high, the greenback’s fluctuations are closely watched as they influence expectations around the Federal Reserve’s rate adjustments.

Short-Term Outlook for Gold

In the short term, gold’s price movement appears to be in a holding pattern, awaiting further cues from the Federal Reserve regarding interest rate cuts. The market’s current pricing suggests a reduced expectation of rate cuts this year, with the first cut now anticipated in May.

However, if central banks counter the narrative of imminent rate cuts, this could exert downward pressure on gold prices from a yield perspective. Upcoming U.S. economic reports, including the flash PMI, GDP estimates, and PCE data, will be crucial for investors before the Fed’s meeting at the end of January.

Technical Analysis

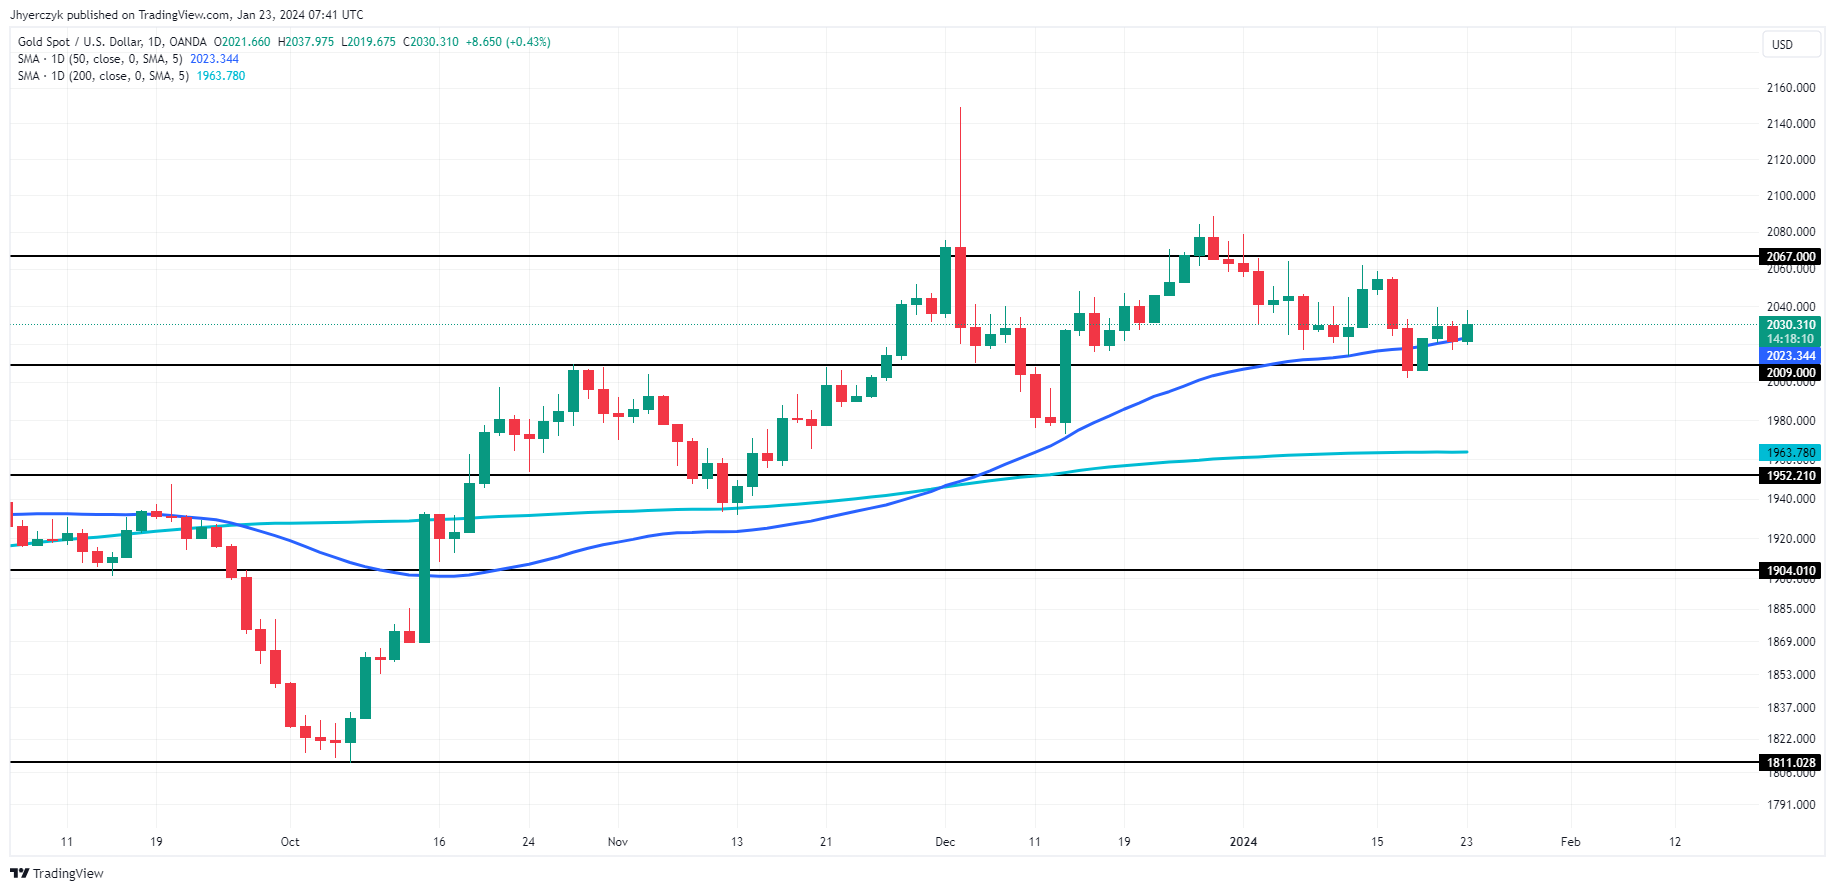
Daily Gold (XAU/USD)Gold (XAU/USD) is currently on a potentially bullish path, evidenced by its rise from a previous close of 2021.66 to a current price of 2030.88.

This upward trend is underscored by the price’s proximity to the 50-day moving average of 2023.36, which is likely to serve as a pivotal point for the market’s intermediate direction. Additionally, the price sits above the 200-day moving average at 1963.78, reinforcing the bullish sentiment.

The market is trading between the minor support level at 2009.00 and minor resistance at 2067.00. Breaking above this minor resistance could indicate a continued rise, potentially aiming for the main resistance at 2149.00. On the flip side, a retreat would lead to a retest of the minor support level.

However, the current market position near the 50-day moving average is a key factor in determining Gold’s next move.

Bank of Japan Leaves Interest Rates in Negative Territory

Bank of Japan Leaves Interest Rates in Negative Territory

The Bank of Japan Leaves Interest Rates in Negative Territory

On Tuesday, the Bank of Japan delivered its first monetary policy decision of the year. Significantly, the BoJ left interest rates unchanged at a negative 0.1%.

According to the Statement on Monetary Policy,

  • The BoJ unanimously voted to maintain a negative interest rate of minus 0.1%.
  • There were also no changes to the Yield Curve Control policy.
  • An upper bound of 1.0% for 10-year Japanese Government Bond yields will remain a reference.

According to the BoJ Outlook for Economic Activity and Prices Report,

  • A slowdown in the pace of recovery in overseas economies will pressure the Japanese economy.
  • However, the BoJ expects a pickup in spending to fuel the Japanese economy thereafter.
  • The BoJ expects core inflation to remain above 2% through fiscal year 2024.
  • Compared with previous Outlook Reports, projected growth for 2023 was lower for 2023 but higher for 2024.
  • Significantly, the annual core inflation rate is lower for 2024.
  • Considering economic uncertainties about the economy and financial markets, the Bank will patiently continue with monetary easing.

USD/JPY Reaction to the BoJ Monetary Policy Decision

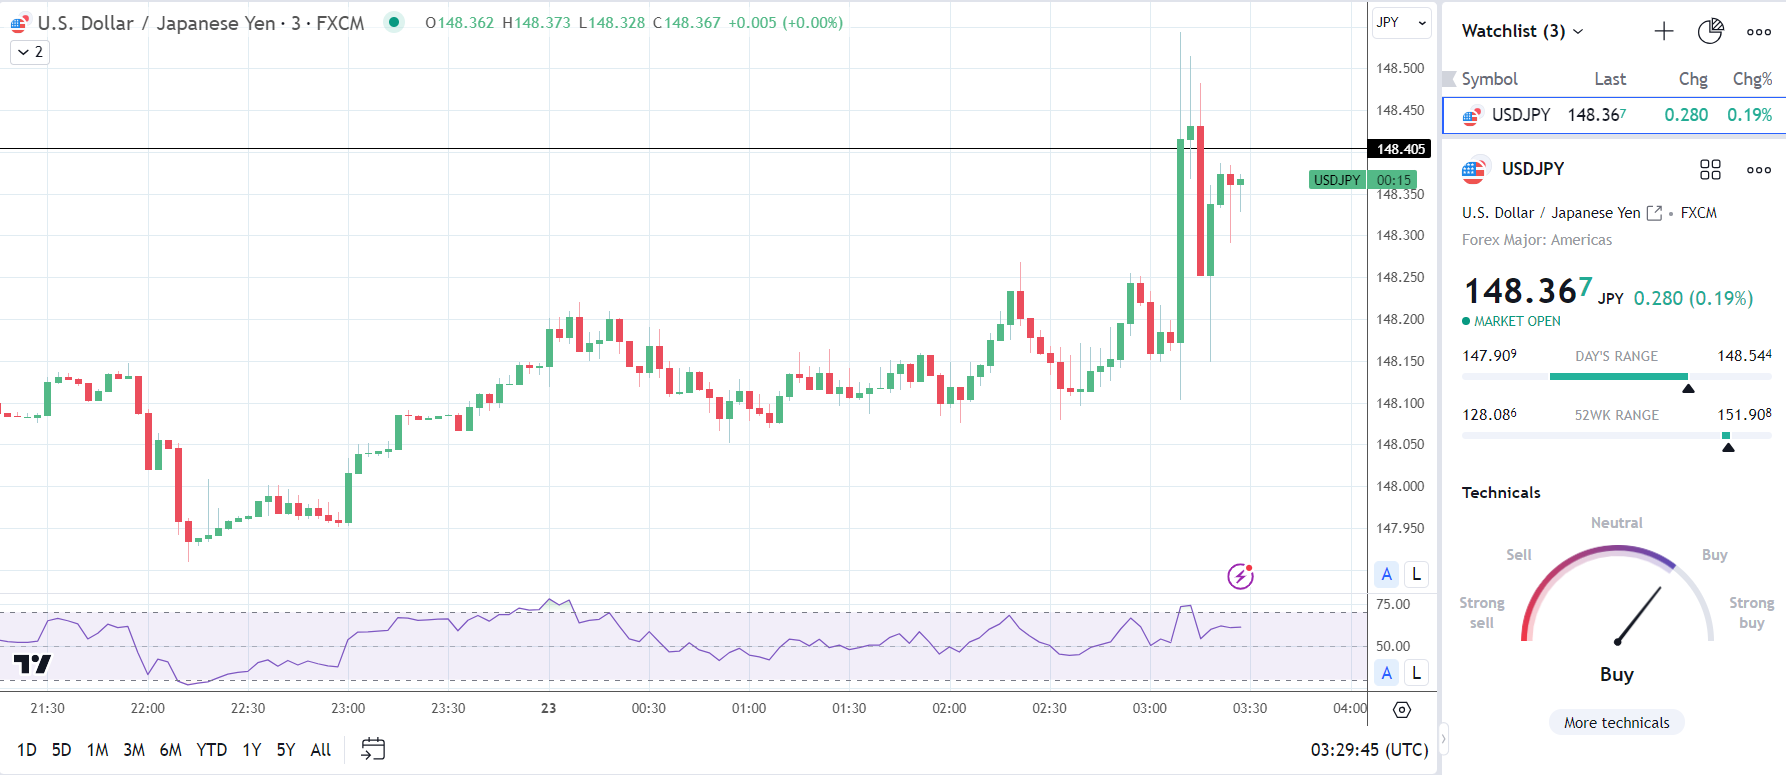
Before the BoJ monetary policy decision, the USD/JPY fell to a low of 147.909 before climbing to 148.268.

However, in response to the BoJ monetary policy decision, the USD/JPY fell to a low of 148.103 before rising to a high of 148.544.

On Tuesday, the USD/JPY was up 0.19% to 148.367.

USD/JPY Reacts to the Bank of Japan monetary policy decision.
230124 USDJPY 3 Minute Chart

Up Next

The Bank of Japan press conference could be pivotal. Forward guidance on the economic outlook, wages, inflation, and interest rates warrants investor attention. The markets anticipate an H1 2024 BoJ pivot from negative rates. Bank of Japan Governor Ueda will likely reference the BoJ Quarterly Outlook Report.

Expectations of softer inflation and an uncertain economic outlook could allow the BoJ to retain ultra-loose policy.

Later in the session, the US economic calendar will garner investor interest. Richmond Fed indexes could influence bets on a March Fed rate cut.

Economists forecast the Richmond Fed Services PMI to decline from 0 to -5 and the Manufacturing PMI to fall from -11 to -15.


Don’t miss a
Oil (Brent Crude, WTI) Edge Cautiously Higher – Follow through Lacking

Oil (Brent Crude, WTI) Edge Cautiously Higher – Follow through Lacking

The oil market is struggling for direction, which is likely to continue as long as oil fundamentals remain unchanged. Economic forecasts anticipate low global economic growth in 2024 which means oil demand growth is likely to be minimal. This brings about the possibility of an oversupplied oil market which pushes down on prices. Speaking of growth, this week oil (WTI) will be in focus as US GDP data for the 4th quarter is due. The final three months of 2023 are expected to reveal a sharp drop from the phenomenal 4.9% in Q3 (2%).

On the other side of the equation, the current tensions in the Middle East and threat on western shipments making their way via the Red Sea has the potential to jolt prices. However, only around 12% of total global seaborne oil trade goes through the Red Sea meaning a major disruption will be required to materially shift oil prices.

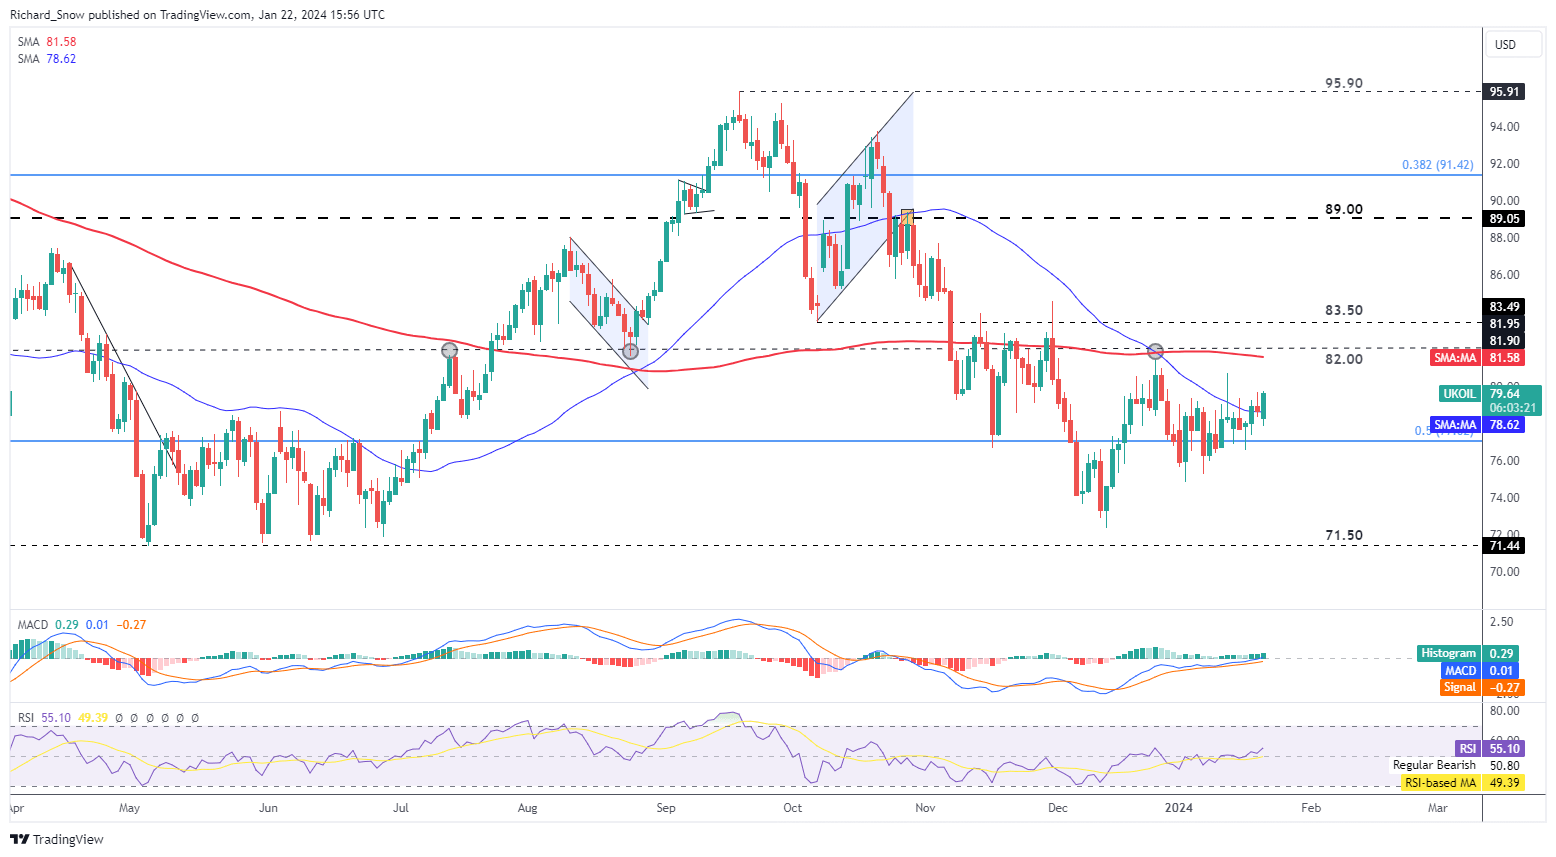
Brent Crude Technical Analysis – Upside Level of Interest at $82

Brent crude oil prices have struggled to really get going, due to the unclear fundamental situation. The MACD points towards a slow and steady rise to the upside, especially after the December 13th swing low. Should the current measured rise extend further, $82 appears as a key level of resistance as the level has proved to be a pivot point in the past. In addition, the $82 level is roughly where the 200-day simple moving average resides. Support is all the way down at the $71.50 level with a less significant $77 emerging as the 50% Fibonacci retracement of the major 2020- 2022 ascent.

Brent Crude Oil Daily Chart

image1.png

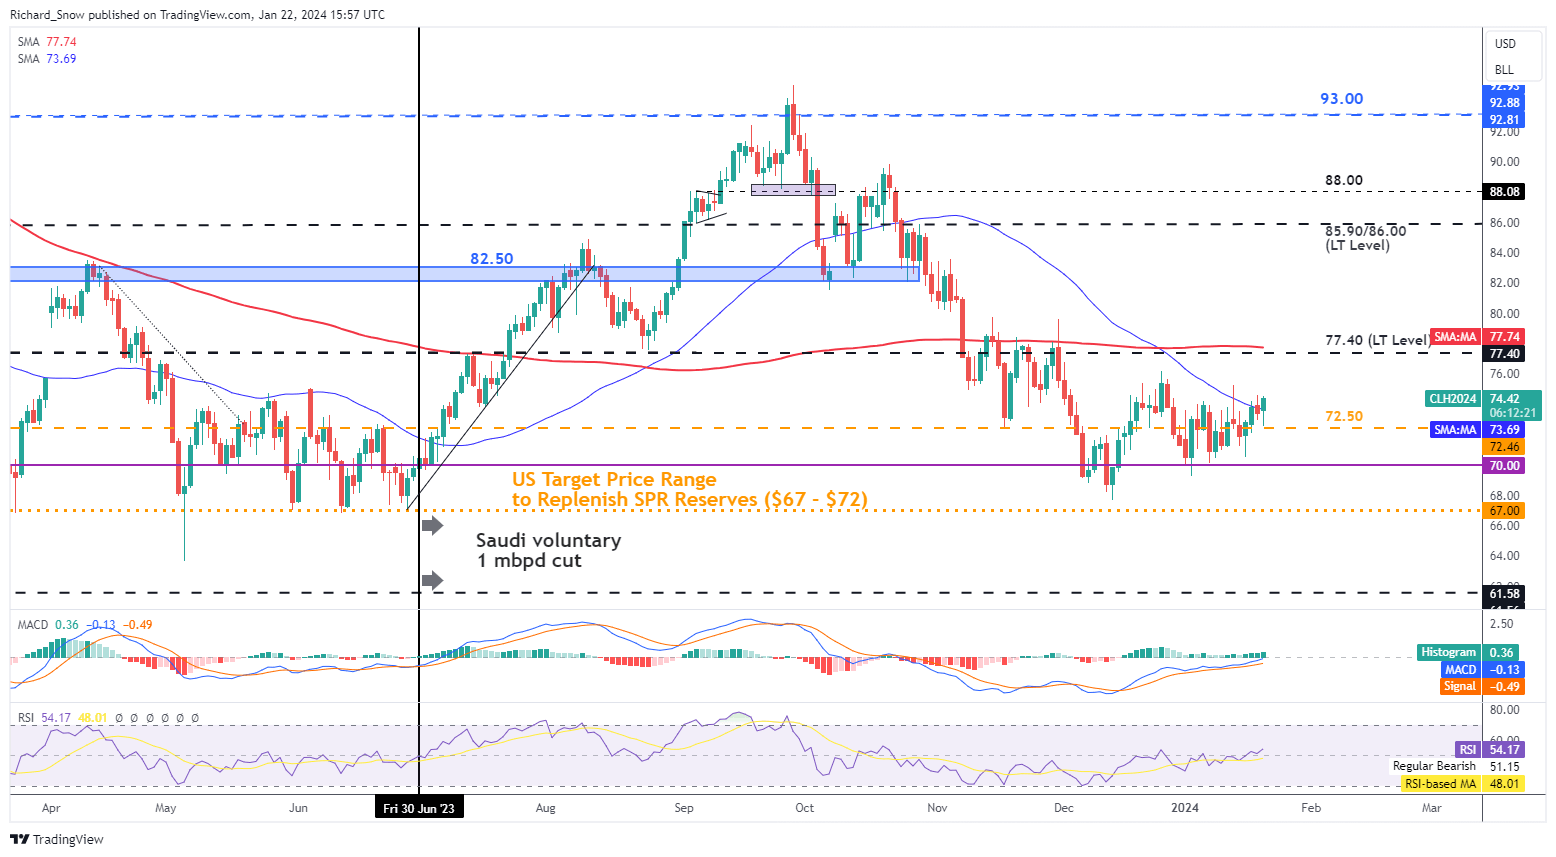
WTI Faces Resistance Ahead of Significant $77.40 Marker

WTI oil prices successfully navigated the $72.50 test, opening up a return to the significant long-term level of $77.40 – which coincides with the 200-day simple moving average. The lift in prices since the swing low continues with trepidation, lacking conviction. $72.50 appears as near-term support.

WTI Oil Daily Chart

image2.png


Tesla’s Share Price: What to Expect from Q4 Results

Tesla’s Share Price: What to Expect from Q4 Results

Tesla (TSLA) Q4 Analysis, Charts, and Price

When is Tesla’s results date?

It’s expected to get volatile for Tesla’s share price on Wednesday, January 24th after market close, as that’s when they’ll be releasing their fourth-quarter results.

Tesla share price: forecasts from Q4 results

It wasn’t a pretty picture last time around, as third-quarter results were a miss on both earnings and revenue and came with added caution on the Cybertruck’s potential (or lack thereof) to deliver significant short-term positive cashflow.

Production and Deliveries Breakdown

But looking beyond that and breaking down deliveries and production for the final quarter of 2023, it was a record. Deliveries totaled over 484K with production nearly 495K, and in all producing 1.846m and delivering under 1.81m while above 2022’s 1.37m and within October’s guidance of 1.8m, fell short of its earlier 2023 goal of two million. The breakdown for the final quarter of 2023 showed nearly 477K Model 3/Y were produced and over 461K delivered, while “Other Models” were 18.2K (3.8% of the total) and 23K respectively.

Tesla’s Eventful Quarter

It was a quarter where Chinese rival BYD and its lower-priced models helped it overtake Tesla as the world’s largest producer of electric vehicles, even if there’s the argument by Elon Musk that his company is “an AI/robotics company that appears to many to be a car company” and in turn shouldn’t fall under an apples-to-apples comparison.

And it’s been busy on other fronts as well. There were (1) troubles in Scandinavia though hasn’t seemed to dent its sales in the region, (2) mixed numbers for other areas as they were tested for Germany and UK but strong for China with a 69% increase year-on-year for December according to CPCA (China Passenger Car Association), (3) the Cybertruck release, (4) Model 3 refresh for some markets in what is considered to be a lineup that aside from recent releases has aged quite a bit, (5) further progress on the charging port adoption front with its massive network of chargers, (6) recalls that aren’t uncommon amongst automakers and for Tesla only required an over-the-air software update, and (6) price cuts with the average lowered again during the fourth quarter (cargurus.com).

And then came more at the start of this quarter with rising labor costs, further price cuts, and supply chain woes on recent geopolitical factors. Expect investors to note that and any further updates on the low-cost model where they are already “quite far advanced” that would feed into the mass market with a lower price point unlike the Cybertruck, its guidance for 2024 in the face of subsidy and tax credit reductions/removals and whether it’ll translate into even more price cuts this year to retain growth, how it might impact profit margins, and its plans on expansion in terms of geographic locations with rate cuts in view this year that might ease what was expected to be a “stormy” macroeconomic situation.

EPS and Revenue Forecasts

In all, expectations for the fourth quarter are that we’ll get an earnings per share (EPS) reading of $0.74, a lower figure both quarter-on-quarter as well as year-on-year. Revenue should come in stronger based on both metrics, rising to $25.5bn, and where growth should be seen across all its key segments. Margins will likely remain tested (relative to figures before 2023) but improve into the 18% handle from 17.89% in Q3 (source: Refinitiv).

As for analyst recommendations, there are five in the ‘strong buy’ category, 12 ‘buy’, 19 ‘hold’, and four for both ‘sell’ and ‘strong sell’, with the average price target amongst them only recently above its falling share price (source: Refinitiv).

Trading Tesla’s Q4 results: weekly technical overview and trading strategies

There’s no denying how strong 2023 has been for the ‘magnificent seven’, and Tesla relatively outperforming amongst them (Nvidia +233%, Meta +188%, Tesla +109%, Amazon +78%, Alphabet +57%, Microsoft +55%, Apple +48%), but those gains were realized in the first half when it comes to its share price and started to get tested after mid-July.

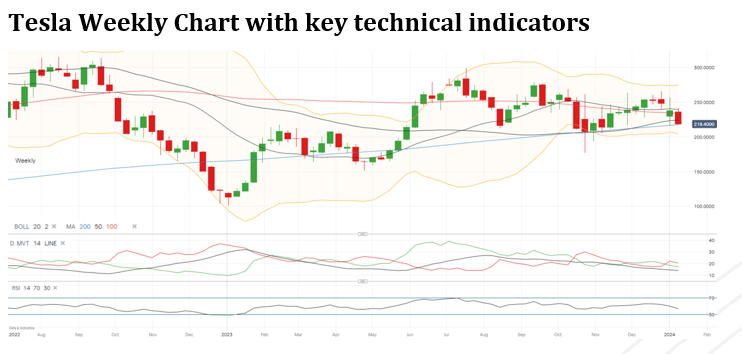
The technical overview on the shorter-term daily time frame was a bit rosier back when price managed to remain within its bull channel, with the break beneath it at the start of this year throwing a wrench into its key technical indicators and included a negative DMI (Directional Movement Index) cross and price beneath all its main short and long-term daily moving averages. Zooming out to the weekly time frame, and while the same negative cross has occurred, price-indicator, as well as indicator-indicator proximity, has made it difficult to get enough clarity on the technical front given the ease with which they can generate signals on a not-so-significant move.

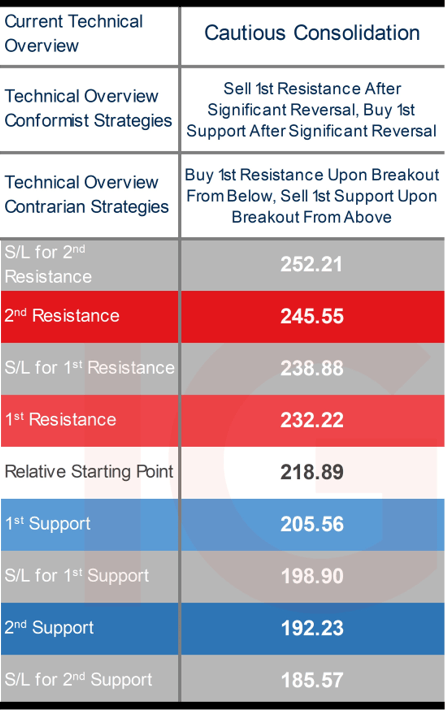
That has translated into an overview that’s more cautious at this stage even as it suffers from negative technical bias, with most weeks offering relatively controlled intraweek moves. There’s the obvious matter that the earnings release is a fundamental event where technicals are shelved, especially when it involves a surprise, and means technical levels will likely struggle or even fail to hold once the latest figures are released. That means conformists ought to go in with added caution avoiding fading any move towards 1st levels and retaining that caution even when it approaches 2nd levels, while contrarian breakout strategies may see added follow-through if price has already gotten near it just before the event.

Growth Versus Value Stocks: How Interest Rates Affect Valuations

Growth Versus Value Stocks: How Interest Rates Affect Valuations

When the Federal Reserve adjusts its monetary policy stance by either raising or lowering borrowing costs, the investment landscape changes, becoming more friendly or more hostile to the equity market. In this article, we will discuss how valuations and performance of value and growth stocks tend to be affected by rising and falling interest rates, but before we get to that, some context and definitions need to be established.

GROWTH STOCKS

Growth companies are often unprofitable and have speculative prospects, but investors are willing to pay a premium to own them because they have an innovative business/product that has the potential to deliver above-average returns over a long-term horizon, although there are no guarantees. They are riskier and therefore more volatile than the market in general, but their share prices usually rise faster than typical stocks because of their strong earnings growth outlook. Often, these high-flyers focus on increasing future revenue at the expense of delaying profitability, reinvesting their earnings into product research and expansion, so they do not frequently distribute capital to shareholders through dividends or buybacks.

VALUE STOCKS

Value stocks sit on the opposite spectrum. These are mature companies with a well-established business, solid balance sheets, proven history of financial performance and steadier but low growth over time. Despite their high quality and solid fundamentals, they have fallen out of favor and lost their “WOW” factor, so they trade a discount to the market and appeared undervalued based on various financial metrics such as price/earnings, price/book, cash flows, etc. Value companies typically pay dividends, offer lower volatility, and carry less risk than the market, but their share prices rarely experience explosive upward movements similar to those seen in the growth universe.

It is clear from the above introduction that different stocks have different characteristics; they are not created equal, so they will be affected by changes in monetary policy in dissimilar ways, but to try to gauge the possible impact, it is first necessary to understand a little about valuations. Very simplistically, the value of a company can be thought of as the present value of expected earnings.

By buying Apple’s shares, for example, a long-term investor has acquired an ownership claim in the company’s profits over time. To assign an intrinsic value to the perpetual cash flows associated with the business’ operations, analysts first forecast earnings growth and then discount the sum of the projected income stream to today’s dollars using a discount rate, usually a risk-free rate such as the 10-year U.S. Treasury yield. This is where interest rates play a huge role in equity investing.

Let’s now analyze two imaginary companies, with different earnings profile over the next decade to determine how their value are affected by a changing interest rate environment. To do so, we’ll rely on a basic discounted cash flow model, using the formula below:

The model is very basic and omits key variables for simplicity, but for our purposes is enough.

1. Value Company: Company XYZ is a well-established oil producer. XYZ is expected to generate $1,000,000 in cash flows next year, and grow them by 4% every year for the next 10 years. Let’s now value this company with the U.S. 10-year yield at 0.25% and then at 3%.

Value company cash flows

2. Growth company: Company ZZZ is a recently founded tech firm that launched an innovative cloud storage software. ZZZ is expected to generate $50,000 in cash flows next year, and grow them by 90% every year for the next 10 years. Let’s proceed to value this company with the U.S. 10-year yield at 0.25% and then at 3%.

Growth company cash flows

Related: How to Research Stocks – A Step by Step Guide

CONCLUSIONS

The tables above show that higher discount rates produce lower equity values, but the effects vary across investment styles. In general, however, growth companies will be more sensitive to rising interest rates because of the nature and path of their cash flows: little in their early stages, large later in their life cycle.

Going back to the two hypothetical examples, growth company ZZZ lost 21.3% of its value when the discount rate used went from 0.25% to 3.0%. In real life, the less attractive valuation will likely coincide with a steep drop in the company’s stock price. Company XYZ was also affected by the change in the rate environment, but its present worth only fell by 14.3%, suggesting that companies with value characteristics may fare better when monetary policy becomes more restrictive.

Focusing on real life examples, the charts below are composed of two panels. The upper panel shows the ratio between IWD (iShares Russell 1000 Value) and IWF (iShares Russell 1000 Growth), and the lower panel displays the U.S. 10-year yield by itself.

Chart 1 is from January 2020 to May 2020. During this period, when the 10-year yield dropped from about 1.89% to 0.66%, the IWD/IWF ratio declined roughly 19%, pointing to strong growth outperformance.

CHART 1 – IWD/IWF RATIO VS US 10-YEAR YIELD (JANUARY 2020-MAY 2020)

IWD/IWF ratio

Chart 2 is from January 2022 to May 2022. During this time span, the 10-year yield climbed from 1.50% to about 2.85%. Simultaneously, the IWD/IWF ratio advanced roughly 20%, indicating strong value factor outperformance in an interest rate environment.

CHART 2 – IWD/IWF RATIO VS US 10-YEAR YIELD (JANUARY 2022-MAY 2022)

IWD IWF ratio versus 10 year yield

Building Confidence in Trading

Building Confidence in Trading

Having a gameplan is paramount

A lot of traders approach the market without having a defined game-plan, that is, not having a full understanding of what their methodology is for identifying trade set-ups as well as what type of strategies they want to deploy to take advantage of their analysis.

Having a road-map in of itself will get you started off on the right foot and instill confidence before you get into the ‘heat of battle’. The following are key factors to know…

Know your methodology and toolbox

There are countless ways to analyze markets with no truly right or wrong approach. The key point here is that you have a methodology, and a relatively simple one, as too much complexity causes paralysis by analysis, an obvious enemy of confidence.

In addition to understanding your toolbox, whether it be technical, fundamental, or a combination of the two, you should have specific trade set-ups outlined that provide you with an edge, or statistical advantage over time.

What time-frame are you most comfortable with?

You should have a targeted time-frame. For example, the daily and 4-hr time-frame are excellent time-frames to concentrate on when trading FX. They provide ample information and opportunity, while slow enough that you aren’t forced to make decisions on the fly.

This is where day-trading can become quite difficult, as it is mentally taxing due to the pace at which markets can fluctuate in such a short time. This is also why day-trading holds such an allure, but you need to understand if it is for you or not first before diving in.

You need to be consistent with your trade objectives – don’t turn day-trades into swing-trades and swing-trades into day-trades, know your intentions ahead of time and stick to it. This will help steer clear of indecision, another clear enemy to confidence.

Which markets will you focus on?

Know the markets that you are trading and keeping your universe small is always a good idea. Not all asset classes or even instruments within the same asset class move the same, they have their own personalities. Knowing the behavior of a small universe of symbols will give you more confidence.

Understand your tolerance for risk.

One of the big mistakes traders often times make, is they tend to trade with too much risk. When you trade beyond what you’re capable of you will not only suffer outsized losses but your judgement becomes impaired. Once fear sets in, it’s easy to lose objectivity and make even more mistakes. The accumulation of losses and mistakes of course then leads to a loss of confidence.

What is an acceptable loss-per-trade, 0.5%, 1%, 2% etc.? This varies from person-to-person, and is dependent on strategy type and time-frame you’re focused on.

Breakout strategies have lower win percentages, but typically higher risk/reward ratios, while mean reversion strategies typically have higher win percentages with lower risk/reward ratios.

Trading breakouts will typically mean more consecutive losses, thus it is a good idea to trade with smaller size as a string of losers can add up quickly.

The latter, you still have to account for a string of losers, just perhaps not as many.

This is where looking at your trade history can help in determining how many losers in a row you could suffer (add a few extra in for good measure) and multiply that by the amount you risk per trade.

Can you handle that max figure? If not, adjust your size down. For example, if you see that you have had several instances of losing on six or seven trades in a row, then increase that to ten and multiply it by how much you risk per trade. This will give you a figure to work with in understanding how much of a drawdown a string of losers may cause.

As risk pertains to timeframes – If you are trading longer-term time-frames, then you can risk more per trade due to lower frequency and larger expected moves.

On the extreme end of the spectrum, if you are day-trading you could experience a large number of losers in a short period of time leading to an outsized accumulation of losses at a rapid rate.

Focus on the process, not the results.

This is easier said than done, but if you have a game-plan in place and can accept what you have at risk, focusing on the process of making good trades becomes significantly easier.

Utilizing a check-list, whether it be physical (beginners) or mental (advanced), can ensure you are checking off the right boxes before entering into a trade.

By being able to check off the appropriate boxes for a trade set-up, entry/exit(s), risk, etc., you build confidence in knowing you are doing theright thing, and have a plan in place for all scenarios.

It will also help keep you out of trades that you probably shouldn’t be involved with in the first place. Those types of low quality trades that end up as losers ultimately undermine your confidence in your ability to make good decisions.

Confidence all about maintaining self-efficacy.

How to maintain confidence

Perform periodical reviews of your trading journal and your trade history. This will help you correct course before you stray too far off of it.

Journaling and trade reviews are excellent at helping you do just that. You will see that you are doing some things well (do more of that) and doing some things poorly (figure out how to fix before it results in costly errors).

How to repair damaged confidence

When you are experiencing a large drawdown, first thing is first – get out of the fire. Take a step back from trading, you are almost certain to find immediate relief. Once you’ve had time to recuperate, study over your trade history and look for the mistakes that led to the drawdown.

Once you’ve isolated what you’ve been doing wrong, start trading again with reduced trading size. Get a few good trades on the board before returning to a normal trading size.

The focus here is not to make a lot of money, but rather restoring your confidence without causing further damage.

Overconfidence

After a profitable run you feel confident, which is good, but not if it enters into the overconfident zone. It’s just as important to learn how to handle success as it is to handle failure. If you don’t humble yourself, the market will do it for you.

As soon as you feel like you have it all figured out and maybe even begin to feel yourself getting a little out of control, it’s time to double-down on your efforts of making sure you are following your trading plan and process.

Remember: Winning trades can be bad, losing trades can be good. If you take a trade according to plan and it results in a loser, that is just part of trading, but still a good trade. But if you take a trade outside of your game-plan and it makes you money, this is a bad trade.

 

Short-Term Forex Signals via the IGCS Indicator

Short-Term Forex Signals via the IGCS Indicator

Short-Term Signals via the IGCS Indicator

Unlike market sentiment which shows overall positioning in a market, including positions held by institutions and large market participants, IGCS is derived from IG retail clients’ live trades, representing the percentage of traders holding long and short positions in a specific market at any point in time.

The rationale behind this is that retail investors often try to predict tops or bottoms in anticipation of a reversal or a ‘big move’, without accounting for the positions held by large market players that may be driving price action. For this reason, when trading on sentiment, IGCS is usually followed as a contrarian indicator with a directional bias, either bullish or bearish, often with prices driving in the opposite direction from the currently held retail positioning in that market. This can create divergence between the IGCS reading and price action, illustrating the effect of crowd psychology on traders.

An example of this is shown below, where client sentiment for USD/JPY is showing a strong bullish bias, with 72% of retail traders holding net-long positions, yet the trading signal generated is bearish. Likewise for USD/CAD, 81% of retail traders are holding net-long positions but once again, there is a bearish signal, highlighting bearish trend continuation potential.

Interpreting IGCS for Short-Term Trends

As discussed in the trading trends with IGCS article, using the raw numbers is the simplest and most common method used to determine current positioning; but another way of incorporating that data is to read signal potential with IGCS, specifically for short-term signals is by looking at the change in daily and weekly net positions, also known as IGCS delta. A detailed explanation of client positioning as well as the interpretation of IGCS delta can be found by accessing the full sentiment report.

As shown below, despite IGCS showing a strong bullish bias, with 78.16% of retail client holding long positions, the trading signal generated is still bullish, and this is due to the recent change in longs v/s shorts. While Gold may retain a strong imbalance of longs versus shorts, the fact that many shorts opened and (17.99% in a day and 14.04% in a week) many longs closed (-.99% in a day and –15.33% in a week) can keep the door open for bullish strategies.

This would be placing preference to the delta in positioning on Gold, versus the big picture reading as a whole.

To interpret the change in IGCS, for the purpose of determining short-term signals, is given to the daily and weekly changes in long and short positions. The above shows that net-long positions have decreased by 0.99% from the previous day and by 15.33% from the previous week weekly. Meanwhile, net-short positions increased by 17.99% from the previous day and by 14.04% from the previous week. Because net long positions have decreased while net short positions have increased, IGCS in this case would result in a bullish trading signal as retail traders may look at an increase in short positions as a signal to scale down on long positions and increase short holdings in an effort to sell gold at its peak, therefore increasing selling pressure for retail traders.

USD/JPY Slips Lower After BoJ Stands Pat but Hints on Improving Inflation Outlook

USD/JPY Slips Lower After BoJ Stands Pat but Hints on Improving Inflation Outlook

The Bank of Japan today said that consumer inflation may be moving higher, giving a nudge towards tighter monetary policy conditions in the months ahead. In the Quarterly Outlook, the BoJ lowered their forecasts for core inflation to 2.4% from 2.8% but said,

‘Consumer inflation is likely to increase gradually toward the BOJ’s target as the output gap turns positive, and as medium- to long-term inflation expectations and wage growth heighten,’ adding, ‘the likelihood of realizing this outlook has continued to gradually rise, although there remain high uncertainties over future developments,’

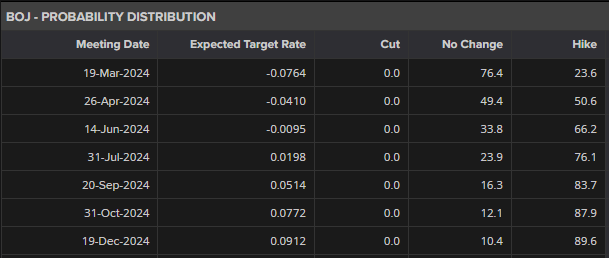
The latest BoJ interest rate probabilities see a rough 50/50 chance of a rate hike at the April 26th central bank meeting.

image1.png

While the Bank of Japan may have added a bit of support to the Japanese Yen, the medium-term outlook for USD/JPY will be driven by the US dollar and upcoming data releases and events. This Friday the latest Core PCE report will drive price action going into next week’s FOMC meeting. While the Fed is fully expected to leave rates untouched, Chair Jerome Powell’s comments in the post-meeting press conference will need to be followed closely. The markets will be looking for Chair Powell to give some sort of indication about when the central bank expects to begin its rate-cutting cycle, and any comment around this will steer the US dollar.

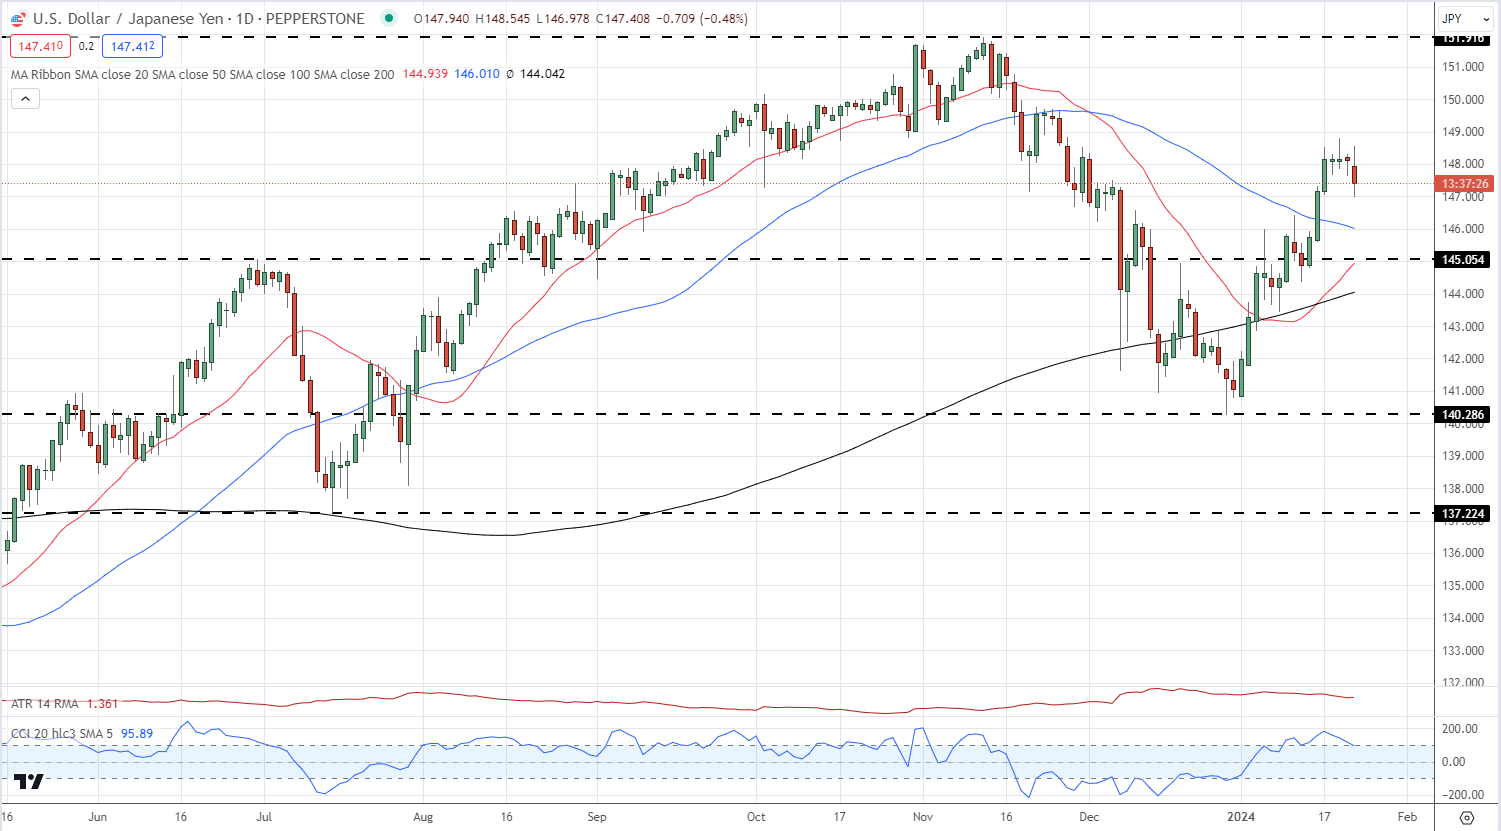
USD/JPY has turned lower from last Friday’s 148.80 multi-week high and has tested 147.00 so far today. The pair remain supported by all three simple moving averages and a break below 146.00 opens the way to 145.00 or lower. A combination of Yen strength and US dollar weakness could see the pair eventually move down to 140.00. The upside remains capped and it will take an above forecast US inflation release or a hawkish Chair Powell next week to send USD/JPY back to 150.

USD/JPY Daily Price Chart

image2.png

Retail trader data show 26.13% of traders are net-long with the ratio of traders short to long at 2.83 to 1.The number of traders net-long is 7.17% higher than yesterday and 15.88% lower from last week, while the number of traders net-short is 2.86% higher than yesterday and 14.98% higher from last week.

We typically take a contrarian view to crowd sentiment, and the fact traders are net-short suggests USD/JPY prices may continue to rise.

Modest Start to the Week for AUD, PBOC Maintains Benchmark Rate

Modest Start to the Week for AUD, PBOC Maintains Benchmark Rate

Chinese Benchmark Rates Unchanged – AUD Lower

Chinese officials kept lending rates unchanged on Monday, leaving the one year and five year loan prime rate (LPR) at 3.45% and 4.2% – in line with expectations. Markets continue to opine for further accommodation which was evident after last week’s medium-term lending facility (MLF) rate was left unchanged, sending markets lower.

image1.png

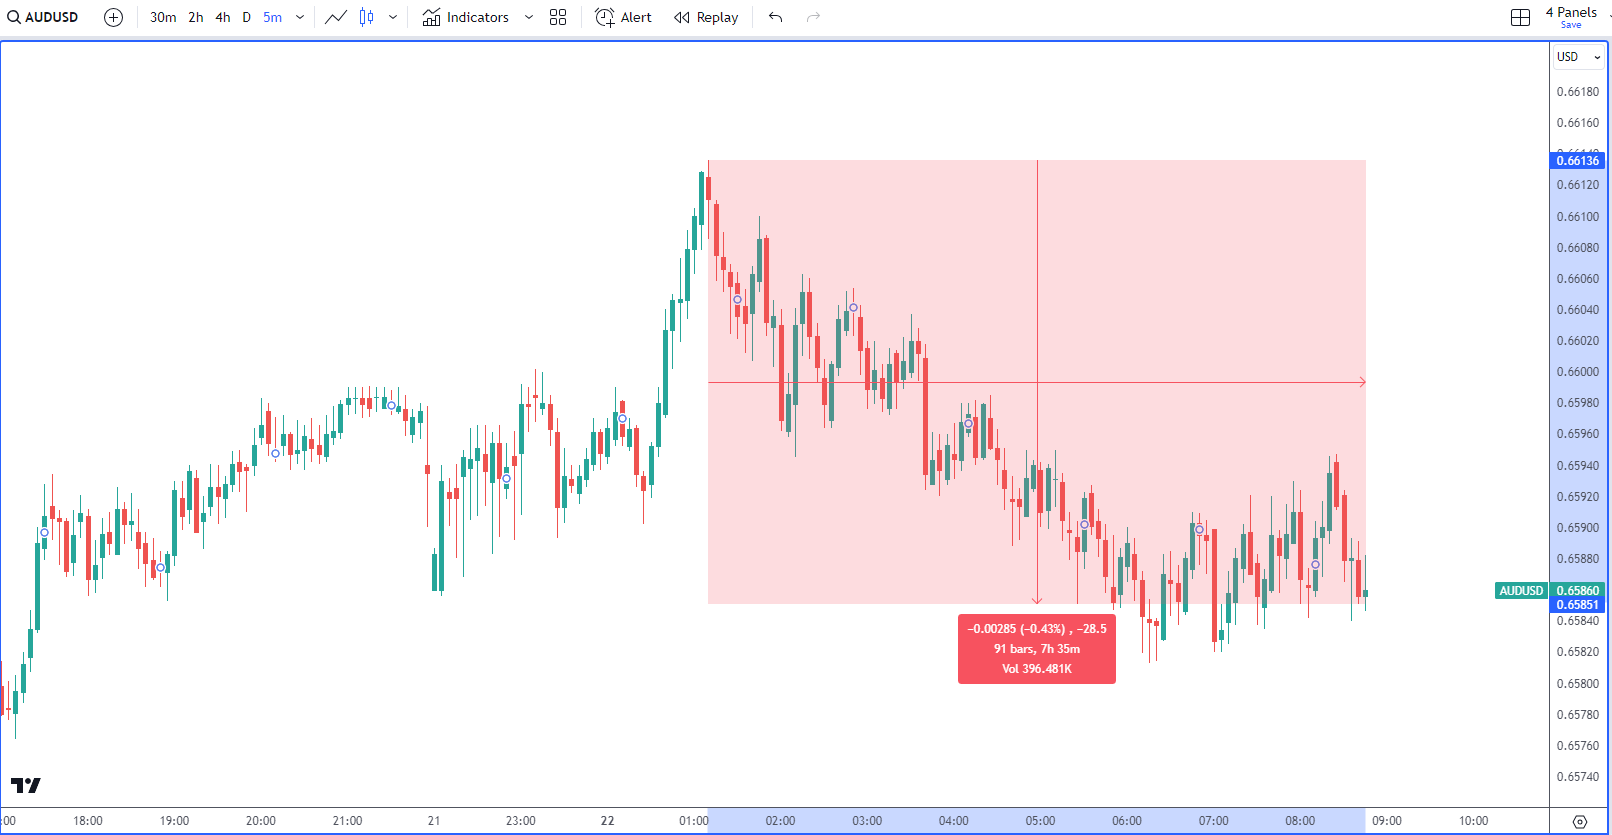
On the back of the decision to leave Chinese benchmark rates on hold, AUD/USD trended lower as can be seen on the 5-minute chart below. The Australian economy and currency is impacted by developments in China due to its close trading ties to the Asian powerhouse which also happens to be the second largest economy in the world.

AUD/USD 5-Minute Chart

image2.png

AUD/USD Pullback Possible on Generally Positive Risk Sentiment (S&P 500)

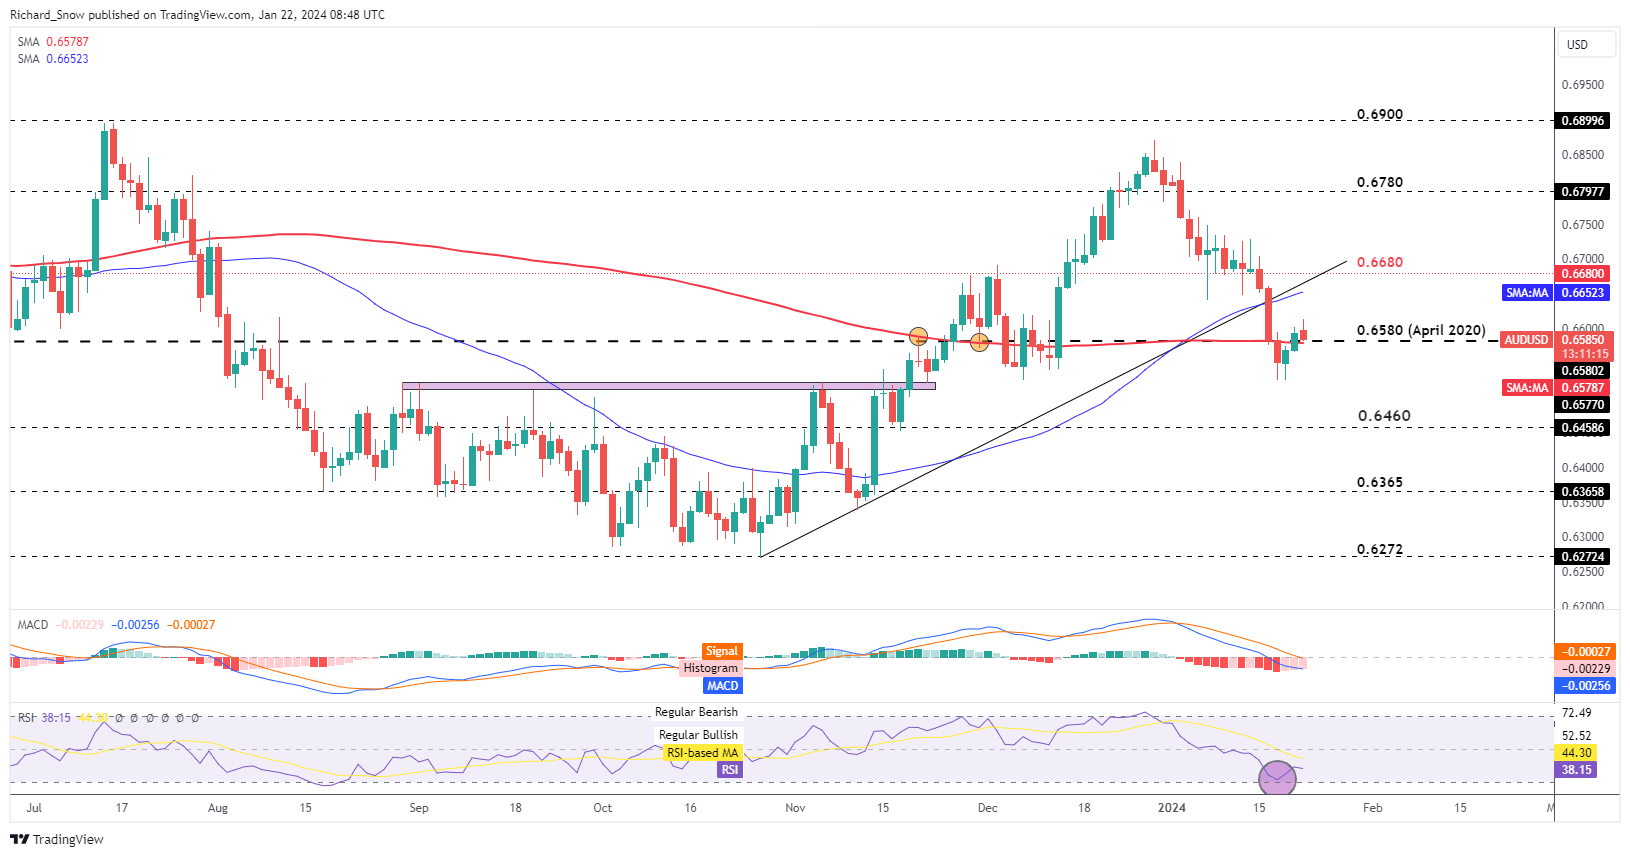
The AUD/USD recovery is off to a slow start on Monday, in fact the pair is slightly down on the day at 09:00 GMT. The 0.6580 level offers immediate support and it coincides with the 200 simple moving average (SMA).

Respecting this level on an intra-day time frame, sets up a continuation of the recent lift in the pair- boosted by a surge in the S&P 500 late last week. Mega-cap tech earnings are due for release this week with Netflix on Tuesday and Tesla on Thursday which could provide a further boost to sentiment. One thing to always be aware of is any forward guidance issued at these announcements, including any challenging conditions around the EV market amid increased competition in the space and economic headwinds as the global outlook remains suppressed.

However, keep an eye on the MACD, negative momentum is yet to reverse and could re-engage if 0.6580 fails to hold.

AUD/USD Daily Chart

image3.png

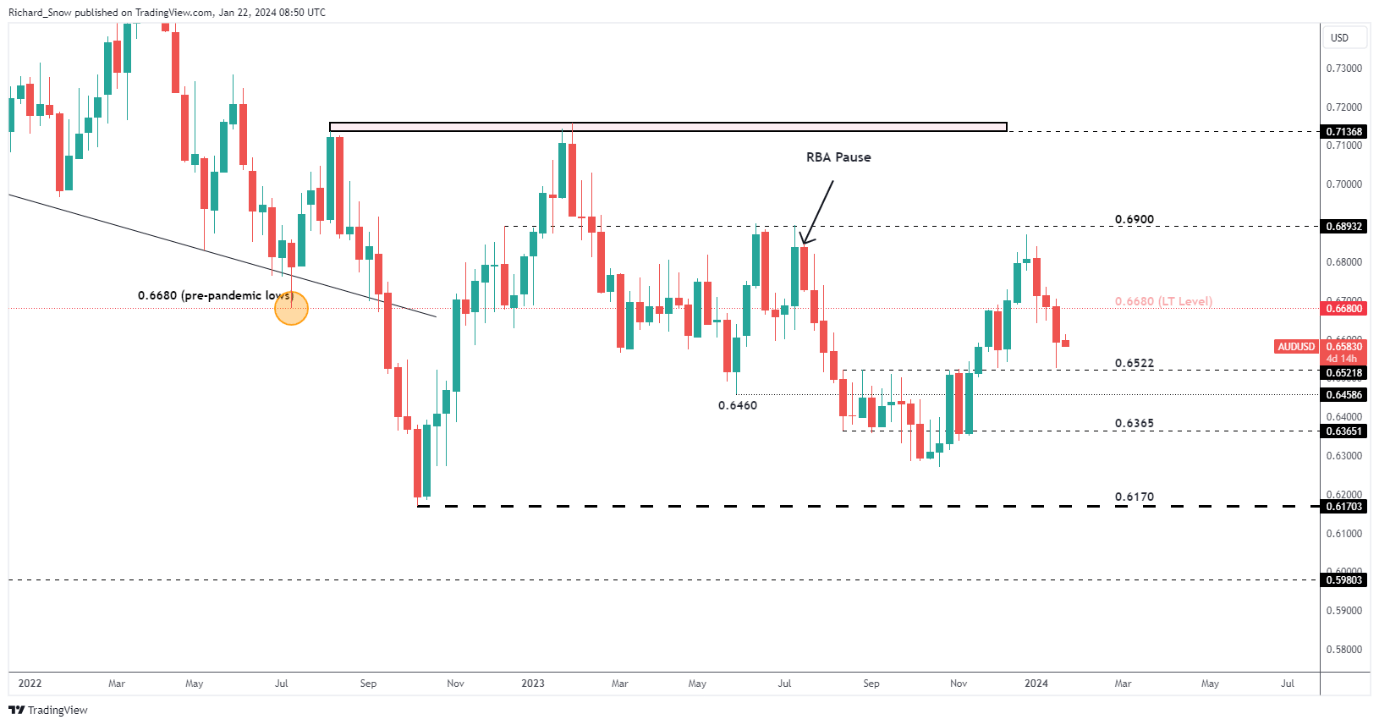
The weekly chart has AUD/USD within a medium-term downtrend, however,, lower prices were repelled at 0.6522. With a lot of US centered data due this week it appears the Aussie dollar will be at the mercy of the dollar – likely to respond to short-term volatility.

AUD/USD Weekly Chart

image4.png


US Dollar Forecast: EUR/USD, USD/JPY, USD/CAD & AUD/USD’s Path Tied to US PCE

US Dollar Forecast: EUR/USD, USD/JPY, USD/CAD & AUD/USD’s Path Tied to US PCE

The U.S. dollar, as measured by the DXY index, has staged a remarkable turnaround recently, supported by the significant rebound in U.S. Treasury yields on the back of a hawkish repricing of the Federal Reserve’s monetary policy outlook.

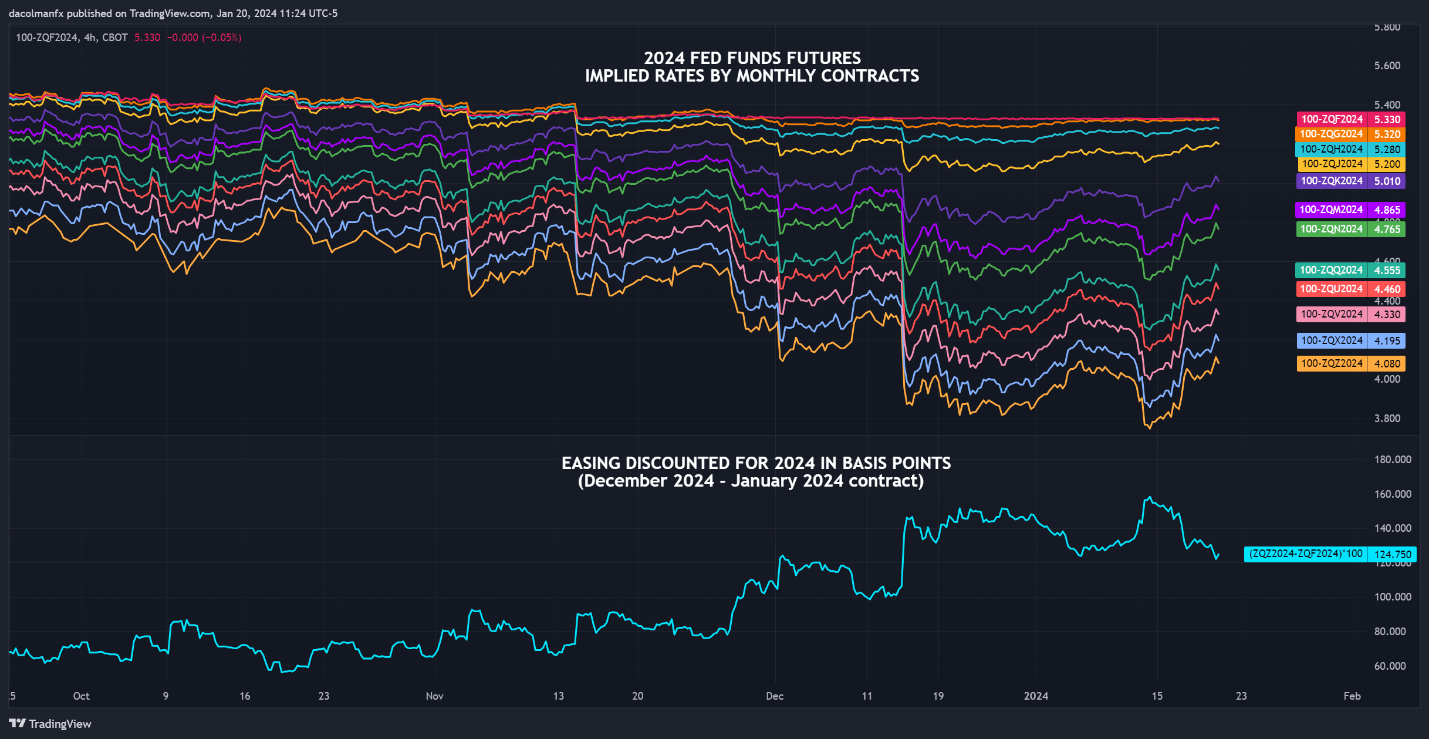
To provide context, as recently as last Friday Wall Street was forecasting nearly 160 basis points of interest rate cuts for the year, but these dovish expectations have since been scaled back, with markets now discounting only 124 basis points of easing for the highlighted period.

2024 FED FUNDS FUTURES CONTRACTS (IMPLIED YIELDS)

A graph of different colored lines  Description automatically generated

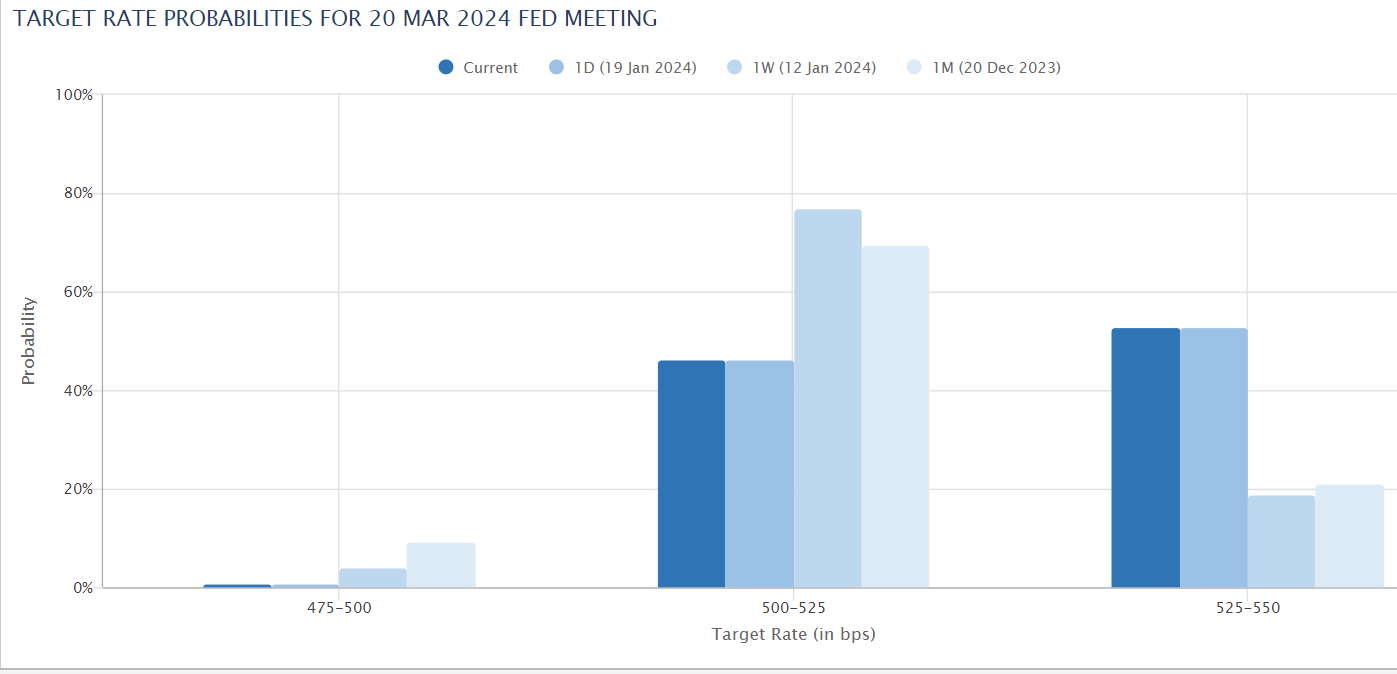
he prospect of the FOMC starting to lower borrowing costs at its March meeting has also diminished, falling from roughly 77% one week ago (January) to 46% today. This situation has undoubtedly contributed to the greenback’s positive performance against its top peers.

For a complete overview of the U.S. dollar’s technical and fundamental outlook, request your complimentary Q1 trading forecast now!

image2.png

With U.S. economic activity growing above trend, the labor market extremely tight and progress on disinflation stalled, it would not be surprising to see traders further reduce bets on how much policymakers will cut rates in 2024, especially if incoming data doesn’t cooperate.

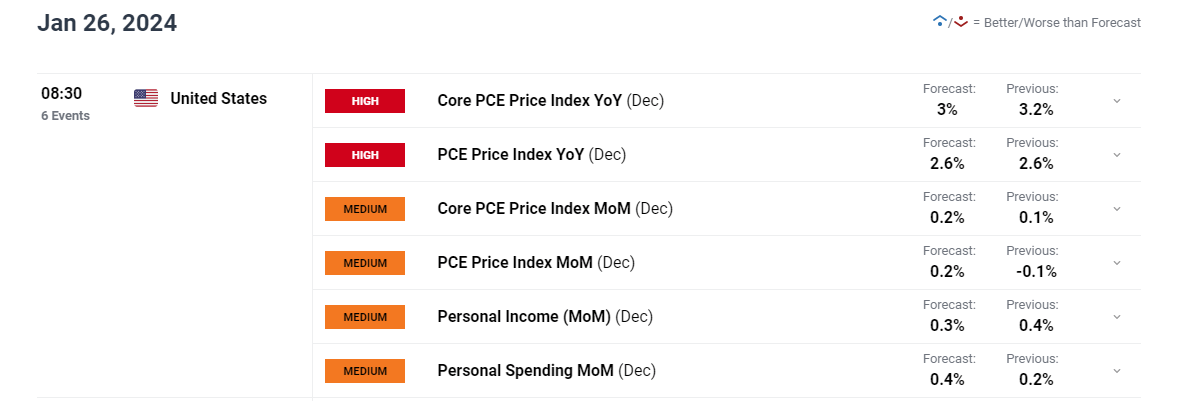
We’ll have more clarity on the economy and consumer prices in the coming days when the U.S. Bureau of Economic Analysis unveils last month’s personal income and outlays numbers. That said, traders should pay attention to two things in the report: consumer spending growth and core PCE.

The screen capture below, sourced from DailyFX’s economic calendar, presents the consensus estimates for the upcoming release.

UPCOMING US DATA

image3.png

Any results above consensus estimates could indicate that the U.S. economy continues to run hot and that it would be premature to ease the policy stance. This scenario could drive Treasury yields higher, reinforcing the U.S. dollar’s bullish reversal. Conversely, subdued numbers could validate easing expectations, putting the greenback back on a depreciating path.

Interested in learning how retail positioning can offer clues about EUR/USD’s near-term trajectory? Our sentiment guide has valuable insights about this topic. Download it now!

EUR/USD TECHNICAL ANALYSIS

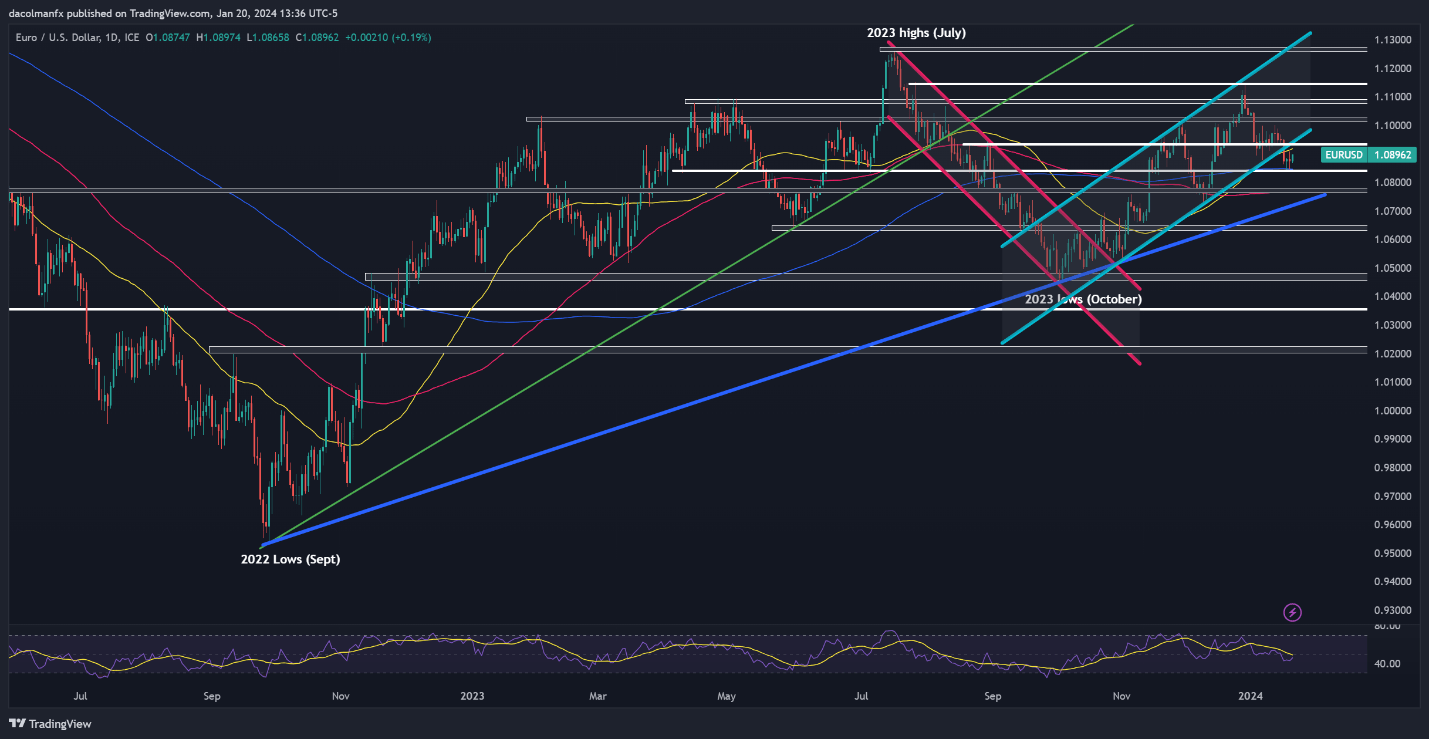
EUR/USD retreated earlier in the week but managed to hold above its 200-day simple moving average at 1.0840. To bolster sentiment toward the euro, it is crucial for this support zone to remain intact; failure to do so could result in a pullback towards 1.0770, followed by 1.0700.

On the flip side, if buying momentum returns and triggers a market turnaround, primary resistance is located in the 1.0910-1.0930 band. Sellers are expected to vigorously defend this technical ceiling; however, a successful breakout could expose the 1.1020 area.

EUR/USD TECHNICAL CHART

A screen shot of a graph  Description automatically generated

For a complete overview of the Japanese yen’s medium-term prospects, make sure to request the Q1 trading forecast!

USD/JPY TECHNICAL ANALYSIS

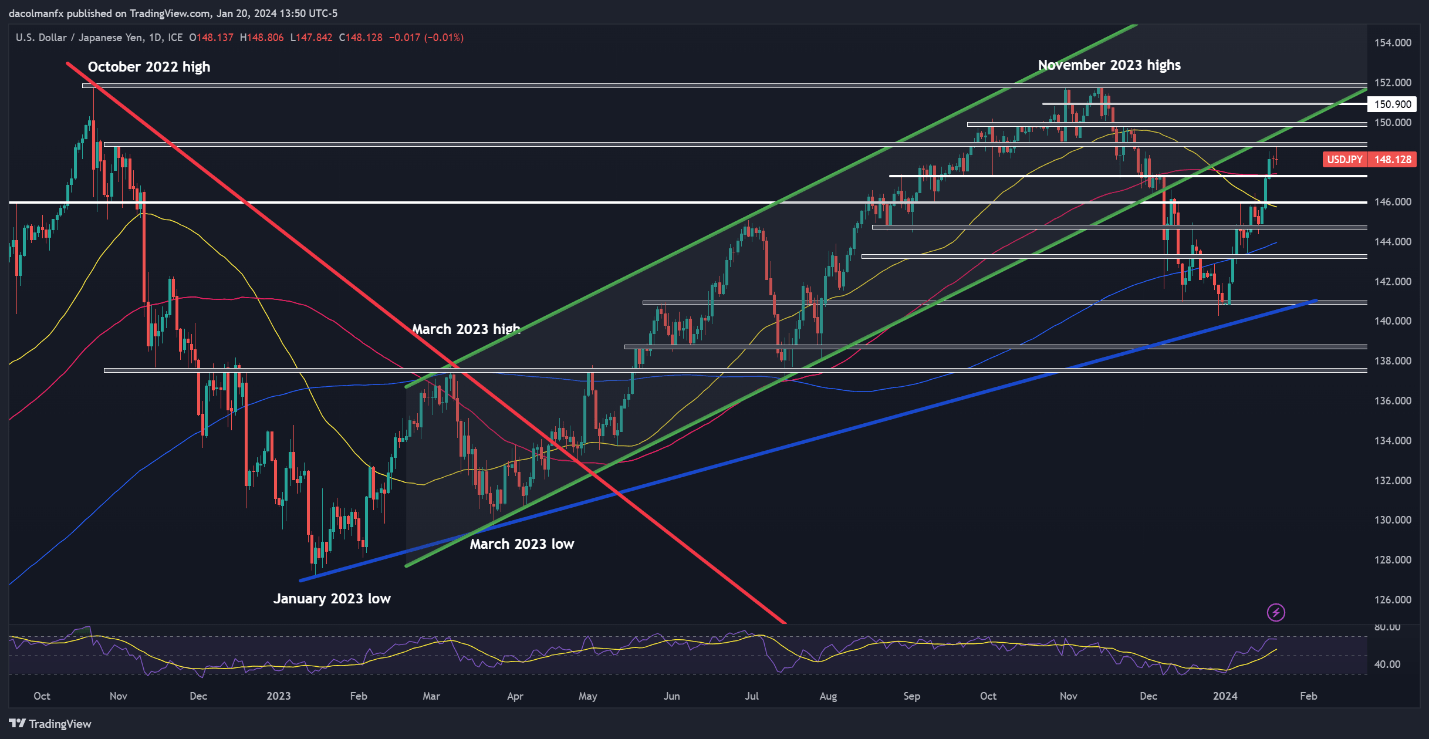
USD/JPY rallied earlier in the week, but its upward momentum diminished as the weekend approached when prices failed to clear resistance near 149.00, which resulted in a modest retracement from those levels. That said, if losses intensify in the upcoming days, support appears at 147.40, followed by 146.00.

On the flip side, if bulls regain market control and propel the pair above 149.00, there’s potential for a rally towards the psychological 150.00 mark. If historical patterns serve as a guide, USD/JPY could be rejected from this area on a retest; however, a breakout could set the stage for a move toward 150.90.

USD/JPY TECHNICAL CHART

A screenshot of a graph  Description automatically generated

Want to know more about the correlation between retail positioning and USD/CAD’s trajectory? Download our sentiment guide to learn more about market psychology.

USD/CAD TECHNICAL ANALYSIS

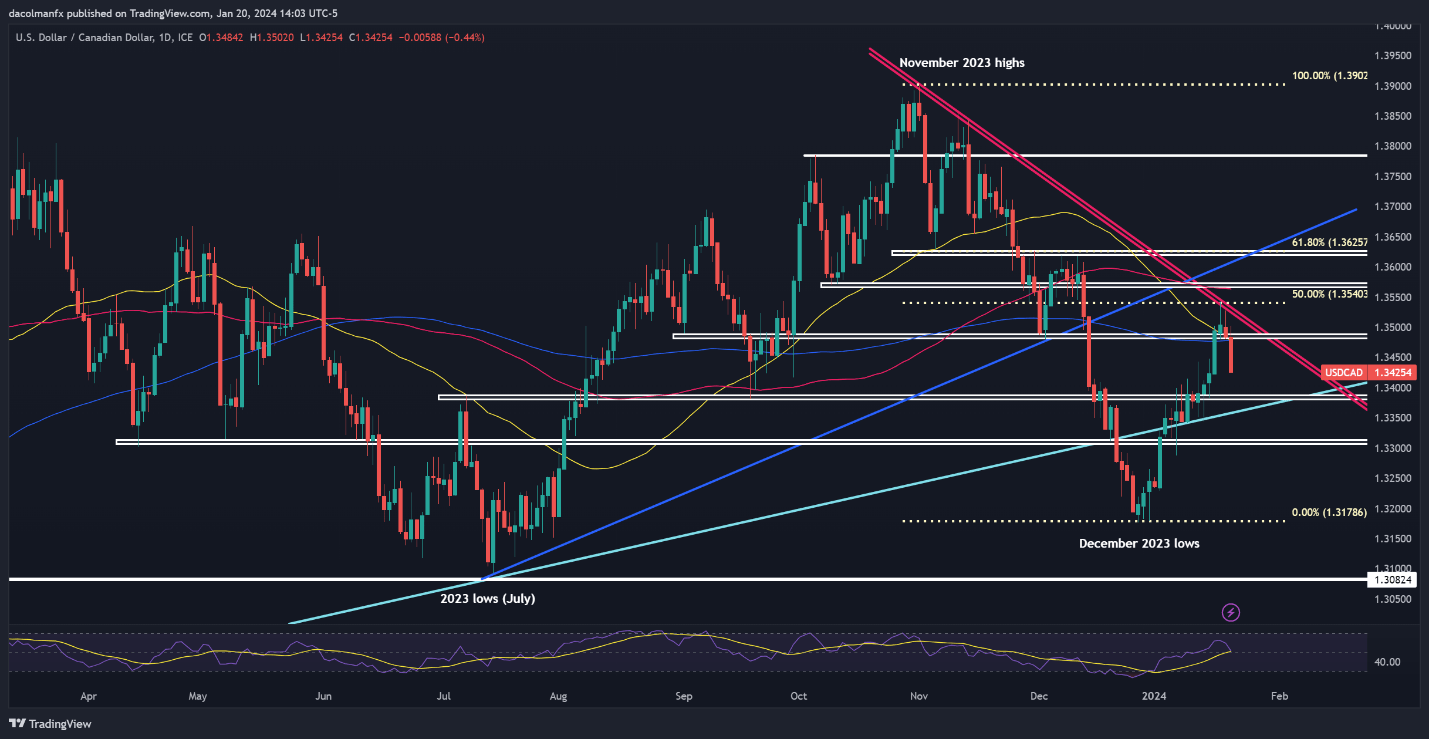
USD/CAD showed strong performance early in the week but took a sharp turn to the downside, losing its 200-day simple moving average heading into the weekend. This pullback followed an unsuccessful attempt to overtake trendline resistance and a key Fibonacci level near 1.3540.

If the bearish reversal gains momentum in the trading sessions ahead, initial support is expected at 1.3385, followed by 1.3355. On the other hand, if bulls stage a comeback and drive the pair higher, resistance is seen at 1.3480. With further strength, attention will be on 1.3510.

USD/CAD TECHNICAL CHART

A screenshot of a graph  Description automatically generatedCurious about what lies ahead for the Australian dollar? Find comprehensive answers in our quarterly trading forecast. Claim your free copy now!

 AUD/USD TECHNICAL ANALYSIS

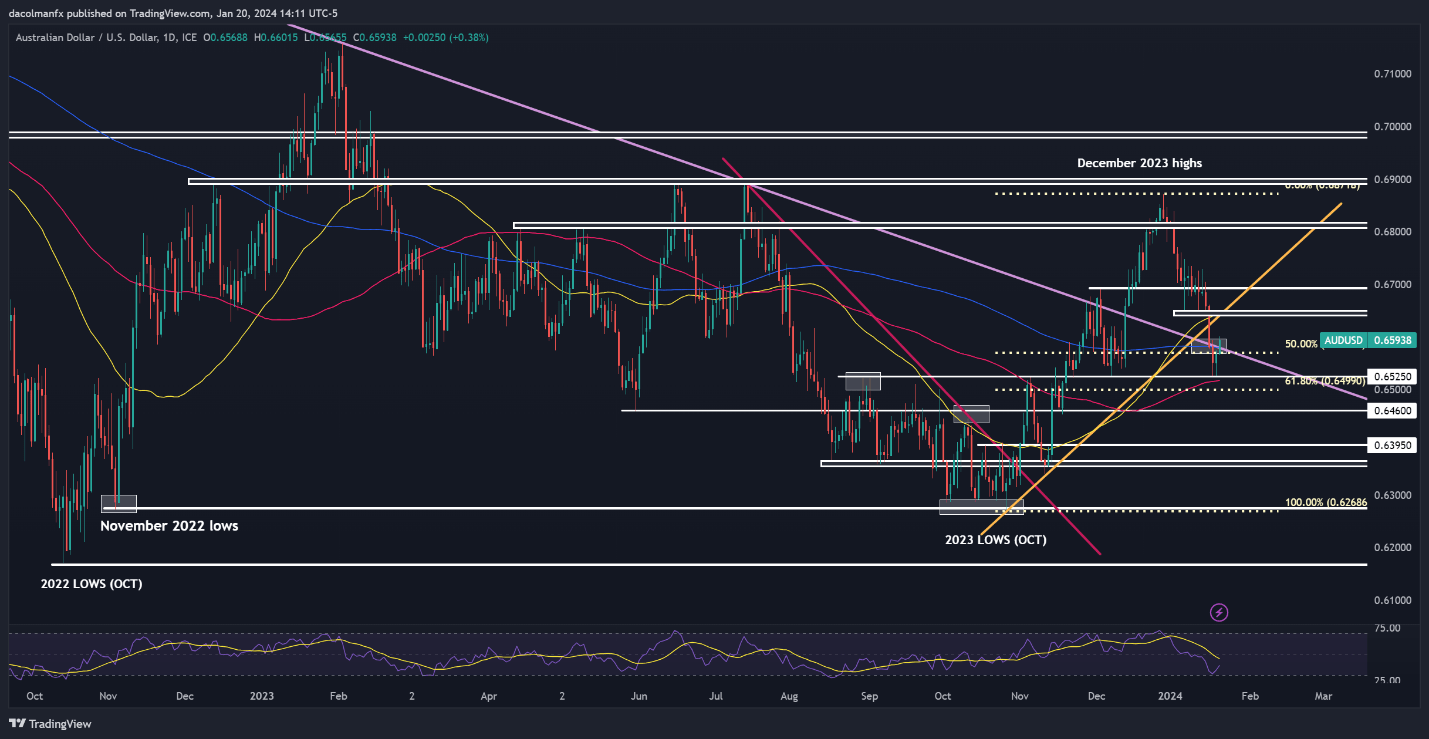
AUD/USD lost ground from late December through early this week, but has bounced off technical support at 0.6525, allowing prices to push past a key ceiling ranging from 0.6570 to 0.6580. Should the recovery gather strength in the coming sessions, initial resistance lies at 0.6650, followed by 0.6700.

Conversely, if sellers reappear and drive the pair below 0.6580/0.6570, the next area likely to offer technical support appears at 0.6525, which corresponds to the 100-day simple moving average. On further weakness, the focus will be on 0.6500, the 61.8% Fib retracement of the October/December rally.

AUD/USD TECHNICAL CHART

A screenshot of a computer screen  Description automatically generated