Big Mistake Leads Technical Trader to Top Three Tools

Big Mistake Leads Technical Trader to Top Three Tools

The 116 Death Trap

Developing your strategy comes at a cost –often a lot of time, money and frustration. I came to this realization in 2003 as USD/JPY was pulling back from multi-year highs. The ‘116 death trap,’ as I’ve dubbed it, was a seemingly rock solid zone of support. It had caught the lows since 2001 with numerous defenses suggesting a perfect opportunity for me to ‘catch the lows’ and cost average in. Even when price broke, my hope was that every rebound was the low. Not quite. In September of 2003, the death trap began with a drop of more than 12% over the next year, taking USD/JPY to lows not seen since the late-90s. Even a glimmer of hope offered by a multi-week rally in early 2004 reversed. With the pain finally too hard to tolerate, I exited at the lows. So much for cost averaging into a loser. That was my hard lesson learned.

USD/JPY Daily Price Chart

Where did I go wrong?

Well, there was a lot, but for starters, emotions are not your friend. Most of all, my error was not having a plan and not recognizing market conditions. Knowing the style of trading that works best for your personality, risk tolerance and goals is critical and without a plan you are on a ship without a rudder.

Everyone comes to this realization differently. I learned through years of managing market flow for one of the first brokers to offer online retail FX trading. It was through close observations of retail market flow and tracking near-term price-action that Ideveloped three basic principles for my technical trading strategy. It boils down to assigning a value for price, time and momentum.

Price Value – Key reversals, Fibonacci, High/Low-day Closes

It’s all about the levels – identifying support / resistance is a critical part of being able to create actionable trade ideas targeting or countering key levels in price. These lateral levels can be identified using various methods. The three I rely on most are key reversals (outside-day reversals), high and low-day closes and Fibonacci.

The word “Fibonacci” often appears in trading and it is likely that you have already seen or heard of it — for good reason. It is a simple measurement based on the golden ratio of 61.8%. This ratio can be observed everywhere in nature from trees to galaxy formations and is also very relevant to buying and selling behavior in markets. It is a tool you can implement in both trending and range-bound markets to help identify areas of possible support / resistance. We have a lot more in the education section: Fibonacci Application in Financial Markets (dailyfx.com)

Time value indicator – Slope and Trend lines

One discipline I rely heavily on is pitchfork and median-line analysis. The goal of this style of analysis is to identify the slope or gradient of a given market in an attempt to highlight when a price level may be significant. It is this time value that adds another dimension to the lateral levels identified earlier – these “confluence zones” are often points in price and time that can offer major pivots in near-term price-action. Trading into / off these inflection points todayform the basis of my favored technical trade setups.

Momentum value – RSI

The speed of a market can tell The Relative Strength Index (RSI). The RSI is an oscillator that is used as a measure of momentum — the speed of the recent price movement in either direction. While all oscillators are inherently backward looking, they can still be of value when you are trying to asses when the market maybe overextended in either the overbought or oversold conditions. The ability to assess the inertia of a given market is critical for near-term swing and trend trading as it offers a window into the possible longevity and strength of a given move as well as ideas on when it may expire.

Bottom line

Having a multi-faceted approach that takes into account price value, momentum value and time value could help steer you not only to possible opportunities, but also help you avoid failure. Knowing the condition of the market using price, time and momentum has been a major philosophy of my trading.

Markets Week Ahead: Gold Under Pressure, US Equities Rally, USD Holds Recent Highs

Markets Week Ahead: Gold Under Pressure, US Equities Rally, USD Holds Recent Highs

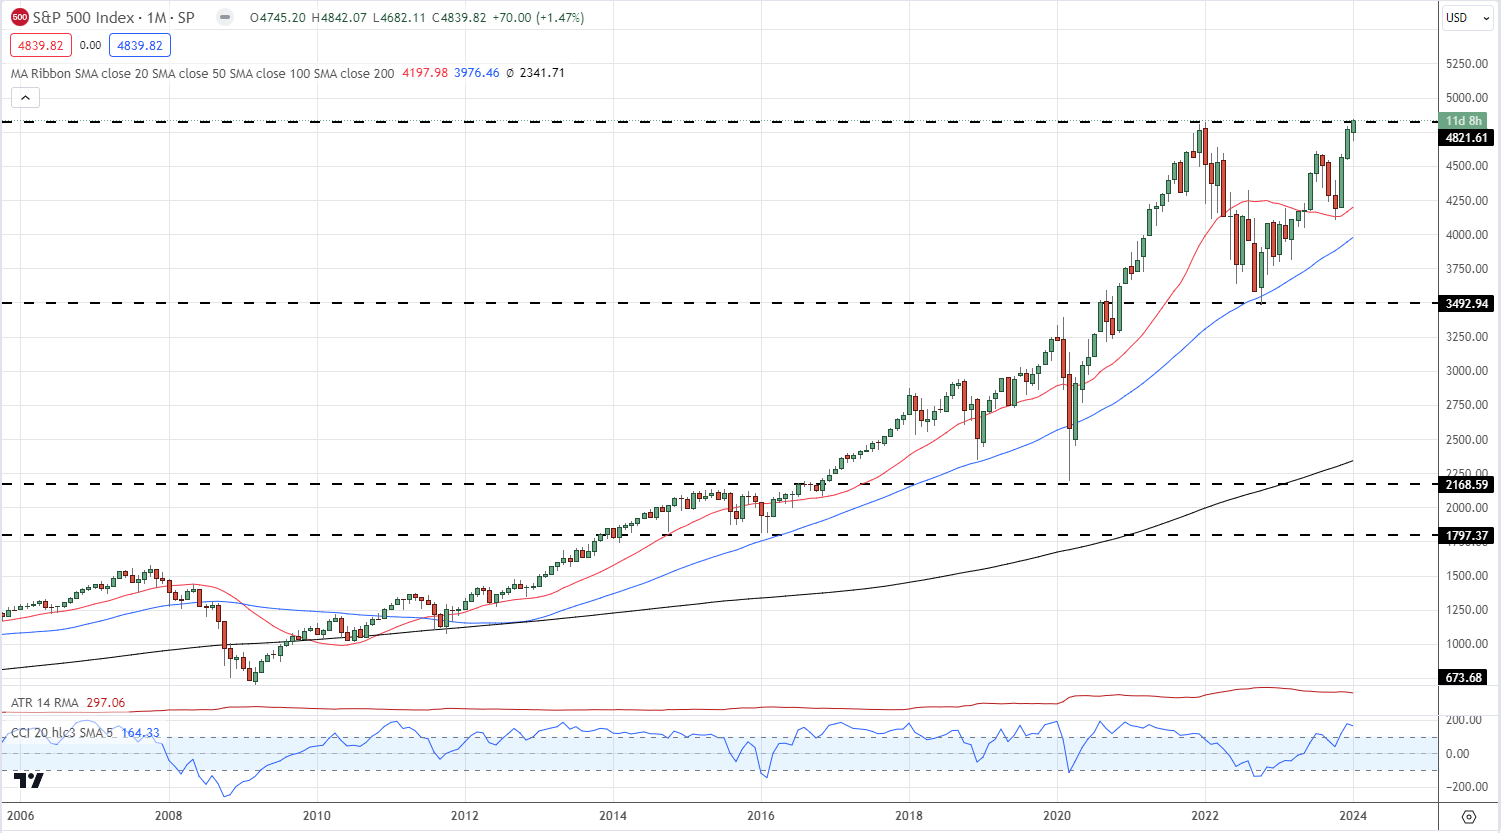
US equities are running ever higher with the S&P 500 and the Dow Jones posting fresh all-time highs on Friday. A strong in big tech stocks is behind the latest leg higher and with the Q4 earnings season already up and running, strong results from any of the ‘Magnificent Seven’ will likely see US indices rally further. The S&P 500 is dominated by these seven companies with Microsoft on its own having a 7.29% weighting in the index.

S&P 500 Monthly Chart

image1.png

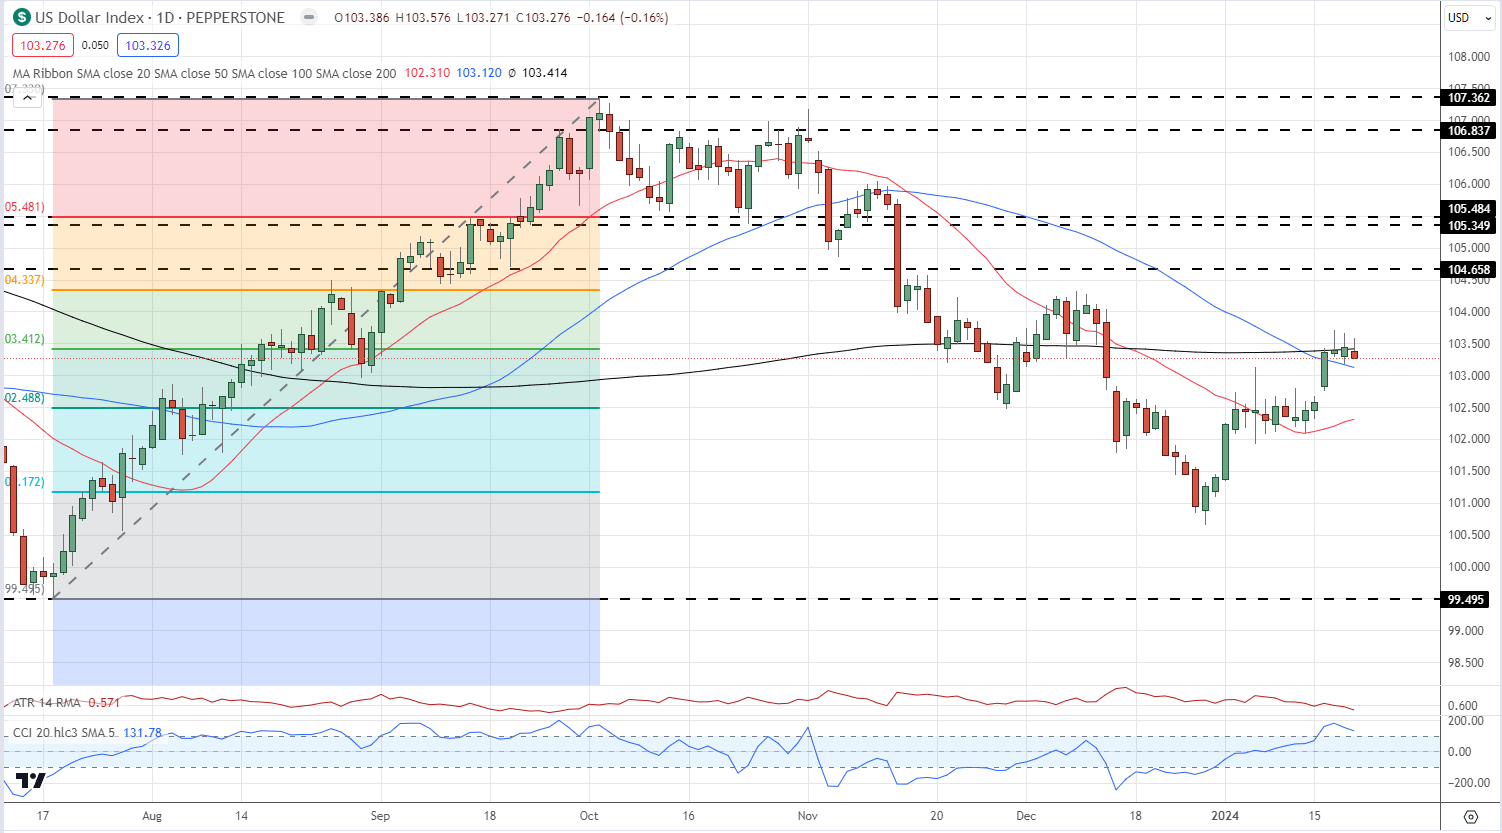
The US dollar has enjoyed a strong start to the year as US Federal Reserve Members push back against what they perceive to be excessively bullish interest rate cut expectations. US Treasury yields have backed up, underpinning the US dollar against a range of other currencies. Precious metals have been under pressure this week with gold twice testing the $2,000/oz. level.

Gold and Silver Under Pressure From Pared Back Interest Rate Cut Expectations

US Dollar Index Daily Chart

image2.png

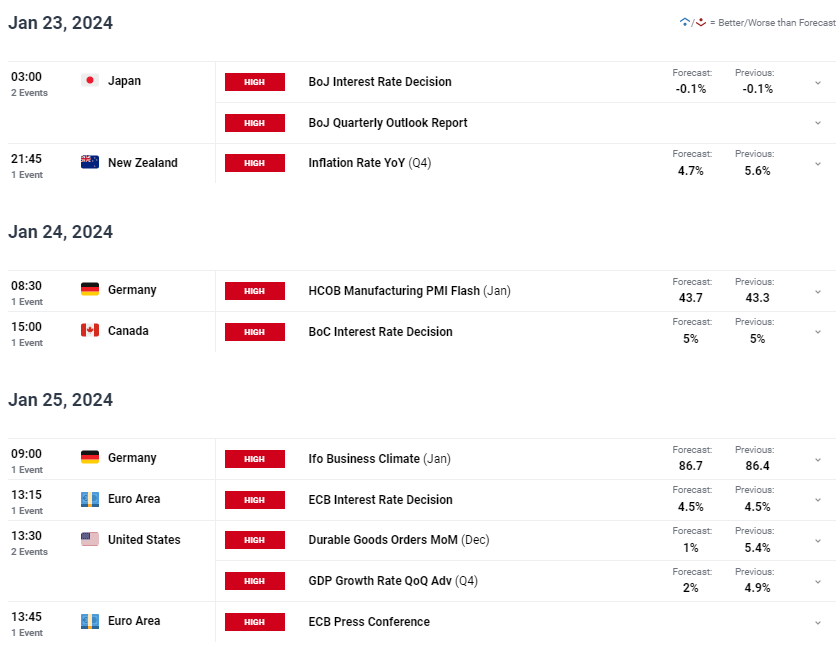
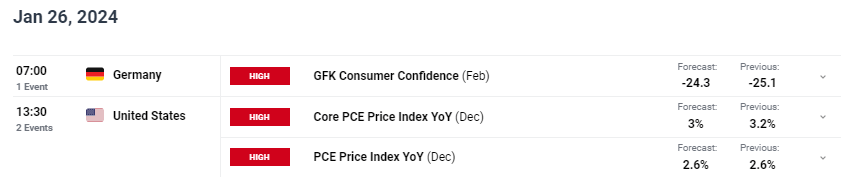
Aside from a raft of Q4 US earnings releases next week, the economic docket is packed full of high-importance data releases and events. The Bank of Japan Quarterly Outlook Report needs to be closely monitored, especially with USD/JPY at elevated levels, while Thursday’s ECB policy decision and Friday’s US core PCE release will be next week’s main attractions.

For all economic events and data releases, see the real-time DailyFX Economic Calendar

image3.pngimage4.png


Gold Price Weekly Forecast: Gold Rallies on US Rates, Geopolitical Worries

Gold Price Weekly Forecast: Gold Rallies on US Rates, Geopolitical Worries

Gold is getting a decent boost going into the weekend and beyond on a combination of escalating geopolitical tensions and a weaker US dollar. Last night’s US/UK coordinated attacks on Houthi rebels in Yemen have prompted fears of reprisals, and with both sides unlikely to back down the already fraught situation is likely to get worse.

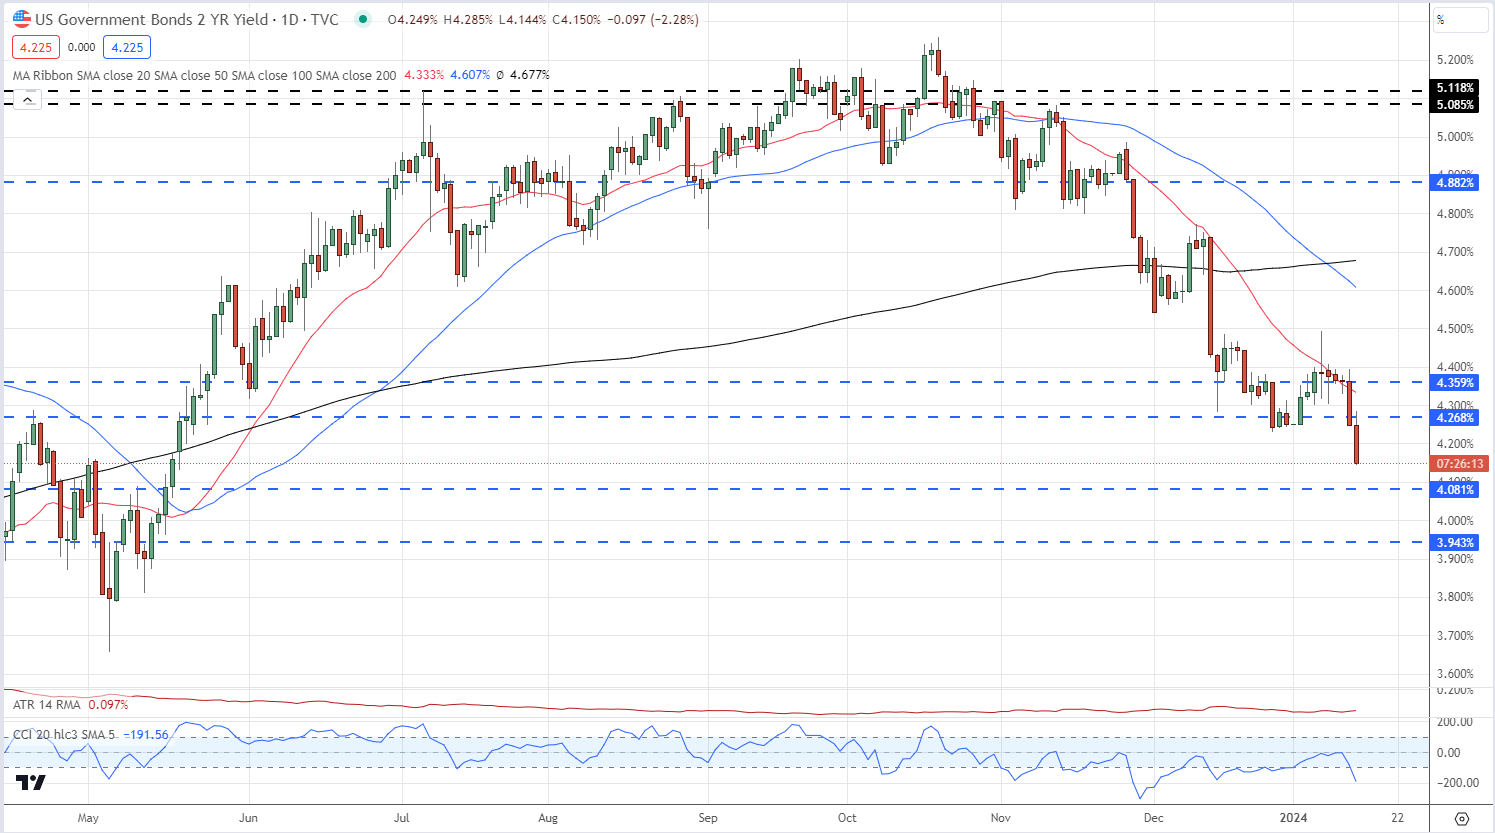
Short-dated US Treasury yields have been moving lower over the last few months as traders continue to price in a series of US interest rate cuts. The latest CME Fed Watch tool suggests the Federal Reserve will cut interest rates by a total of 150 basis points next year with the first of six quarter-point clips seen in March. The interest-rate sensitive US 2-year Treasury currently trades with a yield of 4,15%, down from a multi-year peak of 5.26% in mid-October and at the lowest level seen since mid-May last year. The latest leg lower in US yields is being driven by a combination of haven buying, Middle East fears, and rate expectations.

UST 2-Year Yield

image1.png

The technical outlook for gold also looks positive and further gains look likely, especially if the fundamental background remains the same. The series of higher lows and higher highs, leaving aside the December 4th spike, remains in place and is guiding gold higher, while a close, and open, above the 20-day simple moving average would help confirm the bullish outlook. The CCI indicator is turning higher and is moving from a multi-week oversold low. A break above the late-December $2089/oz. high would leave $2,100/oz. and then the $2,044/oz. spike vulnerable.

 Gold Daily Price Chart

image2.png

Retail trader data shows 58.42% of traders are net-long with the ratio of traders long to short at 1.40 to 1.The number of traders net-long is 1.90% higher than yesterday and 2.68% higher from last week, while the number of traders net-short is 4.90% lower than yesterday and 0.98% lower from last week.

We typically take a contrarian view to crowd sentiment, and the fact traders are net-long suggests Gold prices may continue to fall.

US Dollar Forecast: Reversal Possible; Setups on EUR/USD, USD/JPY, GBP/USD

US Dollar Forecast: Reversal Possible; Setups on EUR/USD, USD/JPY, GBP/USD

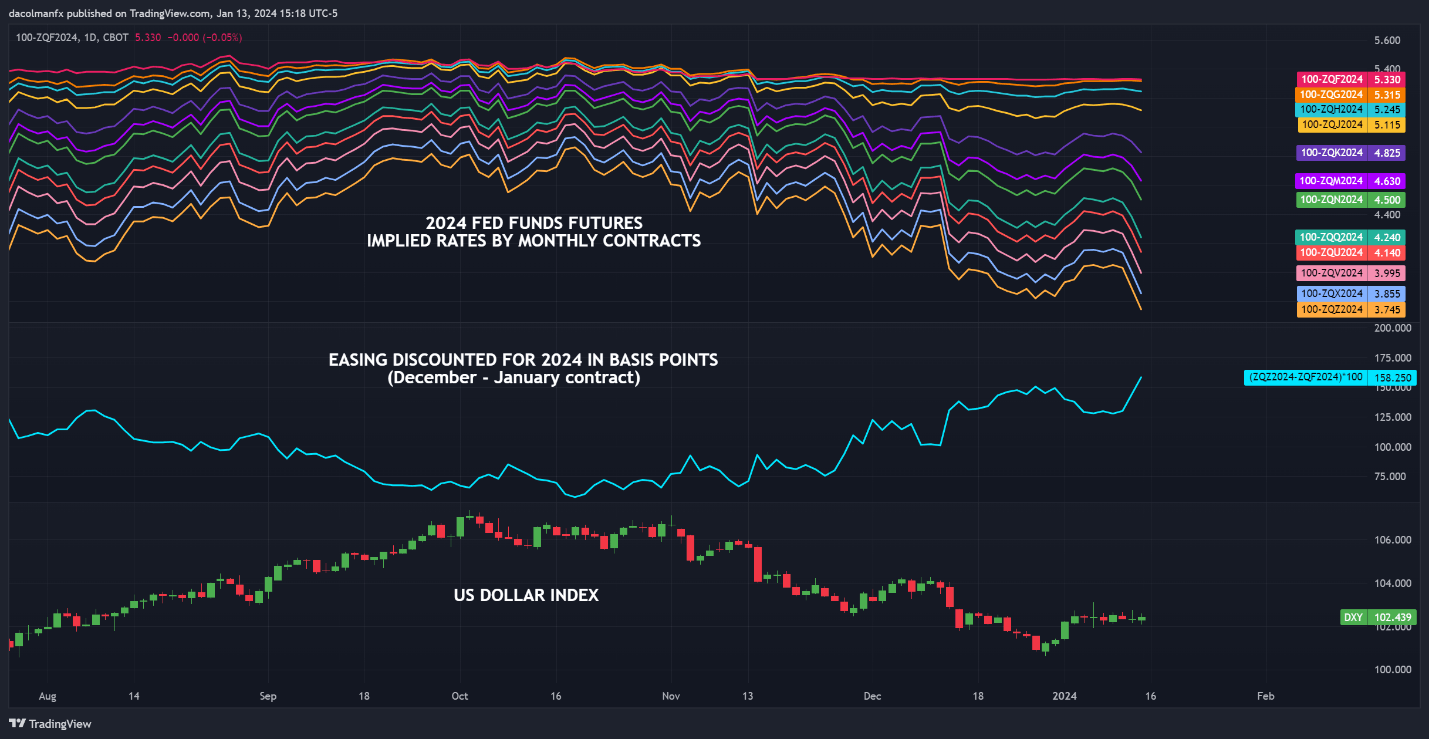
U.S. interest rate expectations turned quite dovish last week even though December headline and core inflation figures surprised to the upside. The chart below shows that traders are now discounting almost 160 bp of easing for 2024, 30 bp higher than seven days ago. In this context, the U.S. dollar (DXY) has stalled its recovery, consolidating slightly above the 102.00 level since the start of the year.

A graph of different colored lines  Description automatically generated

Wondering about the U.S. dollar’s technical and fundamental outlook? Gain clarity with our latest forecast. Download a free copy now!

Recommended by Diego Colman
Get Your Free USD Forecast
Get My Guide

Although the U.S. central bank is likely to reduce borrowing costs later this year, the deep rate cuts priced in by market participants seem extreme for an economy displaying remarkable resilience and still experiencing above-target and sticky inflation. Given current conditions, it would not be surprising to see traders scale back dovish wagers soon, paving the way for a market reversal.

Looking ahead to next week, the U.S. economic calendar is rather light, with markets closed on Monday for the Martin Luther King Jr. holiday. However, several Fed officials will have public appearances, so it is important to watch whether policymakers start pushing back against Wall Street’s dovish outlook. If they do, yields and the U.S. dollar may head higher.

For a complete analysis of the euro’s medium-term prospects, request a copy of our Q1 forecast!

EUR/USD TECHNICAL ANALYSIS

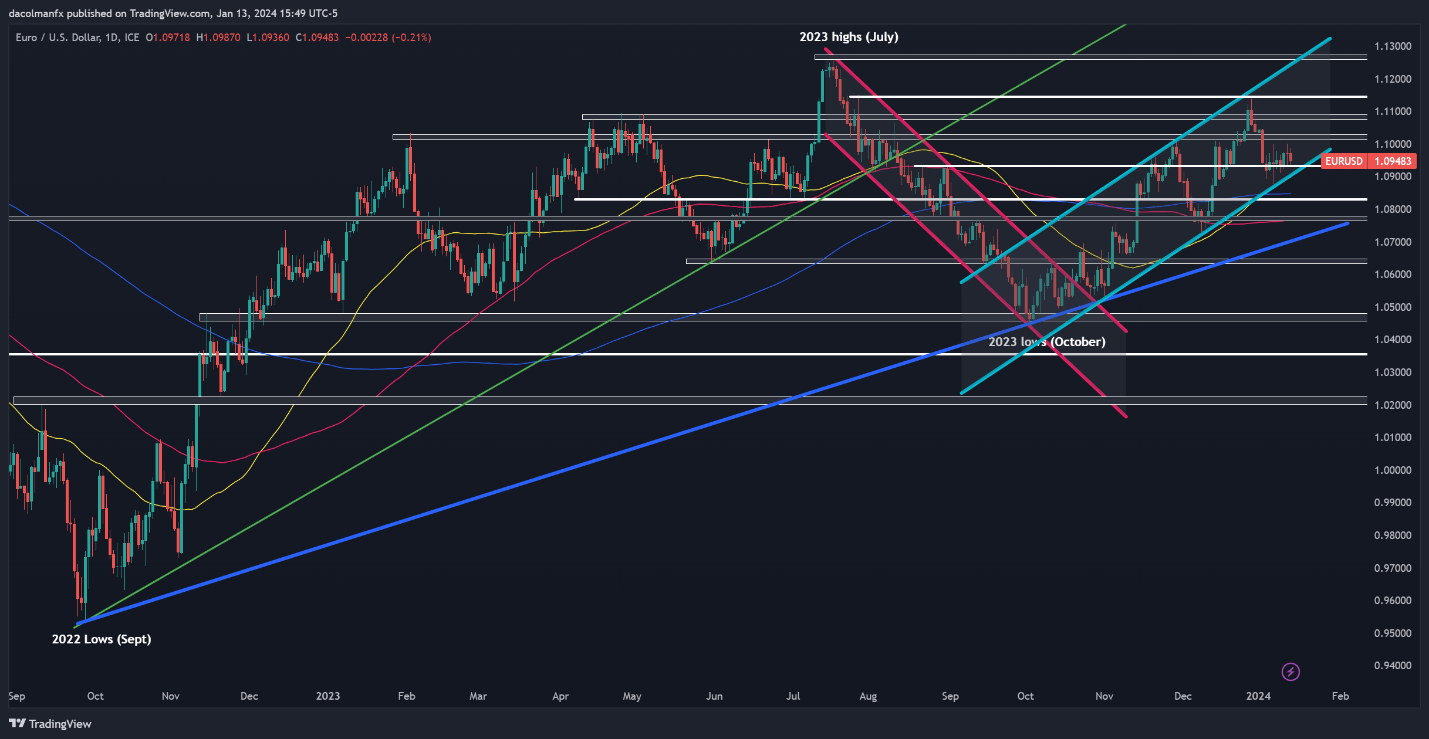
EUR/USD fell modestly on Friday, but remained above support near 1.0930. If this technical floor holds, there is potential for prices to resume their upward journey in the near term, in which case, we can’t rule out an advance towards 1.1020. Continued strength may then redirect attention to 1.1075/1.1095, followed by 1.1140.

On the flip side, should bearish momentum intensify and drive the exchange rate below 1.0930, the possibility of a retracement towards 1.0875 emerges – a key area where the 50-day simple moving average converges with the lower limit of a short-term ascending channel. On further weakness, sellers may initiate an assault on the 200-day SMA.

EUR/USD TECHNICAL CHART

A screen shot of a graph  Description automatically generated

 For a comprehensive view of the Japanese yen‘s fundamental and technical outlook, make sure to download our Q1 trading forecast today. It is totally free!

USD/JPY TECHNICAL ANALYSIS

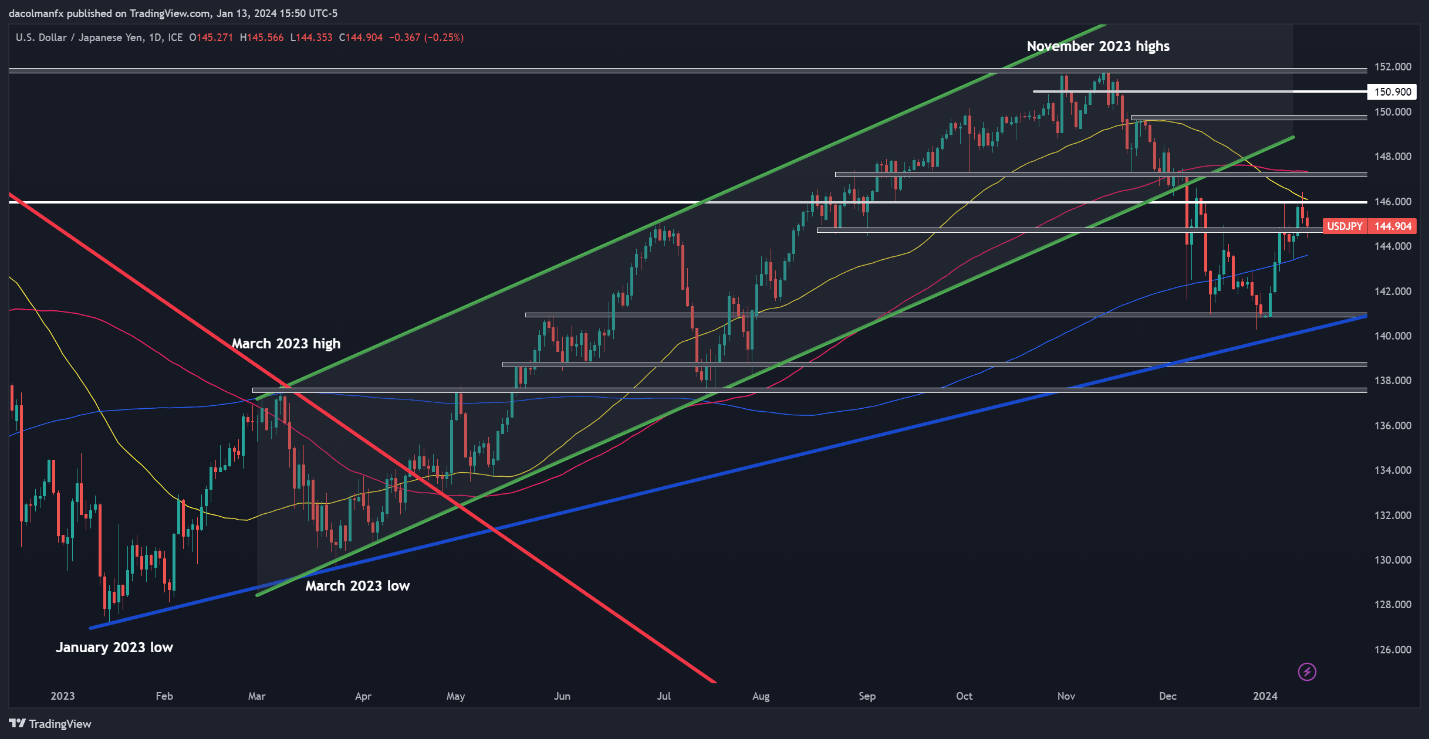
USD/JPY rallied early last week, but its upward momentum started fading when the pair failed to push past resistance near 146.00, eventually leading to a pullback towards support at 144.65. Bulls must defend this floor at all costs; failure to do so could expose the 200-day simple moving average at 143.60. Continued losses from this point onward could draw attention to the December lows below the 141.00 mark.

In the event of bulls regaining control of the market, technical resistance appears at 146.00, right around the 50-day simple moving average. If history is a guide, the pair could be rejected from this region on a retest, but a successful breakout could set the stage for a rally towards 147.25, slightly below the 100-day simple moving average.

USD/JPY TECHNICAL CHART

A screen shot of a graph  Description automatically generated


Markets Week Ahead: Gold Bid, US Dollar Struggles, US Equities Eye Fresh Highs

Markets Week Ahead: Gold Bid, US Dollar Struggles, US Equities Eye Fresh Highs

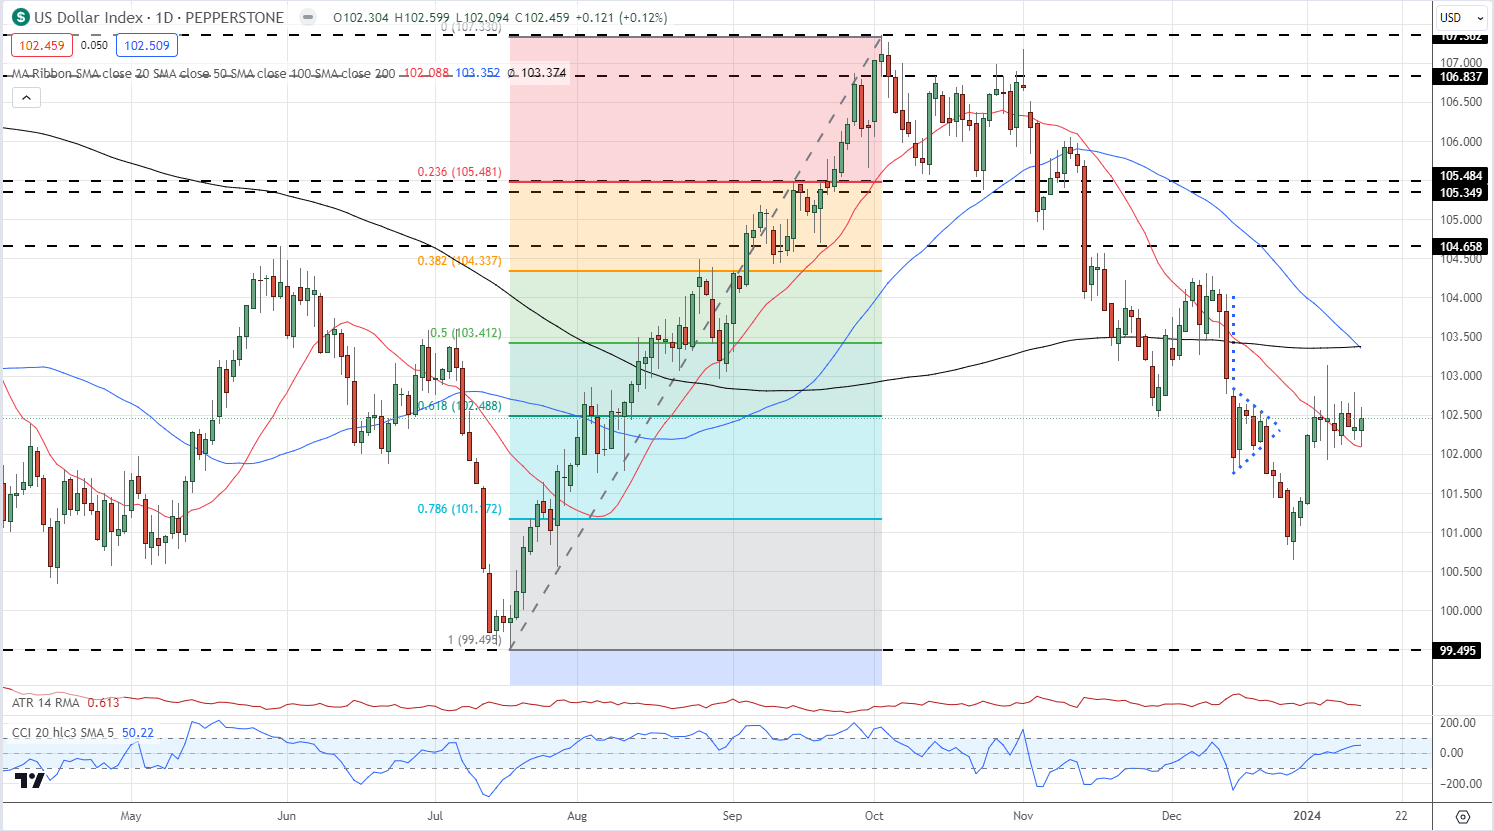
The US dollar has had a mixed few days and ends the week flat. Expectations remain that the Federal Reserve will cut rates six times this year for a total of 150 basis points, despite pushback from various Fed members, and this continues to weigh on the greenback. On the flip side, the dollar is getting a small bid due to the troubles in the Red Sea and surrounding area. In this environment, it is going to be difficult for the US dollar to make a concerted break, one way or another.

US Dollar Index

image1.png

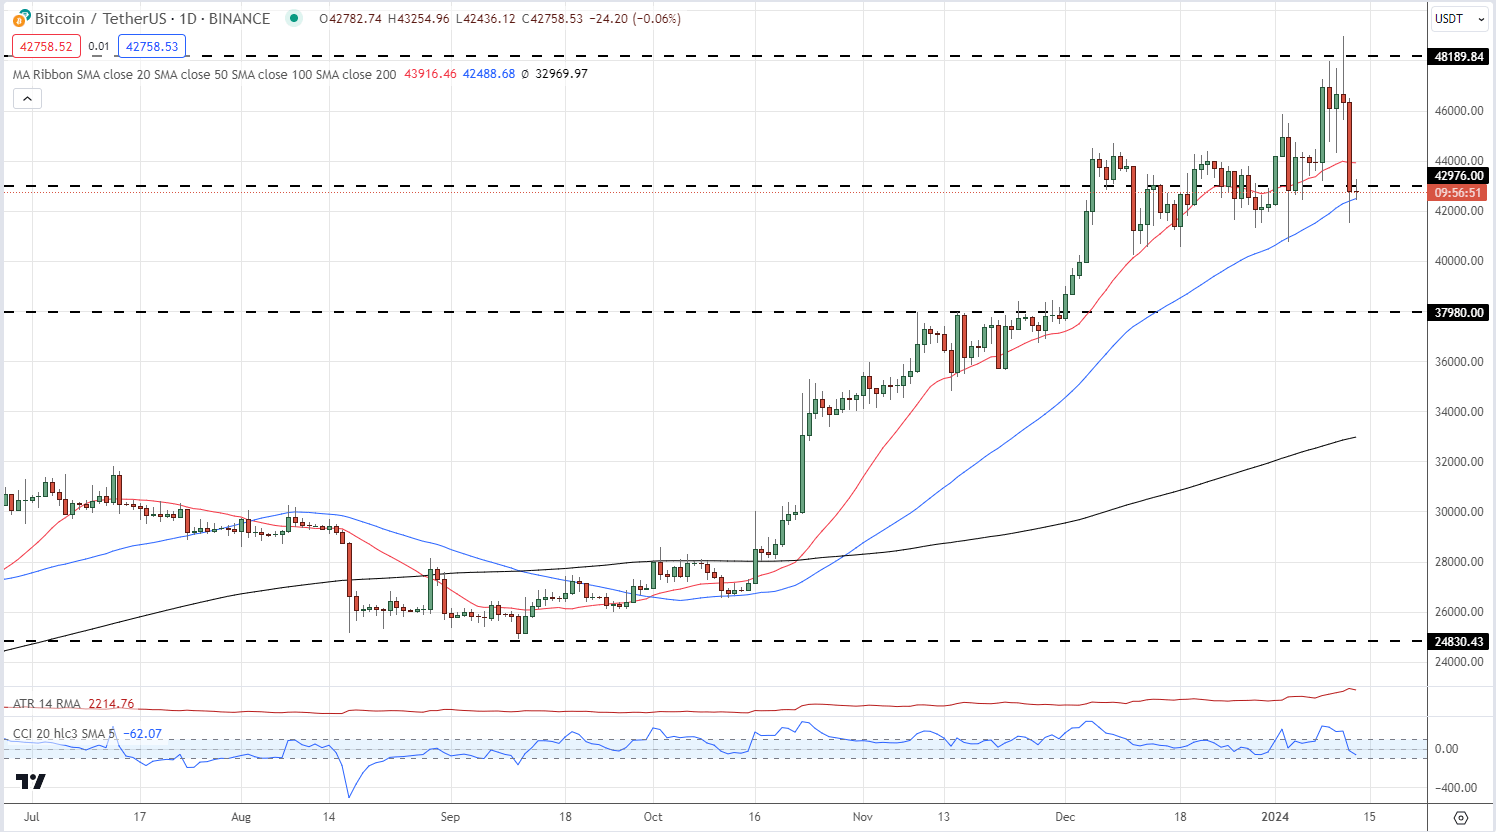
In the cryptocurrency space, eleven spot Bitcoin ETFs were finally approved by the SEC despite a week of mixed messages and fake tweets. Bitcoin traded just below $49k on Thursday before the market turned lower, leaving BTC/USD trading just below $43k. Despite the sell-off, Bitcoin retains a positive long-term outlook.

Bitcoin Daily Chart

image2.png


FX Week Ahead: GBP/USD, AUD/USD and USD/JPY

FX Week Ahead: GBP/USD, AUD/USD and USD/JPY

US Dollar Hangs on Despite Weaker Treasury Yields and More Aggressive Rate Cut Forecasts

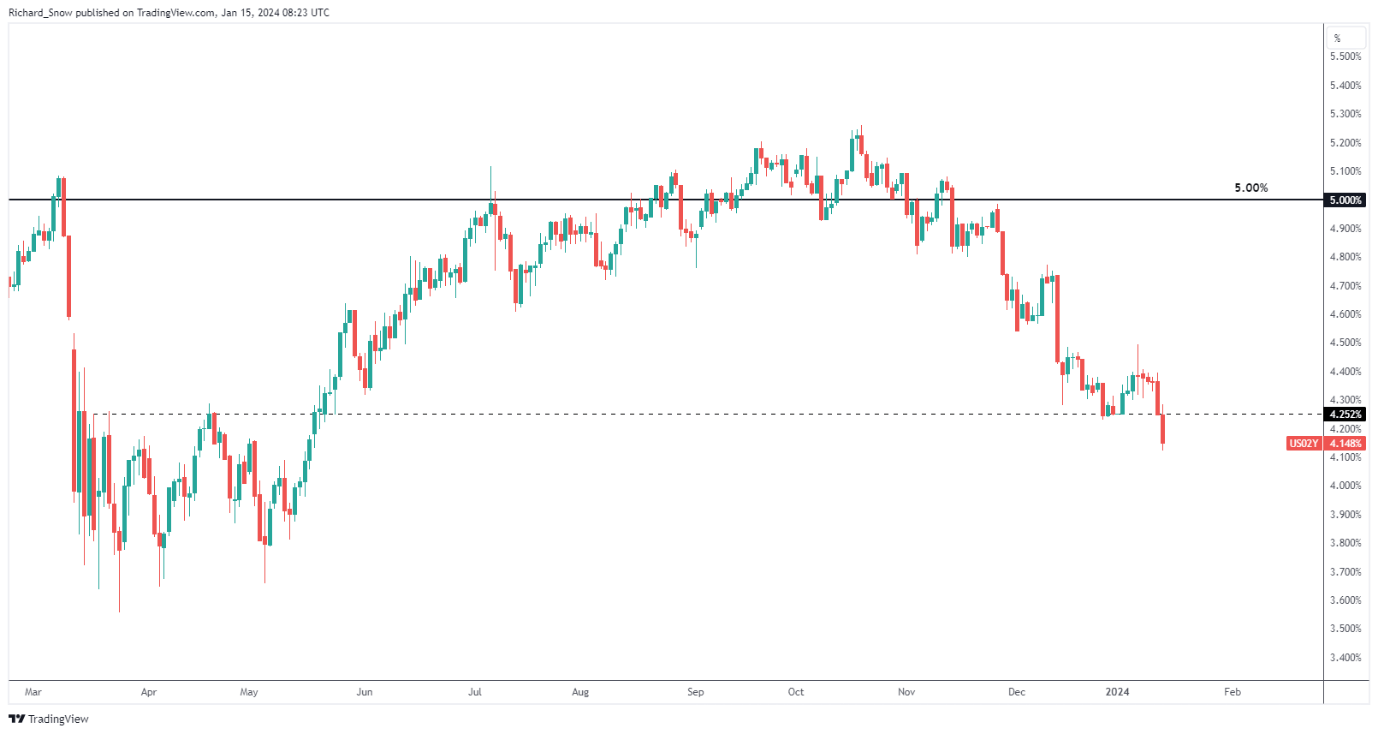
The US dollar holds its current trading range despite lower yields and more imminent rate cuts. The US 2-year yield continues its six-day decline and markets anticipate nearly 25 basis point cuts each meeting from March until November. However, keep in mind the Fed tend not to adjust rates in the lead up to presidential elections meaning we effectively have fewer windows for the Fed to act.

US 2-Year Treasury Yields

image1.png

Source: TradingView, prepared by Richard Snow

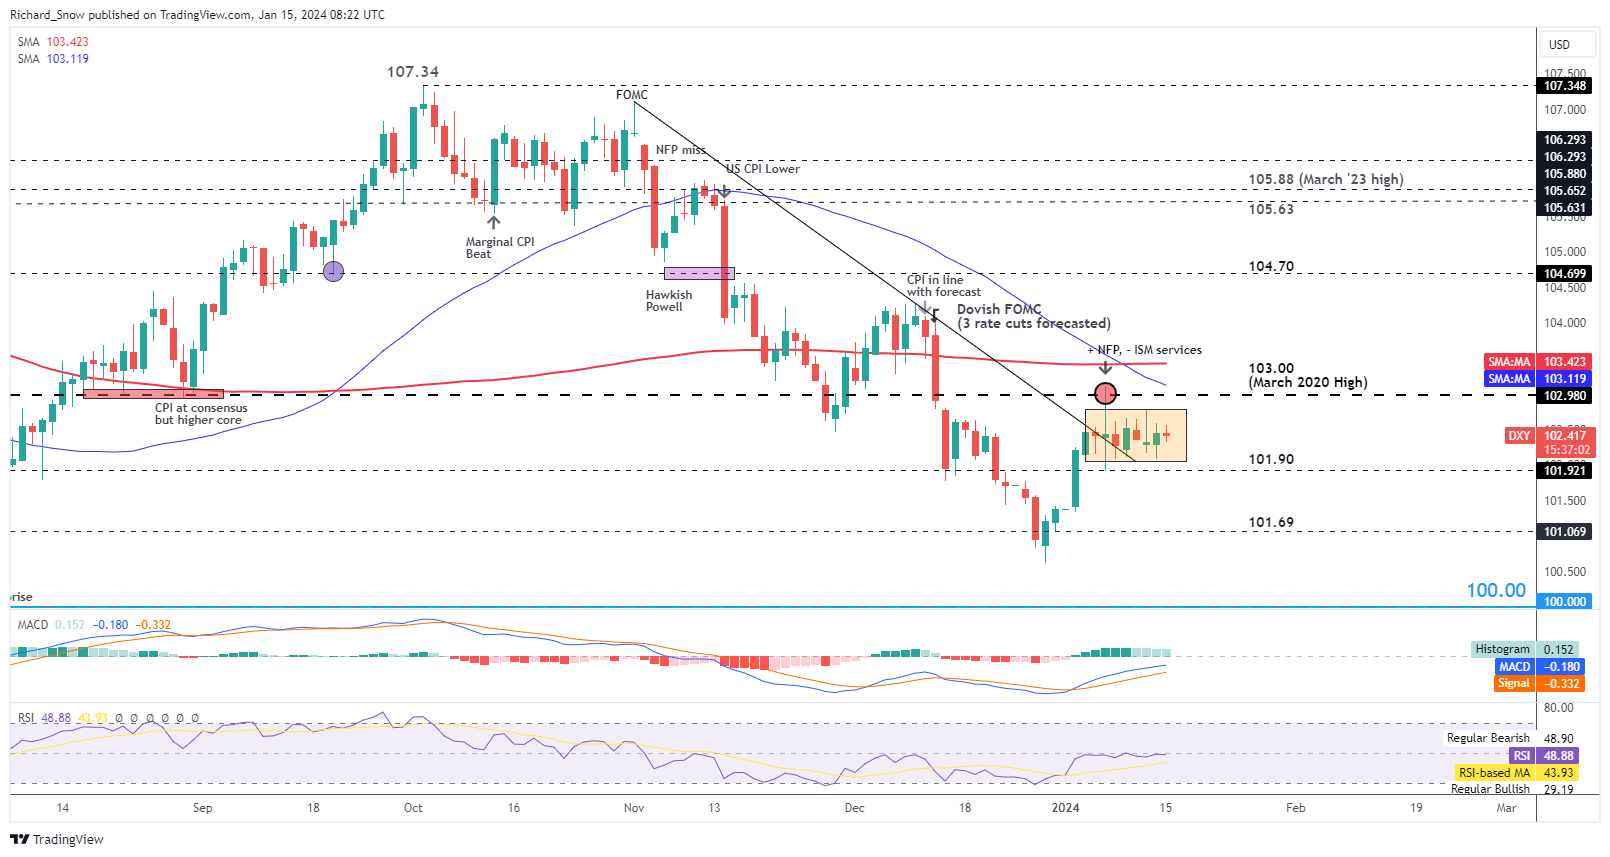
The US Dollar Basket, often viewed as a proxy for USD performance, has traded within a range for the better part of the last fortnight. The major 103.00 level has capped dollar upside with the 200 and 50-day simple moving averages adding to the zone of resistance.

USD faces a number of headwinds including declining yields, more imminent prospect of rate cuts and easing price pressures.

Implied Fed Funds Rate via Fed Funds Futures Market

image2.png

Source: Refinitiv, LSEG, prepared by Richard Snow

Despite last month’s slightly hotter CPI readings, inflation is expected to continue dropping as prior base effects (resulting in upside risks to inflation forecasts) are likely to have come to an end. USD appears to be holding onto the range due to its safe haven appeal after the joint US and UK strikes on Houthi targets at the end of last week. Gold, the most notable safe haven asset rose into the weekend.

US Dollar Basket Daily Chart

image3.png

Source: TradingView, prepared by Richard Snow

GBP/USD Volatility Expected to Pick up in Response to Major Economic Data

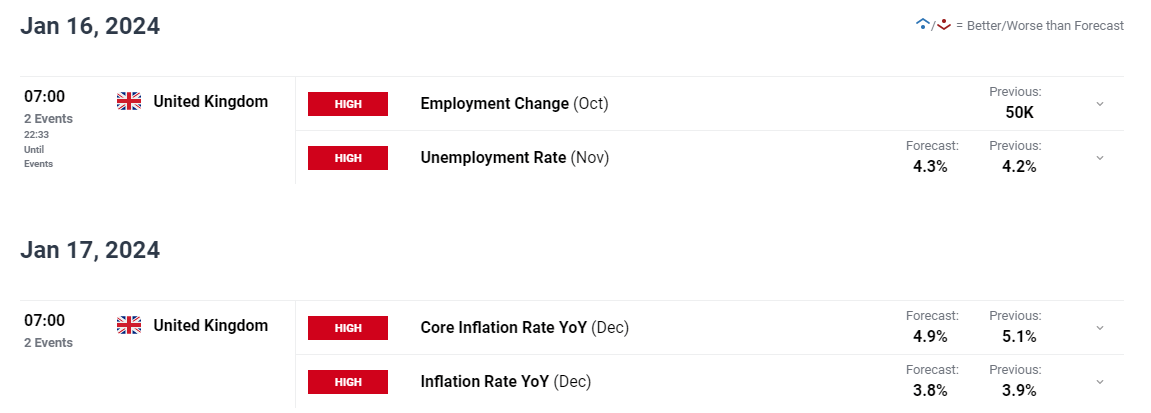
The UK is due to release major jobs, average earnings and inflation data this week. The Bank of England will keep an eye on average earnings, although, this has been less of a focal point for policy setters as services inflation has occupied more attention in recent months.

UK inflation is expected to see further improvement.

image4.png

Customize and filter live economic data via our DailyFX economic calendar

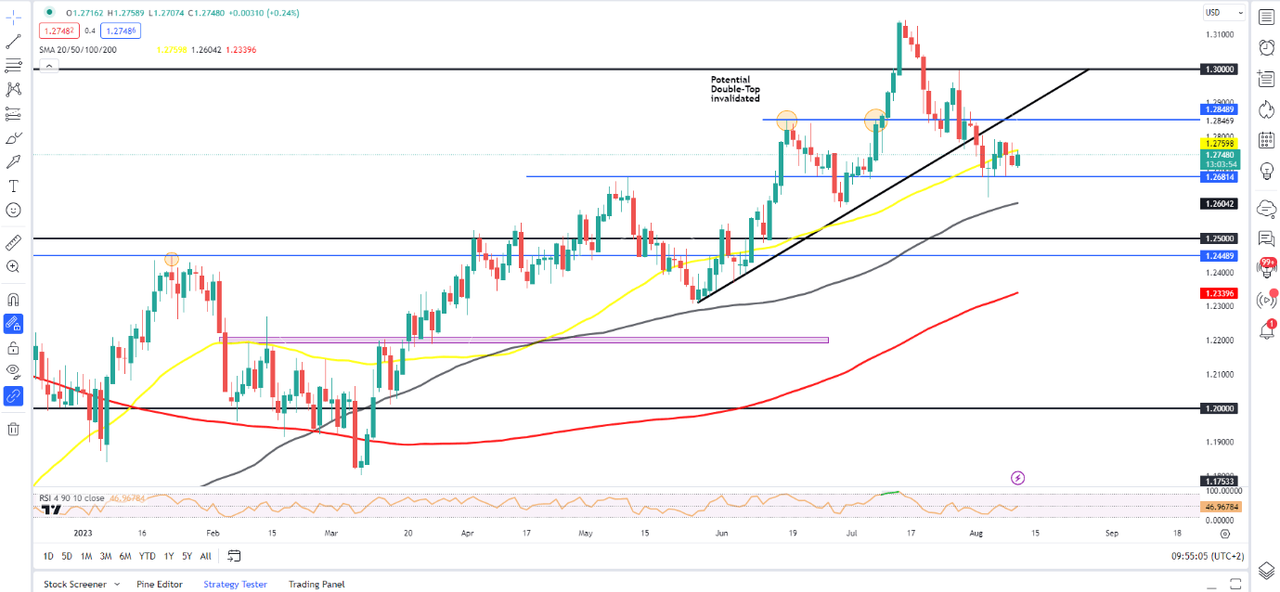
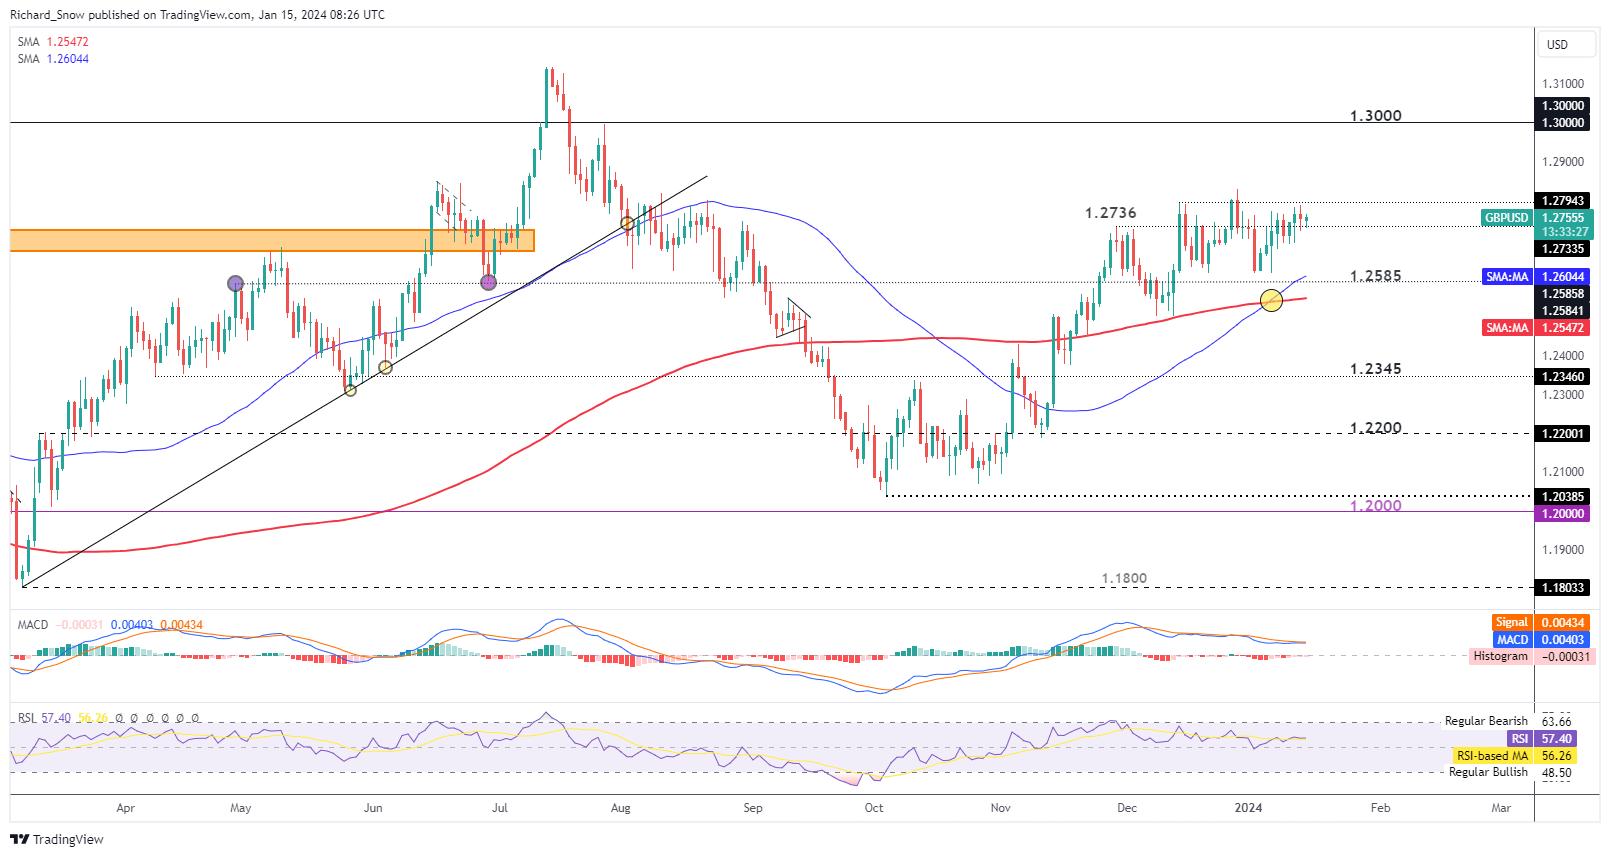
GBP/USD has crept higher but continues to show reluctance to advance above the recent swing high. Daily price ranges have been modest, as has volatility – a situation that may change this week in light of the incoming data.

Price action trades above the 200 SMA after the golden cross was observed but immediate resistance at 1.2794 comes into play at the start of the week, at least until Tuesday when the data comes rolling in. Given the data flow, the recent high of 1.2828 has the potential to witness a test, particularly if the US dollar succumbs to bearish pressure or responds to easing geopolitical tension.

On the downside, 1.2736 appears as immediate support, followed by 1.2585 some distance away.

GBP/USD Daily Chart

image5.png

Source: TradingView, prepared by Richard Snow

AUD/USD Unable to Capitalise on Bullish Potential – Drifts Toward Trendline Support

Despite a sizeable trade surplus update earlier this month for November, the Aussie has struggled to maintain any bullish momentum. AUD/USD now heads towards trendline support and the 50 SMA which provides a solid decision point for the pair before assessing the next move.

If indeed the US dollar dips lower this week, we could see a bounce higher in AUD/USD but any upside potential may be limited by China’s Q4 data which is out on Wednesday. The Chinese economy continues to witness an uneven recovery with improving export data in December but weakening credit growth, not to mention the deflation problem which is ongoing.

image6.png

Source: DailyFX, prepared by Richard Snow

USD/JPY in Focus Ahead of Japanese Inflation Data – BoJ Urgency Subsides

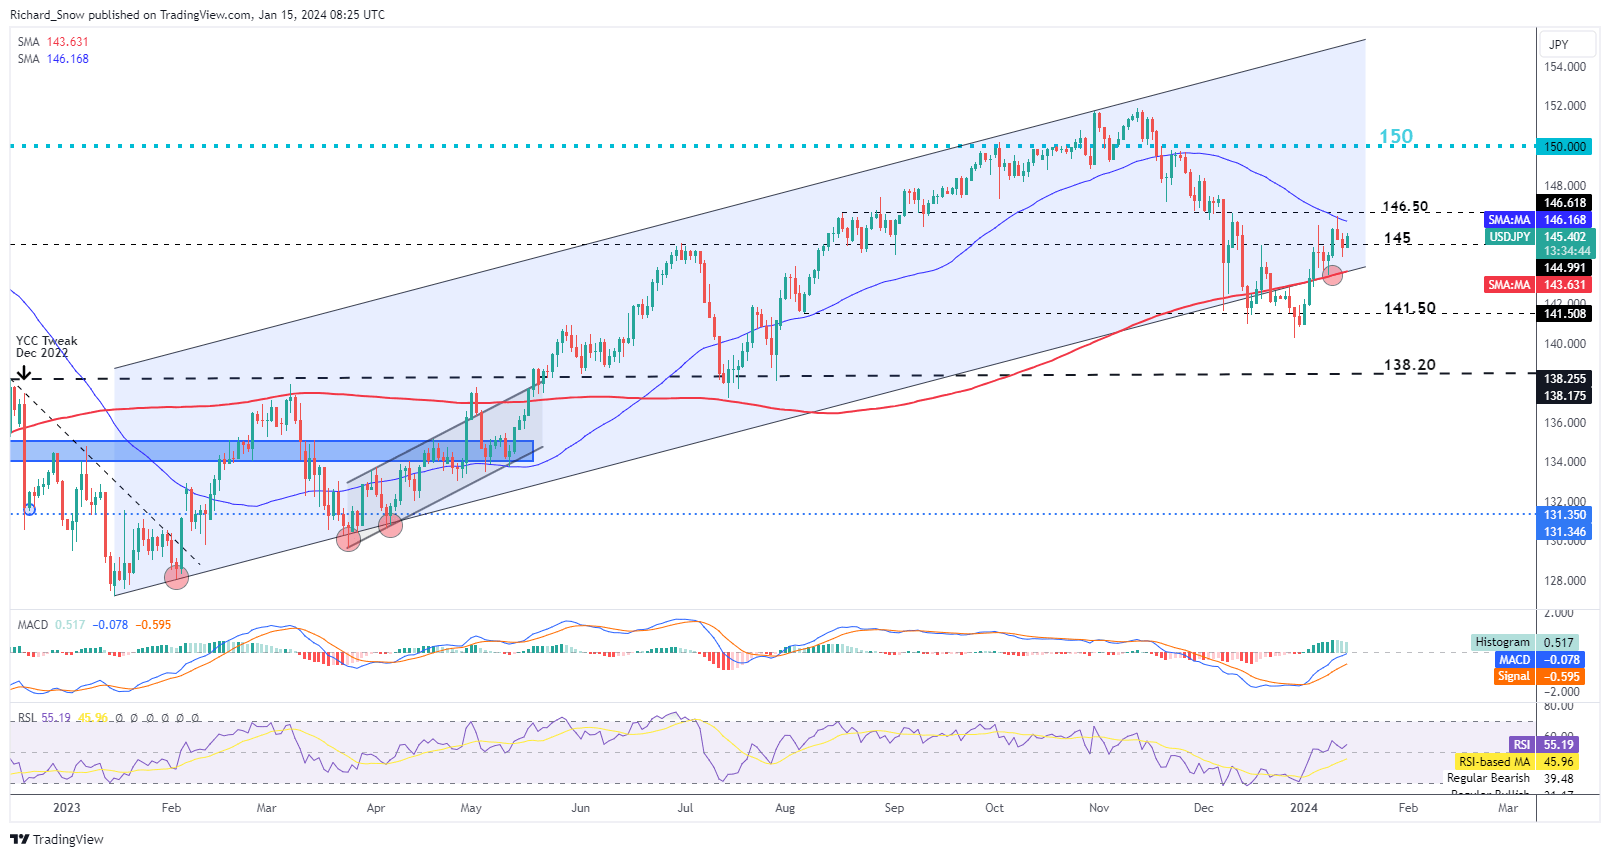
USD/JPY trades higher this morning after previously finding resistance at the 50 SMA (blue line) and the 146.50 level. The yen has lost ground against the dollar after rising inflation and wage growth data lacked persistence.

Recent CPI and wage growth data has tempered calls for the Bank of Japan to step away from negative rates. On Thursday, Japanese inflation data for December will add to the narrative, either building on the case for policy change or working against it if we see a move lower.

Channel support and the 145 level prop up price action, with 150 still the major level to the upside but US dollar upside remains in doubt.

USD/JPY Daily Chart

image7.png

Gold Price Weekly Forecast: Gold Rallies on US Rates, Geopolitical Worries

Gold price benefits from Middle East tensions, looks to US PPI for fresh impetus

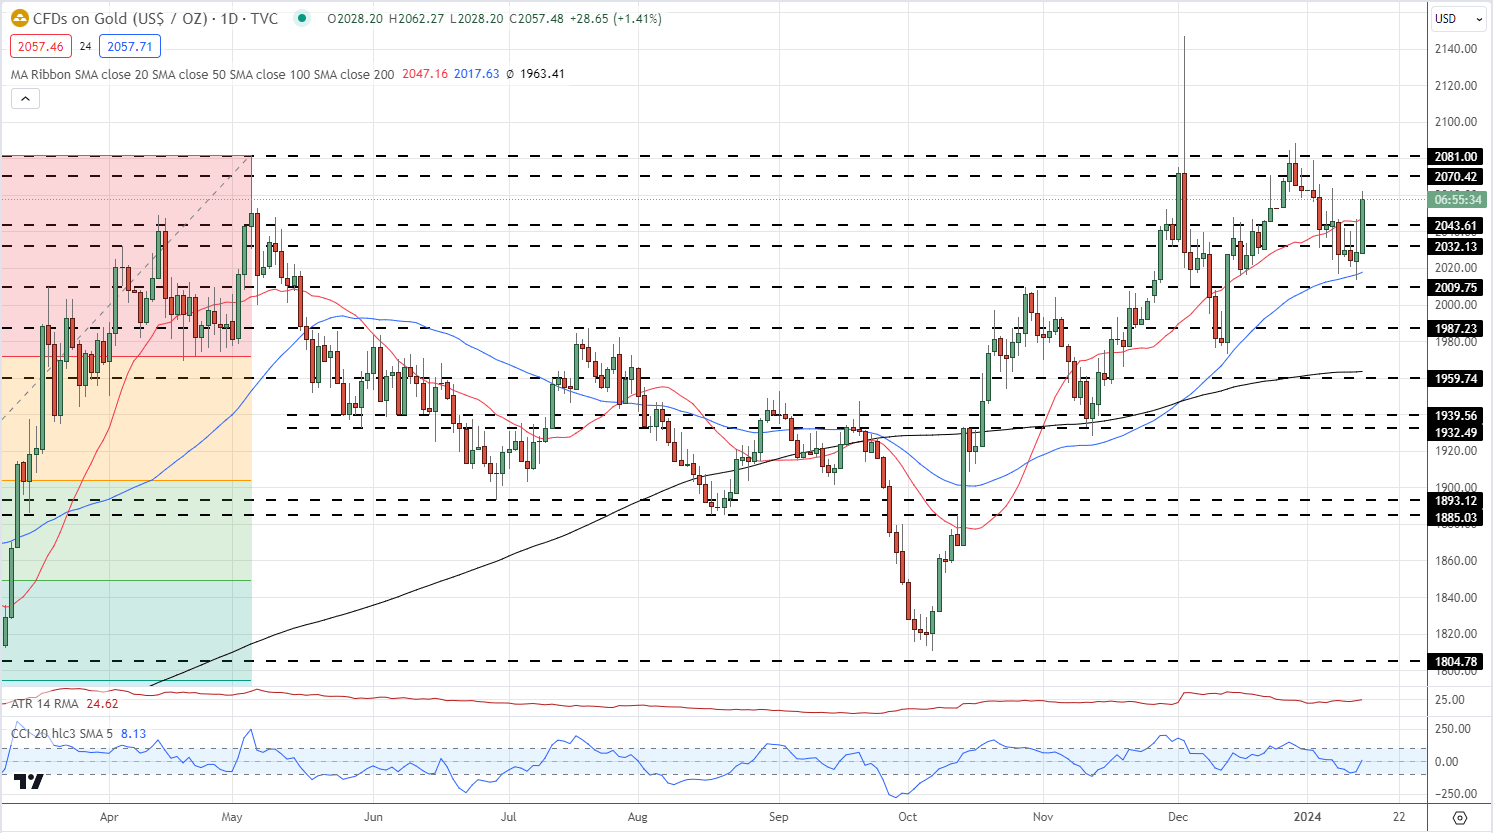
From a technical perspective, the overnight bounce from the 50-day SMA and the subsequent move up as well as positive oscillators on the daily chart favour bullish traders. That said, it will still be prudent to wait for a sustained strength beyond the $2,040-2,042 supply zone before positioning for additional gains. The Gold price might then accelerate the momentum towards last Friday’s swing high, around the $2,064 area, en route to the $2,077 area. Some follow-through buying will negate any near-term negative outlook and set the stage for a move towards reclaiming the $2,100 round figure.

On the flip side, the $2,022 area now seems to protect the immediate downside ahead of the multi-week low, around the $2,013 region, or the 50-day SMA tested on Thursday. A convincing break below the latter will be seen as a fresh trigger for bearish traders and drag the Gold price to the $2,000 psychological mark. The downward trajectory could extend further towards the December swing low, around the $1,973 region before the XAU/USD eventually drops to the $1,965-1,963 confluence, comprising the 100- and 200-day SMAs.

Gold price (XAU/USD) builds on the previous day’s recovery from a one-month low, around the $2,013 region, representing the 50-day Simple Moving Average (SMA), and gains positive traction for the second successive day on Friday. The precious metal extends its stready intraday ascent through the early European session and benefits from reviving safe-haven demand amid the risk of a further escalation of geopolitical tensions in the Middle East. The commodity, however, remains below the $2,040-2,042 hurdle, warranting caution for bulls on the back of the uncertainty over the Federal Reserve’s (Fed) rate cut path.

A slightly hot consumer inflation figures released from the United States (US) on Thursday, along with hawkish remarks by Fed officials, forced investors to trim their bets for a more aggressive policy easing. This acts as a tailwind for the US Treasury bond yields and the US Dollar (USD), which might cap gains for the non-yielding Gold price. Meanwhile, the markets are still pricing in a greater chance of a Fed rate cut in March. This should keep a floor on the non-yielding yellow metal as traders now look to the US Producer Price Index (PPI) and Minneapolis Fed President Neel Kashkari’s speech for short-term impetus.

GBP/USD clings to gains above 1.2750 after UK data

GBP/USD clings to gains above 1.2750 after UK data

GBP/USD trades in a tight channel above 1.2750 on Friday. The data from the UK showed that monthly real GDP expanded by 0.3% in November, while Industrial Production contracted by 0.1% on a yearly basis. Market focus shifts to US PPI data.

GBP/USD stays above the lower limit of the ascending regression channel and the Relative Strength Index (RSI) indicator moves sideways above 50, pointing to a bullish bias in the near term.

1.2780 (static level) aligns as interim resistance before 1.2830 (end-point of the latest uptrend, December 28 high) and 1.2860 (mid-point of the ascending channel).

On the downside, supports are located at 1.2750 (lower limit of the ascending channel), 1.2710-1.2700 (100-period Simple Moving Average (SMA), static level) and 1.2670 (200-period SMA).

GBP/USD reversed its direction after dipping below 1.2700 and closed in positive territory above 1.2750 on Thursday. The positive shift seen in risk mood supports the pair on Friday as markets await Producer Price Index (PPI) data from the US.

The data from the US showed on Thursday that the Consumer Price Index (CPI) increased 3.4% on a yearly basis in December, coming in above the November print and the market expectation of 3.1% and 3.2%, respectively. The Core CPI, which excludes volatile food and energy prices, rose 0.3% on a monthly basis.

Inflation figures provided a boost to the US Dollar (USD) with the initial reaction but they seemingly failed to persuade markets that the Federal Reserve (Fed) could refrain from lowering the policy rate in March. The CME FedWatch Tool still shows that markets are pricing in a nearly 70% chance that there will be a 25 basis points rate cut in March and the benchmark 10-year US Treasury bond yield stays below 4%.

The UK’s Office for National Statistics (ONS) reported early Friday that the Gross Domestic Product (GDP) grew by 0.3% on a monthly basis in November. This reading followed the 0.3% contraction recorded in October and helped Pound Sterling stay resilient against the USD. In the meantime, the UK’s FTSE 100 Index is up 0.8%, reflecting an upbeat market mood in the European session.

Annual producer inflation in the US, as measured by the change in the PPI, is expected to climb to 1.3% in December from 0.9% in November. The USD’s reaction to inflation data on Thursday suggests that it will take a significant increase in the PPI to convince investors that the Fed will delay the policy pivot toward the end of the second quarter.

EUR/USD consolidates gains below 1.1000 amid subdued US Dollar

EUR/USD consolidates gains below 1.1000 amid subdued US Dollar

EUR/USD is consolidating the latest uptick but stays below 1.1000 early Friday. The pair benefits from a renewed US Dollar weakness, induced by the dovish Fed expectations. Escalating geopolitical tensions cap the pair’s upside. US data next in focus.

EUR/USD continues to fluctuate between the 100- and the 200-period Simple Moving Averages (SMA) on the 4-hour chart, while the Relative Strength Index (RSI) stays near 50 following Thursday’s short-lasting advance, reflecting the pair’s indecisiveness.

1.0990-1.1000 (100-period SMA, psychological level) stays intact as key resistance. If EUR/USD manages to flip that area into support, it could target 1.1050 (mid-point of the ascending regression trend channel) and 1.1100 (psychological level, static level) next.

On the downside, 1.0930 (200-period SMA) aligns as important support before 1.0900 (psychological level, lower limit of the ascending regression trend channel) and 1.0850 (Fibonacci 38.2% retracement of the latest uptrend).

After spiking to 1.1000 on Thursday, EUR/USD made a sharp U-turn and dropped below 1.0950. With the US Dollar (USD) struggling to find demand in the late American session, the pair regained its traction and closed the day flat. The pair holds steady above 1.0950 early Friday as markets await producer inflation data from the US.

Mixed inflation figures from the US ramped up market volatility on Thursday. The Consumer Price Index (CPI) rose 3.4% on a yearly basis in December, the US Bureau of Labor Statistics (BLS) reported. This reading followed the 3.1% increase recorded in November and came in above the market expectation of 3.2%. The Core CPI, which excludes volatile food and energy prices, rose 0.3% on a monthly basis to match analysts’ estimate.

These prints failed to influence the market positioning on Federal Reserve (Fed) policy outlook in a noticeable way. The CME FedWatch Tool shows that the probability of a 25 basis points rate reduction in March stays about 70%.

Commenting on the rate outlook, Cleveland Fed President Loretta Mester told Bloomberg that Fed is “not there yet on rate cuts” and added that she would want to see more evidence that the economy is progressing as expected. Inflation has to be coming down on a “sustainable basis” before rate cut conversation can happen, Mester argued.

On a yearly basis, the Producer Price Index (PPI) is forecast to rise by 1.3% in December, up from 0.9% in November. A smaller-than-forecast increase could make it difficult for the USD to hold its ground ahead of the weekend. A print at or above 1.5% could revive concerns over stronger producer inflation making it difficult for the Fed to control consumer inflation and weigh on EUR/USD.

UK Economy Expanded in November but Contracted by 0.2% over Three Months

UK Economy Expanded in November but Contracted by 0.2% over Three Months

UK GDP

On Friday, the UK economy was in the spotlight. November GDP, industrial, and manufacturing production garnered investor interest.

The UK economy expanded by 0.3% in November after contracting by 0.3% in October. However, the 3-month GDP average showed a 0.2% contraction after stalling in the three months to October. Economists forecast the UK economy to expand by 0.2% in November and to contract by 0.1% in the three months to November.

According to the Office for National Statistics,

  • Service sector output increased by 0.4% after falling 0.1% in October. The service sector was the main contributor to growth in November.
  • Significantly, output from customer-facing services rose by 0.6%.
  • However, there was no service sector growth in the three months to November.
  • Production output increased by 0.3%, driven by manufacturing output. Industrial production declined by 0.8% in October.
  • Manufacturing production rose by 0.4% after falling by 1.1% in October.
  • However, output across the construction sector declined by 0.2%. Adverse weather reportedly affected planned work.

Bank of England Monetary Policy Implications

The larger-than-expected 3-monthly average contraction could allow the Bank of England to begin discussions on rate cuts. However, improving UK service sector conditions could be a consideration. Nonetheless, a lack of service sector growth over three months leaves uncertainty about the UK economic outlook.

GBP/USD Reaction to the UK GDP Estimate

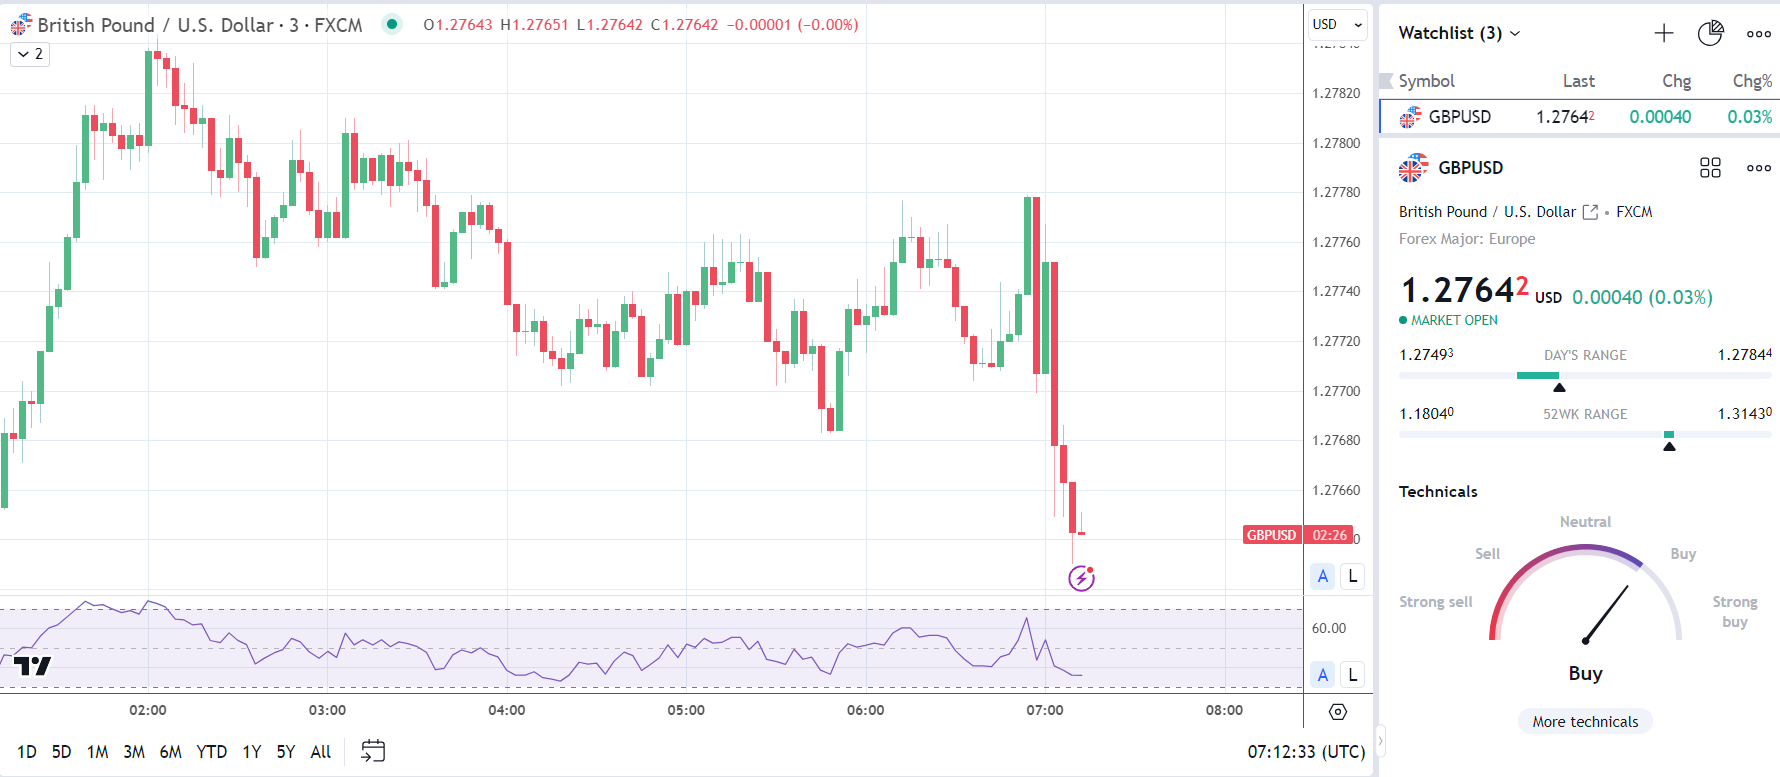
Before the UK numbers, the GBP/USD fell to a low of $1.27493 before rising to a high of $1.27844.

However, in response to the UK GDP numbers, the GBP/USD rose to a high of $1.27767 before falling to a low of $1.27630.

On Friday, the GBP/USD was up 0.03% to $1.27642.

GBP to USD reacts to mixed UK GDP numbers.
120124 GBPUSD 3 Minute Chart

Up Next: US Producer Prices and Fed Commentary

On Friday, US producer prices for December will garner investor interest. After the hotter-than-expected US CPI Report, a marked pickup in producer prices could test bets on a March Fed rate cut. Producer prices are a leading indicator of consumer price inflation.

Economists forecast producer and core producer prices to increase by 0.1% and 0.2%, respectively. Producer and core producer prices stalled in November.

With inflation in the spotlight, FOMC member commentary also needs consideration. FOMC member Neel Kashkari is on the calendar to speak on Friday. Reaction to the inflation figures will warrant investor attention.