The European Central Bank: A Forex Trader’s Guide

The European Central Bank: A Forex Trader’s Guide

The European Central Bank (ECB) is situated in Frankfurt, Germany. It was established in 1998 by the Treaty of Amsterdam. The European Central Bank is different to other central banks in that it controls monetary policy for the entire eurozone. Countries that belong to the eurozone include Austria, Belgium, Cyprus, Estonia, Finland, France, Germany, Greece, Ireland, Italy, Latvia, Lithuania, Luxembourg, Malta, The Netherlands, Portugal, Slovakia, Slovenia and Spain.

European Central Bank

What is the ECB

The European Central Bank acts as the central bank for the 19 countries that belong to the eurozone. The European Central Bank is overseen by a governing council that consists of six executive board members, with one serving as the president. The executive board members are appointed by the European Council.

The European Central Bank’s primary objective is to maintain price stability. They use monetary policy to support the economy and job creation.

Key Economic Mandates of the ECB

The European Central Bank’s primary mandate or objective is price stability. Price stability is the control of inflation, Harmonised Index of Consumer Prices (HICP) and the exchange rate of the EUR.

1) Price Stability – which is price stability or inflation

2) Financial stability – Through the control of price stability and sometimes other mechanisms.

Price Stability

To maintain price stability, the European Central Bank influences the short-term interest rate for the eurozone. The European Central Bank has a target interest rate (like most central banks) of below, or close to, 2%. Although they target inflation mostly, GDP and unemployment data have a big effect on the decisions the policy makers make.

If inflation goes above 2%, the European Central Bank may signal a hiking of the interest rate to the public to tighten the eurozone’s economic expansion and bring down inflation. If unemployment numbers are increasing and the economy is slowing down, the bank may have to make the decision to decrease interest rates, to stimulate the economy and job growth. A period of rising inflation and increasing unemployment will require the policy makers to weigh the pros and cons of tightening the economy to reign-in inflation or stimulate the economy to produce jobs.

Financial Stability

The European Central Bank also plays a large role in keeping the eurozone’s financial system stable. In times of a crisis they can do this by adding liquidity to the system, either by buying bonds on the open market or decreasing the interest rate to extremely low levels to help distressed debt holders pay back their obligations.

If the European Central Bank does not add liquidity in times of a crisis, the entire financial system could collapse.

How ECB interest rates affect the Euro

Interest rate impact on the Euro

The European Central Bank can affect the value of the Euro through changes in interest rate expectations. Traders should understand that currencies tend to appreciate when interest rate expectations increase, not just from increases in the nominal interest rate.

For example, if the European Central Bank keeps interest rates unchanged but issues forward guidance (tells the market) that they expect more interest rate hikes in future, the value of the Euro tends to appreciate.

A quantitative easing program (QE) has a similar effect to interest rates on the Euro. Quantitative easing is the buying of securities on the open market by a Central Bank in order to stimulate the economy and add liquidity to the financial system. Historically it has only been done in times of a financial crisis. Increased quantitative easing reduces the value of the Euro because it increases the amount of money in supply.

Interest rate impact on the economy

The European Central Bank lowers interest rates when it is trying to stimulate the economy (GDP) and increases interest rates when it is trying to contain inflation caused by an economy operating above potential (overheating).

Lower interest rates stimulate an economy in a few ways:

  1. Businesses can borrow money and invest in projects that will receive more than the risk borrowing rate.
  2. When interest rates are lower the stock market is discounted at a lower rate, leading to an appreciation in stock market values which causes a wealth effect.
  3. People invest their money into the economy (stocks and other assets) because they can earn more in these assets than at currently low interest rates.

How to trade ECB interest rate decisions

The table below displays the possible scenarios that come from a change in interest rate expectations. Traders can use this information to forecast if the currency is likely to appreciate or depreciate and how to trade it.

Market expectations Actual Results Resulting FX Impact
Rate Hike Rate Hold Depreciation of currency
Rate Cut Rate Hold Appreciation of currency
Rate Hold Rate Hike Appreciation of currency
Rate Hold Rate Cut Depreciation of currency

Let’s look at an example, EUR/USD, where the European Central Bank ended its long-time program of quantitative easing. Ending the quantitative easing program means that the central bank would no longer be adding more money to the system. On December 13, 2018 the European Central Bank announced an end to its quantitative easing program, which led to an appreciation in the Euro because it signalled that less money than expected would be in the economy.

European central bank ends quantitative easing program

Top Takeaways of the ECB and Forex Trading

  • The European Central Bank is fundamental to the value of the Euro.
  • The Euro tends to appreciate or depreciate depending on changes in interest rate expectations, not just on actual changes.
  • Quantitative easing has a similar effect to changes in interest rates. Changes in expectations of quantitative easing will have an effect on the Euro.
  • Rising inflation does not mean the European Central Bank will increase interest rates, it depends on the balance between economic growth and inflation. The ECB will raise rates if inflation is close to, at, or above target – the ECB’s primary mandate is to maintain price stability (inflation).
EUR/USD and GBP/USD Price Forecast: PMI Figures Weigh In, Dollar Index Declines 0.40%

EUR/USD and GBP/USD Price Forecast: PMI Figures Weigh In, Dollar Index Declines 0.40%

A review of the day’s economic events reveals mixed signals from the Eurozone. French Flash Manufacturing PMI stood at 43.2, slightly above expectations but still in contraction territory. The Services PMI at 45.0 also surpassed forecasts but remained below the critical 50 mark, indicating contraction.

In Germany, the Manufacturing PMI registered at 45.4, underscoring the ongoing challenges in the manufacturing sector, while the Services PMI at 47.6 pointed to near-stagnation.

The UK’s Public Sector Net Borrowing was reported at 6.8 billion GBP, significantly lower than the anticipated 11.4 billion GBP. This data reflects a more controlled fiscal environment than expected, which could have implications for the GBP.

In today’s forex market, the US Dollar Index exhibits a bearish trend, trading around 102.825 with nearly 0.40% decline. This movement notably influences major currency pairs, including EUR/USD and GBP/USD.

Events Ahead

Looking ahead, the US market anticipates the Flash Manufacturing PMI, projected at 47.6, and the Services PMI, estimated to remain stable at 51.4. These indicators are crucial for assessing the health of the US economy.

In the Eurozone, the focus will be on the overall Flash Manufacturing and Services PMIs, with predictions of continued contraction in manufacturing and a slight decline in services activity.

The UK will also release its Flash Manufacturing and Services PMI data, with forecasts suggesting a contraction in manufacturing but growth in services. These economic indicators provide a mixed picture, reflecting the complexities in the current global economic landscape.

US Dollar Index (DXY)

Dollar Index
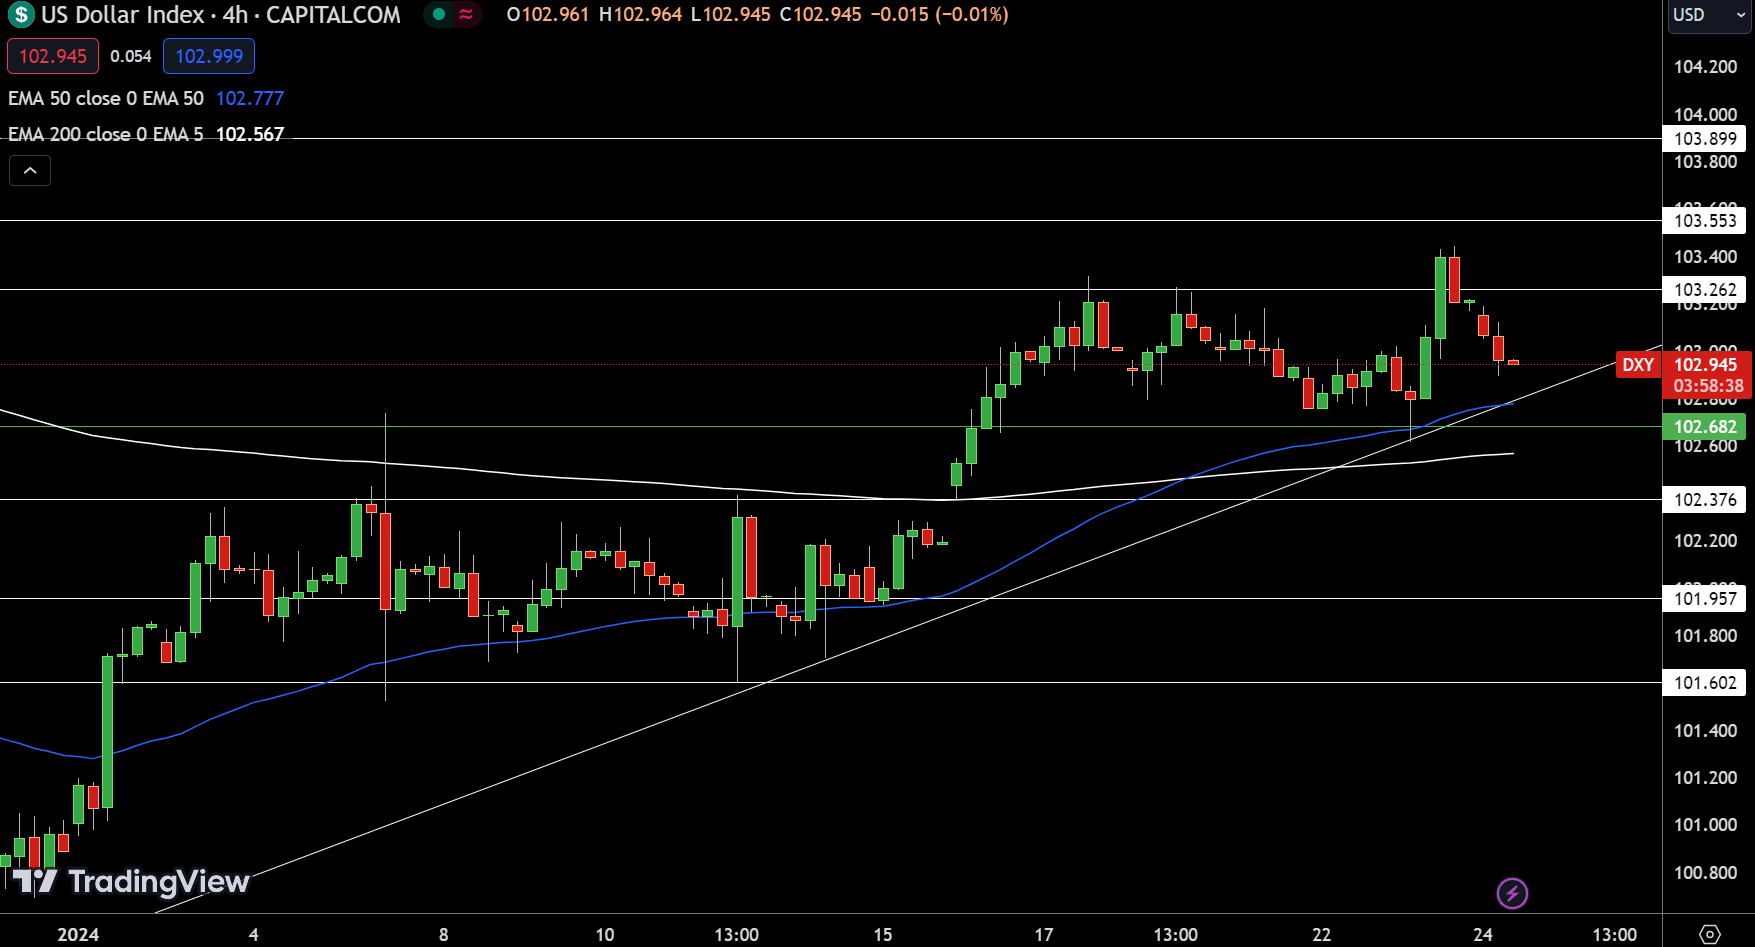
Dollar IndexThe US Dollar Index hovers around a pivotal point at $102.682. If the index ascends, it will encounter resistance at $103.262, followed by higher barriers at $103.553 and $103.899. On the flip side, support levels are set at $102.376, with subsequent floors at $101.957 and $101.602.

The 50 and 200-day Exponential Moving Averages, at $102.777 and $102.567 respectively, flank the pivot point, suggesting a mixed technical outlook. A bullish trend above the pivot is plausible, but a bearish sentiment persists below this mark.

EUR/USD Technical Forecast

EUR/USD Price Chart - Source: Tradingview
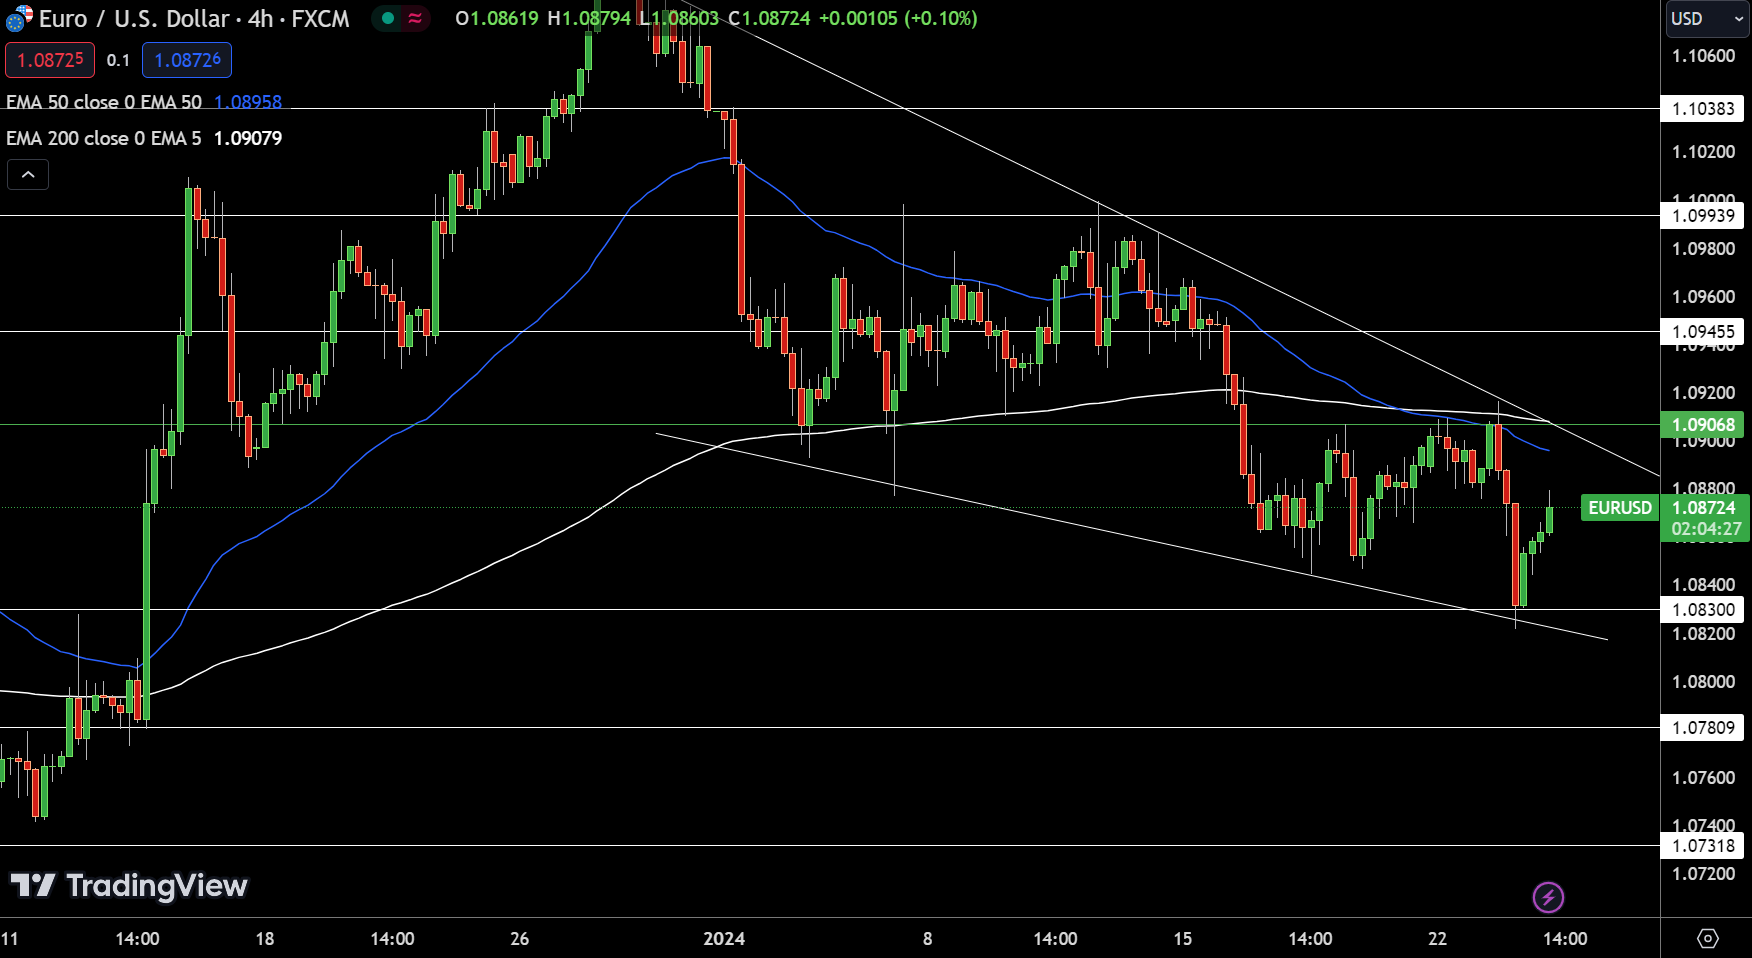
EUR/USD Price Chart – Source: TradingviewThe EUR/USD currency pair shows a modest uptick, currently trading at 1.08787, up by 0.27%. It navigates near a pivotal point at $1.09068, with immediate resistance awaiting at $1.09455. Should bullish momentum continue, the next challenges stand at $1.09939 and $1.10383.

On the downside, support levels at $1.08300, $1.07809, and $1.07318 offer potential cushions against pullbacks. The 50 and 200-day EMAs at $1.08960 and $1.09080 respectively, hover around the pivot point, indicating a crucial juncture for future price action.

The observed downward trendline converging at the pivot suggests resistance, hinting at a bearish stance below this threshold. Short-term expectations point to the possibility of the pair testing these resistance levels if a reversal above the pivot occurs.

GBP/USD Technical Forecast

GBP/USD Price Chart
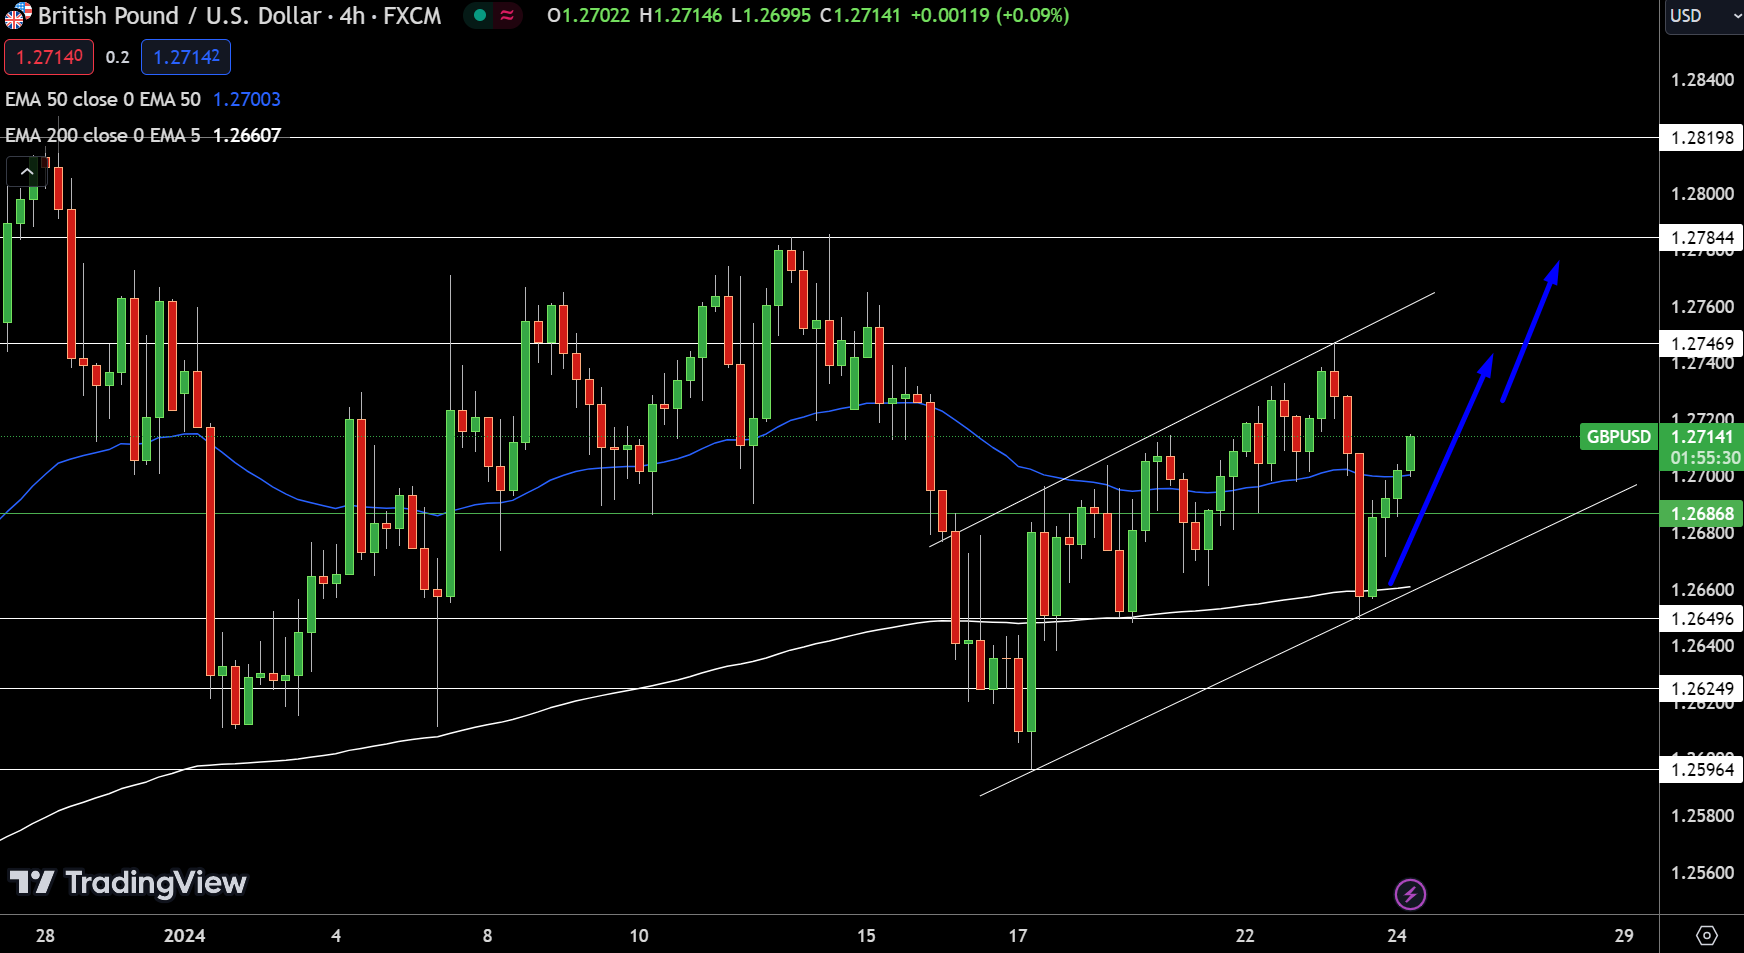
GBP/USD Price Chart – Source: TradingviewThe GBP/USD pair, currently positioned at $1.27141, reflects a subtle yet steadfast climb above the pivot of $1.26868. Resistance points loom overhead at $1.27469, $1.27844, and $1.28198, challenging the pair’s northward journey. Conversely, support forms a safety net at $1.26450, with further cushions at $1.26249 and $1.25964.

The proximity of the 50-day and 200-day EMAs at $1.27003 and $1.26607, respectively, suggests a convergence point that may dictate near-term price action. A ‘Three White Soldiers’ candlestick pattern has emerged, hinting at bullish momentum above the pivot level.


German Manufacturing PMI Rises, While Services Sector Deteriorates

German Manufacturing PMI Rises, While Services Sector Deteriorates

German Private Sector Analysis: Early 2024

As 2024 unfolds, Germany’s private sector continues grappling with economic contraction. The latest HCOB Flash Germany PMI survey by S&P Global reveals persistent challenges across both the services and manufacturing sectors. This analysis delves into key aspects such as activity levels, demand conditions, employment trends, and inflationary pressures.

Service Sector Contraction

The services sector, a crucial component of the economy, experienced a notable downturn at the start of the year. The HCOB Flash Germany Services PMI Business Activity Index fell to a five-month low of 47.6. This decline reflects customer hesitancy amidst high financing costs and geopolitical uncertainty, leading to a reduction in new business inflows.

Manufacturing Sector’s Mixed Signals

Manufacturing, a vital pillar of the German economy, shows signs of a nuanced recovery. The HCOB Flash Germany Manufacturing PMI Output Index rose to 46.0, an eight-month high, indicating a slowdown in the rate of contraction. However, the overall Manufacturing PMI reached 45.4, marking an 11-month high, suggesting a gradual improvement in the sector’s health. Despite this, the sector remains in a recessionary phase, impacted by global supply chain disruptions, notably the events in the Red Sea.

Employment trends varied across sectors. The service sector maintained relatively stable employment levels, while manufacturing witnessed more significant job losses. On the inflation front, service sector firms faced heightened cost pressures, particularly from wage demands, leading to an increase in service prices. Conversely, manufacturing prices continued to decline, albeit at a slower pace.

Comment from Chief Economist

Dr. Cyrus de la Rubia, Chief Economist at Hamburg Commercial Bank, notes the sluggish start for Germany’s economy in 2024, with significant impacts from supply chain disruptions and persistent inflation in the service sector. The ongoing recession is expected to continue into the current quarter, influenced by global events and internal economic dynamics.

Short-Term Market Outlook

In the short term, the German private sector’s outlook is cautiously mixed. The services sector shows a degree of optimism, likely buoyed by its ability to transfer increased costs to consumers. However, the manufacturing sector, despite showing signs of recovery, continues to be hampered by external challenges such as supply chain disruptions and inflationary pressures.

This results in a tempered optimism within the sector. Overall, the economic landscape in early 2024 presents a scenario of gradual, sector-specific recovery amidst a backdrop of persistent challenges, with the resilience in services sector employment and cautious optimism contrasted against the cautious recovery and ongoing difficulties faced by the manufacturing sector.

XRP News: SEC v Ripple and Falling Bets on an XRP-Spot ETF Impact XRP

XRP News: SEC v Ripple and Falling Bets on an XRP-Spot ETF Impact XRP

XRP-Spot ETF Chatter Impact Buyer Demand

On Tuesday, XRP joined the broader crypto market in negative territory. However, uncertainty about the SEC approving an XRP-spot ETF continued to impact buyer demand for XRP.

Significantly, the BlackRock (BLK) plan to launch an XRP-spot ETF could face significant regulatory scrutiny. The SEC v Ripple case is unlikely to conclude until the summer. The SEC and Ripple are progressing through remedies-related discovery. Remedies-related discovery ends on February 12, 2024.

After remedies-related discovery, the SEC and Ripple must file remedy-related briefs. The parties will argue for and against a punitive penalty for XRP sales to US institutional investors. In July, Judge Analisa Torres gave Ripple a partial win, ruling that XRP is not a security in Programmatic Sales.

However, Judge Torres also ruled Ripple breached Section 5 of the 1933 Securities Act for failing to register XRP as a security for institutional sales.

For BlackRock, Fidelity, and other issuers, including Grayscale, SEC plans to appeal the Programmatic Sales ruling is another hurdle.

Given the SEC’s appeal plans, it’s unlikely that SEC Chair Gary Gensler will approve an XRP-spot ETF. Spot ETF issuers may wait until the SEC formally acknowledges that XRP is not a security before filing applications. An acknowledgment could hinge on the courts.

Considering the Court Briefing Schedule for the final stages of the SEC v Ripple case, an SEC appeal could extend into 2025. Significantly, XRP could lose out to any crypto tokens that the SEC deems securities.

The SEC v Terraform Labs ruling fueled uncertainty about an XRP-spot ETF market. In December, Judge Jed Rakoff ruled Luna and TerraUSD are securities. The court ruling will likely incentivize the SEC to appeal against the Programmatic Sales ruling.

XRP Price Action

Weekly Chart sends bearish price signals.
XRPUSD 240124 Weekly Chart

Daily Chart

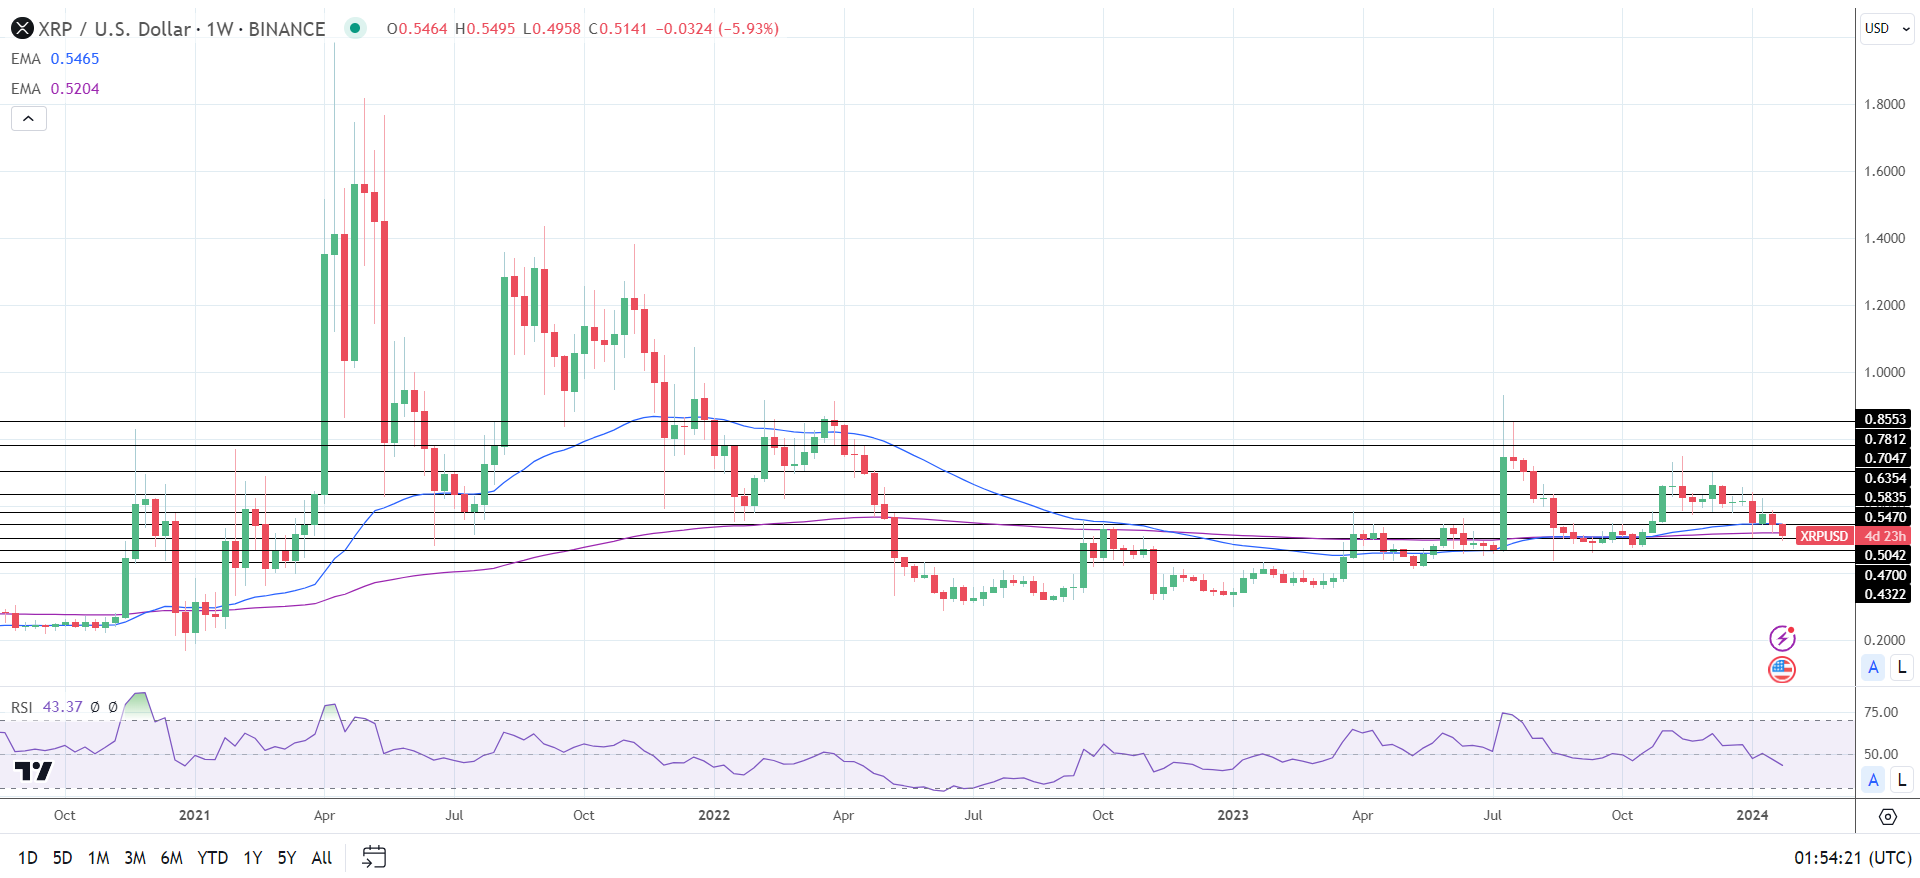
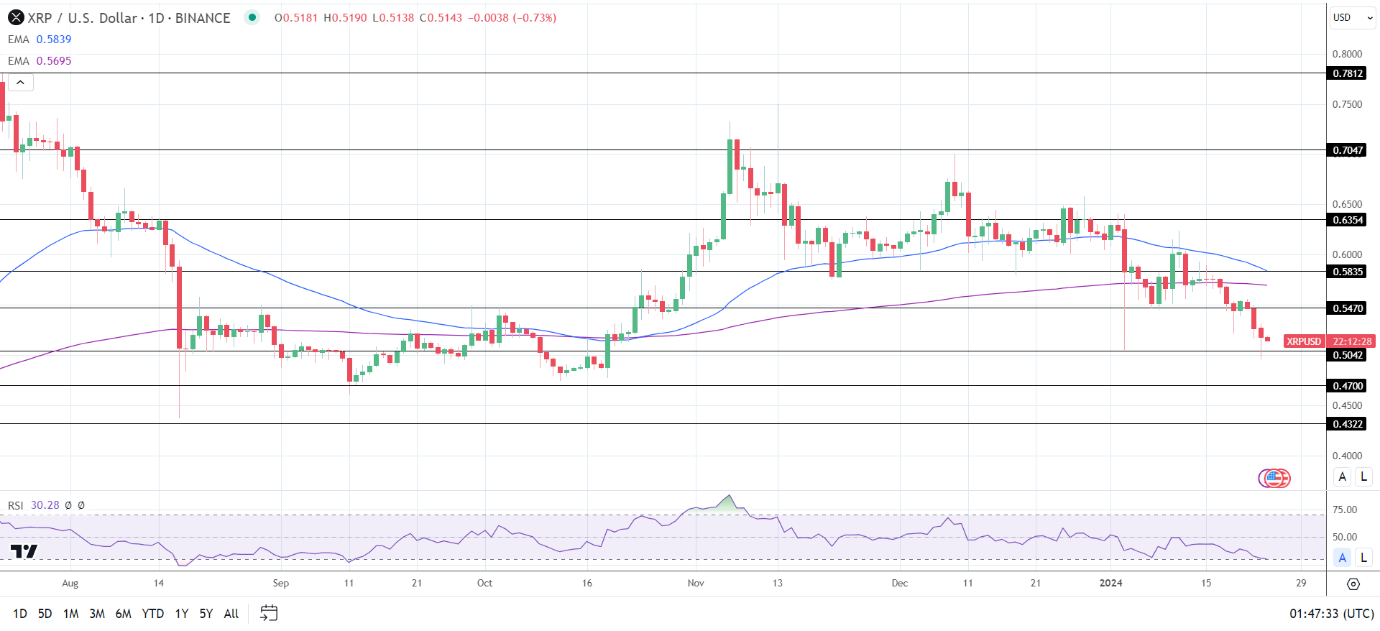
XRP sat below the 50-day and 200-day EMAs, sending bearish price signals. Significantly, the 50-day EMA continued narrowing on the 200-day EMA, another bearish sign.

A return to the $0.52 handle would support a move to the $0.5470 resistance level. A break above the $0.5470 resistance level would bring the 200-day EMA into view.

SEC v Crypto case-related news and US lawmaker scrutiny need consideration.

However, a break below the $0.5042 support level would support a fall toward the $0.4700 support level.

The 14-day RSI reading, 30.28, shows XRP on the border with oversold territory. Buying pressure could intensify at the $0.5042 support level.

XRP Daily Chart affirms bearish price signals.
XRPUSD 240124 Daily Chart

4-Hourly Chart

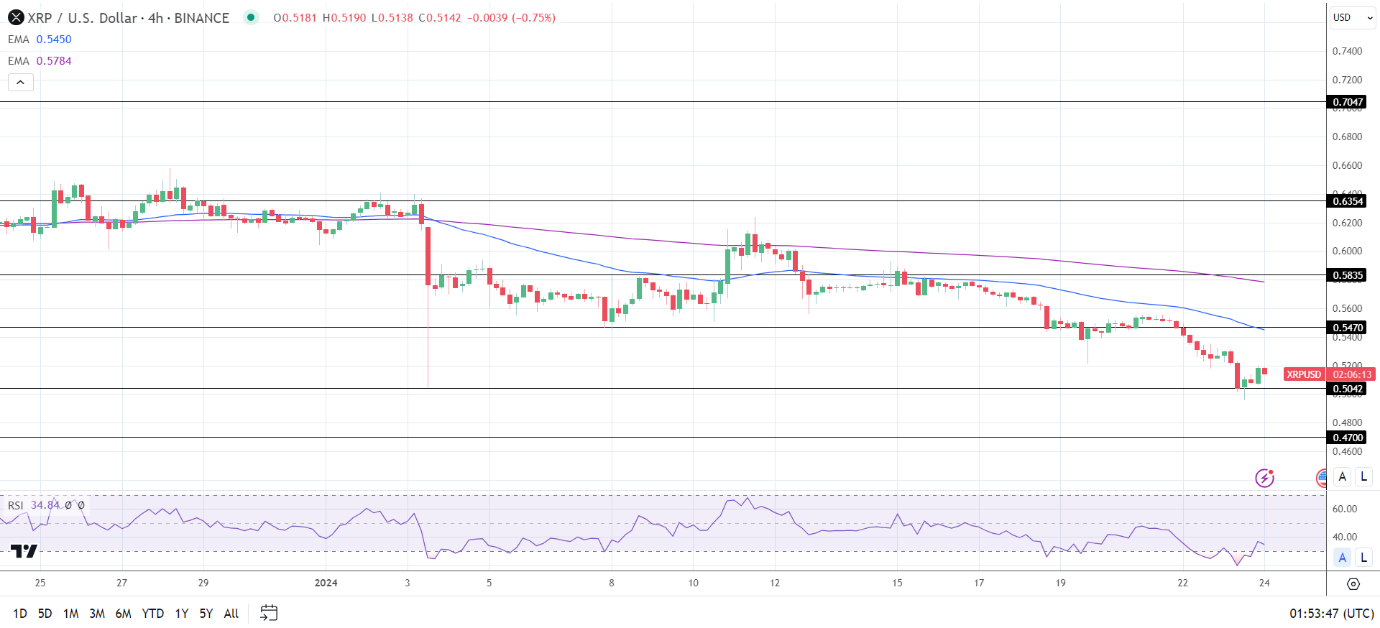
On the 4-hourly, XRP remained below the 50-day and 200-day EMAs, confirming the bearish price trends.

A break above the Tuesday high of $0.5315 would support a move toward the $0.5470 resistance level.

However, a fall through the $0.5042 support level would give the bears a run at the $0.4700 support level.

The 4-hourly RSI, with a reading of 34.84, suggests a fall through the $0.5042 support level before entering oversold territory.

XRP 4-Hourly Chart reaffirms bearish price signals.
XRPUSD 240124 4-Hourly Chart
US Dollar Analysis – Technical Analysis on EUR/USD, USD/JPY, USD/CAD

US Dollar Analysis – Technical Analysis on EUR/USD, USD/JPY, USD/CAD

EUR/USD TECHNICAL ANALYSIS

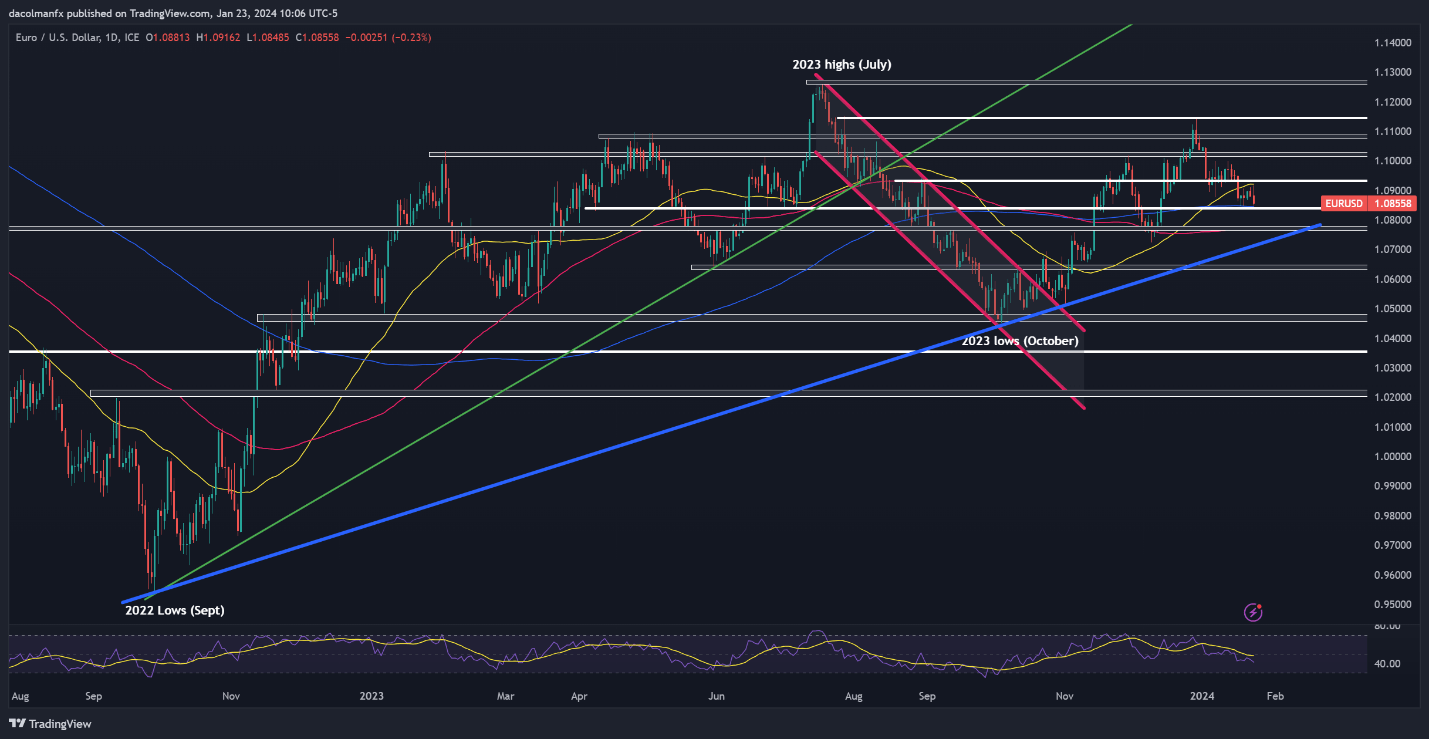
EUR/USD has been moving lower this week, but has so far managed to hold above its 200-day simple moving average near 1.0840. For sentiment around the euro to improve, the bulls have to protect this floor at all costs; failure to do so could result in a pullback towards 1.0770. On further weakness, all eyes will be on trendline support at 1.0710.

In the event of a bullish reversal ahead of the ECB decision, technical resistance extends from 1.0920 to 1.0935. If history is any guide, buyers will face difficulties in clearing this barrier; however, a successful breakout has the potential to usher in rally towards 1.1020. On continued upward momentum, attention will turn to 1.1080.

EUR/USD TECHNICAL CHART

A screen shot of a graph  Description automatically generated

For a complete overview of the Japanese yen’s technical and fundamental outlook, download our complimentary Q1 trading forecast now!

USD/JPY TECHNICAL ANALYSIS

While the Bank of Japan’s monetary policy announcement sparked some yen’s volatility, it was ultimately a nothingburger, with the institution maintaining its ultra-loose policy settings – a decision that could pave the way for further weakness in the Japanese currency.

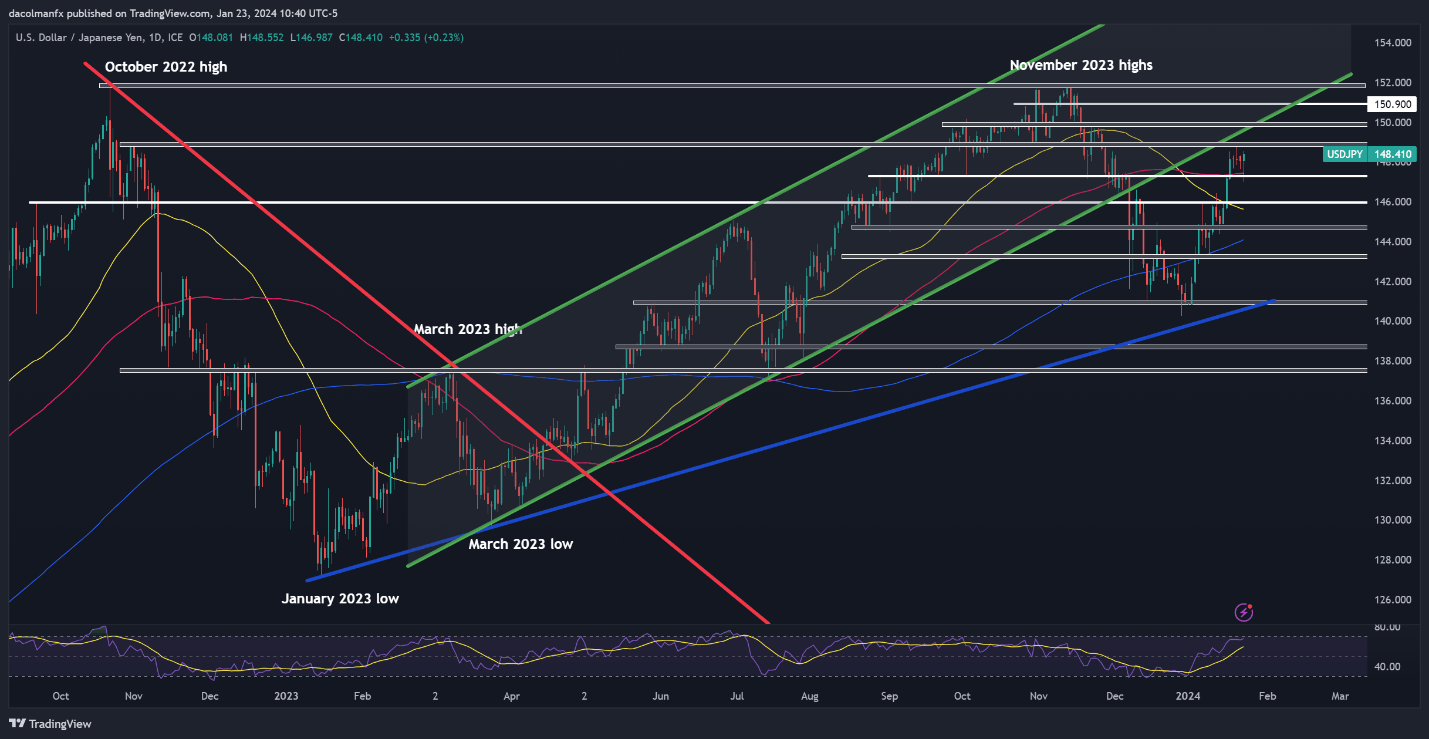
Looking at USD/JPY, prices seem to be ready to start the next leg higher after a short period of market consolidation, as shown on the daily chart below, where the pair can be seen approaching a key ceiling near 149.00. If buyers manage to push the exchange rate above this ceiling, a retest of the 150.00 level could be just around the corner.

On the flip side, if USD/JPY reverses off technical resistance, initial support is located near 147.40, near the 100-day simple moving average. Prices are likely to stabilize in this area before resuming their bullish path; however, a decisive breakdown could pave the way for a retracement toward the 146.00 handle.

USD/JPY TECHNICAL CHART

A screen shot of a graph  Description automatically generated

Interested in learning how retail positioning can shape the short-term trajectory of USD/CAD? Our sentiment guide has all the answers. Download your free guide now!

USD/CAD TECHNICAL ANALYSIS

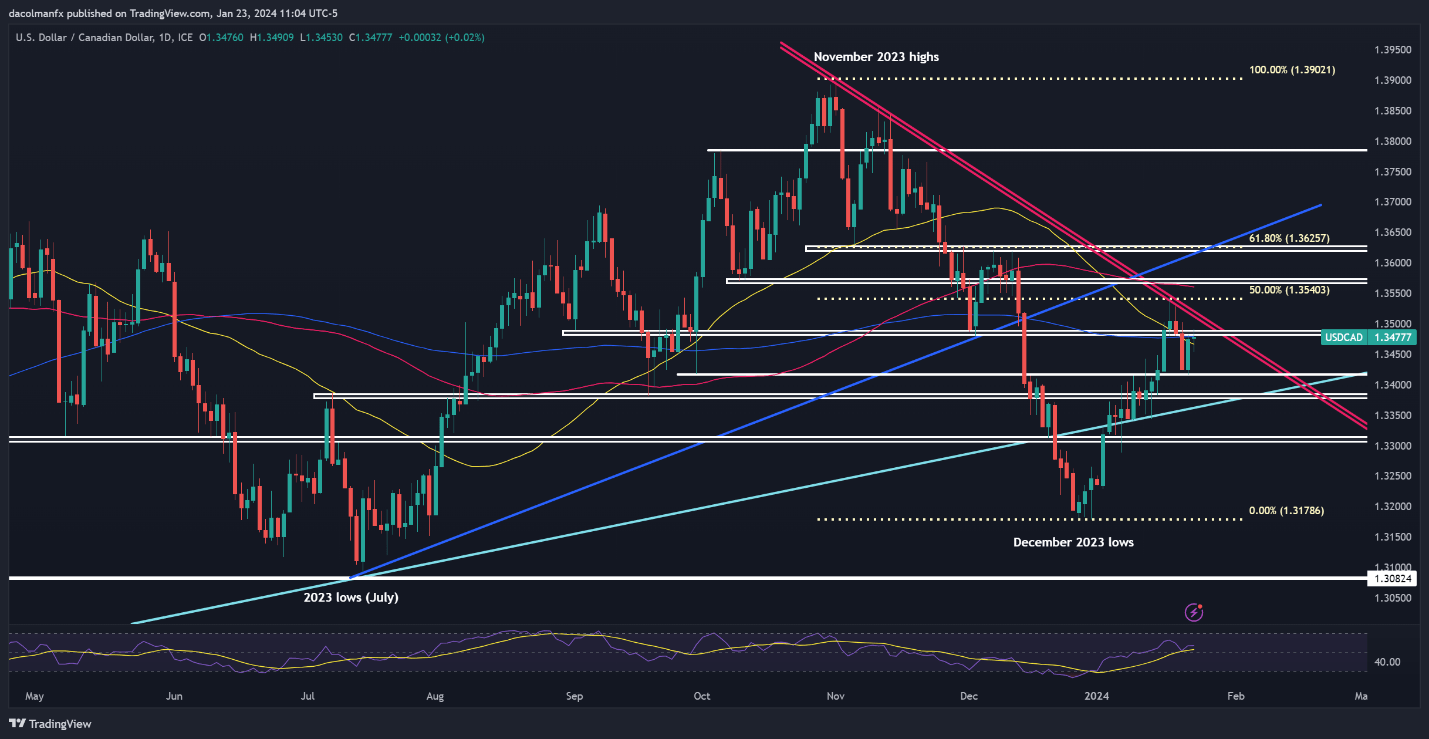
After a sharp pullback late last week, USD/CAD has regained ground over the past two days, overcoming significant hurdles in the process, including the 200-day and 50-day simple moving averages. Should gains accelerate in the coming days, trendline resistance appears at 1.3500. Looking higher, the crosshairs will be on 1.3540, the 50% retracement of the November/December downturn.

In contrast, should USD/CAD’s upward momentum falter and prices turn lower, primary support below the key moving averages highlighted before looms at 1.3415, followed by 1.3380. Although the pair may bottom out in this region during a pullback, a decisive breakdown could create the right conditions for a drop toward the 1.3300 handle.

USD/CAD TECHNICAL CHART

image3.png


Gold Wavers, GBP/USD Forges Symmetrical Triangle, Russell 2000 Eyes Breakout

Gold Wavers, GBP/USD Forges Symmetrical Triangle, Russell 2000 Eyes Breakout

GOLD TECHNICAL ANALYSIS

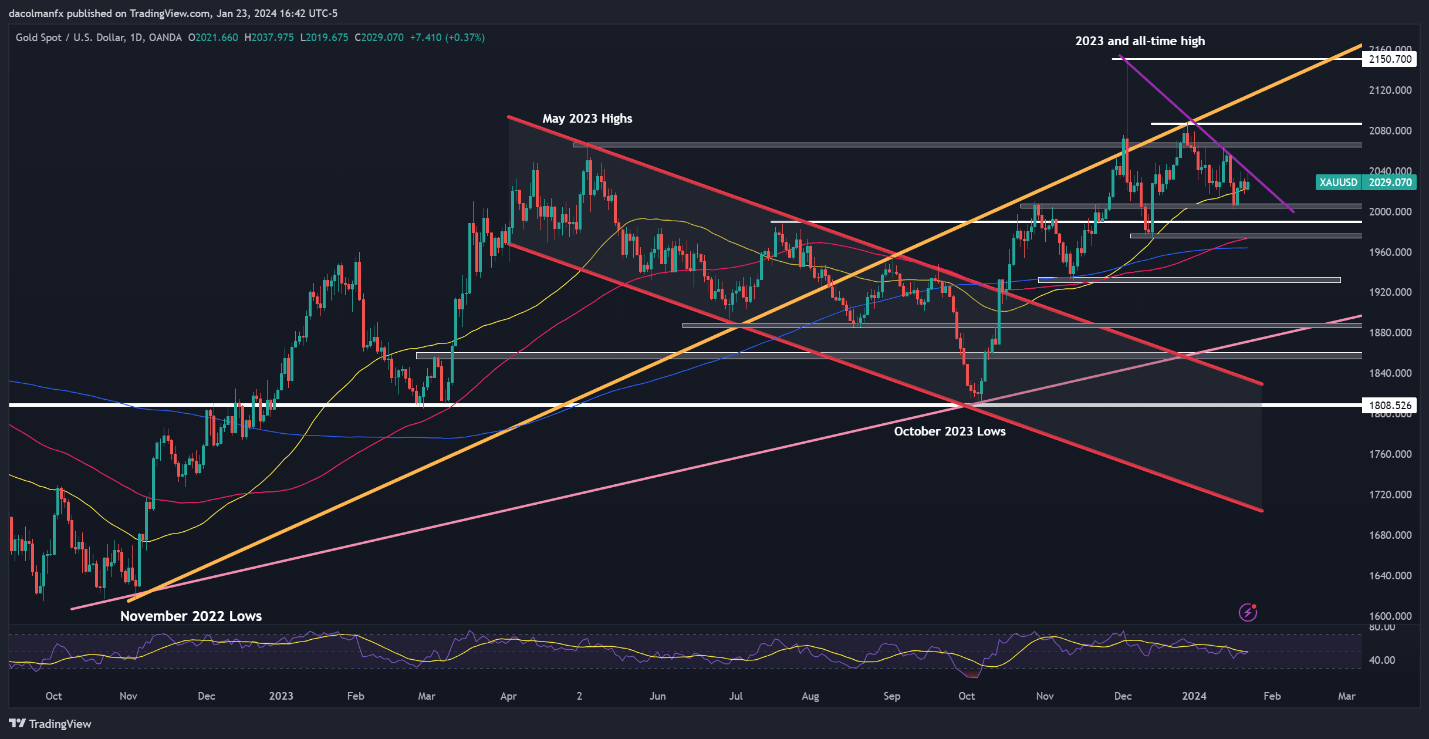
After falling to multi-week lows last Wednesday, gold has recovered some ground in recent days; however, the rebound appears to be losing momentum, with prices approaching trendline resistance at $2,040. To gauge the future direction, it’s vital to see how XAU/USD reacts around this ceiling, keeping in mind that a breakout could usher in a move towards $2,065. Moving up, all eyes will be on $2,080.

In case of a bearish rejection around $2,040, technical support is positioned around $2,005. The precious metal might find stability in this area during a pullback before mounting a turnaround, but should prices fall below this threshold, the bears could initiate an assault on $1,975. Additional losses from this point onward could draw attention to the 200-day simple moving average.

GOLD PRICE TECHNICAL CHART

A screen shot of a graph  Description automatically generated

Interested in learning how FX retail positioning can offer clues about GBP/USD’s near-term trajectory? Our sentiment guide has valuable insights about the subject. Request your free copy now!

GBP/USD TECHNICAL ANALYSIS

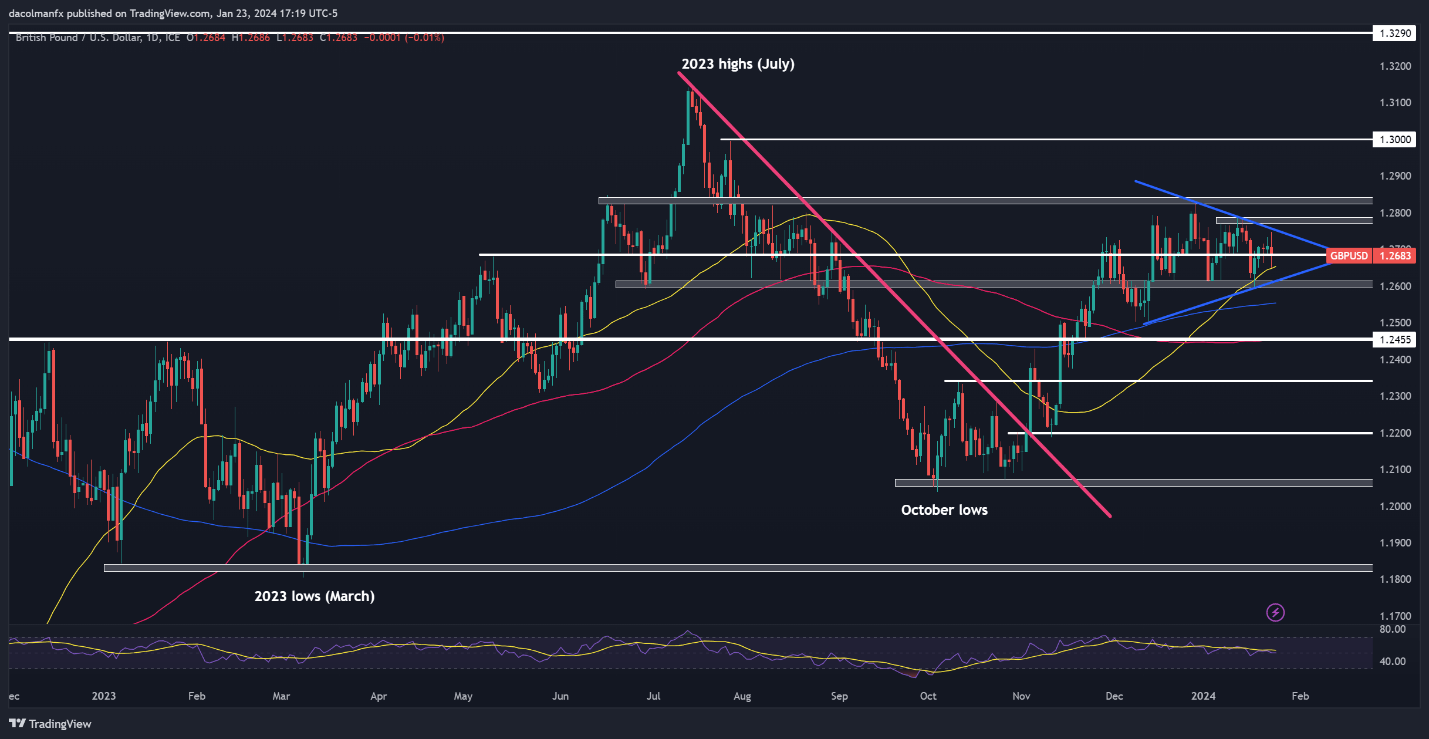
GBP/USD has been in an uptrend since October of last year, but its upward impetus has faded in recent weeks, with cable entering a consolidation phase, as reflected by the pair’s coiling within what appears to be a symmetrical triangle.

A symmetrical triangle, composed of two converging trend lines, an ascending one connecting a sequence of higher highs and a descending one linking a series of lower lows, is usually considered a continuation pattern once confirmed.

This setup is validated once prices breach the triangle, especially if the move is in the direction of the prevailing trend. In the case at hand, GBP/USD might rally towards 1.2775 upon successfully clearing 1.2750. With continued strength, the focus could shift to 1.2830, followed by 1.3000.

On the other hand, if consolidation resolves to the downside and prices fall below support at 1.2600, the 200-day simple moving average will serve as the next line of defense against a deeper pullback. Shifting gaze downward, all eyes will be on 1.2455.

GBP/USD TECHNICAL CHART

A screen shot of a graph  Description automatically generated

If you’re looking for an in-depth analysis of U.S. equity indices, our first-quarter stock market trading forecast is packed with great insights. Request a free copy now!

RUSSELL 2000 TECHNICAL ANALYSIS

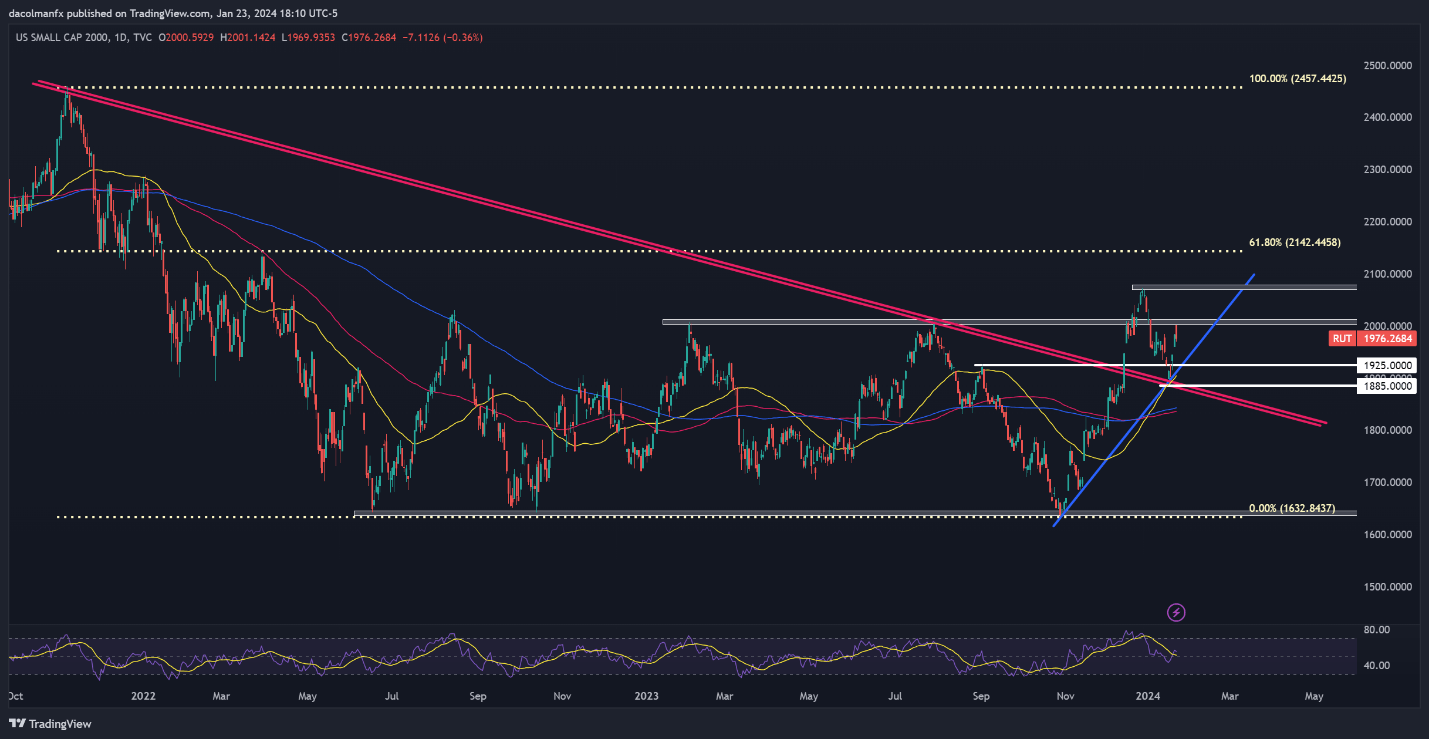
Following a sharp selloff earlier this month, the Russell 2000 has rebounded recently, though it has encountered resistance near the psychological 2,000 level. The small-cap equity index’s ability to surpass this hurdle remains in question, but if a decisive breakout occurs, a retest of last year’s highs near 2,075 could be around the corner. On further strength, a move towards 2,142 should not be ruled out.

On the flip side, if sellers return and regain decisive control of the market, prices could head back toward trendline support at $1,925. The Russell 2000 could bottom out around these levels during a retrenchment before staging a turnaround; however, a breakdown could intensify downward pressure, paving the way for a drop toward 1,885.

RUSSELL 2000 TECHNICAL CHART

A screenshot of a computer screen  Description automatically generated


How I Use RSI

How I Use RSI

Before we begin, it’s worth nothing that all oscillators are backwards looking- that is they are giving you a description of historical price action – not forward looking. It is with this humble regard that we approach momentum studies and while there is much we can derive from this indicator, never base a trade solely on one technical factor. Rather this should be used as a tool within a broader technical approach to price action. Now, lets dive in.

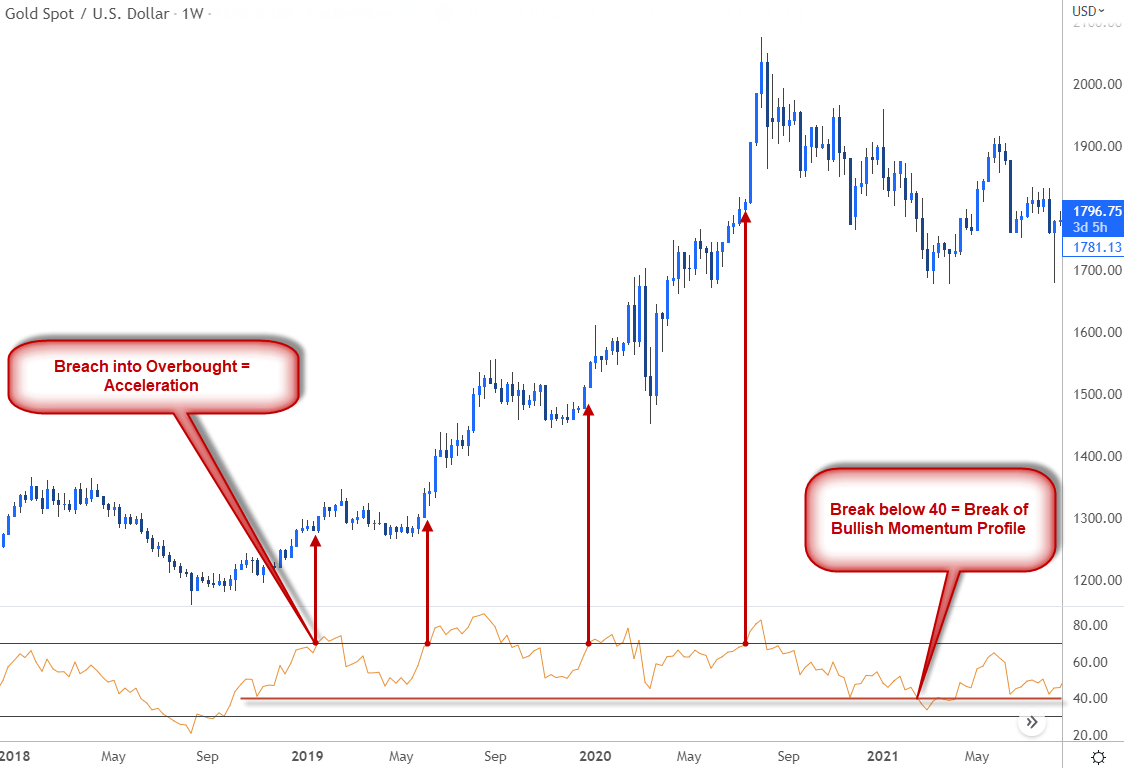
Everyone has heard of a market that is overbought or oversold – typically an RSI reading above 70 is considered to be overbought and below 30, oversold. But what does this mean for us from a trading standpoint? The misconception is that an overbought / oversold reading IS in itself the signal is one of the first major pit-falls of this indicator. A simple historical study of price action shows that often times the market has the most thrust when markets are trading above 70 in RSI and within a broader uptrend. Likewise, the largest declines can often be seen after momentum has broken below 30 within the confines of downtrends.

Gold Price Chart – XAU/USD Weekly

image1.png

The key is to remember that RSI has no time value – markets can remain in an overbought / oversold condition for an indefinite time period. In fact, the sharpest part of the rally or decline is often times after momentum has broken into the extreme. The signal, that exhaustion may be ahead is the return from the extreme- IE back the move back above 30 / back below 70. Recognizing this simple fact can help you avoid trying to call the high or fade something just because of a stretch in to momentum.

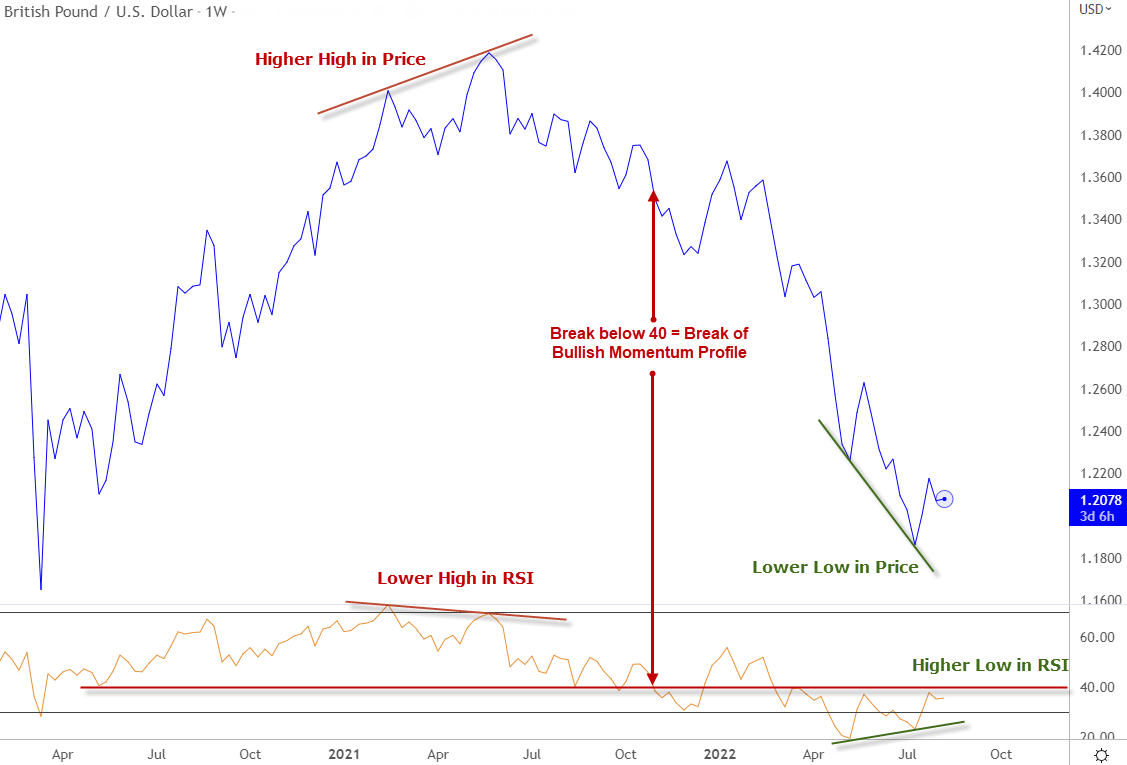
Another aspect of RSI that is often overlooked is what I call the momentum profile. A basic rule of thumb is that in strong bull-markets, RSI should typically hold above 40 – likewise in a bearish trends the oscillator will tend to find resistance at ahead of 60. These subtle tendencies can be very useful in assessing the broader directional bias from a moment standpoint and whether a move is corrective within a broader trend or a larger reversal.

Sterling Price Chart – GBP/USD Weekly

image2.png

A note on divergence – Divergence is a phenomena where a new extremes in price are not reflected in the oscillator. This tendency can often times help identity market turns / reversals. However its important to note that it is the candle close that matters – not the wicks (high / low). An easy way to help filter out the noise is to simply consider divergences on a line chart, taking account only the period close. The Sterling chart above illustrates both bullish / bearish divergence signals and shifts in the broader momentum profile. It’s worth noting that the closer the divergence reference points are to 50- the stronger the signal. So in this example, the bearish divergence seen in 2021 would be interpreted as a stronger signal than that of this year’s rebound in GBP/USD.

Bottom line : All oscillators should be used in as a compliment to a broader trade strategy and there should never be an over-reliance on any one indicator other than price. That said, momentum can be an extremely useful tool when used properly and offers much more insight than simple overbought / oversold readings within the confines of a given trend. Forget the cookie-cutter explanations – knowing how a given indicator behaves to real-life price action is the key to effectively utilizing them as part of you trading strategy.


Trading Psychology: Managing Emotions

Trading Psychology: Managing Emotions

Discretionary traders are not programming trade criteria and removing the ‘self’ from the decision-making process as say a quantitative trader would.

But while not trading quantitively you still need to have hard-fastened rules in place to guide the decision-making process and manage risk. A trading plan. This is the first step towards mitigating negative emotions (i.e. fear) and emphasizing positive ones (i.e. conviction).

But no matter how prepared you are, you will still have to face the thoughts and feelings that impact your trading. It all begins with self-awareness. Developing good self-awareness means you have a good understanding of yourself and your strengths and weaknesses.

Let’s start with fear, for example, it’s a very common weakness experienced in trading. Something is causing it, but what exactly? A common culprit is trading too big. When trading with improper trading size you magnify volatility unnecessarily and it causes you to make irrational mistakes you normally wouldn’t make if trading with proper risk limits in place. The simple solution? Reduce your trading size to a manageable level.

It could be a larger problem at hand that is causing you to be fearful. Perhaps you’ve had a bad run and are experiencing a drawdown. While drawdowns are a natural part of trading, if not controlled they can become severe enough to cause not only monetary damage but psychological damage as well.

If you reach this point, the first piece of advice is to acknowledge you are struggling and take a break away from the markets. Get out of the fire. The time-off is almost certainly to make you feel better right away. Once you have been able to decompress, then it is time to get at the root of problem(s).

From there, fix the issues at hand one at a time, otherwise if you try to fix everything at once you will overwhelm yourself. Once you are confident you have the necessary fixes in place return to trading with inconsequential trading size. Your goal at this point is to get back on track by making quality trades that build your confidence back up, not try to make back all your losses quickly.

 Conviction, excitement are key emotions we want to feed off of. You should feel good as you pull the trigger. It’s the final piece of any good trade just before execution – conviction. If you do not have a level of conviction that urges you to go ahead and pull the trigger, then there is a good chance you are not in the ‘right’ trade. By ‘right’ it is meant the correct trade according to your analysis.

To be clear, good trades can and will be losers just as bad trades can be winners. The idea is to keep yourself winning and losing on only good trades. Stopping to make sure you really do have conviction on a trade idea will help ensure this.

If you are lacking conviction or excitement but still have a good set-up, then it could be market-related (i.e. too volatile) or personal (you’re experiencing fear perhaps to recent losses). Staying away from market conditions that don’t fit your strategy is prudent. Not trading when you are experiencing fear un-related to the market means you have some work to do in figuring out how to move past this. Often times it is as simple as reducing trading size by a material amount.

Feeling greedy, overconfident? The good news is that overconfidence is probably coming as a result of having good results. The bad news is that if you aren’t careful you will get reckless and end up in a drawdown or worse.

Recognizing this (self-awareness) and acknowledging this state of mind is first. This a good time to make sure you are using proper trade mechanics (i.e. sticking to stops, targets, good risk/management, good trade set-ups…). When you are doing well, there may be inefficiencies in your trading that you are overlooking. It is possible that you could be doing even better, or that you are doing things that in the long-run will do more damage than they have good.

To summarize: It all starts with SELF-AWARENESS. Listening to your emotions and understanding them and how they can impact your ability to make good decisions. By listening to yourself you can match the objective (cause) with the subjective (emotion) to help ensure you are trading in the right frame of mind.

Central Banks and Monetary Policy: How Central Bankers Set Policy

Central Banks and Monetary Policy: How Central Bankers Set Policy

How Central Banks Set Policy

Central bank policy is an important driver of movements in financial markets. Central bank officials gather, project, and analyze economic data to determine the future path of the economy and its relation to the bank’s policy goals. Challenges or deviations from the ideal path of the economy will often drive a central bank to policy action. However, the setting of a central bank policy is not as simple as issuing a press statement declaring a change in interest rates, an adjustment to asset purchases, or further supportive measures. Central bank policies must also be implemented through transactions in financial markets.

Central bank policies have a direct and oftentimes immediate impact on the FX markets. As central banks loosen or tighten policy, their respective currencies become more or less attractive to hold. Understanding the process by which central banks make such decisions is a valuable skill to any trader, as being able to predict what a central bank might do will give a greater depth of understanding to each key economic data release.

Mandates and Price Stability

While the US Federal Reserve is the most watched and most important of the central banks, it’s mandate exceeds that of the average central bank. The Federal Reserve is dually focused on maximum employment and price stability, while most central banks are focused exclusively on the price stability mandate. Price stability is best defined as low, stable, and predictable inflation. Most central bank’s target an inflation level of around 2%, which is viewed as a good indicator of strong and stable economic growth. When making monetary policy decisions, central banks must weight a variety of economic indicators, expectations, and conditions.

Economic Data

Central banks parse the same economic data that FX traders and other market participants watch closely. Unemployment, housing, and inflation are some of the key data points central bankers track as they meet to discuss and set policy. These indicators are important to GDP and to identifying expanding or slowing trends in a large economy. The DailyFX Economic Calendar is a great tool to help traders monitor the same data releases that central bankers are keeping a close eye on.

Recommended by Izaac Brook
Trading Forex News: The Strategy
Get My Guide

Projections, Economists

Beyond following the same economic data that market participants have access to, central banks employ hundreds of economists. These economists are specialized in a certain area of expertise and are often considered leaders in their field, making them the best choice to hold the responsibility of creating the projections that central banks will use to set policy. Economists create and model economic projections of the future path of the economy based on current data, expectations for the future, their knowledge of the subject area, and potential policy choices.

Central bankers use these models to anticipate where the economy is headed next and help evaluate the potential impact of their policy choices. Many central banks publish summaries of their economic and policy projections on a consistent basis, and these summaries are a valuable resource for traders looking to understand how an important driver of markets is viewing overall economic conditions.

Framework

Once central banks have gathered the necessary amount of economic data and projections, they apply it to a framework in order to determine whether policy changes are needed. A central bank’s policy framework outlines its understanding of the relationship between key economic metrics and the central bank’s mandate, oftentimes how a variety of economic data points will weigh on inflation.

The ever-evolving world economy has led to continual evolution of central bank policy frameworks. Monetary policy setting was once based on simple rules and equations that dictated a proper level of interest rates given the relationship between inflation and employment. The world has since become much more complex, and central banks have moved away this simplistic, rules-based approach to policy.

The most important development, and the one with the largest implications for central bank policy, is the secular trend of low interest rates and low inflation in developed economies. Continued low interest rates have weakened the central bank’s ability to fight economic downturns through simple cuts in interest rates. Meanwhile, low inflation despite tight labor markets and low rates has meant that central banks have had to rethink and update their understanding of the relationship between employment and inflation.

With these shifting tides in mind, the Federal Reserve and the ECB have both conducted reviews of their monetary policy frameworks. While the ECB’s review and conclusions are still underway, the Federal Reserve announced its findings and its new policy framework in the late summer of 2020. In this announcement, Fed central bankers recognized that the relationship between inflation and employment had changed such that the economy can tolerate higher employment levels without inflation becoming a threat. The Fed also changed its inflation policy from a symmetric 2% target to an average 2% target, meaning that Federal Reserve policy makers will now tolerate inflation higher than 2% so long as that higher inflation helps raise the average to 2%. In essence, this new framework communicates to the markets that the Fed will no longer be looking to tighten policy at the first signs of overheating but rather will allow policy to remain loose and the economy to heat up further.

For traders and market participants, understanding that higher inflation readouts and other strong economic data will not drive the Fed to preemptively tighten policy is an important departure from the framework that held true following the financial crisis. For central bank watchers and traders in general, the importance of understanding the central bank’s framework cannot be overstated. An understanding of the framework will make for more informed trades as you will be able to better predict the market’s expectation of the central bank following data releases.

Once the central bank reconciles new economic data and projections with its framework, it makes a decision. While such a decision was once as simple as raising or lowering rates, central bank toolkits have expanded dramatically since the financial crisis as central banks have played a larger role in supporting the financial system and the overall economy.

Conventional v/s Unconventional Policy Tools

Before the financial crisis, the toolkit of most central banks was relatively standard. These central banks would set a short-term interest rate and control bank lending through reserve requirements and other similar metrics. The major exception to these simple operating tools was the Bank of Japan, which began to embark on “unconventional” policy tools beginning in the late 1990s, as Japan struggled to escape a major recession and deflation.

Learn more about major financial bubbles, crises and flash crashes

In the aftermath of the financial crisis, economies around the world remained stuck in a state of shock. Global central banks, led by the Federal Reserve, began to adopt the same unconventional policies introduced by the Bank of Japan. They purchased large amounts of government bonds to flood the financial system with liquidity and dropped and held their policy rates at zero or even in negative territory. During the crisis, central banks also used their lending powers to create new, targeted tools that could provide support to key areas of the financial system, like money market funds and large broker-dealers, that fell outside of the purview of traditional central bank support tools.

These unconventional tools have become a major part of the central bank’s toolkit and have been put to use to great effect during the Covid crisis. Beyond slashing policy rates back to the zero-lower bound, central banks expanded the scope of their support measures beyond anything seen during the financial crisis, pledging support to corporate bond markets, backstopping key areas of the financial system, and purchasing trillions in government bonds.

Quantitative Easing

Following the financial crisis, central banks set out on a journey to manipulate longer-term rates and flood the financial system with liquidity in order to better support economic spending, growth, and inflation. Through large-scale asset purchase programs, better known as quantitative easing (QE), central banks have bought large quantities of government debt from the open market. Technically, these operations are similar to the traditional open market operations undertaken by central banks pre-crisis, just on a much larger scale. While the exact mechanism of action surrounding QE remains a point of debate, such programs drive down longer-term interest rates, help to support inflation, and oftentimes provide a tailwind to other financial markets.

QE has also risen in importance given the prolonged period of low rates that advanced economies have been faced with. Since central banks can no longer simply cut rates to the necessary level needed to jumpstart the economy during a recession, they have instead turned to further QE programs. Research suggests that an asset purchase program equivalent to around 1.5% of GDP has a similar impact as 25 basis point interest rate cut. With US interest rates at only 1.50% before the Covid crisis, and rates elsewhere even lower, continued QE programs should supplement the deficiency in traditional rate cuts. As such, asset purchase programs have ballooned since the Covid crisis began, sending central bank balance sheets to record levels.
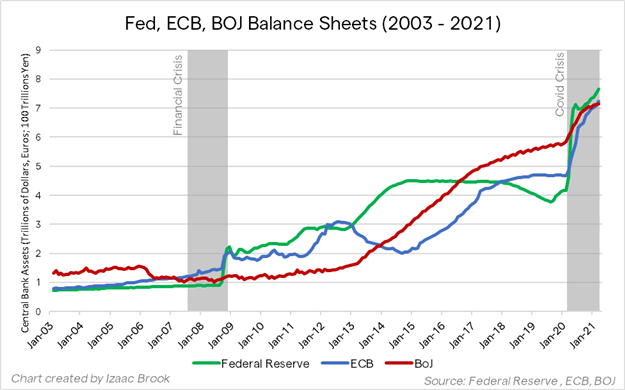
Implementation

These unconventional support measures are carried out by the central bank’s monetary policy implementation division. The implementation division is where central bank policy is actually put into effect through trading and technical adjustments made in financial markets. Policy decisions from head central bankers are passed to central bank traders, who then trade with specific counterparties to move rates or otherwise carry out policy decisions.

Rates Setting: Pre-Crisis

For the Federal Reserve, monetary policy is implemented through the Federal Reserve Bank of New York. Before the financial crisis, a decision on the Federal Funds Rate would be passed to markets desk traders. These traders would conduct open market operations with primary dealers. Primary dealers are large banks approved as trading counterparties of the NY Fed, and are required to make markets and support the issuance of US Government debt (Treasuries). The NY Fed markets desk would buy or sell a certain amount of Treasuries from these banks, adjusting the supply of liquidity in the financial system and pushing short-term rates into the FOMC’s desired range. This fine-tuning of liquidity was the process used by central banks around the world before the unconventional tools of the financial crisis were put to use. Once global financial systems were flooded with liquidity, policy setting had to evolve beyond this rudimentary method.

Rates Setting: Post-Crisis

Following the QE operations undertaken by central banks during the financial crisis, traditional open market operations would not have enough of an impact on liquidity and credit conditions to materially tighten or loosen interest rates. The Fed’s main policy lever became interest on reserves, the rate at which banks earn for storing “freshly-printed” QE money directly at the Fed.

Keep track of interest rate decisions by visiting our Central Bank Calendar

Activity in the Federal Funds Market shrunk drastically as banks no longer needed to seek out funds to maintain regulatory requirements and also no longer desired to lend to other banks on an unsecured basis. Instead, interbank lending migrated to the repo market, where lending is secured against collateral. The NY Fed’s repo and reverse repo facilities have become important tools for managing the excess liquidity in the system and the rates on these facilities are often adjusted alongside the Fed’s main policy rate. The repo (RP) facility allows the Fed to lend to cash-seeking market participants against Treasury collateral, setting an upper-bound on interest rates. The reverse repo facility (RRP) is the opposite, where the Fed lends Treasury collateral to market participants with excess cash. The RRP facility serves as a temporary drain of reserves from the system and sets a lower-bound on interest rates.
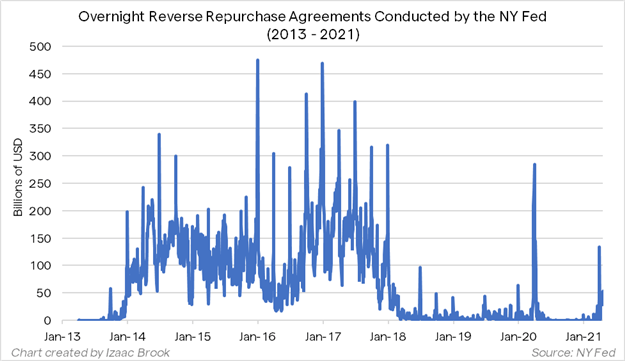
During 2014 to 2018, the pre-Covid peak of the Federal Reserve’s balance sheet, the RRP facility saw huge uptake at quarter-end periods as excess cash was drained from elsewhere in the financial system, preventing rates from below the FOMC’s lower-end target. With bank reserves at new record highs in the post-Covid environment, one should expect to see similarly-large usage of the RRP facility at future quarter-ends. The NY Fed raised the counterparty limit for the facility at the March 2021 FOMC meeting in preparation of future usage.

Unconventional Policy Implementation

QE programs are implemented in the same way that open market operations are. Traders in the central bank’s policy implementation division publish announcements and schedules detailing their purchase plans. Their counterparties submit a list of bonds they are willing to sell to the central bank and the central bank’s traders select and transact with the most competitive bids. While the internet is awash with central bank-focused money printing memes, the actual money created by the central bank in exchange for these bonds is electronic only. The accounts of transacting counterparties are credited with fresh digital money from the central bank.

Communication is Key

Given the evolution of monetary policy implementation since the financial crisis, another important development in the central bank toolkit has been forward guidance. Forward guidance is the communication of the future path of interest rates. The premise of forward guidance is simple: businesses, investors, and markets are constantly trying to predict the central bank’s next moves. By clearly communicating their plans, central bankers can adjust expectations to their desired points and provide better clarity to markets. Forward guidance is linked to policy framework, applying the central bank’s view on key metrics to its communication about future policy.

Communication, transparency, and the setting of expectations has been a continually-evolving piece of central bank policy. Transparency on policy helps the central bank remain both predictable and credible, valuable standards to maintain for an institution with such power over the financial system. The FOMC began to use forward guidance in the aftermath of the financial crisis, communicating that rates would be held at zero “for some time.” As the recovery continued, forward guidance language evolved to a dates-based approach and then an outcomes-based approach. Both approaches help to set expectations for policy over the longer-term and have proved useful for central banks around the world.

Central banks have turned to forward guidance again in the Covid crisis, providing markets with clear communications of rate outlooks, tapering expectations, and asset purchase program paths. For its part, the Federal Reserve has continued to stick to guidance consistent with their new framework despite strong economic data and market worries of inflation. FOMC members have affirmed that tapering and rate hikes will not come until substantial progress is seen towards the Fed’s goals.

Setting Policy, Summation

Central bank policy has evolved a great deal over the past two decades. While the data that central banks track in order to formulate policy has not changed much, the way that policy is implemented has evolved a great deal. The development of secular trends following the financial crisis has also created the need for new innovations in policy. Central banks now control rates and monetary policy more generally through the management of liquidity, through large-scale asset purchases, through technical tweaks to money markets, and through enhanced communication. Understanding how these components interlock and weigh on each other and their impact for overall financial markets is valuable knowledge for any trader.


Using Candlestick Wicks to Identify Price Action Support and Resistance

Using Candlestick Wicks to Identify Price Action Support and Resistance

In that scenario the main takeaway is the point at which the wick began to form – which is the same price at which the reversal started to show on lower time frames – is a resistance price of relevance and something that traders can follow on their chart for future trade setups or analysis.

But – what about when multiple wicks align at the same price point?

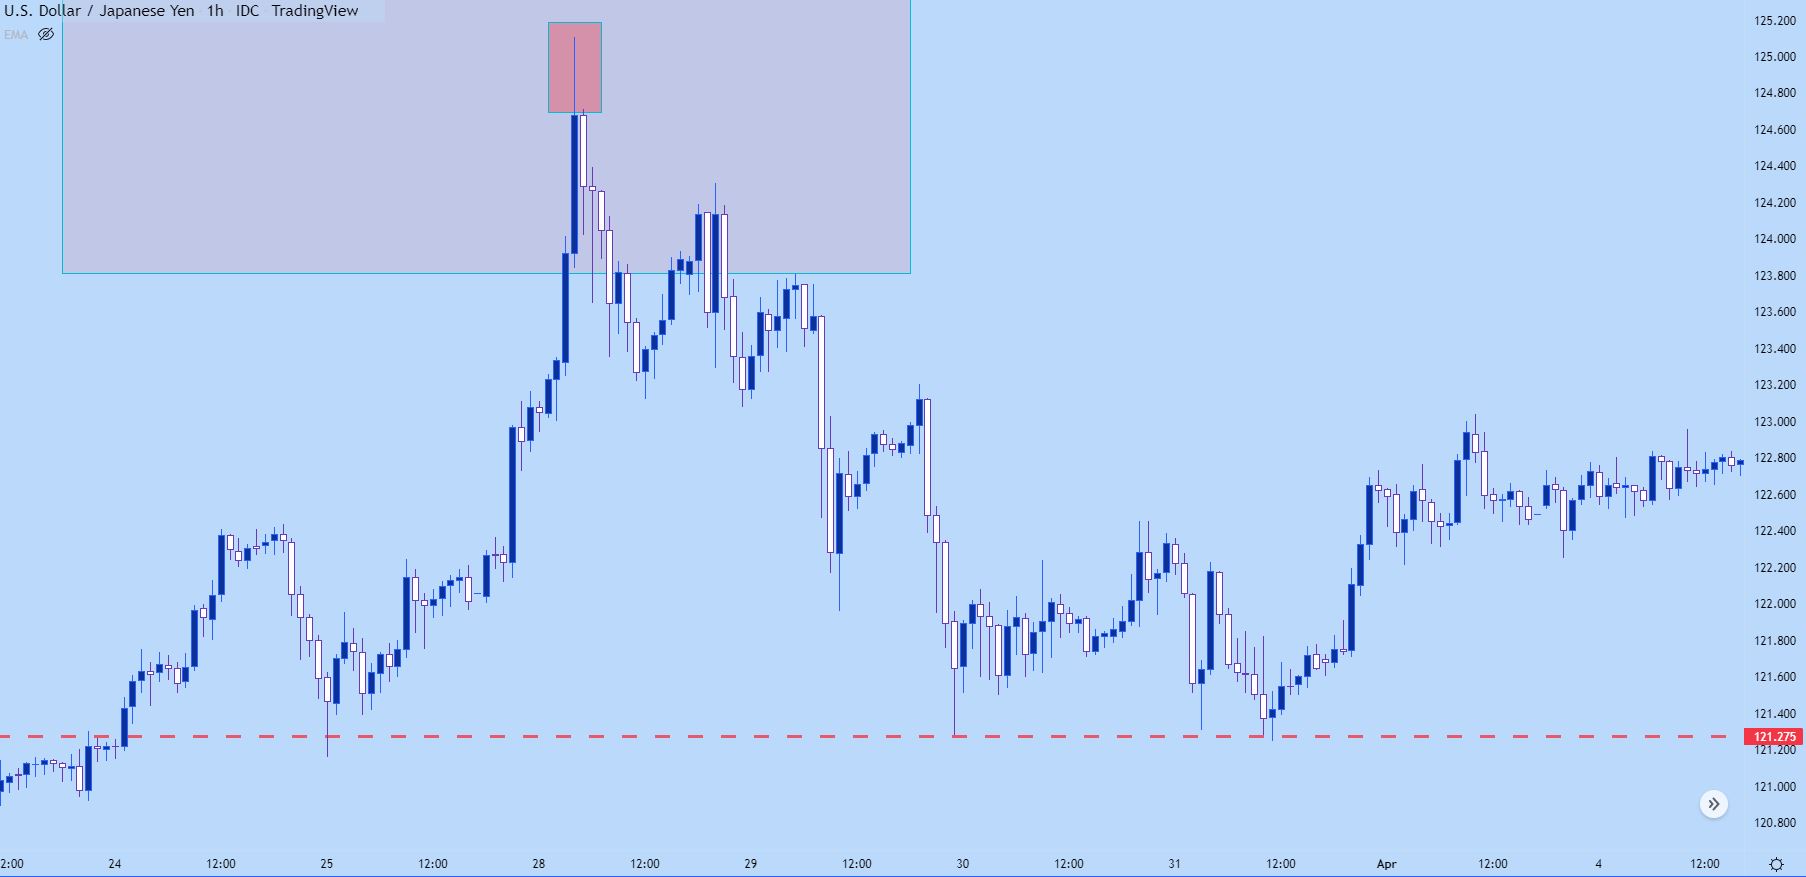
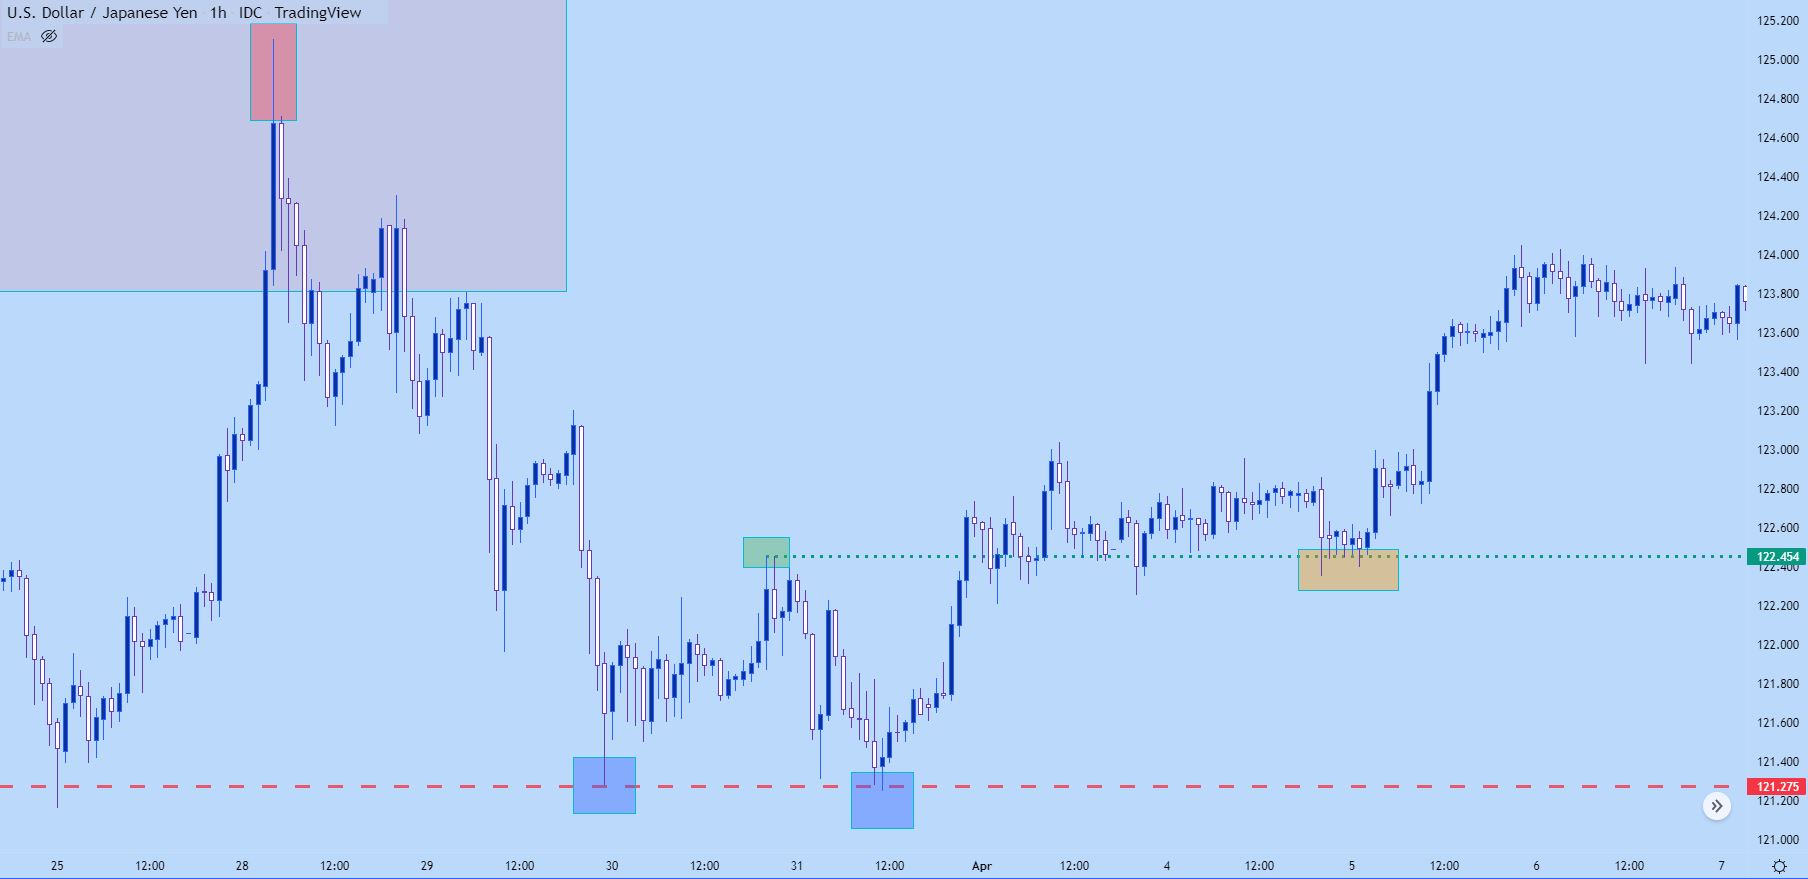
You might remember the final point of our last article, in which I wanted to draw your attention to a red line on that USD/JPY chart. I’ll post it again below to highlight what I’m talking about.

USD/JPY Hourly Price Chart

Chart prepared by James Stanley; USD/JPY hourly chart, late March – early April 2022

Previously we were looking at the reversal as started by the extended wick on this hourly chart. But, look at what happened at the red line after the move had priced-in.

As price hit the red line after topping, the sell-off stopped. Sellers took another swing but when touching that level for a second time, similarly, the sell-off stopped.

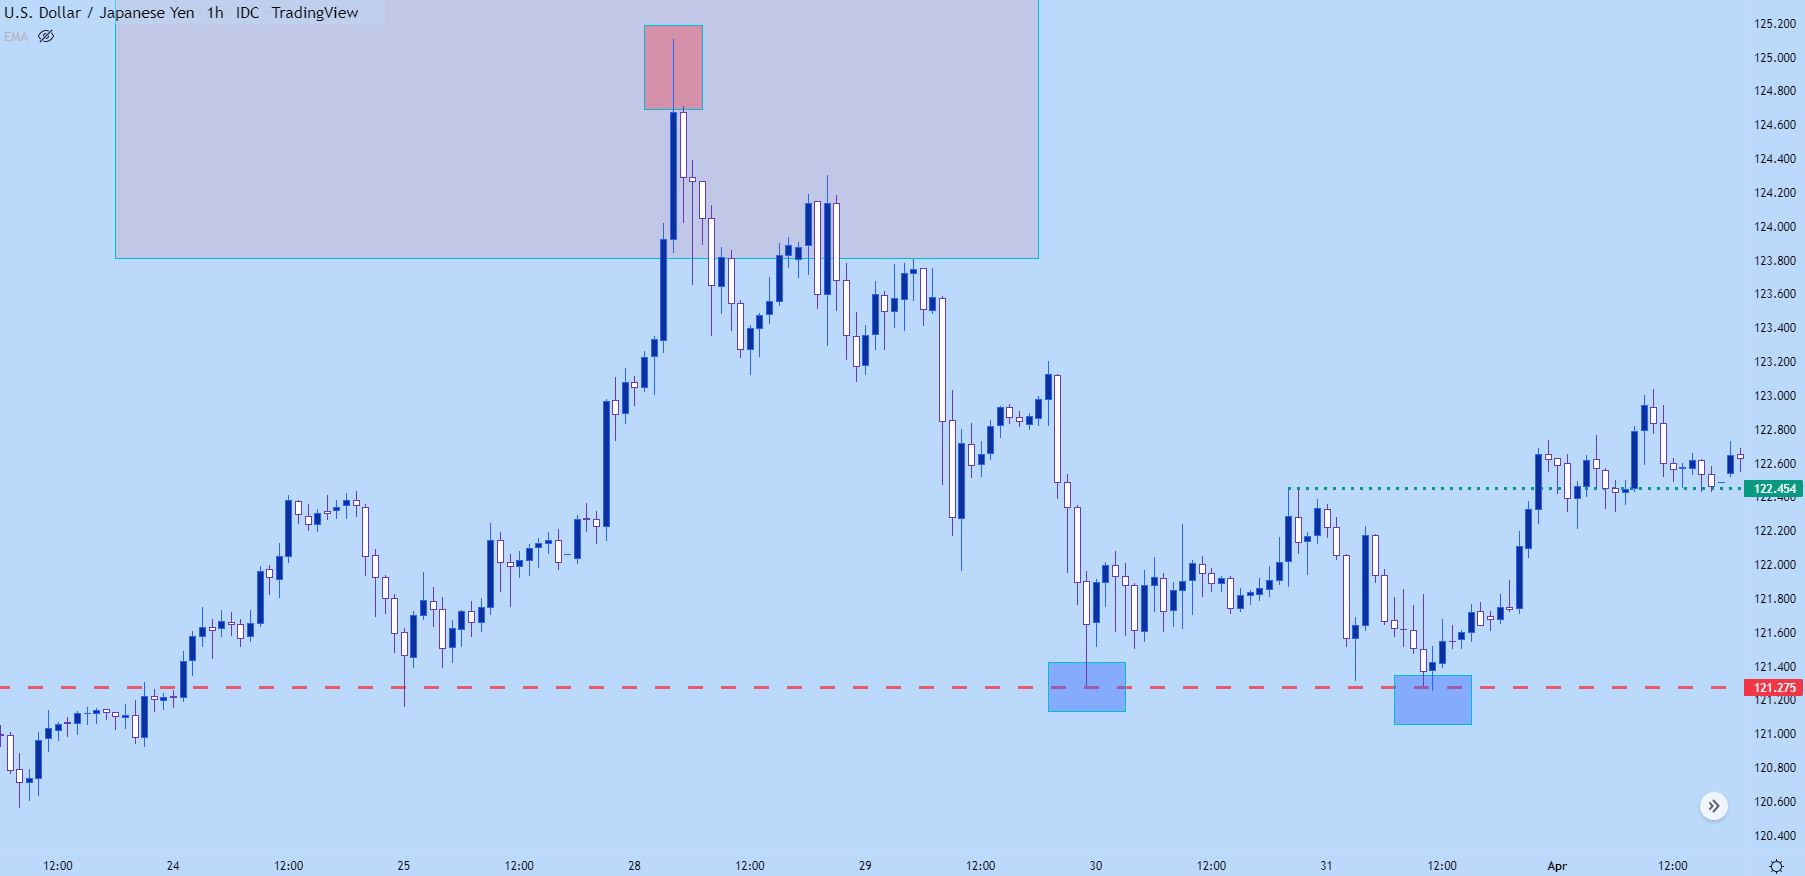
This is indication of support. Below, I take a closer look at this item with a blue box around each bounce. I’ve also added a green line that we’ll talk about a little later.

USD/JPY Hourly Price Chart

Chart prepared by James Stanley; USD/JPY hourly chart, late March – early April 2022

When a point of support shows two inflections, that brings up a possible double bottom formation. Such formations are often followed with the aim of bullish reversals, driven by the premise that price hit a level of support that it could not breach and, eventually, that support played out with buyers reversing the trend to bring on higher prices.

Remember that green line? Well, that would be called the ‘neckline’ from such a formation, and it’s simply the high point between the two support inflections. A breach of that neckline opens the door for bullish trends as a short-term breakout takes hold.

In the below example, we can see where that breakout hits shortly after the second support inflection, after which the green line of prior resistance is soon re-purposed as support before the bullish trend launches higher.

USD/JPY Hourly Price Chart

Chart prepared by James Stanley; USD/JPY hourly chart, late March – early April 2022

Wick Sequencing

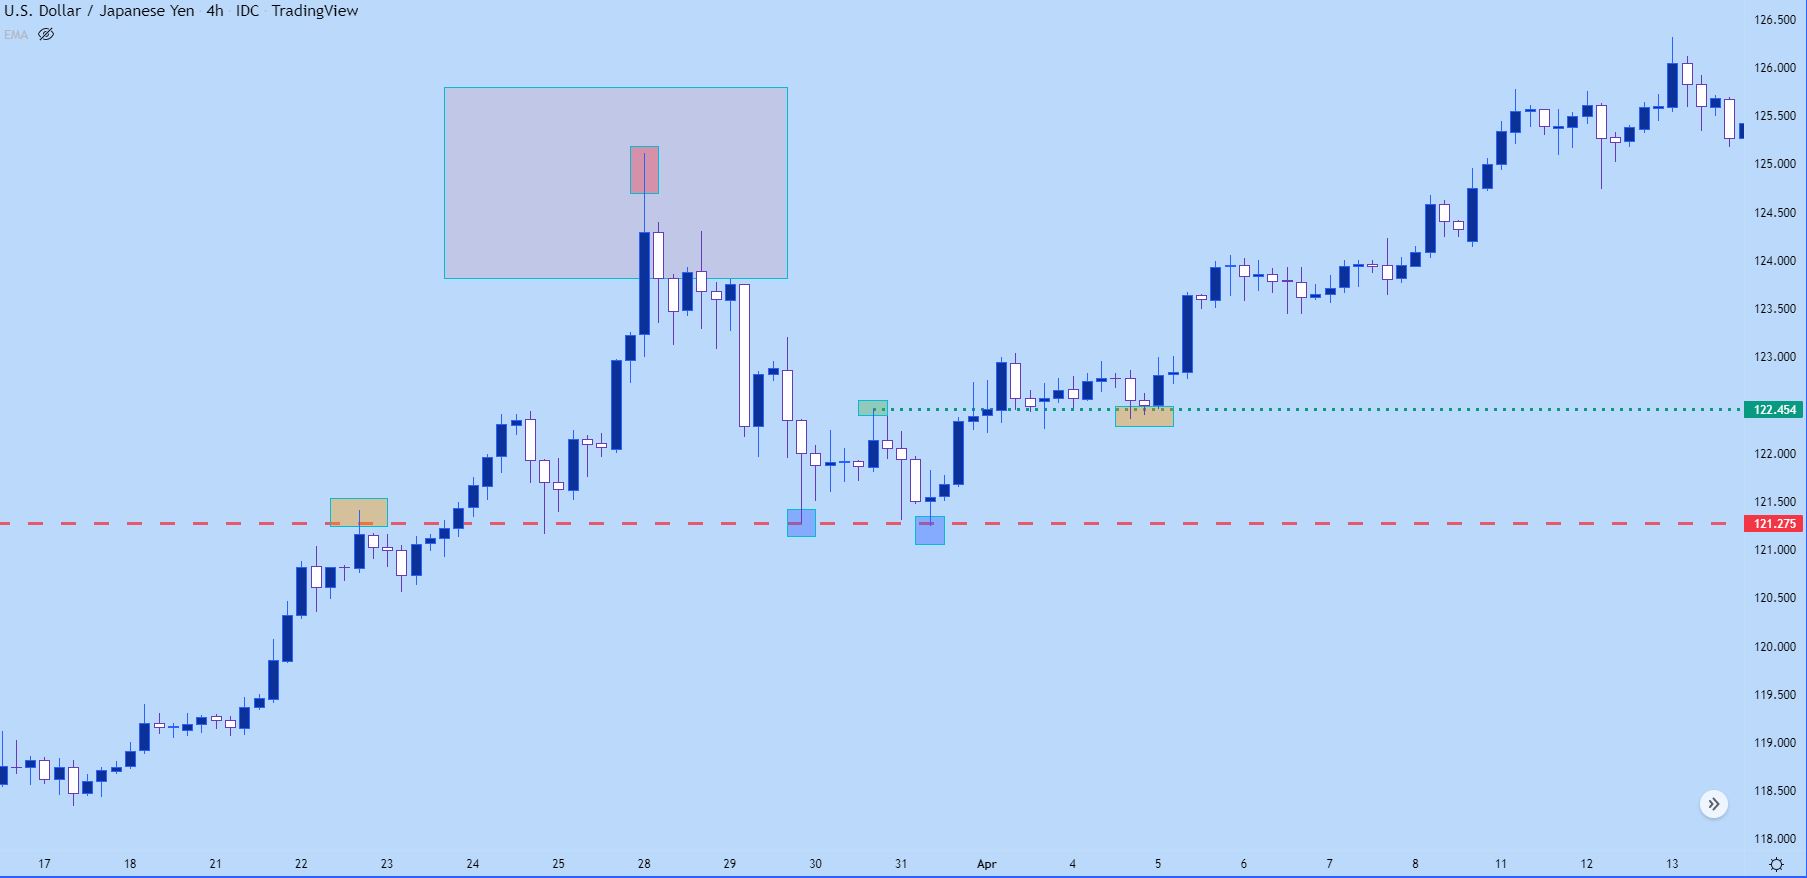
Let’s look at that same example again but, this time we’ll use a four hour chart. The benefit of a four hour chart is that we’re getting a lot more information in the same number of candles but, the trade-off is less granularity.

But, price is price, and whether that price served as support or resistance on a one minute or a weekly chart, it will show on the candlestick chart as an inflection.

But – when we get a grouping of candles all showing wicks in a similar area – that’s highlight a key price level that’s at work, continuing to drive price flows in that market as it comes into play. On the below chart, notice the orange boxes, one on left and the other on the right side of the chart.

The first orange box is showing resistance which later became support. And the second orange box shows support that was prior resistance. The key being that these prices didn’t just drop on the chart, there was prior reference at these levels from previous days’ trading activity.

USD/JPY Four-Hour Price Chart