Gold Prices Slip as US Dollar, Yields Blast Higher; Nasdaq 100 Sinks to Support

Gold Prices Slip as US Dollar, Yields Blast Higher; Nasdaq 100 Sinks to Support

Gold prices (XAU/USD) retreated moderately on Tuesday, succumbing to rising rates and the commanding resurgence of the U.S. dollar, which climbed sharply following a poor performance last month, just as the curtain rose on the first trading session of 2024.

The Nasdaq 100 also suffered a setback, plummeting 1.7% to 16,543, posting its biggest daily decline since late October, weighed down by the substantial rally in U.S. Treasury yields.

After a strong finish to 2023 for the yellow metal and the technology index, traders adopted a cautious stance at the start of the new year, trimming exposure to both assets for fear of a larger pullback ahead of high-profile events in the coming days.

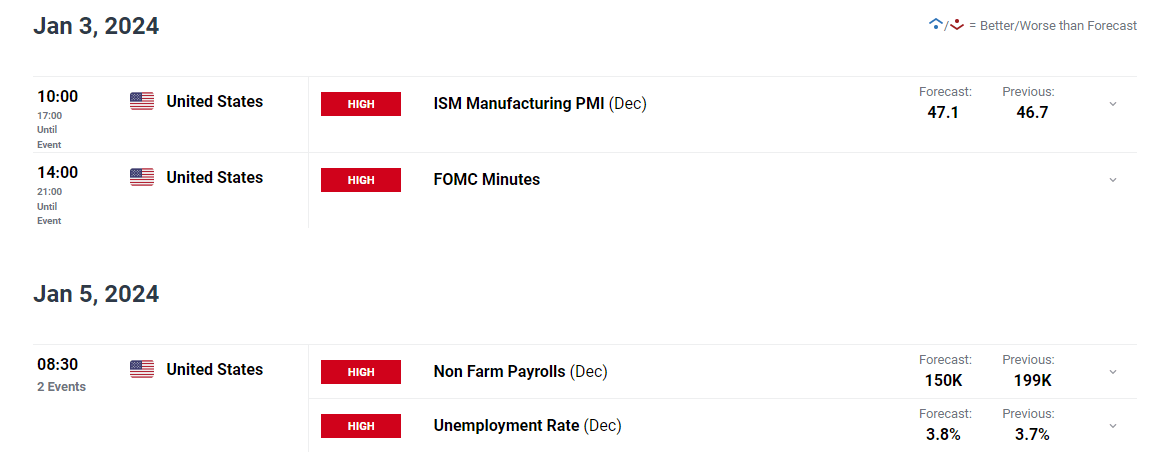
Focusing on key catalysts later this week, Wednesday brings the ISM manufacturing PMI, followed by U.S. employment numbers on Friday. These reports may give Wall Street the opportunity to assess the broader economic outlook and determine if aggressive easing expectations are justified.

Outlined below are investor projections for both the ISM and NFP surveys.

image1.png

In the grand scheme of things, subpar economic figures will be supportive of tech stocks and gold prices by affirming expectations for aggressive rate cuts. Conversely, robust data might trigger an opposing response, leading bullion and the Nasdaq 100 lower as traders dial back their bold rate cut forecasts.

For an extensive analysis of gold’s medium-term prospects, which incorporate insights from fundamental and technical viewpoints, download our Q1 trading forecast now!

GOLD TECHNICAL ANALYSIS

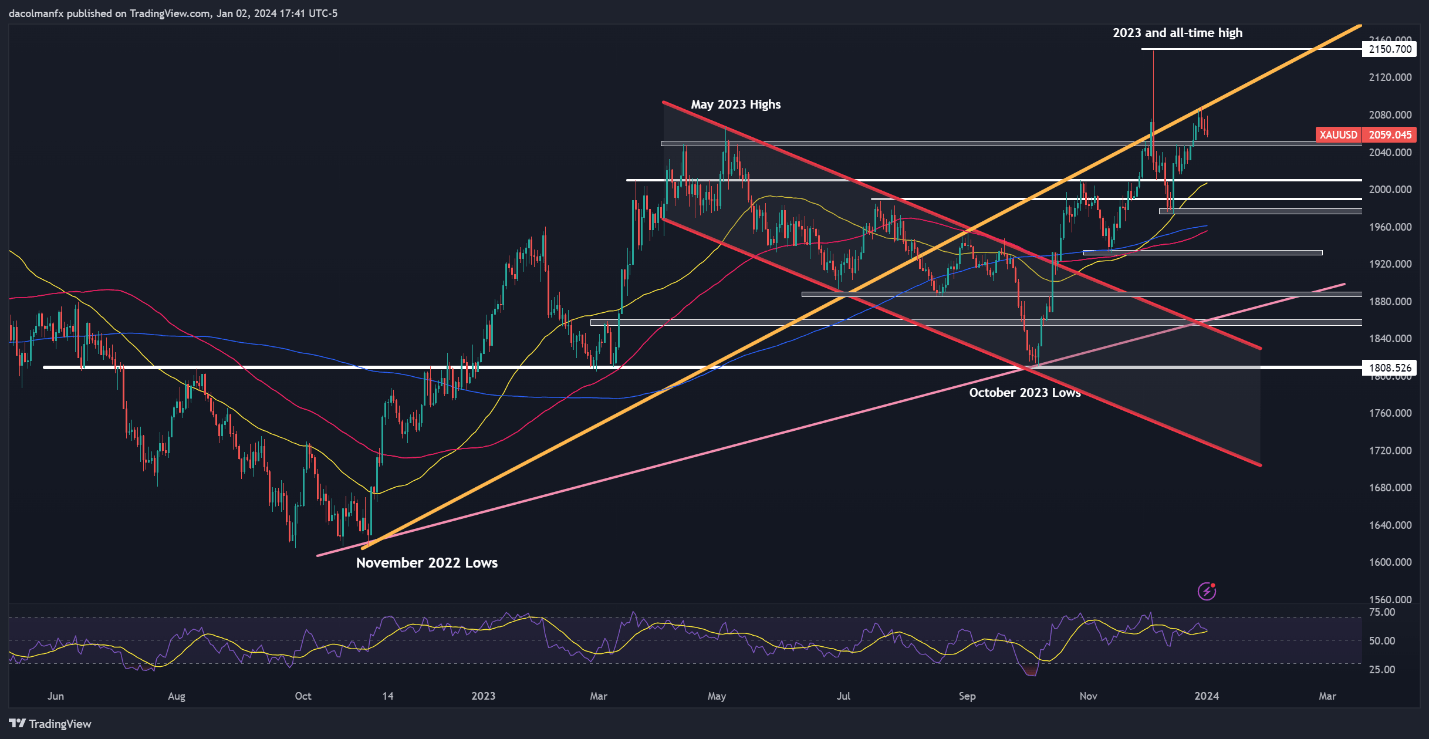
Gold trended lower on Tuesday, slighting for the third straight session after prices failed to clear a key resistance in the $2075-$2,085 region. If the precious metal extends its retracement in the coming days, support appears at $2,050-$2,045. Bulls must defend this floor tooth and nail – failure to do so could send XAU/USD reeling towards $2,010, near the 50-day simple moving average.

Conversely, if buyers regain the upper hand and propel prices upward, the first line of defense against a bullish attack emerges at $2075-$2,085. Previous attempts to break through this ceiling have been unsuccessful, so history could repeat itself in a retest, but in the event of a sustained breakout, the all-time high at $2,150 would be in play again.

GOLD PRICE TECHNICAL CHART

A screen shot of a graph Description automatically generated

If you’re looking for an in-depth analysis of U.S. equity indices, our first-quarter stock market outlook is packed with great fundamental and technical insights. Get it now!

NASDAQ 100 TECHNICAL ANALYSIS

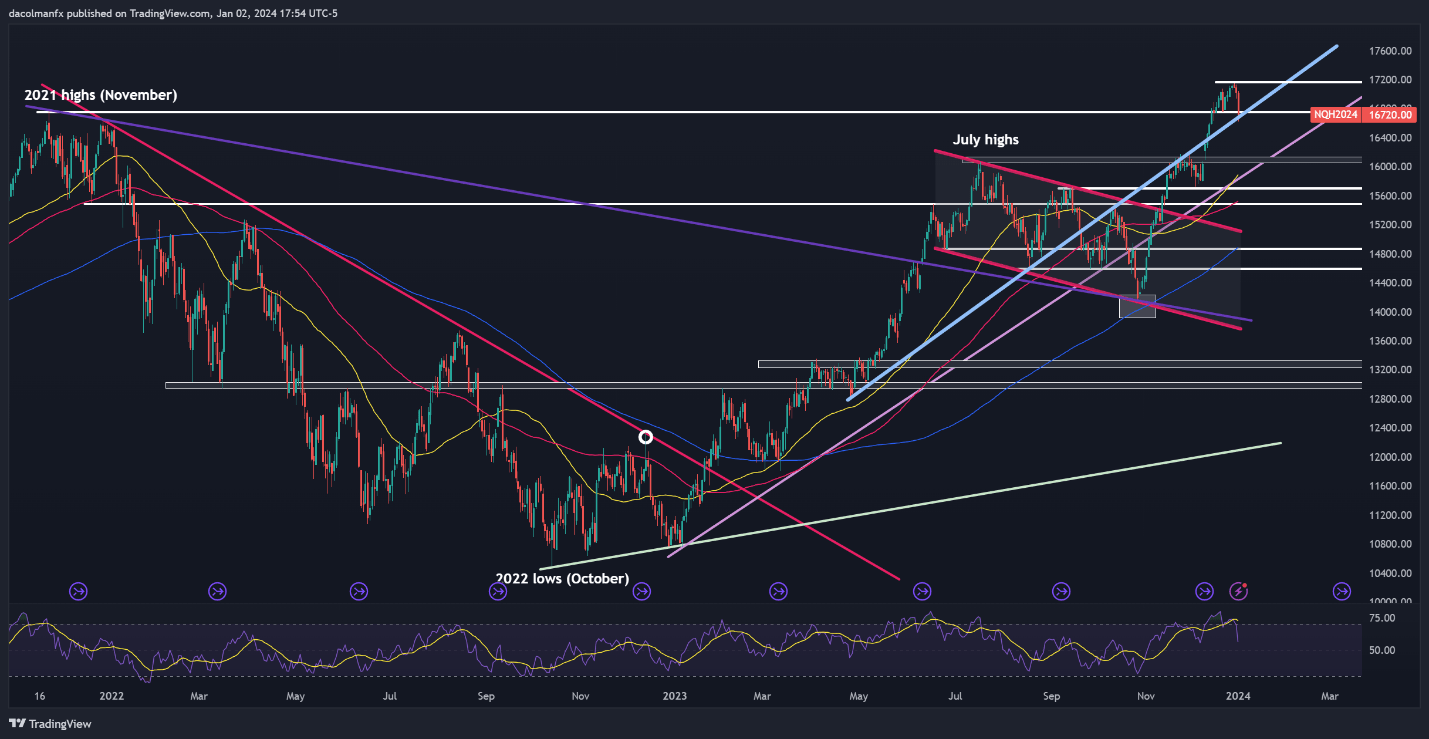
The Nasdaq 100 fell sharply on Tuesday, yet it narrowly avoided breaching confluence support positioned near the 16,700 area. To preserve bullish aspirations for a new record, this technical floor must be maintained at all costs; failure to do so might prompt a deeper downward move, with the next area of interest located at 16,150.

On the flip side, if market sentiment stabilizes and gives way to a steady rebound in the upcoming trading sessions, overhead resistance looms at 17,165. If history is any guide, the Nasdaq 100 could be rejected lower from this ceiling on a retest, but a breakout could trigger a rally toward 17,500, which would represent a new milestone for the tech index.

NASDAQ 100 TECHNICAL CHART

A screen shot of a graph Description automatically generated


Gold (XAU), Oil (USOIL) Bitcoin (BTC) Technical Outlooks and Prices

Gold (XAU), Oil (USOIL) Bitcoin (BTC) Technical Outlooks and Prices

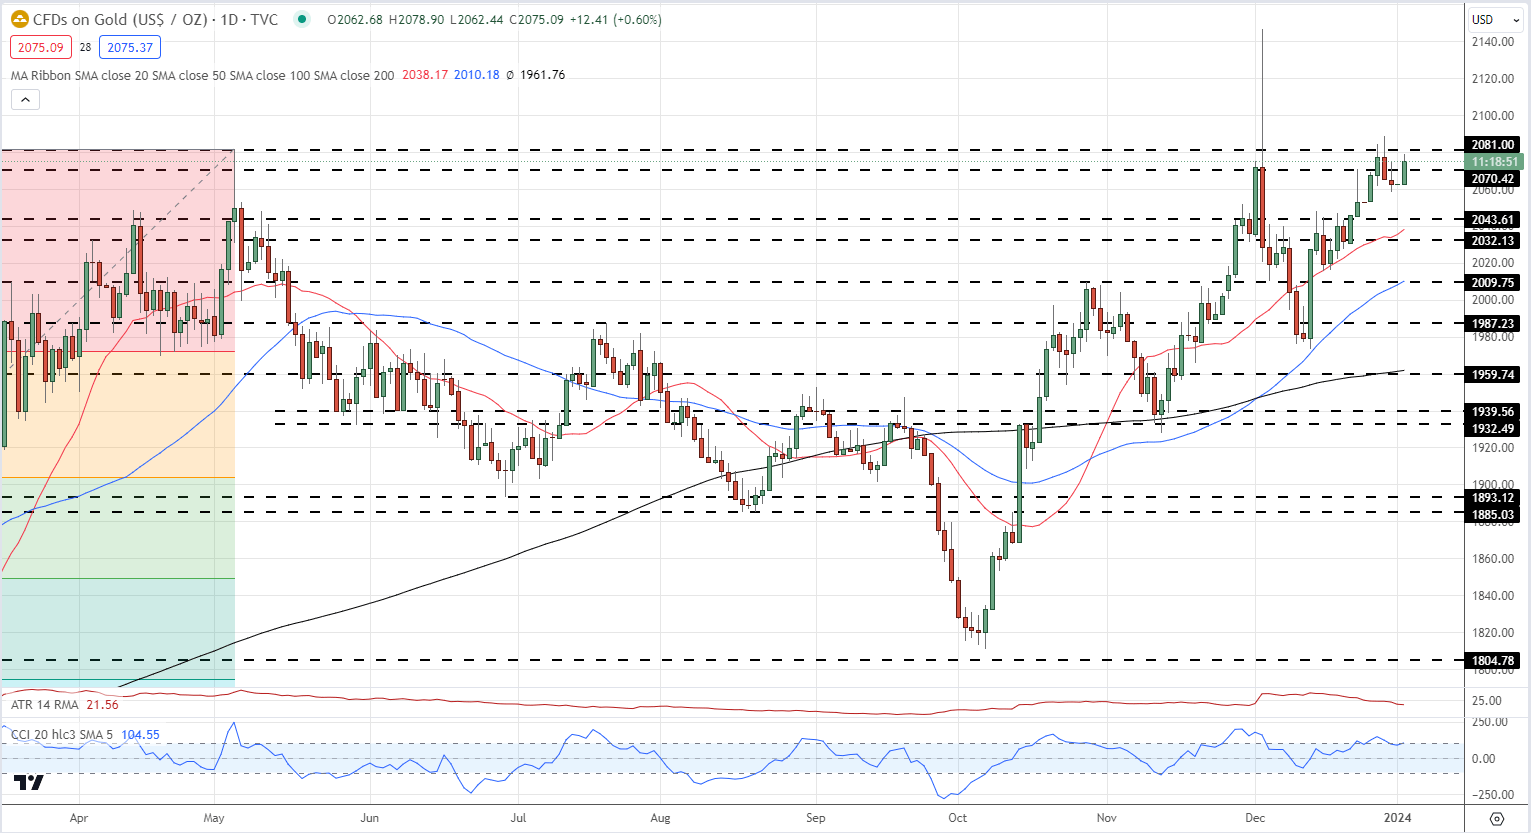
A stronger US dollar is weighing on gold as we start the year but the overall outlook for the precious metal remains positive. The daily chart shows a series of unbroken higher lows and higher highs since early October, while all three simple moving averages remain in a bullish set-up. There is plenty of recent support back down to around $2,010/oz. while a break above the December 28th high of $2,088.5/oz. opens the way to the spike high of $2,146.8/oz.

Gold Daily Price Chart

image1.png

Retail trader data shows 56.57% of traders are net-long with the ratio of traders long to short at 1.30 to 1.The number of traders net-long is 5.46% higher than yesterday and 6.39% lower than last week, while the number of traders net-short is 1.38% higher than yesterday and 7.14% higher than last week.

We typically take a contrarian view to crowd sentiment, and the fact traders are net-long suggests Gold prices may continue to fall.

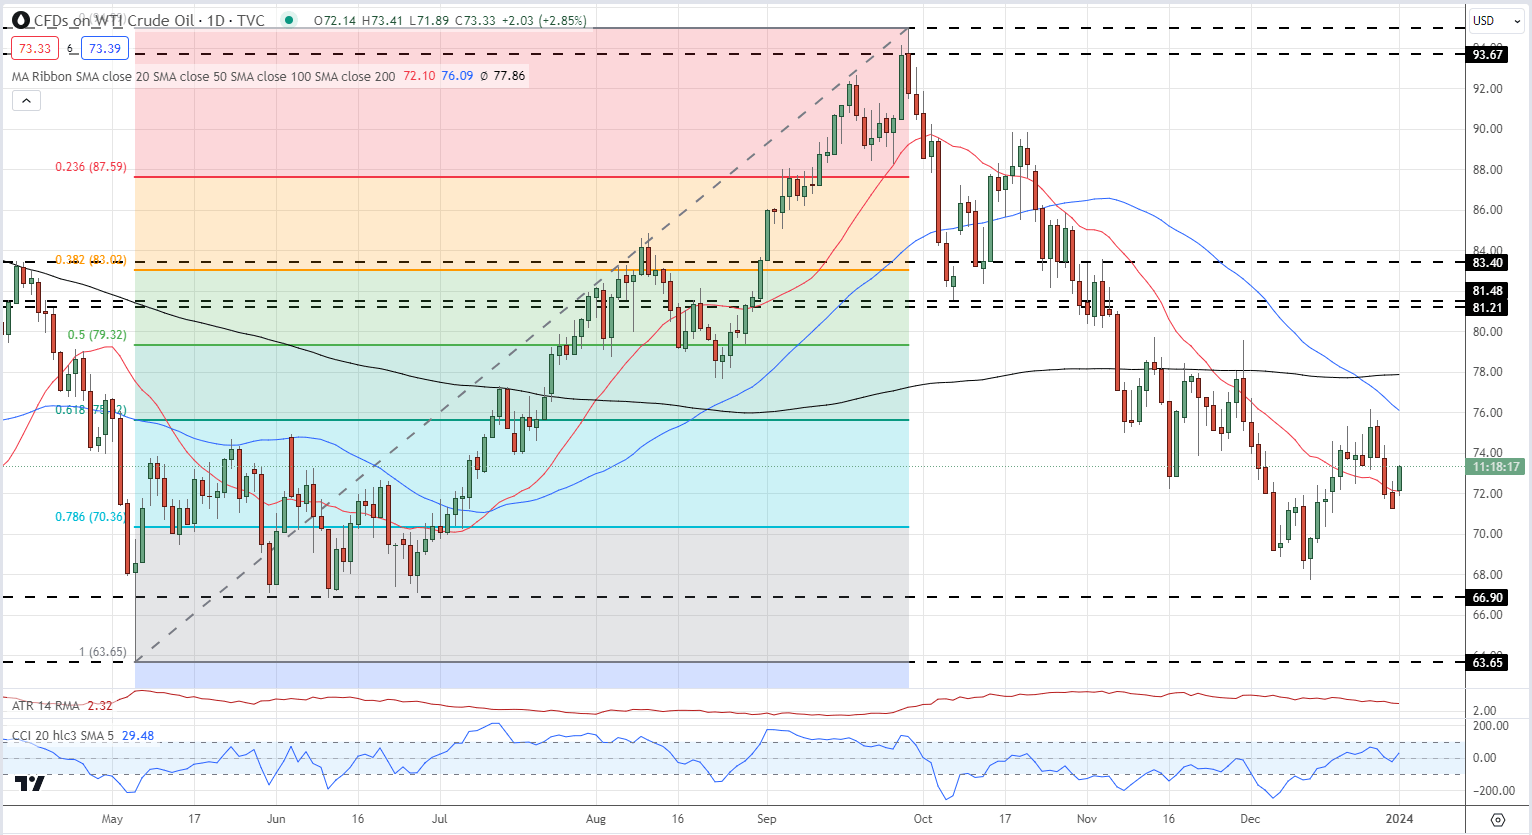
Oil is picking up a geopolitical bid after Iran sent a warship to the Red Sea yesterday, stoking tensions further. The Red Sea is the southern entrance to the Suez Canal, a vital shipping lane. According to a Politico article, some 7 to 10 percent of the world’s oil and eight percent of LNG pass through these waters.

Oil is pushing higher today, after pushing lower at the end of December. The daily chart looks mixed with a print below $67.74/bbl. needed to keep a series of lower lows intact, while the current spot price ($73/bbl.) is using the 20-dsma as current support. A bearish 50-/200-dsma crossover was made on December 22nd. Initial support off the 78.6% Fibonacci retracement at $70.36/bbl. before a triple low of around $67/bbl. comes into play.

US Oil Daily Chart

image2.png

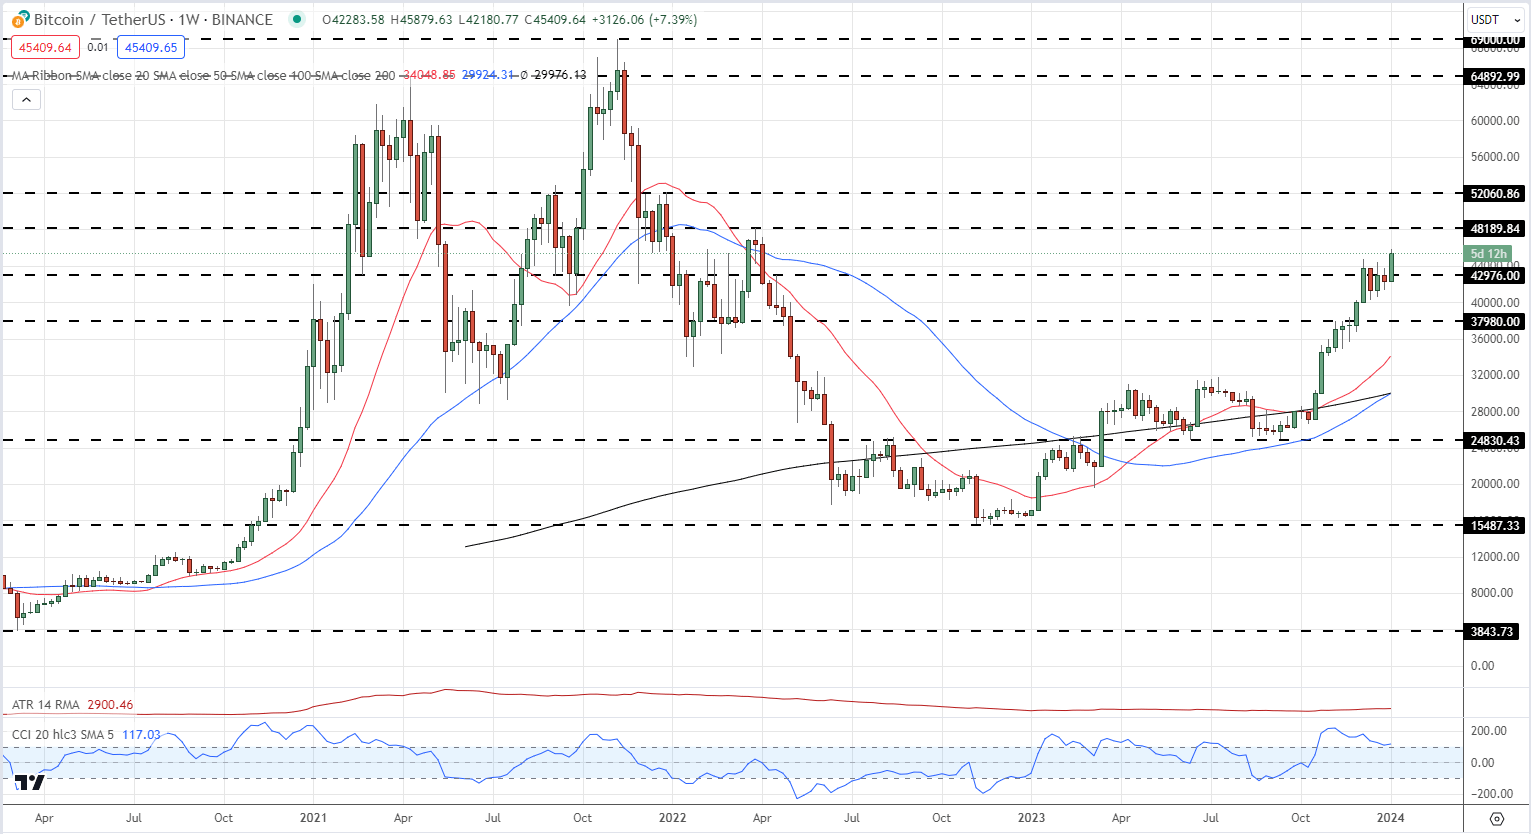
Bitcoin rallied strongly last year and is continuing to push higher in 2024. Growing expectations of SEC approval for a raft of spot Bitcoin ETF and longer-term traders setting up ahead of the next Bitcoin halving in April have underpinned the rally and pushed Bitcoin to its highest level since April last year.

The weekly chart shows the next level of resistance just under $48.2k before the December 2021 triple top around $52k comes into play.

Bitcoin Weekly Chart

image3.png

US Dollar (DXY) Latest: Jobs Data, FOMC Minutes Set to Drive EUR/USD and GBP/USD

US Dollar (DXY) Latest: Jobs Data, FOMC Minutes Set to Drive EUR/USD and GBP/USD

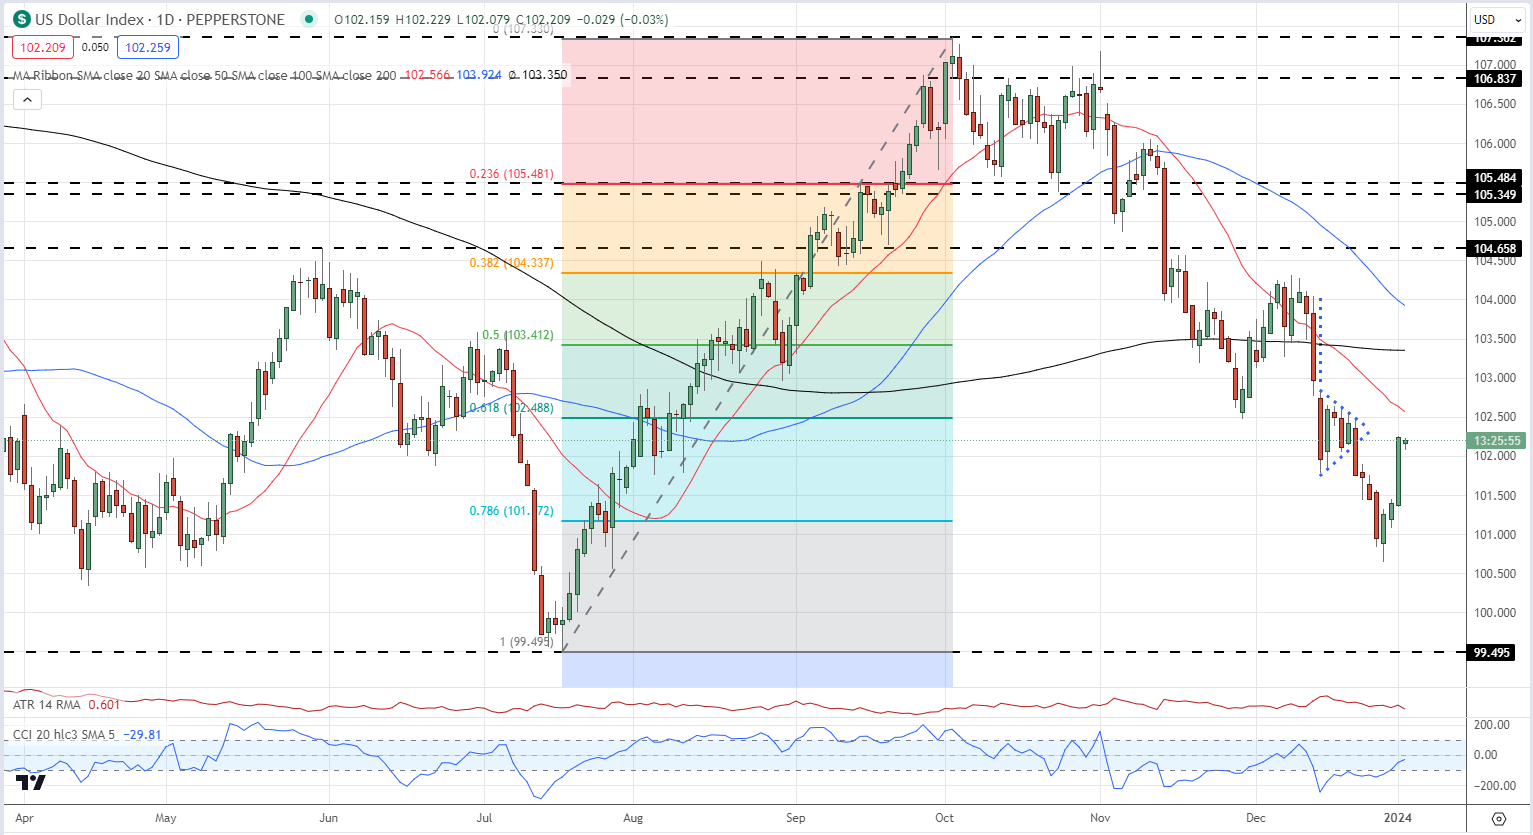
The US dollar is keeping hold of most of Tuesday’s gains as expectations of an aggressive series of US rate cuts are pared back. Going into the end of 2023, CME Fed Fund probabilities at one stage showed markets expecting 175 basis points of rate cuts this year with the first move seen in March. This has now been reduced by a quarter of a point to 150 basis points of cuts. The late-December dovish tone was fuelled by Fed Chair Powell at the last FOMC meeting and today’s release of the minutes of this meeting may show that the market’s interpretation of Chair Powell’s remarks may have been misplaced.

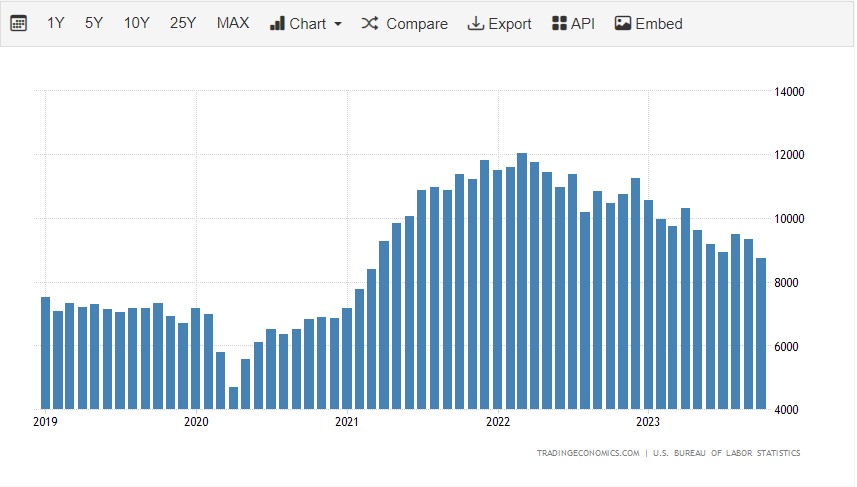
Later in today’s session, we have the first of three US jobs reports this week with the November JOLTS job openings release at 15:00 UK. Job openings have fallen steadily over the last two years, and are expected to fall further today, tightening labor market conditions.

image1.png

On Thursday the December ADP report is released at 13:15 UK, while on Friday the latest US NFP report is released at 13:30 UK.

Tuesday’s tightening of rate expectations forced US bond yields higher, giving the US dollar a boost. The US dollar index (DXY) popped sharply higher and is now close to negating the recent bearish pennant pattern seen at the end of December last year. The DXY chart remains bearish overall but a short period of consolidation around these levels cannot be discounted.

US Dollar Index Daily Chart

image2.png

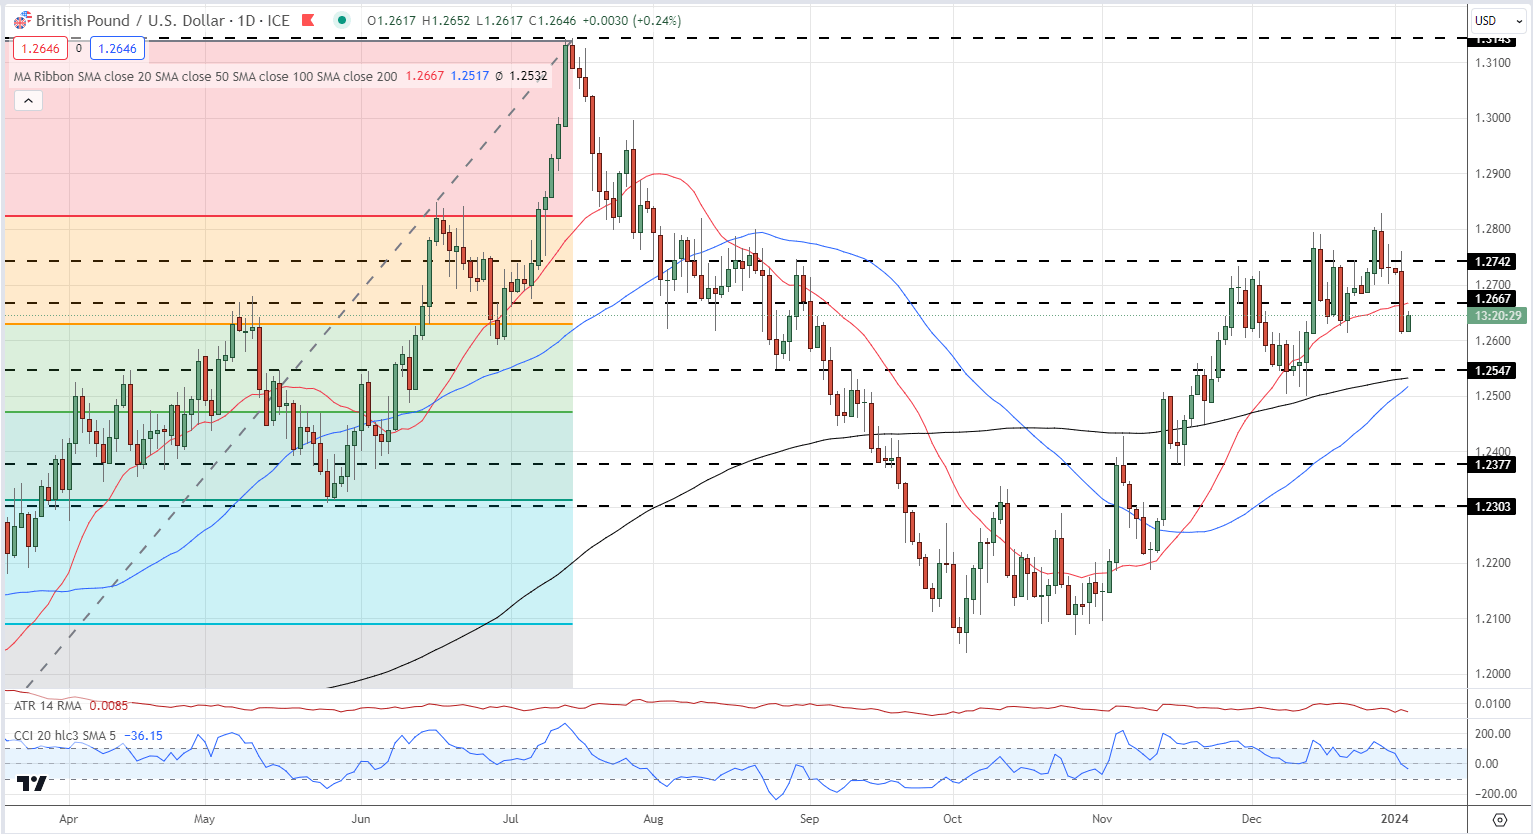
The recent bout of US dollar strength has put the brakes on cable’s multi-month rally. After touching a five-month high of 1.2828 on December 28th, the pair are now eyeing 1.2600. A clean break below the 38.2% Fibonacci retracement level at 1.2628 will see 1.2600 tested before the 200- and 50-day simple moving averages at 1.2532 and 1.2517 respectively come into play.

GBP/USD Daily Chart

image3.png

IG retail trader data shows 57.98% of traders are net-long with the ratio of traders long to short at 1.38 to 1.The number of traders net-long is 32.60% higher than yesterday and 30.90% higher from last week, while the number of traders net-short is 10.10% lower than yesterday and 19.98% lower from last week.

We typically take a contrarian view to crowd sentiment, and the fact traders are net-long suggests GBP/USD prices may continue to fall.

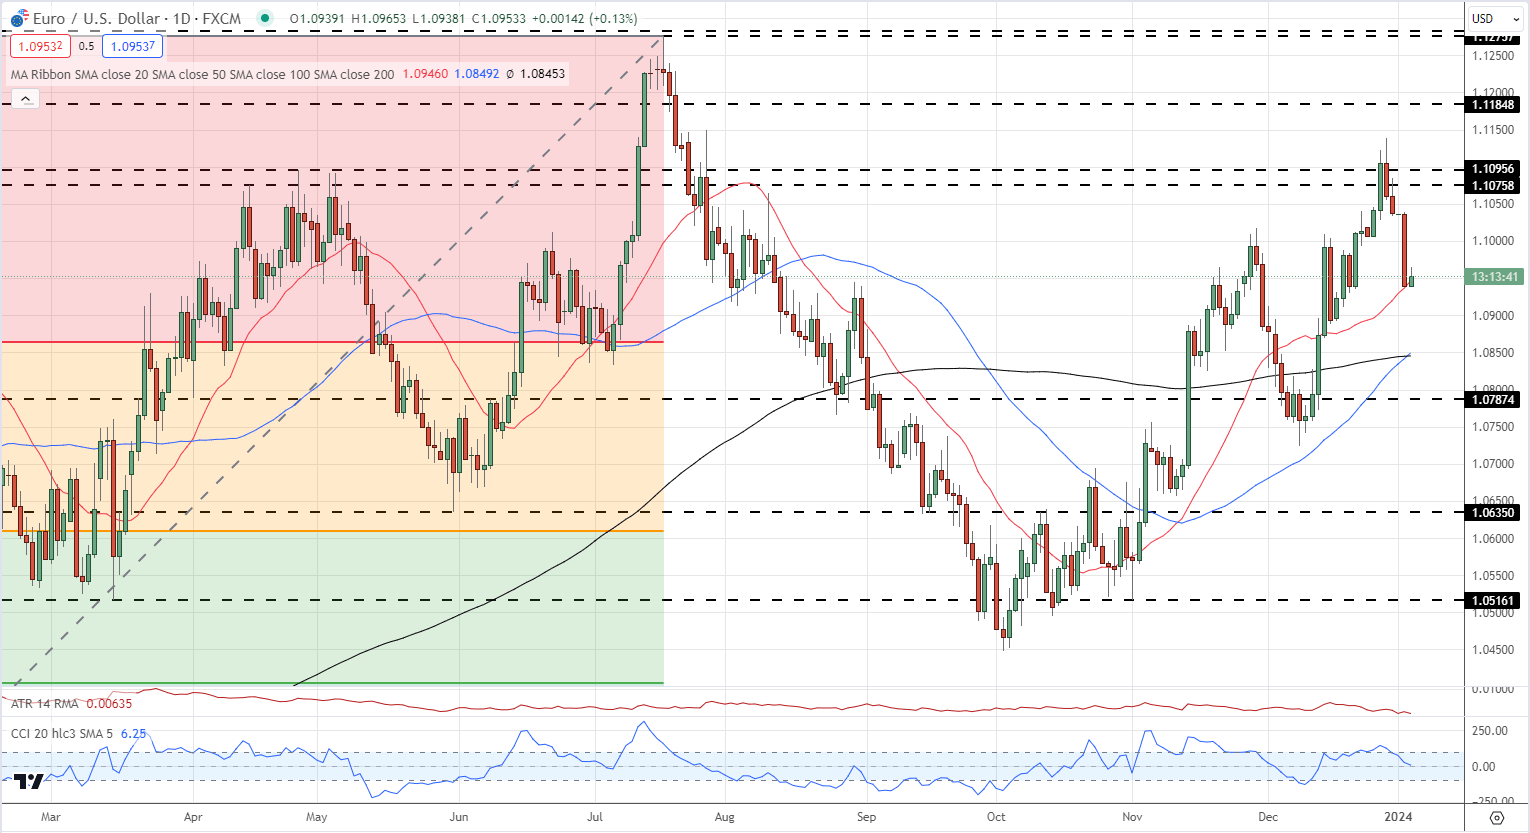
EUR/USD has lost two big figures since the late December high print of 1.1193 but remains in an uptrend for now. The first level of support is seen off the 23.6% Fibonacci retracement at 1.08645, followed closely by the 50- and 200-day simple moving averages at 1.0849 and 1.0845.

EUR/USD Daily Chart

image4.png

Gold Trading: Three Top Tips for Trading Gold

Gold Trading: Three Top Tips for Trading Gold

Gold Trading Tips

Few markets on Earth have the historical appeal and attraction as Gold. While traders have numerous trading options today, in a number of different currencies or asset classes or geographies, Gold has been a long-standing store of value that’s piqued speculators’ interest for about as long as human beings have traded with each other.

We previously looked at some of the basics around Gold trading in the What is Gold article a little earlier in this sub-module. And we also have a ‘How to Trade Gold’ article on the Gold page of DailyFX. But, in this article, we’re going to get a bit more granular as we investigate Gold Trading Strategies, Tips and Tactics.

Gold Trading Tips

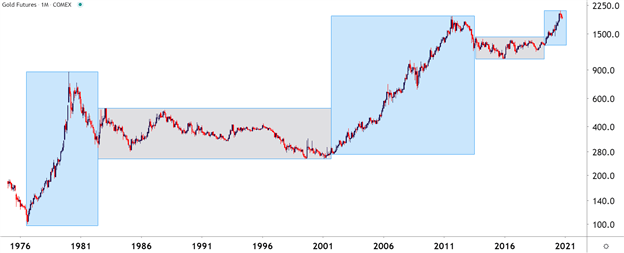
Probably one of the more obvious aspects of Gold, particularly on a longer-term basis, is the cycle sensitivity that will often show around the metal – and this isn’t a new phenomenon. As markets themselves are cyclical animals, Gold often moves to a similar type of tune, although timing may be differentiated from other markets at the time. Looking at Gold prices over the past 45 years, and this becomes a bit more clear. On the below chart, trends and ranges have been identified by blue or grey boxes, and that leads us into tip number one:

Gold Trading Tip #1: Adapt to the Present Condition

The key takeaway here is the importance of adaptation: Because if a trend trader approaches Gold with their typical approach while Gold markets are in a range, there’s high odds they could see unfavorable results. If Gold markets are mean-reverting and range-bound, the trader would likely want to approach the matter with a range-based approach. But, when Gold markets are trending, such as the case from 2001-2011 or 1976-1980, then traders are going to want to utilize trend strategies to adapt to the present condition.

Gold Futures Monthly Chart
Gold Trading Tip #2: Watch the US Dollar

The US Dollar is traded in a number of markets but, in the largest venues, Gold is traded in US Dollars. As a matter of fact, one common equation on CFD platforms presents a quote for Gold prices as ‘XAU/USD.’ The chemical symbol for Gold on the periodic table of elements is ‘AU’ and the denominator in that quote is the US Dollar, highlighting how Gold is being priced in terms of US Dollars.

This also means that, all factors held equal, and if Gold made no move at all but the US Dollar increased in value – the price of Gold could go down. Because in the function above, the value of the denominator, or USD, would increase in value thereby decreasing the value of the function as a whole.

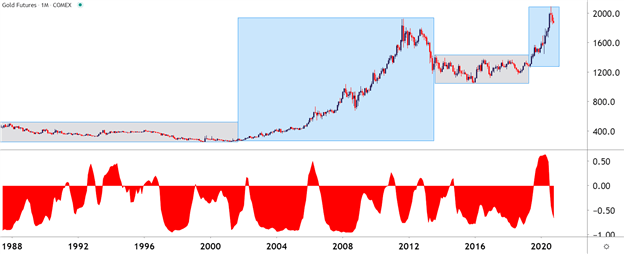
So, there could be a tendency for Gold to display an inverse correlation with the US Dollar. This isn’t all of the time, there are scenarios where both Gold and the Dollar may increase in value although those are somewhat rare, historically speaking.

On the below chart, that correlation is highlighted in the bottom portion of the image. Reads or values above the zero line indicate positive correlation which, again, is somewhat rare but not unheard of. Reads below zero highlight inverse correlation, with a value of -1 highlighting a perfect inverse relationship.

Gold Monthly Price Chart: An Inverse Relationship with the US Dollar
Gold Trading Tip #3: Know Your Time Frames

On the above charts we’re looking at the bigger picture behind Gold prices using the Monthly variety. But these conditions and market changes can take place on shorter-terms, as well, and it’s key for traders to have some type of consistent framework for their analysis so that they can properly implement their strategies in the ways that they want.

As we looked at in the multiple time frames article, traders should analyze markets from more than a single vantage point. The above monthly variety can be helpful to see the bigger picture – but for actually setting up trades and implementing strategies, traders will likely want to look to shorter time frames.

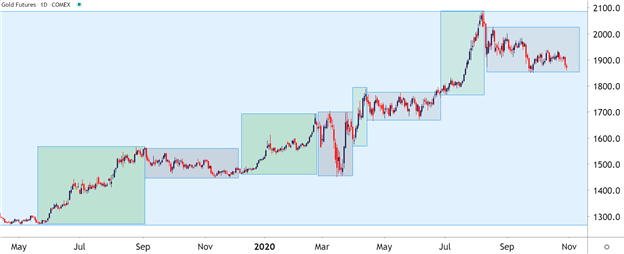
In the above graphic, the blue box on the right side of the chart shows a trend that’s been going for a little over two years now. But, looking at the shorter-term daily chart below to get a more granular look at that two-year-outlay shows that Gold prices were not trending the entire time. As a matter of fact, the same type of trend-range-trend-range relationship presented itself inside of this longer-term trend.

This is again important for traders when setting up strategy because for those that are looking to trade a trend, waiting for the monthly chart to highlight that potential may be too late. On the below chart, that blue box has been expanded so we can take a more granular look at the trend; but this time, I’ve added green boxes around the shorter-term trends and grey boxes around the mean-reverting or range-bound periods.

Gold Daily Price Chart
Gold Trading Strategies

Perhaps more important than the specific strategy that one is using to analyze or set up trades in Gold is the ‘fit’ to that specific market condition. For instance, if we look at the above image and focus on the green boxes, when the short-term trend is moving in the direction of the longer-term trend, traders are going to want to follow the age-old adage of ‘buying low and selling high.’ In the grey portions, however, when prices are ranging, traders want to similarly buy low and sell high but they’re going to want to do that in a slightly different way; closing the entirety of the long position while ‘high’ and then looking at potentially getting short to play the other side of the range.

Right up front – this means that no trader is always going to be ‘right’ because conditions, similar to trends, will change; and its impossible to know that until after the fact. This is where items like trade and risk management come into play, potentially helping to mitigate the downside in those instances where something changes or shifts away from their expectations.

Simplifying Market Behaviors by Assigning ‘Conditions’

With any market, if you think about it, there’s really only a couple of things that prices might do: Trend or not. Either prices are trending in a directional move for some reason, or they’re not trending at all: And the transitory state between mean-reversion and trends are breakouts, which are technically a market condition, itself. So, in that effort of simplification, analysts can break down market conditions into three specific types:

  1. Trend – a directional move is showing and there’s often a fundamental reason for it as traders are bidding higher-highs and higher-lows (or selling lower-lows and lower-highs).
  2. Range/Mean-Reversion – devoid of a driver, prices will often display no trend, which can open the door for range-bound or mean-reversion strategies.
  3. Breakouts – this is what happens when new information gets priced-in, and this can create a breakout move from a range and into a new trend. That new trend may last for a while or it may merely propel price action into a new range.

Bespoke Approach for the Proper Condition

Knowing what state a market is in isn’t enough, as traders are usually going to want to cater their approach to that specific condition. For instance, a trader focusing on breakouts likely won’t be able to withstand as much excursion as a trader picking on range/mean reversion setups.


The MACD Histogram and How It Works as a Buy/Sell Signal

The MACD Histogram and How It Works as a Buy/Sell Signal

The MACD as a Lagging Indicator

The MACD is an indicator that uses exponential moving averages (EMA) to determine trend strength along with entry points based on crossovers.

Traders who use the MACD indicator often are critical of the fact that it may signal an entry after the initial move has begun and therefore leave pips behind. As such, many traders wanting to enter a trade sooner dismiss it as a “lagging” indicator.

A lagging indicator is a technical indicator that uses past price data to formulate the actions of the indicator itself. Therefore, all indicators are lagging since they are computed on trading data that has already taken place and then factored in with what is occurring.

In the case of the MACD indicator, the most widely suggested entry signal is when the MACD line crosses over the signal Line in the direction of the trend. Since these two lines are simply two moving averages, by their very nature the crossover will not occur until the move itself is under way. Some traders prefer this method of suggested entry as it offers more confirmation that the move is more likely to continue in that direction however, the MACD histogram can offer an earlier signal to enter.

MACD Histogram: What does the Histogram Represent?

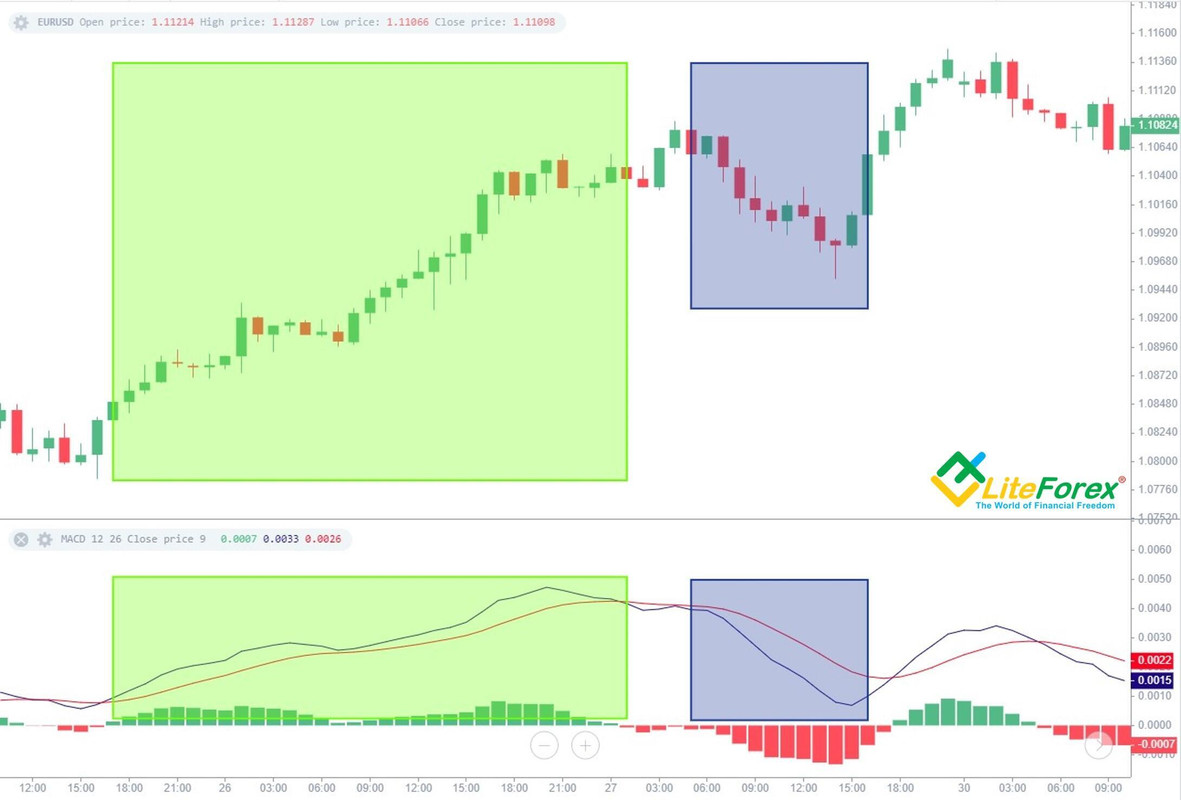
The histogram or “bar chart” included in the background of the MACD (see images below) displays the difference between the MACD and signal line. When the MACD is above the signal line, the bar is positive. When the MACD is below the signal line, the bar is negative. The actual height of the bar is the difference between the MACD and signal line itself.

MACD histogram:

MACD histogram formulaFor more aggressive traders who are not interested in the additional confirmation and are simply looking for a possible early entry, they may prefer this less widely used suggestive entry signal based on the MACD histogram bars. This is because the histogram bars have a faster setting (9) than either the MACD line or the signal line, resulting in a timelier trigger – see MACD crossover vs MACD histogram below.

MACD crossover vs MACD histogram:

MACD histogram buy sell signal

Using MACD histograms to identify bullish/bearish biases

The first point of analysis would be to pursue the MACD histogram as it moves away from the zero line (both positive or negative) – track it as its bars grow larger. The actual signal comes when the histogram no longer increases in height and produces a smaller bar. Once the histogram prints a smaller bar, traders look to enter in the direction of the histogram’s decline.

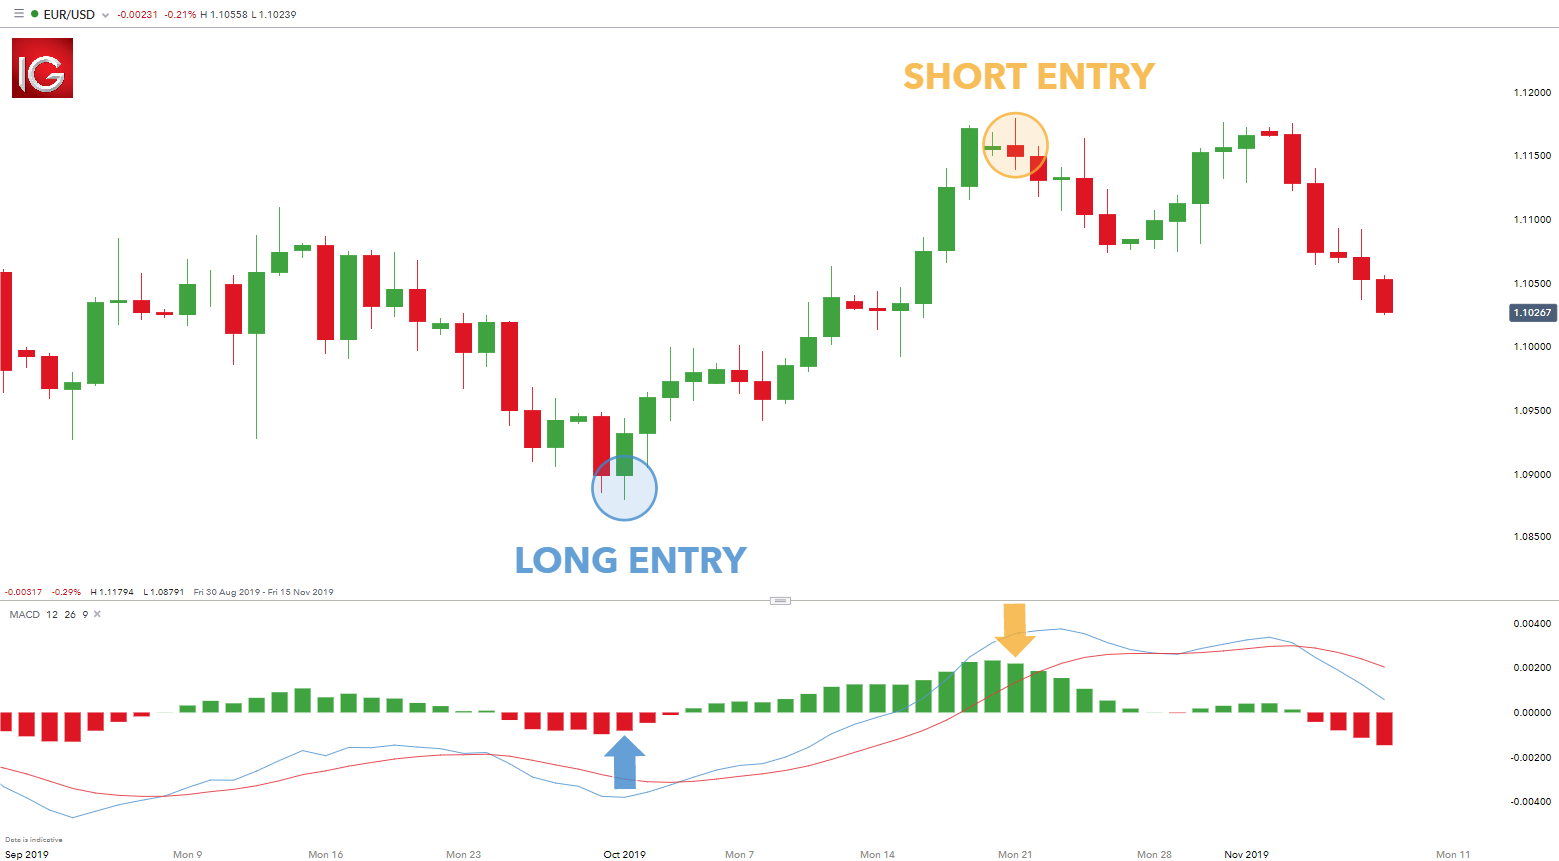
The suggestive buy signal on the left (blue) was created by five swelling red bars in a row followed by a fifth bar that closed smaller. Two bars later, the MACD line crosses above the signal line which is a traditional MACD signal. This later signal would have missed most of the move to the upside that the histogram signal would have caught.

The suggestive sell signal on the right (yellow) is a similar story. We saw fourteen bars growing consecutively until a contracted 15th bar was formed. This buy trade came several bars before the MACD/signal line cross.

EUR/USD MACD histogram buy sell signal:

MACD histogram buy sell signal

The MACD as a Lagging Indicator

The MACD is an indicator that uses exponential moving averages (EMA) to determine trend strength along with entry points based on crossovers.

Traders who use the MACD indicator often are critical of the fact that it may signal an entry after the initial move has begun and therefore leave pips behind. As such, many traders wanting to enter a trade sooner dismiss it as a “lagging” indicator.

A lagging indicator is a technical indicator that uses past price data to formulate the actions of the indicator itself. Therefore, all indicators are lagging since they are computed on trading data that has already taken place and then factored in with what is occurring.

In the case of the MACD indicator, the most widely suggested entry signal is when the MACD line crosses over the signal Line in the direction of the trend. Since these two lines are simply two moving averages, by their very nature the crossover will not occur until the move itself is under way. Some traders prefer this method of suggested entry as it offers more confirmation that the move is more likely to continue in that direction however, the MACD histogram can offer an earlier signal to enter.

How to Trade the "One Glance" Indicator, Ichimoku

How to Trade the "One Glance" Indicator, Ichimoku
Recommended by Warren Venketas
How to Trade the “One Glance” Indicator, Ichimoku
Get My Guide

MACD Histogram: What does the Histogram Represent?

The histogram or “bar chart” included in the background of the MACD (see images below) displays the difference between the MACD and signal line. When the MACD is above the signal line, the bar is positive. When the MACD is below the signal line, the bar is negative. The actual height of the bar is the difference between the MACD and signal line itself.

MACD histogram:

MACD histogram formulaFor more aggressive traders who are not interested in the additional confirmation and are simply looking for a possible early entry, they may prefer this less widely used suggestive entry signal based on the MACD histogram bars. This is because the histogram bars have a faster setting (9) than either the MACD line or the signal line, resulting in a timelier trigger – see MACD crossover vs MACD histogram below.

MACD crossover vs MACD histogram:

MACD histogram buy sell signal

Traits of Successful Traders

Traits of Successful Traders
Recommended by Warren Venketas
Traits of Successful Traders
Get My Guide

Using MACD histograms to identify bullish/bearish biases

The first point of analysis would be to pursue the MACD histogram as it moves away from the zero line (both positive or negative) – track it as its bars grow larger. The actual signal comes when the histogram no longer increases in height and produces a smaller bar. Once the histogram prints a smaller bar, traders look to enter in the direction of the histogram’s decline.

The suggestive buy signal on the left (blue) was created by five swelling red bars in a row followed by a fifth bar that closed smaller. Two bars later, the MACD line crosses above the signal line which is a traditional MACD signal. This later signal would have missed most of the move to the upside that the histogram signal would have caught.

The suggestive sell signal on the right (yellow) is a similar story. We saw fourteen bars growing consecutively until a contracted 15th bar was formed. This buy trade came several bars before the MACD/signal line cross.

EUR/USD MACD histogram buy sell signal:

MACD histogram buy sell signal

A Guide to Support and Resistance Trading

A Guide to Support and Resistance Trading

What’s on this page
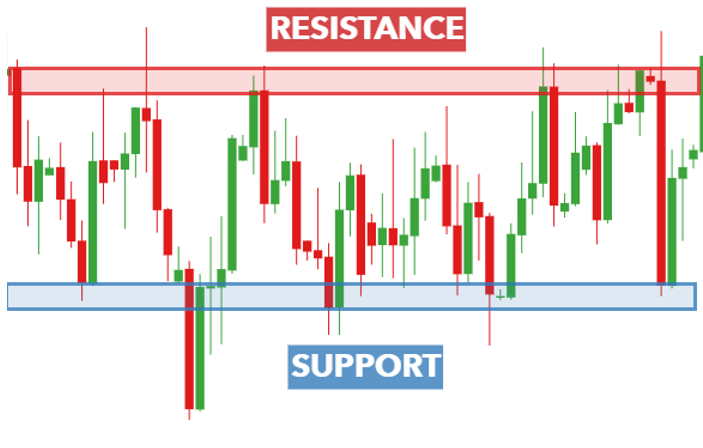
Price bouncing between support and resistance

Learn how to trade using support and resistance levels

Support and resistance is a powerful pillar in trading and most strategies have some type of support/resistance (S/R) analysis built into them. Support and resistance tends to develop around key areas that price has regularly approached and rebounded thereafter. This article explains what support and resistance is and covers top support and resistance trading strategies.

What is Support and Resistance?

Support and resistance is one of the most widely followed technical analysis techniques in the financial markets. It is a simple method to analyze a chart quickly to determine three points of interest to a trader:

  • The direction of the market
  • Timing an entry in the market
  • Establishing points to exit the market at either a profit of loss

If a trader can answer the three items above, then they essentially have a trading idea. Identifying levels of support and resistance on a chart can answer those questions for the trader.

Support

Support is an area on a chart that price has dropped to but struggled to break below. The diagram above shows how price drops down to the area of support and subsequently ‘bounces’ sharply from this level.

In theory, support is the price level at which demand (buying power) is strong enough to prevent the price from declining further. The rationale is that, as the price gets closer and closer to support, and becomes cheaper in the process, buyers see a better deal, and are more likely to buy. Sellers become less likely to sell, since they are getting a worse deal. In that scenario, demand (buyers) will overcome supply (sellers) and that will prohibit price from falling below support.

Resistance

Resistance is an area on a chart that price has risen to but struggled to break above. The diagram above shows how price rises up to the area of resistance and subsequently “bounces” sharply from this level.

Resistance is the price level at which supply (selling power) is strong enough to prevent the price from rising further. The rationale behind this is that as the price gets closer and closer to resistance, and becomes more expensive in the process, sellers are more likely to sell and buyers become less likely to buy. In that scenario, supply (sellers) will overcome demand (buyers) and that will prohibit price from going above resistance.

For a comprehensive guide, read our page on Forex Support and Resistance Explained.

Top 4 Support and Resistance Trading Strategies

Below are four top strategies for trading with support and resistance:

1) Range trading

Range trading takes place in the space between the support and resistance as traders aim to buy at support and sell at resistance. Think of the area between support and resistance as being a room. Support is the floor and resistance the ceiling. Ranges tend to appear in sideways trading markets where there is no clear indication of a trend.

Pro Tip – Levels of support and resistance are not always perfect lines. Sometimes price will bounce off a particular area, rather than a perfect straight line.

Traders need to identify a trading range and therefore, need to identify areas of support and resistance. The area of support and resistance can be identified and is shown in the chart below:

EURUSD support and resistance when trading in a rangeWhen the market is range-bound, traders tend to look for long entries when price bounces off support and short entries when price bounces off resistance.

It is clear to see that price has not always respected the bounds of support and resistance which is why traders should consider setting stops below support when long, and above resistance when going short.

When price does break out of the defined range, this can either be due to a breakout or a false breakout, also known as a “fakeout”. It is essential to adopt sound risk management to limit downside risk when markets breakout of the trading range.

2) Breakout strategy (pullback)

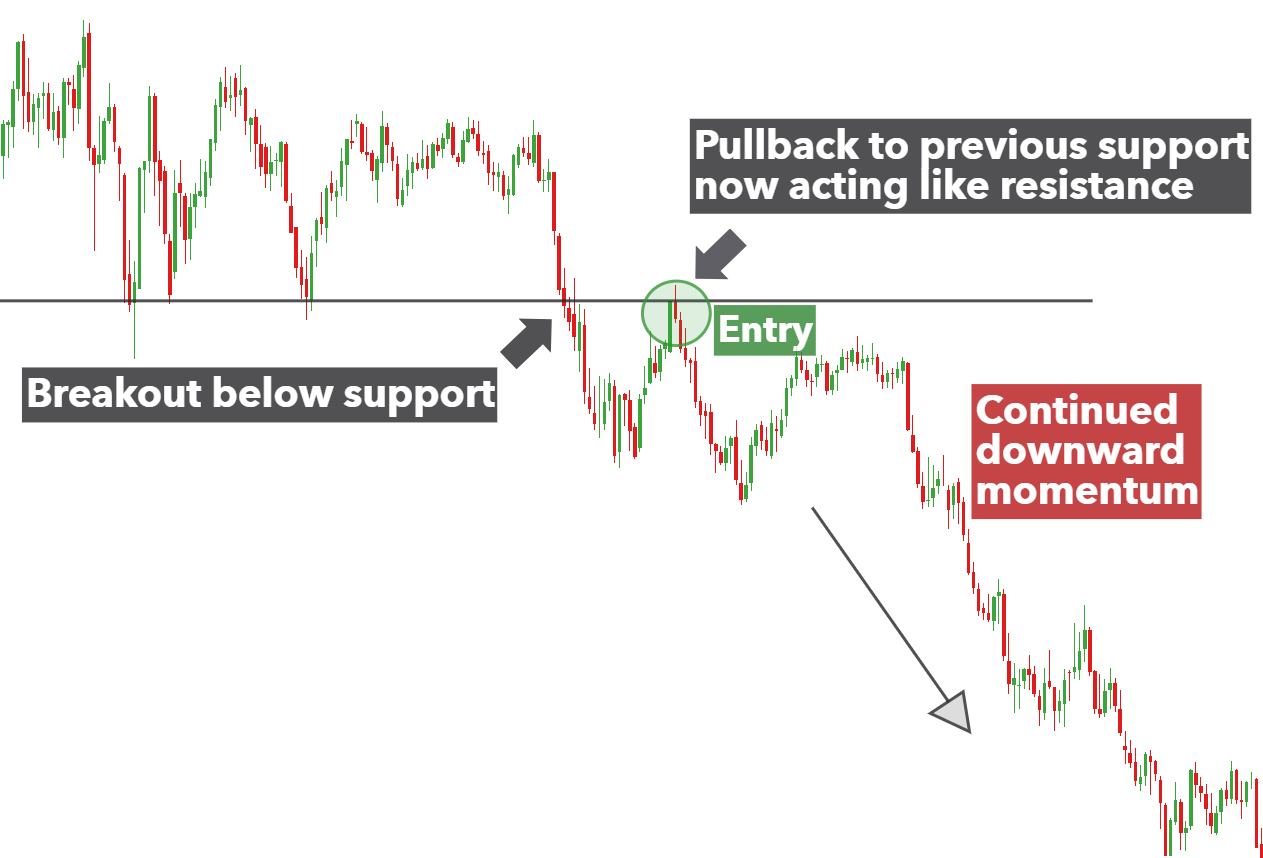
It is often the case that after a period of directional uncertainty that price will breakout and begin trending. Traders often look for such breakouts below support or above resistance in order to capitalize on further increasing momentum in one direction. If this momentum is strong enough it will have the potential to start a new trend.

However, in an attempt to avoid falling into the trap of trading the false breakout, top traders tend to wait for a pullback (towards support or resistance) before committing to a trade.

For example, the chart below shows a strong level of support before sellers pushed the price down below support. Many traders might get carried away and rush to place a short trade prematurely. Instead, traders should wait for the response in the market (buyers attempting to gain control) to break down before executing a short trade.

In the below scenario, traders should wait for the market to continue moving down, after the pullback, before looking for entry points.

AUDUSD pullback towards support3) Trendline strategy

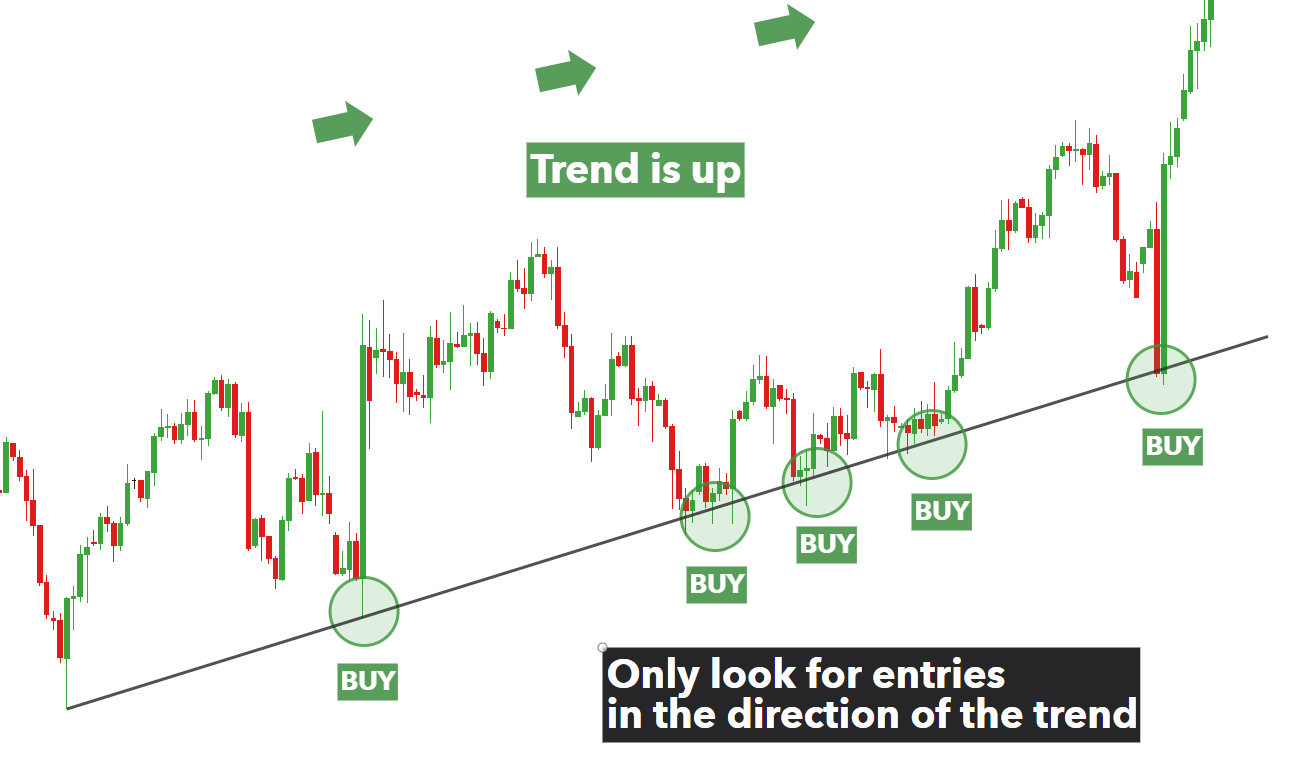
The trendline strategy utilizes the trendline as either support or resistance. Simply draw a line connecting two or more highs in a downtrend, or two or more lows in an uptrend. In a strong trend, price will bounce off the trendline and continue to move in the direction of the trend. Therefore, traders should only be looking for entries in the direction of the trend for higher probability trades.

using trendline as support in US dollar basket up trend.4) Using Moving averages as support and resistance

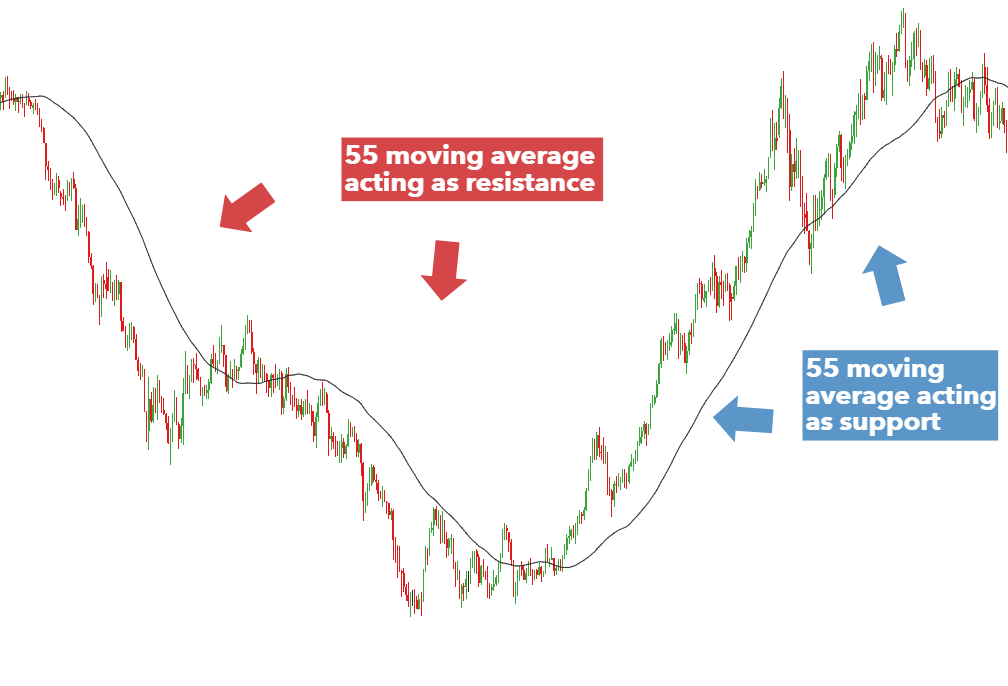
Moving averages can double up as dynamic support and resistance. Popular moving averages to include are the 20 and 50 period moving averages, which can be altered slightly to 21 and 55 period moving averages to make use of Fibonacci numbers. It is not uncommon for traders to incorporate the 100 and 200 MAs and ultimately, it is up to the trader to find a setting that they are comfortable with.

From the chart below, it is clear to see that the 55 MA initially tracks above the market as a line of resistance. The market then bottoms and reverses and the 55 MA then becomes the dynamic level of support. Traders can use these trendlines to make informed decisions about markets likely to continue trending and those susceptible to a breakout.

NZDUSD moving average acting as support and resistance

Support and Resistance Trading Key Takeaways

  • Support and resistance is a powerful pillar in trading and most strategies have some type of support/resistance analysis built into them.
  • Support and resistance strategies can either be based on price respecting these levels (range bound strategy) or anticipating the break of support and resistance (Breakout and pullback strategies).
  • Price will not respect support and resistance forever. Bearing this in mind, traders need to adopt sound risk management to limit losses if there is a breakout.