How to Trade with Long Wick Candles

How to Trade with Long Wick Candles

What are long wick candles?

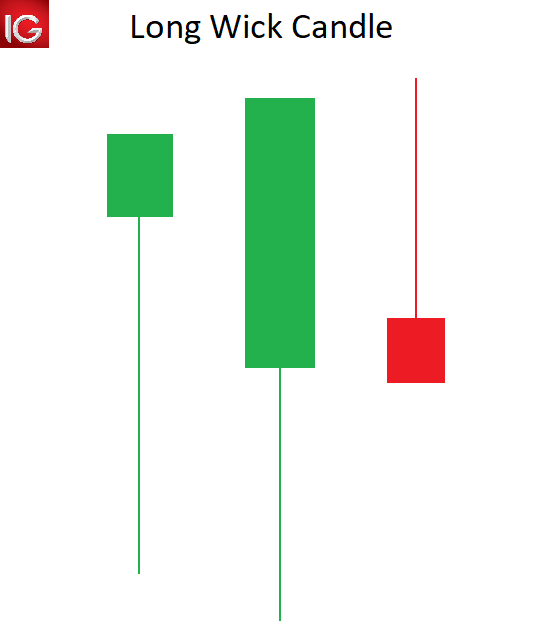
Long wick candles are type of candlestick that have a long wick attached to the candle body. The candle body can be positive or negative, making the long wick appropriate for any type of candlestick.

The length of the candle wick specifies the high and low of price movement within a designated time period. Understanding and trading candlestick wicks can provide forex traders with key tradeable opportunities.

long wicks candle

How to identify a long wick candle on forex charts

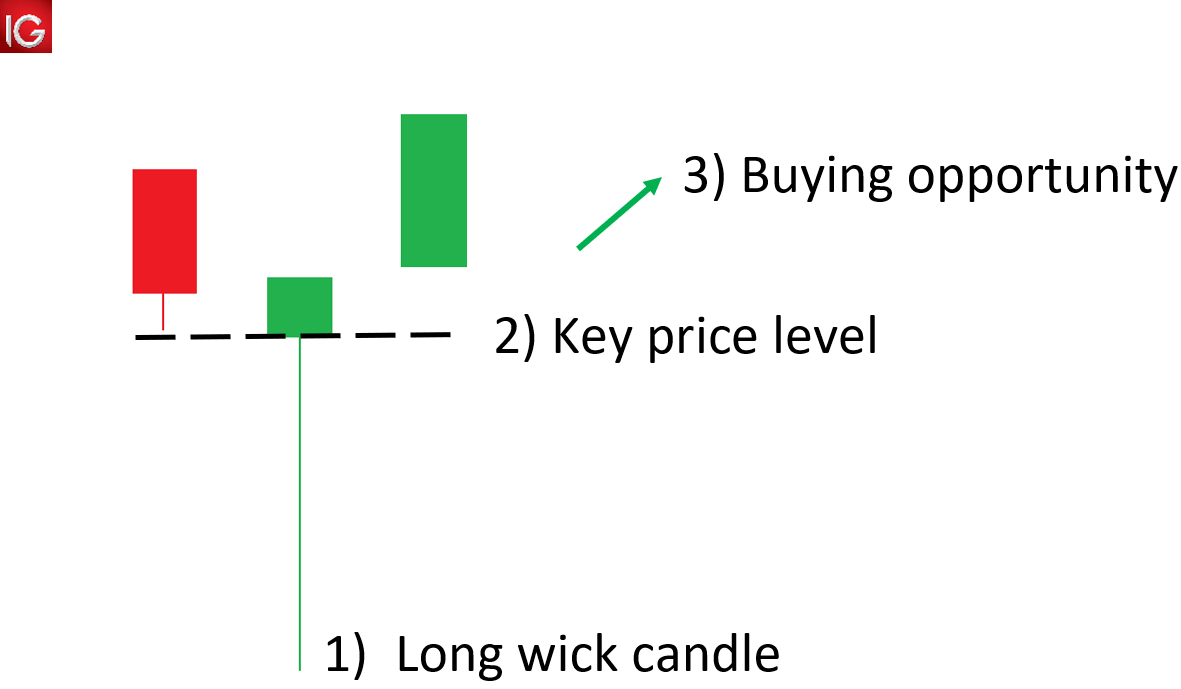
  1. Locate long wicks above/below a candle that is disproportionately longer than that of the surrounding wicks.
  2. Use price action to identify key price levels that may coincide with the long wick, signalling levels of support/resistance.
  3. Use the long wicks and key levels to detect potential trade opportunities.

identifying the long wick candle

What does a long wick indicate in forex?

A long wick candle, like shooting stars, gravestone Doji’s and hammers are part of a “family” of reversal candlesticks. Let’s explore an example:

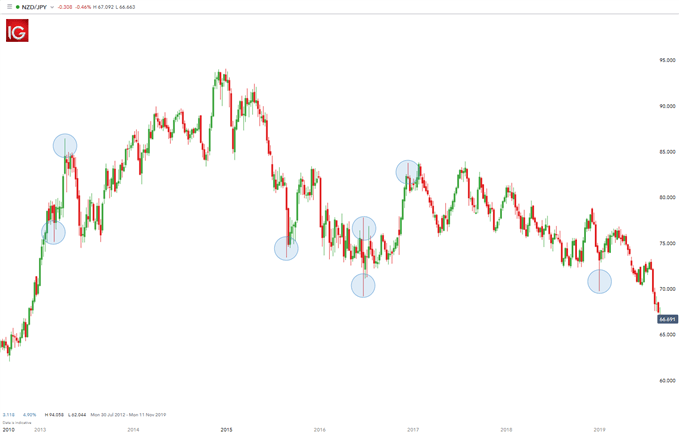
NZD/JPY Long Wick Candles

The chart below shows NZD/JPY on a weekly time frame. Highlighted in blue illustrates long candle wicks prior to a reversal in price movement. In other words, if the longer wick is below the body of the candle, price tends to move up.

Conversely, if the longer wick is above the body of the candle, price tends to move down. These extended wicks (those that are longer relative to other wicks on the chart) provide valuable information for the trader.

trading the long wick candle

A long wick that extends below a candle signifies that sellers were able to push the price down significantly. However, bulls were able to drive price back up showing buyers strength. Since bulls overpowered the selling pressure by bears, there exists the potential that their strength will carry forward leading to an upwards movement in price. The same principal would apply for long wicks appearing above the candle – in the opposite direction.

How can a trader use long wicks in their trading

The first step when utilizing long wicks is to identify the trend (as mentioned above). If the trend is down, seeing a candle (or several candles) with long wicks on the top points to a stronger potential for price to move down in the direction of the market.

Continuing with the downtrend example, if the pair retraces (moves against the trend) and stalls at a level of resistance or a Fibonacci level, traders will look for long wicks at the tops of the candles forming along that resistance line for two reasons:

  1. Those long wicks indicate the potential for the pair to trade to the downside back in the direction of the trend.
  2. The top of that extended wick provides a very prudent level for a trader to place their stop. The rationale for that stop placement being that buyers pushed price to the top of that wick but could not push it beyond that point. Hence, placing the stop just above that wick is a level that has a lower likelihood of getting hit.

There is often confusion amongst traders as to which time frame of chart this strategy can be applied to. For day traders, they may look at 5- or 10-min time frame charts. Swing traders on the other hand may look at other intraday charts like 2-hour or 4-hour charts.

Are you keen to learn about different trading strategies? Learn more about the top 8 forex trading strategies

Taking note of long wicks forming at levels of support or resistance, especially when they signal movement in the direction of the daily trend, can create a beneficial “edge” for the trader.

Advantages and Limitations of the Long Wick Candle

Advantages Limitations
Appears frequently in all financial markets Cannot be traded using the long wick candle in isolation
Long wicks are easy to identify Require supporting evidence to trade such as key price levels or indicators

Further reading on forex candlestick patterns

  1. Rising wedge and falling wedge patterns
  2. Head and shoulders
  3. Double top
  4. Double bottom
  5. Inside Bar
FTSE 100, CAC 40 and Nasdaq 100 Remain under Pressure​​​

FTSE 100, CAC 40 and Nasdaq 100 Remain under Pressure​​​

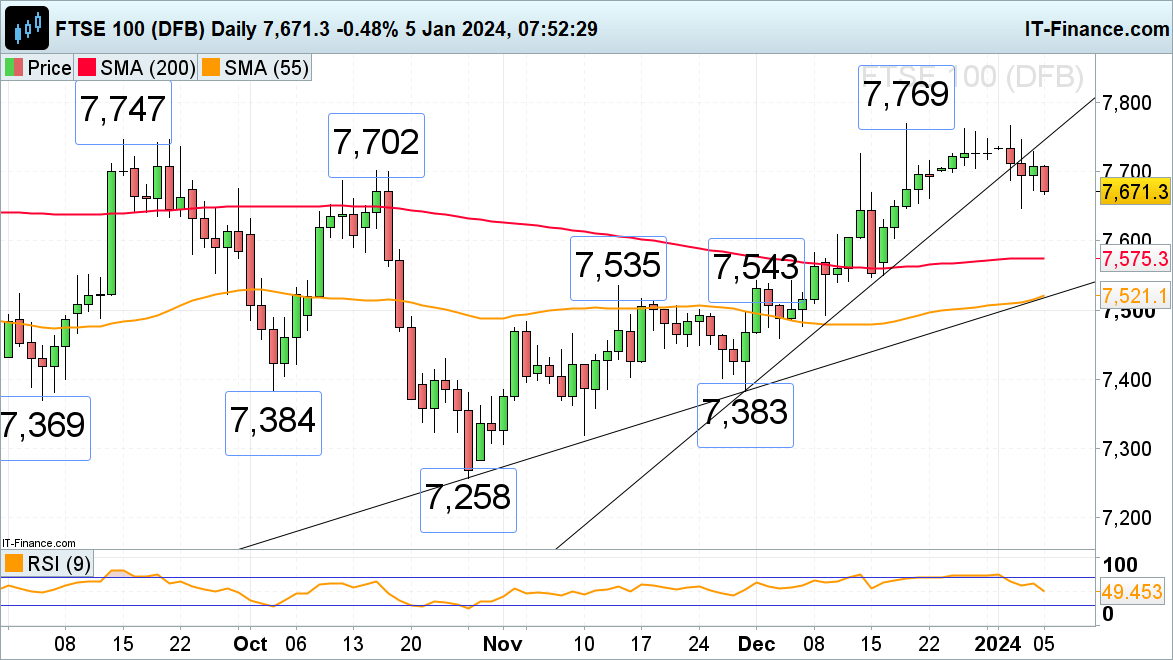
​The FTSE 100 continues to sell-off amid pared back rate cut expectations and despite UK house prices rising for the first time in eight months according to the Halifax. ​Wednesday’s low at 7,648 is thus back in sight, a fall through which could lead to the mid-October low at 7,584 being reached, together with the 200-day simple moving average (SMA) at 7,575.

​Immediate downside pressure should be maintained while Friday’s intraday high at 7,709 isn’t bettered. Above it lies resistance between the September and December highs at 7,747 to 7,769.

FTSE 100 Daily Chart

​CAC 40 drops towards this week’s low

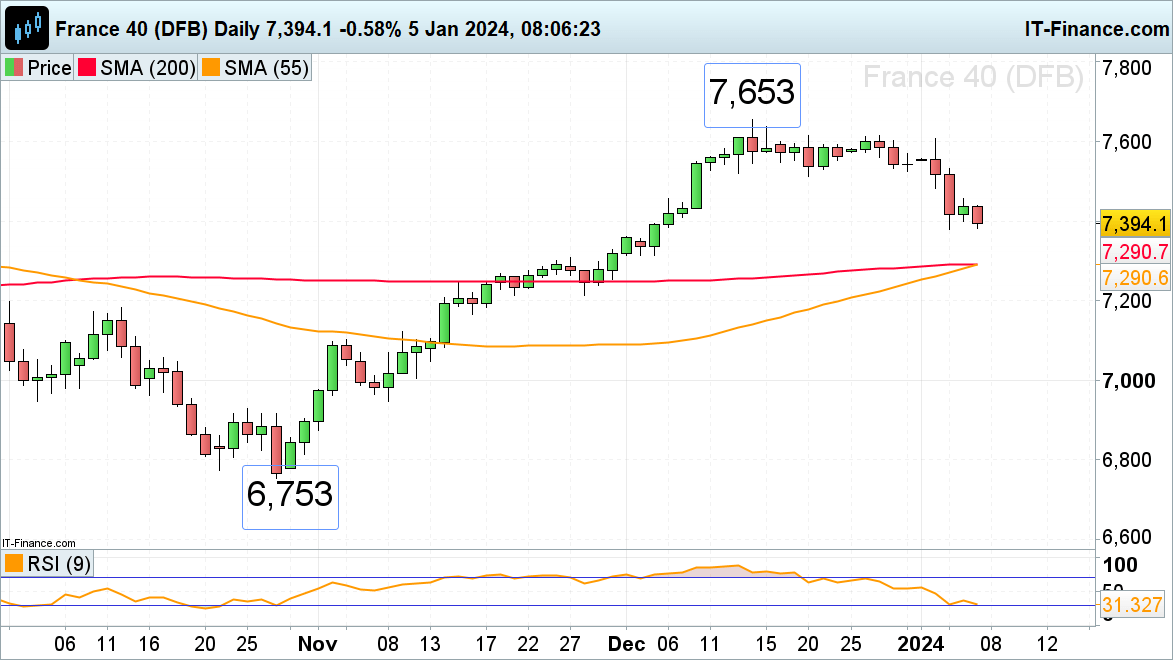
​The French CAC 40 stock index continues to slide amid general de-risking on pared back rate cut expectations and is about to fall through this week’s low at 7,380 ahead of the publication of today’s Eurozone inflation data.

​Were 7,380 to give way, the November high and 5 December low at 7,313 to 7,308 would be targeted. ​Minor resistance above Friday’s 7,438 intraday high sits at Thursday’s 7,456 high. This level would need to be exceeded for the next higher Tuesday low at 7,482 to be back in focus.

CAC 40 Daily Chart

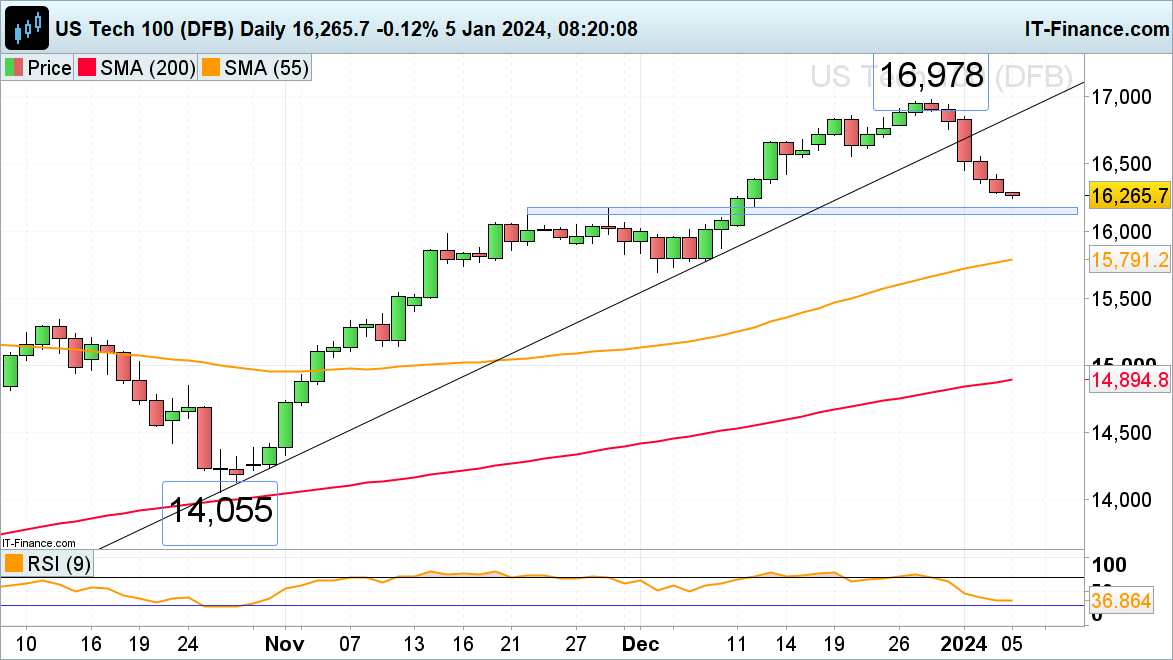
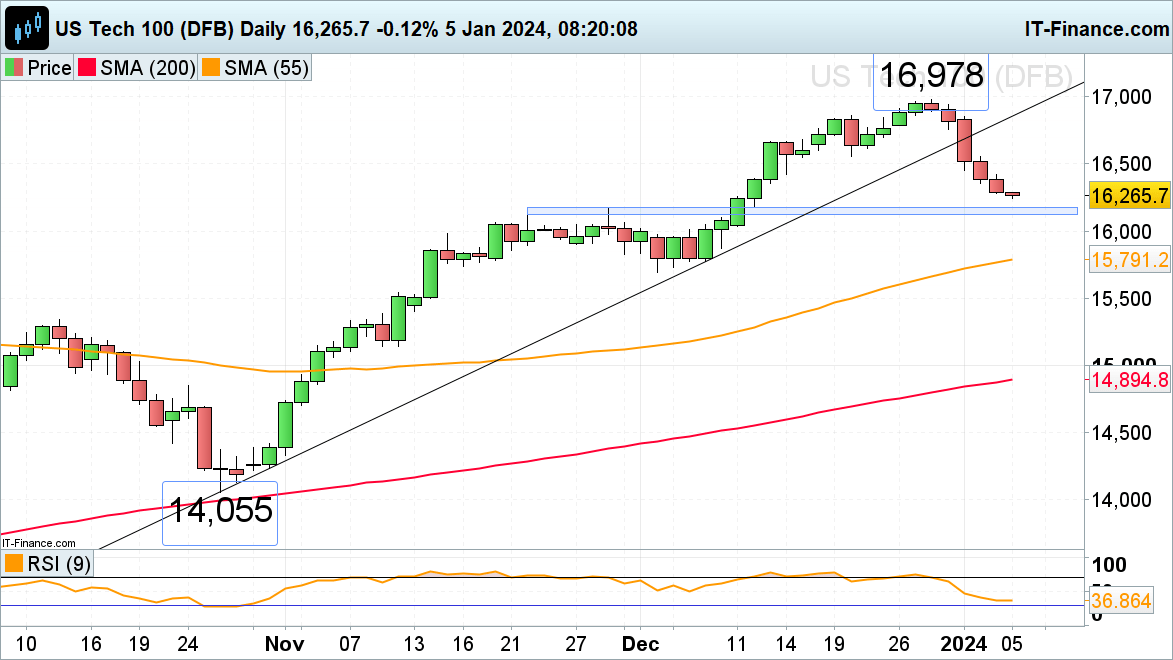
​​​The Nasdaq 100’s decline at the beginning of this year on lowered rate cut expectations and general risk-off sentiment due to heightened tensions in the Middle East led to five consecutive days of losses in the index, not seen since 2022.

​The November high at 16,167 represents the next downside target and, together with the 22 November high at 16,126, should offer at least interim support. ​Resistance above Wednesday’s 16,353 low sits between Tuesday’s low and Wednesday’s high at 16,450 to 16,555.

Nasdaq 100 Daily Chart

What is Gold? Understanding Gold as a Trader’s Commodity

What is Gold? Understanding Gold as a Trader’s Commodity

WHAT IS GOLD AND WHAT IS IT USED FOR?

Gold is a precious metal coveted throughout history for its vibrant color, malleability, and relative scarcity. It has industrial applications in electronics and computing, and is enduringly popular as a jewelry-manufacturing component. Gold has always been used as a monetary instrument, as well as a safe haven asset due to its tendency to retain or increase its value during periods of market turbulence.

HISTORY OF GOLD AS AN ASSET CLASS

For thousands of years, humans have placed a high premium on gold. It has represented the currency of some of the world’s most famed civilizations, such as the empires of Ancient Egypt and Rome. More recently, from the late 19th century up until the outbreak of World War One, the value of currencies have been anchored to a specific amount of gold.

Starting at the end of the World War Two, most of the planet’s largest economies operated within a financial system based on a set gold price, which was tied to the US Dollar. This only ended in 1971, when the US opted to stop aligning its dollar with the commodity.

While the precious metal no longer functions as an official currency, the gold price remains a highly influential element in financial markets and world economies.

WHAT AFFECTS GOLD PRICES?

The factors that affect gold prices include stability, supply and demand, central bank exposure, and volumes traded through ETFs.

Stability

As the bedrock financial instrument underlying global currencies, gold is considered a fairly secure asset. Its price tends to rise in times of turmoil, as governments and investors turn to it as a hedge against uncertainty. Inversely, gold prices usually drop in stable times, as riskier yet potentially more profitable avenues of investment become more viable.

Supply and demand

As with most assets on the open market, an excess of demand for gold (normally for jewelry-making, or manufacturing certain medical, industrial and technological products) drives up the gold price (assuming supply is constant). On the other hand, a weakening of demand often has the opposite effect on its value, sending the price lower (assuming supply is constant).

Central banks

Many of the world’s gold reserves are controlled by central banks within developed nations, in locations such as Europe and North America. As a result, these banks wield immense pricing power in global gold markets. If the banks suddenly increased or reduced their gold exposure at once, even slightly, this would have a magnified effect on the gold price. Central banks therefore rely on a joint (though unofficial) commitment to refrain from unilaterally engaging in large-scale gold sales that could destabilize global markets.

ETFs

While exchange traded funds are generally intended to mirror the gold price rather than influence it, many large ETFs hold a significant amount of physical gold. Therefore, the inflows and outflows from such ETFs can affect the metal’s price, by altering the physical supply and demand in the market.

HOW GOLD AFFECTS CURRENCIES

When it comes to gold’s relationship with currencies, its correlation with USD is a principal talking point as the US Dollar remains the benchmark pricing mechanism for gold. When the value of USD increases, gold becomes more expensive for other nations to purchase.

This ultimately causes demand to fall, which is why there’s generally an inverse relationship between the US Dollar and the gold price. Additionally, when the Dollar starts to lose its value, investors look to gold as a safe-haven alternative and this helps to push its price up.

GOLD PRICES OVERLAID AGAINST THE US DOLLAR

Relationship between Gold and the US Dollar

Also, the value of gold is linked to the value of a nation’s imports and exports. Countries that export gold or have access to gold reserves will see their currencies strengthen when gold prices rise, due to the value of the country’s total exports increasing.

HOW CAN GOLD BE TRADED?

There are a number of ways to trade gold, as explained in our in-depth guide to gold trading. It can be purchased as a physical asset, traded using futures and options in the commodities market, or traded through an exchange traded fund or ETF. For more information on each of these, click on the link above. For more information on each of these, click on the link above.

Reasons to trade gold

Traders might consider trading gold because:

  • As a safe haven in times of economic turbulence, when it tends to hold its value or appreciate
  • To capitalize on a weak US Dollar, and hedge against inflation
  • To maintain a diverse portfolio of commodities, stocks, bonds etc.

FURTHER READING ON GOLD AND COMMODITIES

Make sure you keep up to date with gold market projections by downloading our free quarterly Gold Forecast.

We also recommend reading our guide on trading the gold-silver ratio, which is useful for many traders looking to compare gold’s performance with that of silver. Weighing up whether to choose gold or cryptocurrencies? Read our Bitcoin vs Gold article.

Gold Price Latest: XAU/USD Seeks Guidance from US NFP Release

Gold Price Latest: XAU/USD Seeks Guidance from US NFP Release

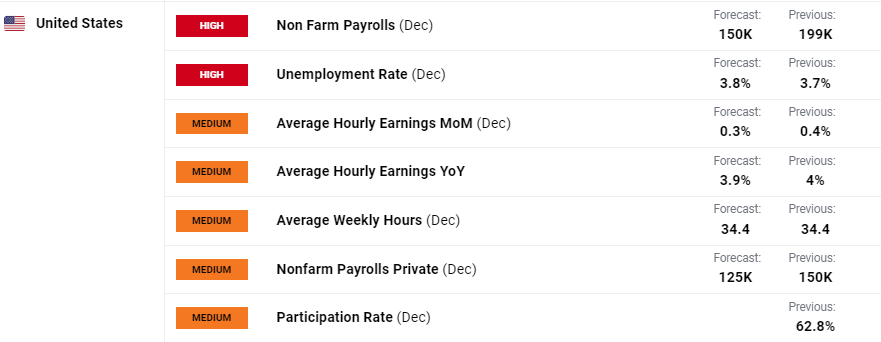
The monthly US Jobs Report hits the screens today at 13.30 UK with expectations of a further hiring slowdown in nonfarm payrolls. The survey, representing around 486k individual worksites provides detailed data on employment, hours, and earnings. Today’s survey is expected to show 150k new jobs added in December, while the unemployment rate is seen ticking 0.1% higher to 3.8%. The Federal Reserve actively monitors labor market conditions and today’s report will be closely watched as the US central bank mulls the timing of the first interest rate cut this year.

image1.png

The precious metal’s haven status may be buoyed in the coming days and weeks as global geopolitical risks increase. The ongoing Russia/Ukraine war shows no sign of slowing down, tensions between China and Taiwan remain heightened, Israel’s military action in the Gaza Strip continues, while major shipping chokepoints in the Red Sea disrupt global supply chains daily. An increase in any of these conflicts will underpin gold.

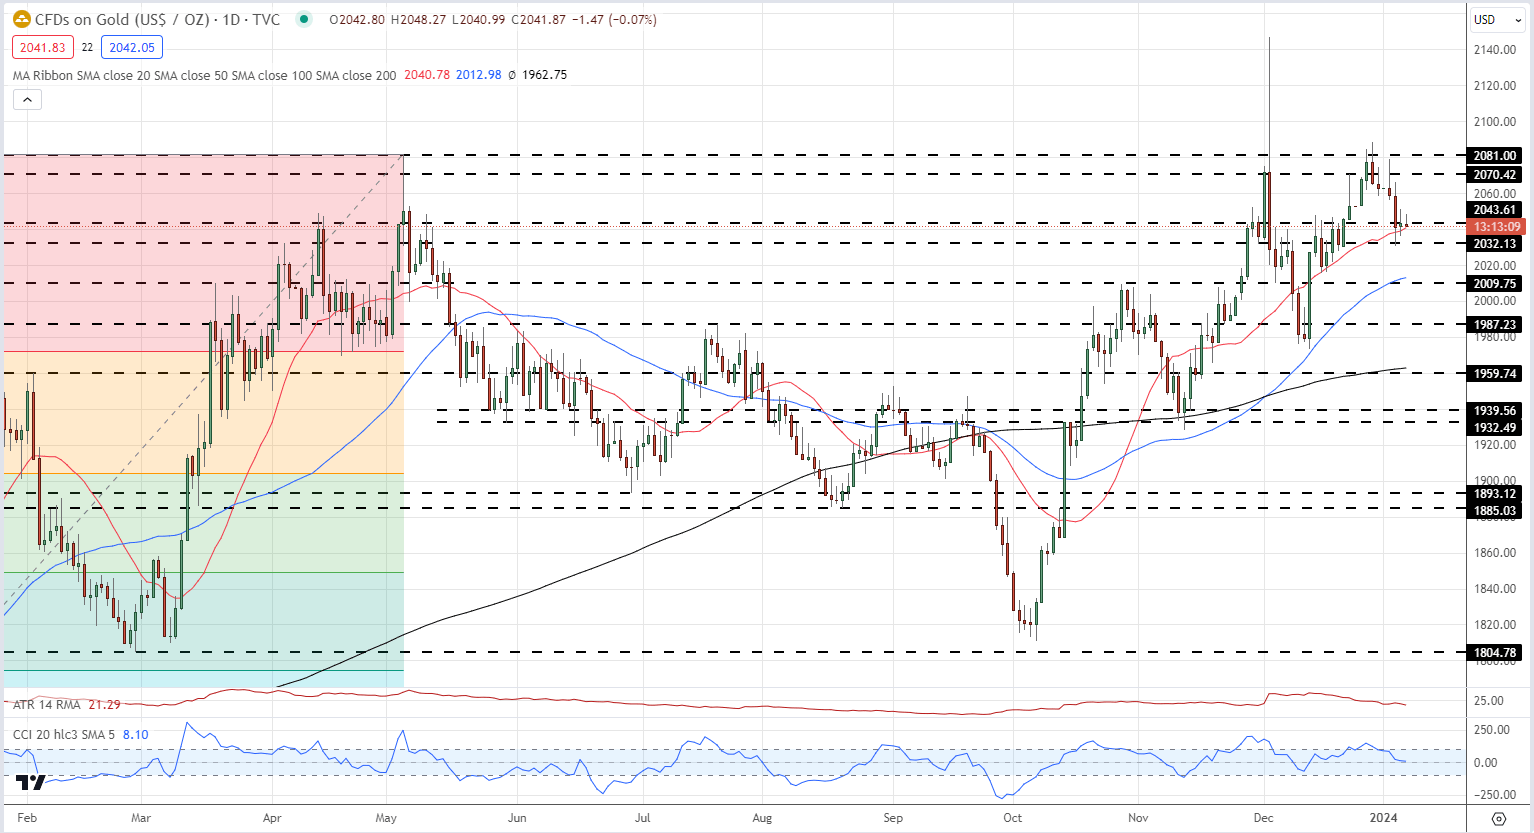
Gold is quiet at the start of Friday’s session and will remain that way until today’s jobs numbers are released. The CCI indicator reading is neutral, while the current $8/oz. trading range is around one-third of the latest 14-day ATR reading. Support around the $2,032/oz. held an earlier test this week but is unlikely to keep sellers at bay if the NFP numbers show a stronger-than-expected labor market. The next level of support is seen at $2,009/oz.

Gold Daily Price Chart

image2.png

Chart via TradingView

Retail trader data shows 57.48% of traders are net-long with the ratio of traders long to short at 1.35 to 1.The number of traders net-long is 2.50% lower than yesterday and 4.17% lower than last week, while the number of traders net-short is 7.82% higher than yesterday and 2.23% lower than last week.

We typically take a contrarian view to crowd sentiment, and the fact traders are net-long suggests Gold prices may continue to fall.

Popular Moving Averages and How to Use Them

Popular Moving Averages and How to Use Them

Popular Exponential Moving Averages

While the most popular Exponential Moving averages (EMA) look very similar to the SMAs, the actual data points that make up the EMA will differ due to the way it is calculated. The EMA calculation attributes a higher weighting to recent price moves compared to the SMA, which takes a general average over the specified time period. The most popular simple moving averages include the 10, 20, 50, 100, and 200.

Traders interested in Fibonacci numbers prefer to replace the popular moving average numbers with Fibonacci numbers.

The standard moving average settings:

popular moving average

Fibonacci moving averages:

popular Fibonacci moving averages

There are a number of moving averages each with different formulas. Over time, formulas have been altered in an attempt to better track price. Therefore, traders have a decent selection of moving averages to choose from, some of the most popular include:

  • Hull Moving Average
  • Weighted Moving Average
  • Smoothed Moving Average
  • Simple Moving Average
  • Exponential Moving Average

Read our article on moving averages for detailed examples on how to calculate both the SMA and EMA.

Why moving averages are popular

Moving averages are simple to use and can be effective in recognizing trending, ranging, or corrective environments. Often traders will use more than one moving average because two moving averages can be used as a trend trigger. In other words, when the shorter moving average crosses above the longer, slower moving average, this can be viewed as a cue to enter long. The long trading bias remains until the moving averages reverse or the target is hit.

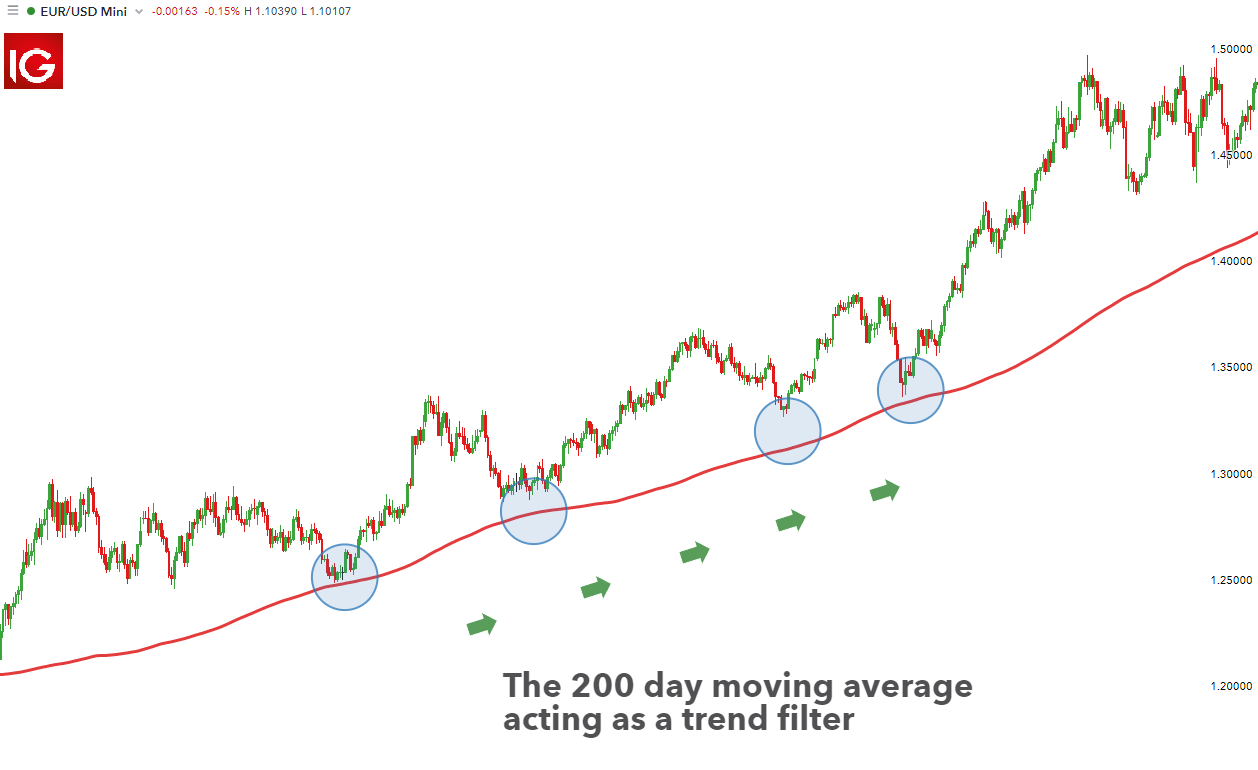
The EUR/USD chart below shows the 200-day moving average acting as support and a clear trend filter. Price approaches the 200-day MA before bouncing back up in the direction of the long-term trend.

popular 200 day moving average acting as a trend filter

Pro Tip: It is best to stick to a few specific moving averages. This will prevent traders from trying to find the “perfect moving average” and will help traders to stay focused on whether the trend is starting, accelerating, or slowing down.

Who uses moving averages

Moving Averages are most popular to new traders, for good reason. They help traders to define the trend and potential entries in the direction of the trend. However, moving averages are also utilized by fund managers and investment banks in their analysis to see if a market is nearing support or resistance or potentially reversing after a significant period.

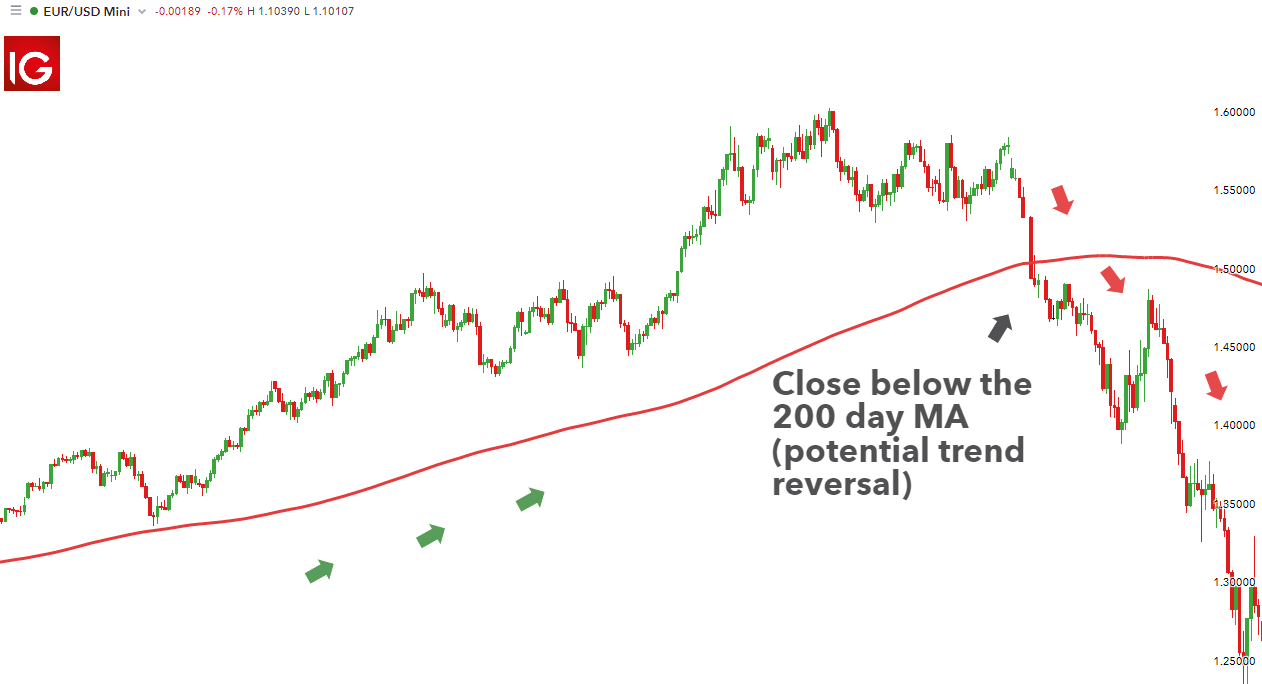
The EUR/USD chart below depicts the slowing down of upward momentum in the long-term trend as the price drops and closes below the 200-day moving average. A close below the 200-day MA alerts traders to the possibility of a reversal in the long-term trend.

Close below popular 200 day moving average signals potential reversal

Moving averages can be a simple tool to define support and resistance in the forex market. When a market is in a strong trend, any bounce off a moving average presents an opportunity to join the trend until the price closes below the 200-SMA. However, if the price persistently moves above and below the moving average in a short period of time, this is likely to be a range, meaning those reversals are less significant from a trading point of view.

How to use the popular moving averages

There are many uses for the popular moving averages but a simple system is to look for a moving average crossover. The moving average crossover looks for the short or faster moving average to cross above an already rising longer or slow-moving average as a buy signal. When looking to sell a currency pair, traders can look for the short or faster moving average to cross below a falling slower moving average as a sell signal.

The most well-known moving average crossovers involve the 50 (51) and 200 moving averages.

Name Crossover Resulting signal
Golden Cross 50 crosses above the 200 Bullish crossover
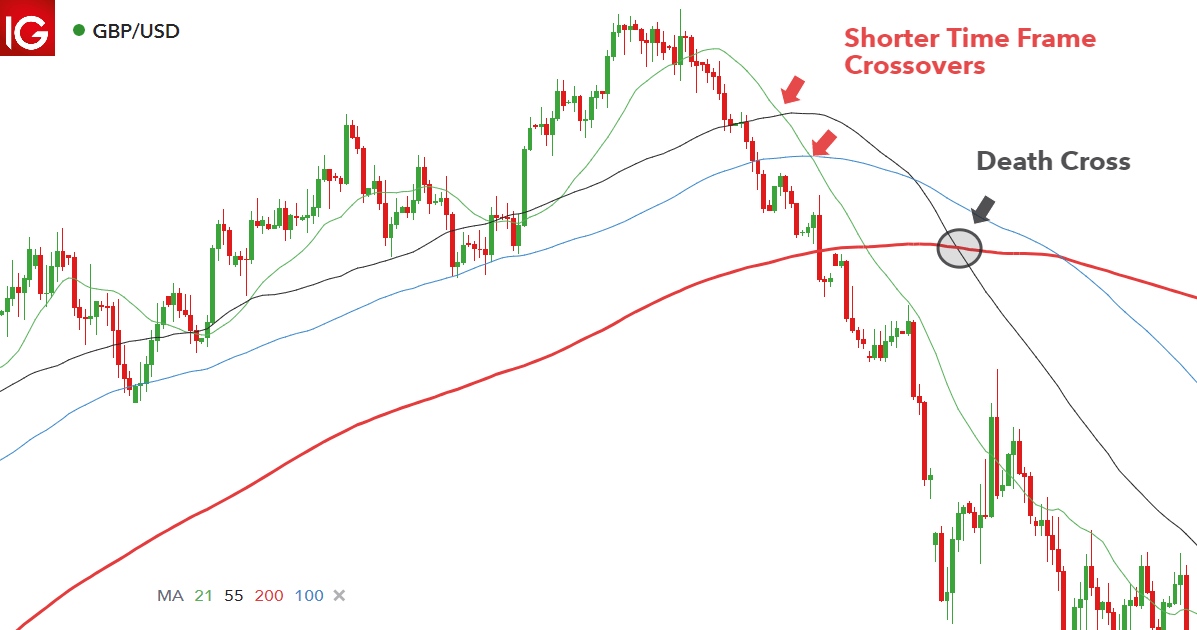
Death Cross 50 crosses below the 200 Bearish crossover

The Death cross is presented in the GBP/USD chart below:

Popular moving averages as crossovers

Frequently Asked Questions (FAQs)

What time frame must I use when trading with moving averages?

Moving averages can be used on any time frame. However, the time frame you decide to use will depend greatly on the type of trader you are. Traders with lots of time to spend in front of the charts may prefer ‘scalping’ and will, therefore, use hourly or 15-minute charts. On the other hand, traders short on time will tend to prefer longer time frames such as the 4-hour or daily charts.

How to Short Sell a Stock When Trading Falling Markets

How to Short Sell a Stock When Trading Falling Markets

Shorting a stock involves selling a borrowed stock in the anticipation of buying the same stock back at a lower future price and pocketing the difference. Short selling is a normal part of an active trader’s plan as it presents traders with the ability to benefit from an advancing market and a declining one. This article makes use of examples to explain what short selling is, why it is important and lists the top things to consider when short selling stocks.

What is short selling and why do it?

Short selling is the process of borrowing shares via a broker, selling those shares at the current market price and later buying the shares back at a lower price in order to return the shares to the broker.

How to short sell stocks

Why short stocks? The answer to this question is multi-layered but in general, shorting stocks presents an opportunity trade a decline in a share’s price.

To some, short selling seems rather unethical because you are essentially taking a stance that a company’s share price will fall, which could result in large scale retrenchments affecting many households in the process. To others, this represents an opportunity to speculate in on over-valued stocks or to benefit from the largescale selling of unscrupulous companies.

Nowadays, in addition to retail traders, there are well-established hedge funds that focus on short selling, or ‘shorting’ various companies. Some short sellers publish research on companies that are alleged to have reported misleading figures in the publication of financial statements or where there is sufficient evidence of corrupt business practices.

Before diving into the world of short selling, we recommend you review the stock market basics.

What does shorting a stock involve?

At this stage it may be helpful to differentiate between short selling stocks in the underlying market (non-leveraged) and shorting (selling or taking a short position) via a broker offering leverage.

The traditional approach has been set out above, where the short seller borrows shares from a broker, sells the shares and later buys the shares back at a discount to return to the broker.

However, the emergence of leverage trading has simplified this process to the point where shorting a stock is simply a matter of clicking the ‘sell’ button for the desired stock on an online platform.

Deal ticket for shorting a stock

Shorting a stock in this way involves:

  1. A regulated broker: It is crucial to trade with a regulated broker offering little to no leverage.
  2. Liquidity/Borrow: In order to short a stock, the broker must have sufficient ‘borrow’. Borrow refers to having a pool of liquidity providers willing to lend the necessary shares to the broker for its internal hedging requirements. In the absence of borrow, brokers can no longer facilitate short selling and will disable the short selling function until sufficient borrow returns to the market. More liquid stocks tend to provide greater borrow than illiquid stocks.
  3. Set risk parameters: When there is sufficient borrow, carry out the necessary analysis, set stops and limits and hit the ‘sell’ button on the online platform.
 How to short sell a stock

The following steps can be followed when shorting a stock:

  1. Select the desired market
  2. Confirm a down-trending market
  3. Predetermine stop losses and limits (risk-to-reward ratio)
  4. Enter the short trade
  5. The trade is complete once the stop or limit is hit

Traders can make use of the 200-day moving average or use trend lines to evaluate whether the stock is in a trending environment.

The short selling process can be made clearer by using actual figures in the form of a practical example.

Short selling example

Let’s say a short seller wishes to sell 10 shares of Apple Inc as he believes the share price is going to drop in the near future. If the price of Apple is $20 and the margin requirement is 50%, that means the trader would effectively be controlling $200 ($20 x 10 shares) worth of Apple shares while only putting up $1000 ($200 x 0.5) as margin.

The short seller sets the target at a price of $17 and a stop at $21 to establish a 1:3 risk-to-reward ratio. If price hits the target, the short seller could gain near $300 ($30 x 10 shares), minus any financing fees and commissions.

Nominal trade value = $2000

Margin = 50% ($1000)

Gain after taking profit = $300 ($30 x 10 shares)

Potential loss: $100 ($10 x 10 shares)

This example also presents the ideal scenario but financial markets are often unpredictable and do not move as reliably as presented here. It is for this reason that traders should adopt sound risk management practices from the outset.

What are the risks when short selling stocks?

When learning how to short sell stocks it is crucial to keep the following in mind:

  • Potential for unlimited losses –Short positions without stops, theoretically have the potential for unlimited losses. There is no limit to the price of a share can rise to which further underscores the importance of stops.
  • Short squeeze –A short squeeze occurs when short traders witness a rise in price (contrary to what was expected) leading to losses that eventually force traders to buy (to close the trade) at a higher price and take a loss. Price gains more upward momentum as more short sellers buy to close their positions.

Below is an example of a short squeeze using the US 500 (S&P 500):

short squeeze when short selling

  • Unborrowable stock – In plummeting markets, even the most liquid shares can become unborrowable and therefore, prevent the opening of any new short positions. Traders need to keep this in mind but should also not allow this to force them into a rushed entry.

Short Selling Stocks: Key Takeaways

Shorting a stock has been made a lot easier with the advancements in technology and forms a part of a trader’s skillset. However, unlike the forex market, stock traders are faced with the unique problem of unborrowable stocks that prohibit any shorting of stocks. Traders should only consider initiating a short trade after conducting the necessary technical and/or fundamental analysis while adhering to sound risk management practices.

As a reminder, the top 5 takeaways for shorting a stock are:

  1. Use a regulated broker: Consider using a highly regulated, reputable broker when short selling stocks.
  2. Trend: In the absence of a well-established downtrend, traders should set entry orders at favourable levels in the event the market gets there. Shares have the potential to trading gap down – especially if negative information finds its way into the public domain. In such fast-moving markets, traders can miss a favourable entry when away from the trading screen and orders can help.
  3. Liquidity/Borrow: Is the stock trading on a major exchange with a healthy number of shares changing hands daily, otherwise known as ‘free-float’? Greater liquidity tends to translate into more borrow being made available to short sellers and greater flexibility to short the stock.
  4. Borrow charge: In addition to any overnight funding charges on open positions held overnight, there are often ‘borrow charges’ that apply to short positions to allow short sellers to participate in the market. It is always a good idea to enquire about such a charge with your broker before placing a trade.
  5. Risk Management: Since short trades theoretically have unlimited losses with limited gain (price can only drop to 0), traders need to make use of stops and limits to rectify an inherently skewed risk-reward payoff.

Short selling stocks FAQs

What are the top stocks to short?

Stocks that become attractive to short sellers vary by industry and sector. Therefore, there is no single stock that traders should target for a short trade. Short sellers apply a number of analysis techniques – mainly fundamental in nature – looking at revenue and debt to equity ratios but also looks at other aspects of the business like the corporate governance structure and calibre of senior management.

All the major stock indices can be viewed on our major stock indices page.

How long can you short a stock?

There is no limit to the length of time traders can hold long positions. This is because shares are owned outright and do not involve borrowing someone else’s shares. Shorting stocks on the other hand involves borrowing shares that can be recalled by the broker at any time. There is no set length of time that traders will typically be able to hold a short trade and this will depend entirely on the market conditions at the time and when the owner of the shares wishes to liquidate those very shares.

Trading on Sentiment: Using IG Client Sentiment Data

Trading on Sentiment: Using IG Client Sentiment Data

Trading on sentiment data can help traders identify hidden trends in the market that may not be obvious to novice traders.DailyFX provides client sentiment data based on all live IG trades in the forex, commodity, cryptocurrency, and indices markets and acts as a contrarian signal. A successful sentiment trading strategy would look to make a trade in the opposite direction whenever sentiment shows a strong directional bias. This may seem counter-intuitive but is well-founded and will be explained in this article.

Trading with IG Client Sentiment talking points:

  • What is IG Client Sentiment?
  • Why is client sentiment a contrarian indicator?
  • How to create a sentiment trading strategy using IG CS
  • Learn more about trading with sentiment

What is IG Client Sentiment?

IG Client Sentiment, or IG CS, uses data derived from IG retail traders with live positions. Essentially, traders can see where the majority of traders are positioned, whether long or short when analyzing trades. Traders can access IG Client Sentiment data using our interactive tool where markets and asset classes can be filtered accordingly.

trading on sentiment

IG Client Sentiment is viewed as ‘fading the crowd’ or going in the opposite direction of retail traders. All of this is made possible with IG’s accurate, real-time data on the most frequently traded markets – which can be used in any sentiment trading strategy.

It’s crucial to note that traders should not trade based on IG Client Sentiment alone but should combine sentiment with technical analysis and ensure that the appropriate trade size (in relation to the account size) is used at all times.

Why is Client Sentiment a contrarian indicator?

Before implementing a sentiment trading strategy, it’s essential to understand why client sentiment is regarded as a contrarian signal.

IG Client Sentiment is regarded as a contrarian indicator for two main reasons.

1. Trading against the trend: The majority of retail traders (the population of the IG CS data) are trend fighters. Unfortunately, this appears to be human nature more than logic as this pattern continues to play out. These traders attempt to call tops and bottoms in the market by trading reversals in strong trending markets. This goes completely against the fundamental concept of, ‘The trend is your friend’.

2. Exiting the trade: If the market is in an uptrend and sentiment is overwhelmingly short, all those short traders will eventually need to do the opposite to close the position, which would involve buying to close. Whether a stop or limit is hit, or the trade is closed manually, this will involve ‘buying’ which drives the prices upwards. If short traders significantly outweigh long traders, those short traders will eventually have to buy to close their positions creating buying momentum that will benefit long traders, not short traders.

How to Create a Sentiment Trading Strategy using IG CS

This section expands on IG CS by incorporating it in a sentiment trading strategy. The steps involved are listed below:

  1. Use IG Client Sentiment to establish the market and direction of the trade
  2. Is the market range-bound or trending?
  3. Overlay net-long/short positions over the price chart to see the while picture.

1) Use IG Client Sentiment to establish the market and direction of the trade

Traders can look to sentiment at the very start of the analysis process or they can conduct thorough technical and/ or fundamental analysis and seek out client sentiment as confirmation of the trade.

Using client sentiment as the starting point, however, can be extremely useful as it can inform which market to trade and in what direction before any other analysis is even done. Thereafter, traders can use technical analysis to spot ideal entry and exit points for that market.

Establishing the market and direction: Look for markets exhibiting extremes in positioning. Strong upward (downward) trending markets combined with extreme net-short (net-long) client positioning, result in a bullish (bearish) signal.

Using IG Client Sentiment for a clear directional bias

The summary table on IG Client Sentiment, displays the number of traders holding long positions in a selected market, to the number of traders holding short positions in the same market.

Traders should be drawn to extreme levels (very short or very long) when analyzing sentiment, as this is where the tool provides clearer signals. As can be seen in the graphic below, there is a relatively extreme figure of 78% for NZD/USD. The figure is written in blue (representing longs) and the horizontal bar also depicts the sentiment imbalance in favor of the longs.

Showing sentiment on top markets for IG Client Sentiment

Red readings indicate net short positions in a currency pair, while readings in blue show that traders are net long the pair. Another way of viewing the degree of sentiment is to consider the ratio of long to short traders. It is widely considered that readings greater than 2, indicate a meaningful bias among retail traders as this translates to at least 66.6% of traders net-long/short.

Therefore, with 78% of traders being net long NZD/USD, this indicates that for every one trader holding a short position, there are 3.54 that are holding long positions; which represents a sizeable imbalance in the positioning of the pair.

General trading signals produced by IG Client Sentiment

Trend Direction Ratio of net-long to net-short Signal
Up trend -2 Long
Down trend +2 Short
Up trend +2 Mixed
Down trend -2 Mixed

At this stage, we know which market to trade and know the direction to trade it but there are further factors to consider and these are explored in the remainder of the article.

2) Is the Market Range-Bound or Trending?

Trending markets: It’s human nature to look for bargains which is why retail traders often look to “call the bounce”, selling in an advancing market and buying a falling market.

Range-bound markets: In well-established ranging markets, preferably with low volatility, selling at the highs and buying at the lows makes sense.

Returning to the NZD/USD example, after realizing that most traders are long NZD/USD, one could reasonably assume that this must be the correct trade to place. This, however, could not be further from the truth.

Taking a look at the NZD/USD chart below, it is clear to see an overall downtrend despite retail traders remaining strongly net long. This seems counter-intuitive but reinforces the notion that retail traders tend to be trend fighters.

Sentiment trading strategy for NZD/USD with IG Client Sentiment

To their detriment, retail traders tend to focus more on catching reversals in strong trending markets than trading ranges. Therefore, when trading on sentiment, traders will find more reliable (contrarian) signals in strong trending markets.

3) Overlay net-long/short positions over the price chart

To make the analysis easier, DailyFX provides a comprehensive report on major markets, showing IG sentiment overlaid on price. To get the full report, navigate to the sentiment page and click on the Green button labeled, “IG Client Sentiment Report”.

Full report on IG Client Sentiment

The report produces a price chart for each market with sentiment superimposed on the same chart. It also includes a paragraph showing all relevant sentiment numbers before providing either a bullish, mixed, or bearish trading bias.

Another useful and often overlooked feature of the report is the changes in long and short positions. This feature is particularly helpful to traders when recent moves in sentiment are sizeable and move conversely to the overall sentiment. Such large changes could indicate a reversal in overall sentiment and the market itself.

changes in long and short positions in sentiment

Once the report is open, scroll down to find the desired market. Traders will find a chart and a quick summary of recent and overall sentiment numbers.

The top section of the diagram shows how price has evolved (green and red candles) and the blue/red sentiment line shows when traders are net long/ net short. If there is a large distance between the sentiment line and the price, this can be considered as a signal to trade in the direction of the trend.

NZD/USD sentiment overlaid on price chart

In the above diagram, price is in a strong downtrend and sentiment is showing over three times more long traders for every short trader, therefore, this can be regarded as a bearish signal.

The lower section of the diagram simply shows the actual number of short and long traders over time. Since traders have become more and more net-long, it’s no surprise to see the blue line well above the red line for long periods.

While IG Client Sentiment is a useful tool, it doesn’t mean that it’s perfectly predictive. Traders should still look to utilize strong risk management in their trades, even with the assistance of IG CS.

EUR/USD recovers toward 1.0950 ahead of key data releases

EUR/USD recovers toward 1.0950 ahead of key data releases

EUR/USD gained traction and rose toward 1.0950 in the European session on Thursday. Inflation data from Germany and private sector employment report from the US will be watched closely by investors in the second half of the day.

The 200-period Simple Moving Average (SMA) on the 4-hour chart aligns as immediate support for EUR/USD at 1.0920 before 1.0880 (lower limit of the ascending regression trend channel). A 4-hour close below the latter could open the door for an extended slide toward 1.0850 (Fibonacci 38.2% of the latest uptrend).

On the upside, strong resistance seems to have formed at 1.0950-1.0960 (100-period SMA, Fibonacci 23.6% retracement) ahead of 1.1000 (psychological level, static level) and 1.1020 (50-period SMA).

EUR/USD staged a technical correction and stabilized below 1.0950 early Thursday after testing 1.0900 on Wednesday. The pair’s technical outlook is yet to point to an extended recovery as investors remain cautious while waiting for key macroeconomic data releases.

The US Dollar (USD) benefited from the cautious market stance mid-week and continued to outperform the Euro. Meanwhile, the relatively hawkish tone seen in the minutes of the Federal Reserve’s (Fed) December meeting minutes helped the currency hold its ground later in the American session.

The Fed’s publication showed that several policymakers noted that situations could justify maintaining the policy rate at its current level for a longer duration than their current expectations. According to the CME Group FedWatch Tool, markets are currently pricing in a 72% probability that the Fed will lower the policy rate by 25 basis points in March, down from 85% earlier in the week.

Later in the session, inflation data from Germany will be watched closely by market participants. Earlier in the day, regional data from Germany showed that the annual inflation in North Rhine-Westphalia, as measured by the change in the Consumer price Index (CPI), rose to 3.5% in December from 3% in November. Markets expect the CPI to increase by 3.8% on a yearly basis. A stronger-than-forecast CPI print could help the Euro find demand in the early American session.

The US economic docket will feature ADP Employment Change for December, which is forecast to rise 115,000. Ahead of Friday’s Nonfarm Payrolls (NFP) report, a noticeable upside surprise in ADP, with a print of 150,000 or above, could make it difficult for EUR/USD to gather bullish momentum even if the initial reaction to German inflation report appears to be Euro-positive.

DAX Index: Services PMIs, Inflation, and the US Labor Market in Focus

DAX Index: Services PMIs, Inflation, and the US Labor Market in Focus

Overview of the DAX Performance on Wednesday

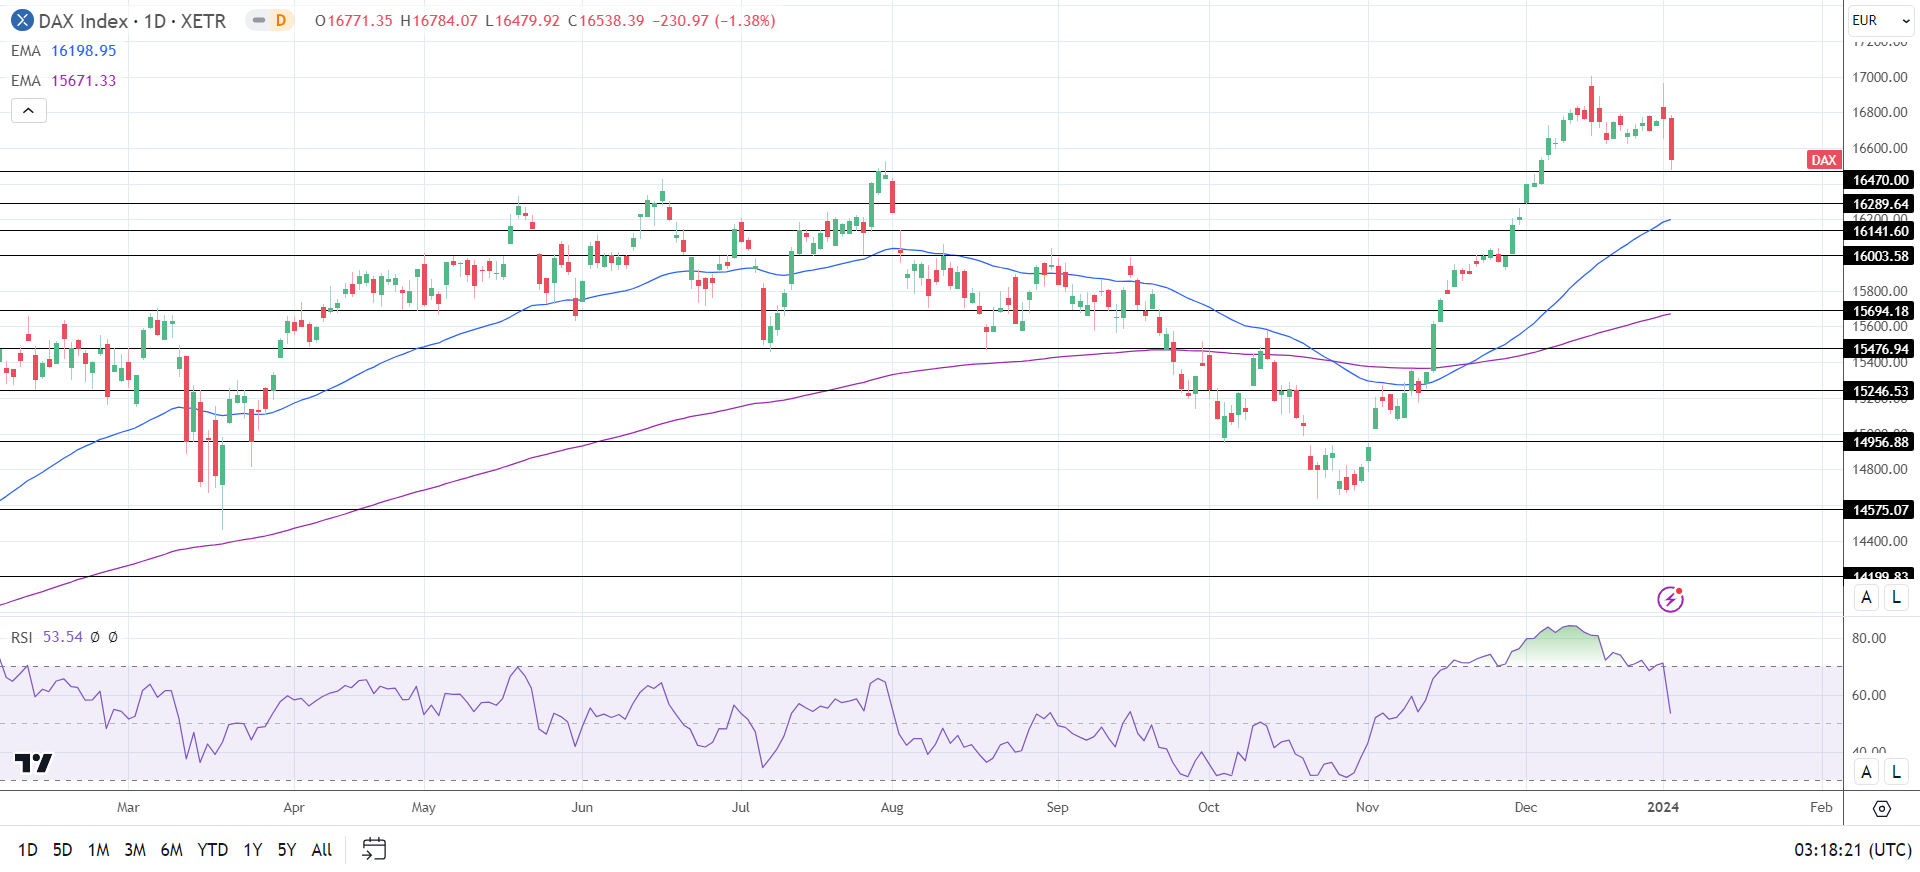
The DAX slid by 1.38% on Wednesday. Reversing a 0.11% gain from Tuesday, the DAX ended the Wednesday session at 16,538.

German Unemployment Inches Higher

On Wednesday, the German labor market was in focus. The German unemployment rate rose from 5.8% to 5.9% in December. However, unemployed persons increased from 2.698 million to 2.703 million. Economists forecast an increase to 2.732 million.

Trading Derivatives carries a high level of risk to your capital and you should only trade with money you can afford to lose. Trading Derivatives may not be suitable for all investors, so please ensure that you fully understand the risks involved, and seek independent advice if necessary. A Product Disclosure Statement (PDS) can be obtained either from this website or on request from our offices and should be considered before entering into a transaction with us. Raw Spread accounts offer spreads from 0.0 pips with a commission charge of USD $3.50 per 100k traded. Standard account offer spreads from 1 pips with no additional commission charges. Spreads on CFD indices start at 0.4 points. The information on this site is not directed at residents in any country or jurisdiction where such distribution or use would be contrary to local law or regulation.

The less-than-expected increase in unemployed persons provided little comfort. Investors turned cautious, with the markets waiting for more decisive guidance on ECB rate cuts.

Hawkish Fed Chatter and US Data Deliver Fed Rate Cut Uncertainty

On Wednesday, FOMC voting member Thomas Barkin warned rate hikes remained on the table. Barkin spoke before the FOMC Meeting Minutes out after the European closing bell.

US economic indicators signaled relatively steady labor market conditions before the all-important US Jobs Report. US manufacturing PMI numbers and JOLTs Job Openings contributed to the losses.

On Wednesday, the US equity markets responded to the stats and hawkish Fed commentary. The Nasdaq Composite Index declined by 1.18%, with the Dow and S&P 500 falling by 0.76% and 0.80%, respectively.

The Wednesday Market Movers

Siemens Energy AG slid by 6.39%, with Infineon Technologies down 3.82% on hawkish Fed comments and the Nasdaq losses.

Auto stocks contributed to the session’s losses on monetary policy uncertainty. BMW fell by 2.23%, with Volkswagen and Mercedes-Benz Group declining by 1.79% and 1.75%, respectively. Porsche ended the session down 1.75%.

However, recession jitters continued to weigh on retail-linked stocks. Online regional retailer Zalando SE slid by 3.58%, with Adidas ending the day down 1.68%.

Euro Area Inflation and Services in Focus

On Thursday, inflation figures from France and Germany warrant investor attention. A pickup in inflationary pressures could delay ECB discussions about interest rate cuts. Significantly, economists forecast Germany’s annual inflation rate to accelerate from 3.2% to 3.7% in December.

However, investors must also consider services PMIs. Downward revisions to German and Eurozone PMIs could fuel bets on a more prolonged Euro area recession. Higher inflation and a more marked contraction across the services sector could impact the demand for DAX-listed stocks.

According to preliminary numbers, the German Services PMI fell from 49.6 to 48.4. The Eurozone Services PMI declined from 48.7 to 48.1.

US Services and Labor Market in the Spotlight

Later in the Thursday session, ADP employment change, jobless claims, and Services PMIs will draw investor interest.

Tight labor market conditions could force the Fed to delay rate cuts to Q2 2024. A more hawkish Fed rate path would affect market risk sentiment. Economists forecast the ADP to report a 115k increase in employment vs. 103k in November. Notably, economists expect initial jobless claims to fall from 218k to 216k in the week ending December 30.

Upward revisions to the preliminary S&P Global Services PMI would also support a more hawkish Fed rate path. According to the preliminary survey, the Services PMI increased from 50.8 to 51.3.

Beyond the numbers, investors must consider FOMC member commentary after the hawkish Fed Minutes.

In the futures, the DAX and the Nasdaq mini were up 1 and 13 points, respectively.

Short-Term Forecast

Near-term DAX trends will depend on inflation, the services PMIs, and the US Jobs Report. Falling bets on ECB and Fed rate cuts and expectations of a Eurozone recession could deliver further losses for the DAX.

DAX Technical Indicators

Daily Chart

The DAX sat above the 50-day and 200-day EMAs, sending bullish price signals.

A DAX move through the Wednesday high of 16,784 would give the bulls a run at the December 14 ATH 17,003.

On Thursday, euro area inflation and services PMIs, the US economic calendar, and central bank commentary are in focus.

However, a fall through the 16,470 support level would bring the 16,290 support level into play.

The 14-day RSI reading of 53.54 suggests a DAX return to 17,000 before entering overbought territory.

DAX Daily Chart sends bullish price signals.
DAX 040124 Daily Chart

4-Hourly Chart

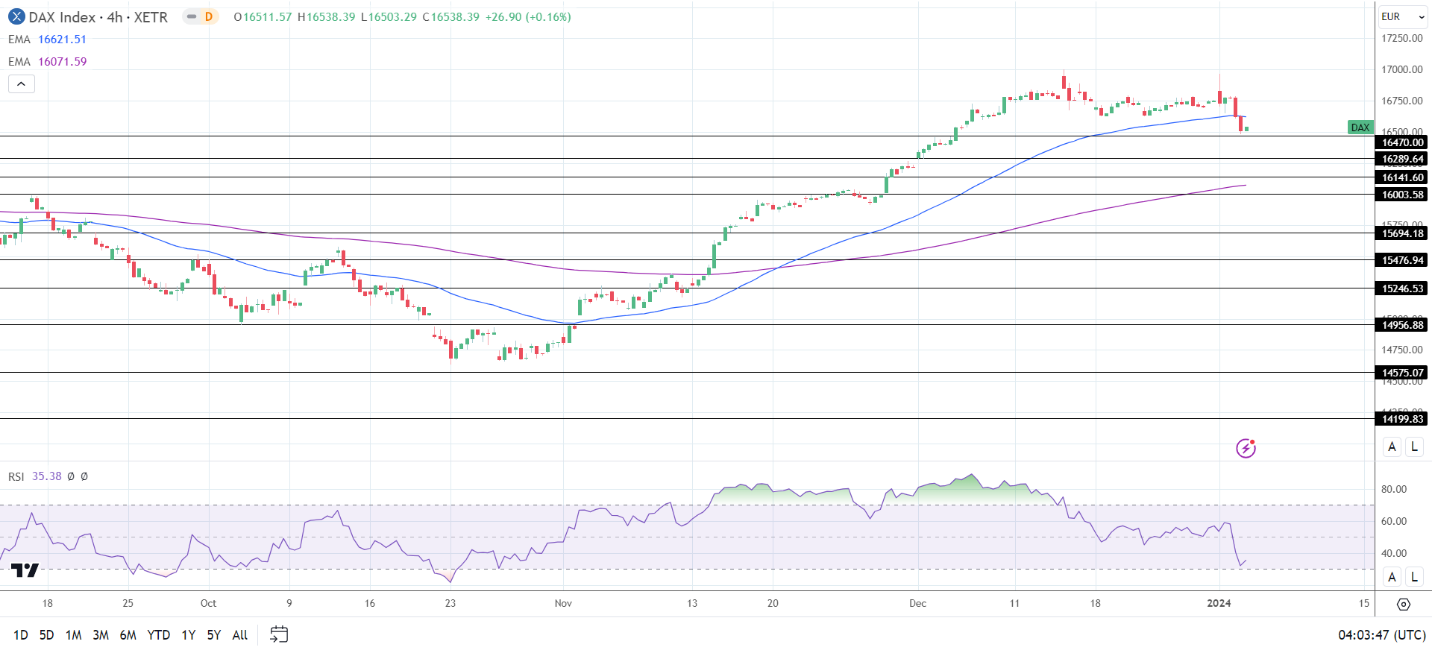
The DAX sat below the 50-day EMA while holding above the 200-day EMA, sending bearish near-term but bullish longer-term price signals.

A DAX break above the 50-day EMA would support a move to the Wednesday high of 16,784.

However, a fall through the 16,470 support level would give the bears a run at the 16,290 support level.

The 35.38 14-4 hour RSI indicates a DAX drop below the 16,470 support level before entering oversold territory.

4-Hourly Chart sends bearish near-term price signals.
DAX 040124 4-Hourly Chart
EUR/USD and GBP/USD Price Forecast: US ADP Non-Farm Employment Change in the Highlights

EUR/USD and GBP/USD Price Forecast: US ADP Non-Farm Employment Change in the Highlights

EUR Dips and GBP Rises: Economic Data Drives Currency Dynamics

Yesterday, the currency market witnessed contrasting movements between the EUR/USD and GBP/USD pairs. The EUR/USD pair experienced a notable decline, falling by 0.16% to close at 1.0921.

This drop is likely linked to economic data releases and the Federal Open Market Committee (FOMC) minutes, which reinforced the US dollar’s position against the Euro. The FOMC minutes possibly indicated a slower pace for interest rate cuts, strengthening the dollar.

Trading Derivatives carries a high level of risk to your capital and you should only trade with money you can afford to lose. Trading Derivatives may not be suitable for all investors, so please ensure that you fully understand the risks involved, and seek independent advice if necessary. A Product Disclosure Statement (PDS) can be obtained either from this website or on request from our offices and should be considered before entering into a transaction with us. Raw Spread accounts offer spreads from 0.0 pips with a commission charge of USD $3.50 per 100k traded. Standard account offer spreads from 1 pips with no additional commission charges. Spreads on CFD indices start at 0.4 points. The information on this site is not directed at residents in any country or jurisdiction where such distribution or use would be contrary to local law or regulation.

Conversely, the GBP/USD pair saw a modest rise, gaining 0.41% to end at 1.2664. This upward trend may be attributed to the UK’s stable economic environment, as indicated by the steady Final Services PMI of 52.7, suggesting robust economic activity in the UK.

Looking ahead, today’s focus shifts to a slew of data from the European service sector and crucial US economic releases, including the ADP Non-Farm Employment Change and Unemployment Claims.

These data points are expected to provide further direction to the EUR/USD and GBP/USD pairs, reflecting the ongoing influence of regional economic conditions and policy anticipations on currency market dynamics.

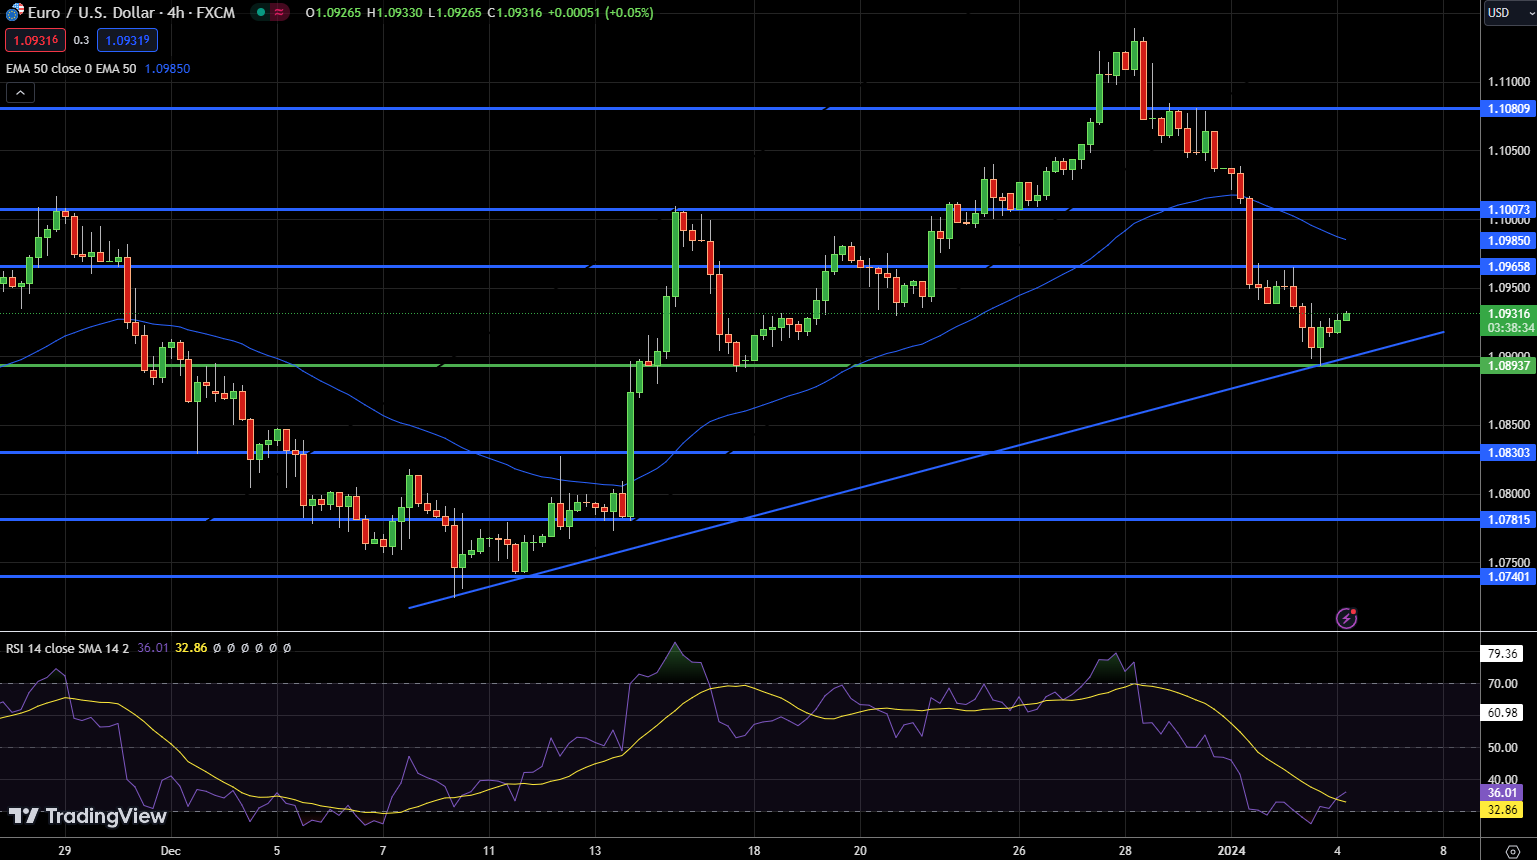
EUR/USD Technical Forecast

EUR/USD Price Chart - Source: Tradingview

As of January 4th, the EUR/USD currency pair is facing a critical juncture in the market, reflected in its slight increase to 1.09316, up by 0.12%. The pivot point for the pair is currently at $1.0894. This level is pivotal for determining the pair’s next directional move. Resistance levels are identified at $1.0966, $1.1007, and $1.1081, marking potential points where bullish momentum might face obstacles.On the flip side, the support levels are at $1.0830, $1.0782, and $1.0740. These levels could provide a cushion against bearish trends. The Relative Strength Index (RSI), a momentum oscillator that measures the speed and change of price movements, is at 36. This figure suggests a bearish sentiment and hints that the pair might be approaching oversold territory, which could signal a potential reversal or pause in the downward trend.

The Moving Average Convergence Divergence (MACD) is showing a slight negative value. The MACD is a trend-following momentum indicator that shows the relationship between two moving averages of a security’s price.  The 50-Day Exponential Moving Average (EMA) of $1.0985 reinforces this bearish trend, as the current price is below this average.

Additionally, an upward trendline at 1.089 and the formation of a tweezer’s bottom pattern suggest the possibility of a bullish correction. This pattern typically indicates a reversal and could be a sign that the selling pressure is subsiding.

In summary, while the short-term outlook for EUR/USD appears cautiously optimistic, particularly above the pivotal $1.089 mark, the pair is still grappling with bearish pressures as indicated by technical indicators.

GBP/USD Technical Forecast

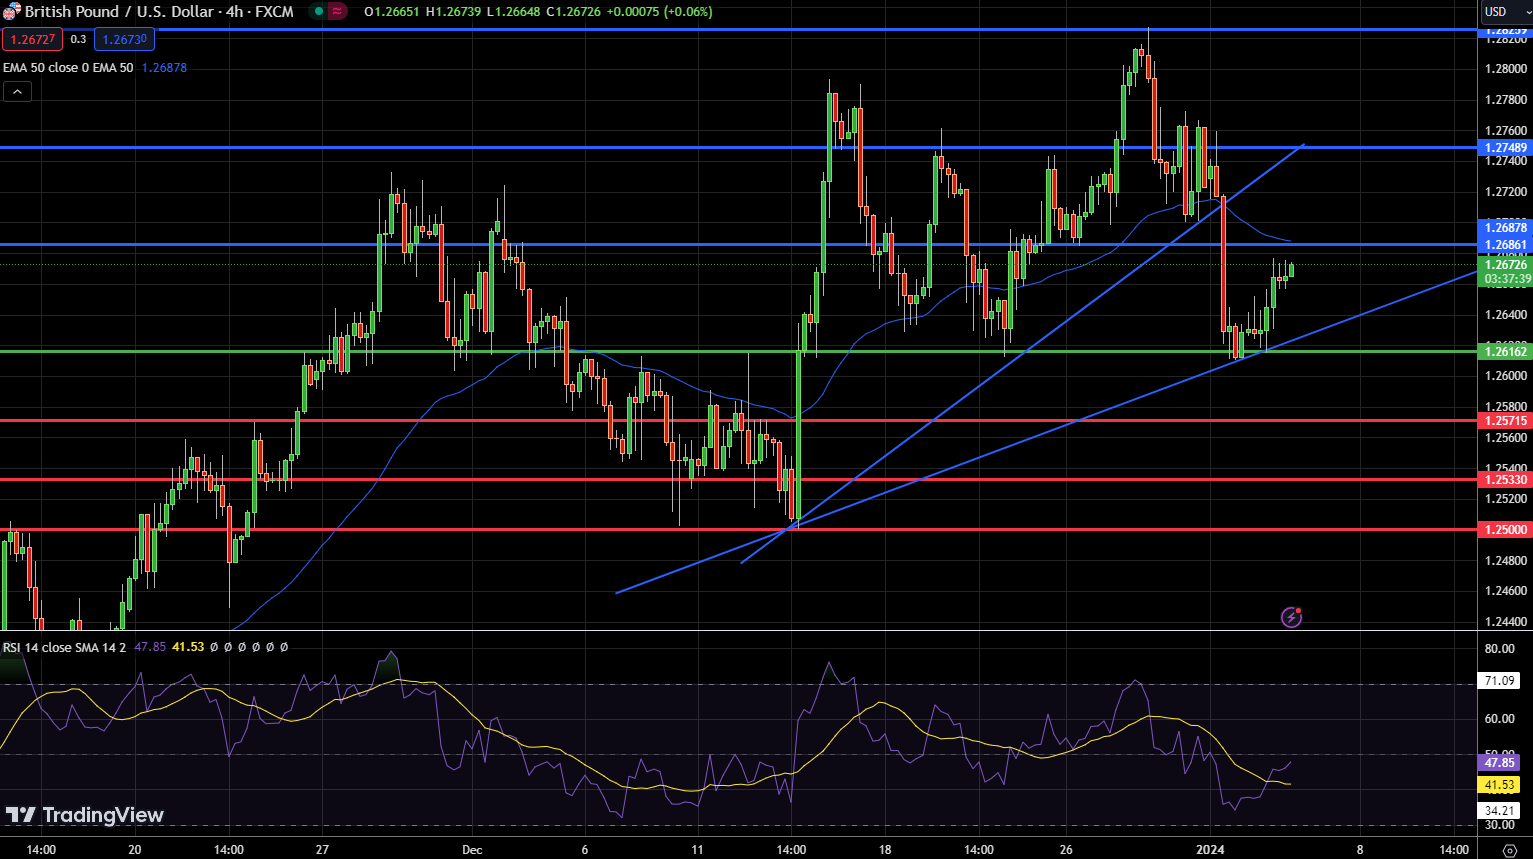
GBP/USD Price Chart

On January 4, the GBP/USD pair showed a positive movement, registering a 0.16% increase to 1.26726. The pair is currently navigating through critical technical levels, with a pivot point established at 1.26162.Key resistance levels are positioned at 1.26861, 1.27489, and 1.28239, which if surpassed, could indicate a stronger bullish trend.

On the downside, support levels at 1.25715, 1.25330, and 1.25000 provide significant thresholds to watch for any bearish turns. The Relative Strength Index (RSI) at 47 suggests a neutral to slightly bearish sentiment.

The Moving Average Convergence Divergence (MACD) shows a minimal positive crossover, hinting at potential upward momentum. However, the 50-Day Exponential Moving Average (EMA) at 1.2688 could act as a resistance, potentially capping upward movements.

An upward trendline at 1.2615 is supporting the pair, with a series of bullish candles indicating an uptrend. Nevertheless, a decisive bullish crossover above the 50 EMA could trigger further buying, suggesting a cautiously optimistic outlook for GBP/USD in the short term.