EUR/USD rises to near 1.0950 as sentiment improves

EUR/USD rises to near 1.0950 as sentiment improves

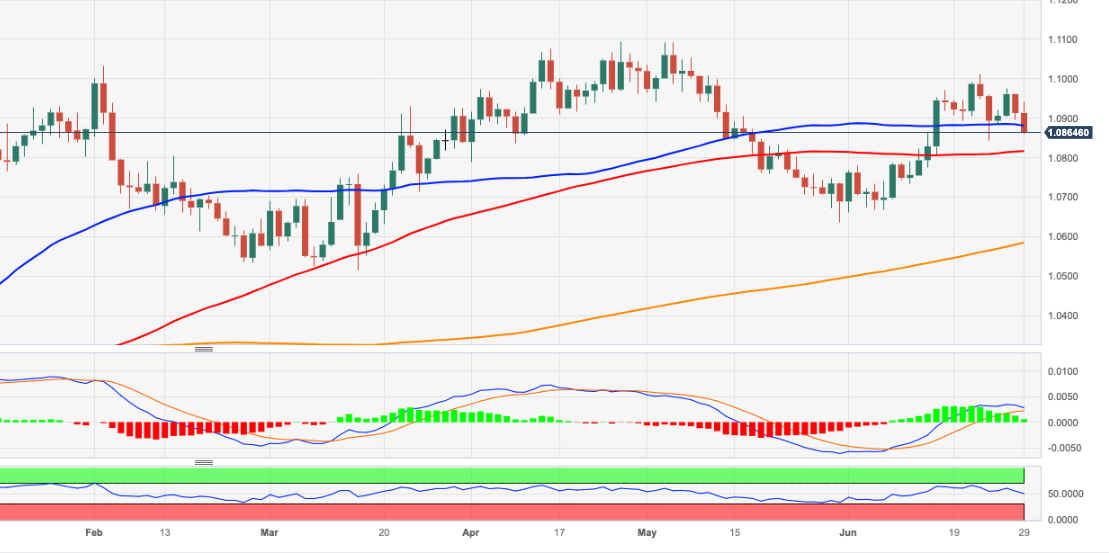
EUR/USD is back on the bids, trading close to 1.0950 in the European trading hours on Wednesday. The pair finds support from a recovery in risk sentiment and negative US Treasury bond yields, weighing on the US Dollar.

EUR/USD trades dangerously close to 1.0920, where the 200-period Simple Moving Average (SMA) on the 4-hour chart is located. Just below that level, the lower-limit of the ascending regression trend channel aligns as next support at 1.0900. A 4-hour close below the latter could attract technical sellers and open the door to an extended decline toward 1.0850 (Fibonacci 38.2% retracement of the latest uptrend).

On the upside, near-term resistances are located at 1.0960-1.0970 (Fibonacci 23.6% retracement, 100-period SMA), 1.1000 (psychological level, static level) and 1.1050 (mid-point of the ascending channel).

EUR/USD edged lower on Tuesday as the risk-averse market atmosphere helped the US Dollar (USD) gather strength against its rivals. The pair struggles to stage a rebound early Wednesday and trades below 1.0950.

The bearish opening in Wall Street provided a boost to the USD in the American session on Tuesday and caused EUR/USD to stretch lower. In the European morning, US stock index futures trade modestly lower on the day as investors grow increasingly concerned over the potential impact of escalating geopolitical tensions in the Middle East on energy prices and inflation. According to the CNBC News, Iran-backed Houthi militants launched the largest attack to date on commercial merchant vessels in the Red Sea late Tuesday.

The US economic docket will not feature any high-impact data releases on Wednesday and market participants will pay close attention to the 10-year US Treasury note auction. Since rising to 4.61% in October auction, the high-yield declined to 4.5% and 4.29% in November and December, respectively. In case the high-yield comes in below 4% in January auction, the USD could come under renewed bearish pressure and help EUR/USD gain traction.

Later in the American session, Federal Reserve Bank of New York President John Williams will be delivering a speech. Following the December policy meeting, Williams said that it was premature to talk about the timing of a policy pivot. In case Williams clings to the hawkish tone, the USD could hold its ground.

US Dollar (DXY) Latest: EUR/USD and GBP/USD on Hold Ahead of US CPI

US Dollar (DXY) Latest: EUR/USD and GBP/USD on Hold Ahead of US CPI

The US dollar is little changed in opening trade Wednesday, leaving a range of USD pairs in limbo. The US dollar index is seen consolidating its recent move higher, and with no guidance from the rates market, this is likely to remain the case until the latest US inflation report is released on Thursday at 13:30 UK.

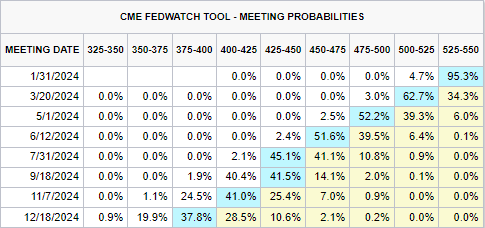
Financial markets are still pricing in a total of 150 basis points of US interest rate cuts this year, with the first 25 basis point move forecast at the March 20th FOMC meeting.

CME Fed Watch Tool

image1.png

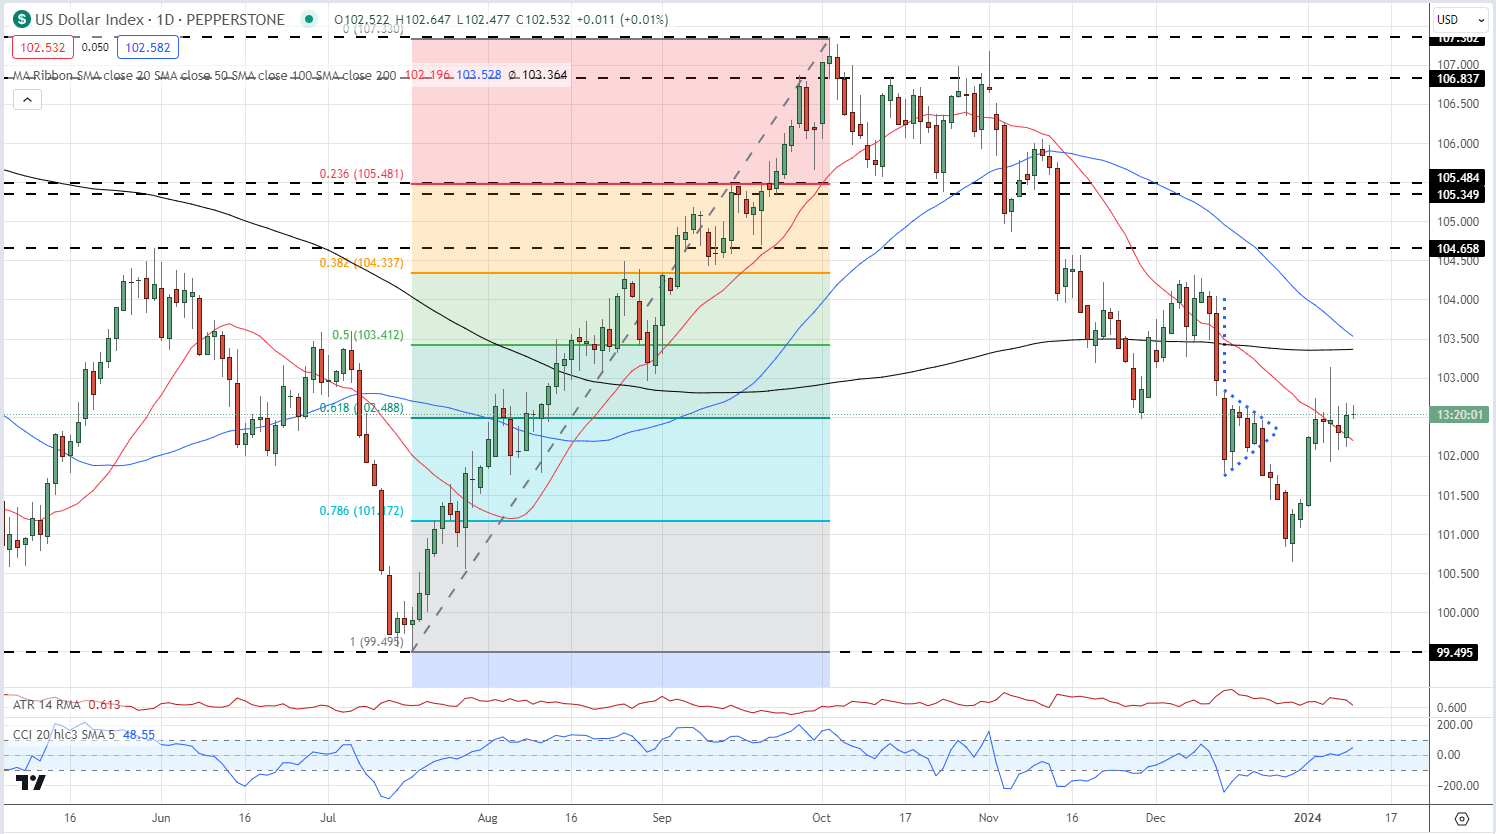
The US dollar index chart shows the greenback in a short-term consolidation phase and is constrained by last Friday’s jobs report candle. The daily chart does show a conflicting set of moving averages with the 20-day sma currently supporting the dollar index, while the 50-/200-day sma is seen setting up a negative ‘death cross’ in the coming days. The dollar index is also sitting on the 61.8% Fibonacci retracement of the mid-July to early-October move, while the CCI indicator is pointing higher but remains in neutral territory.

US Dollar Index Daily Chart

image2.png

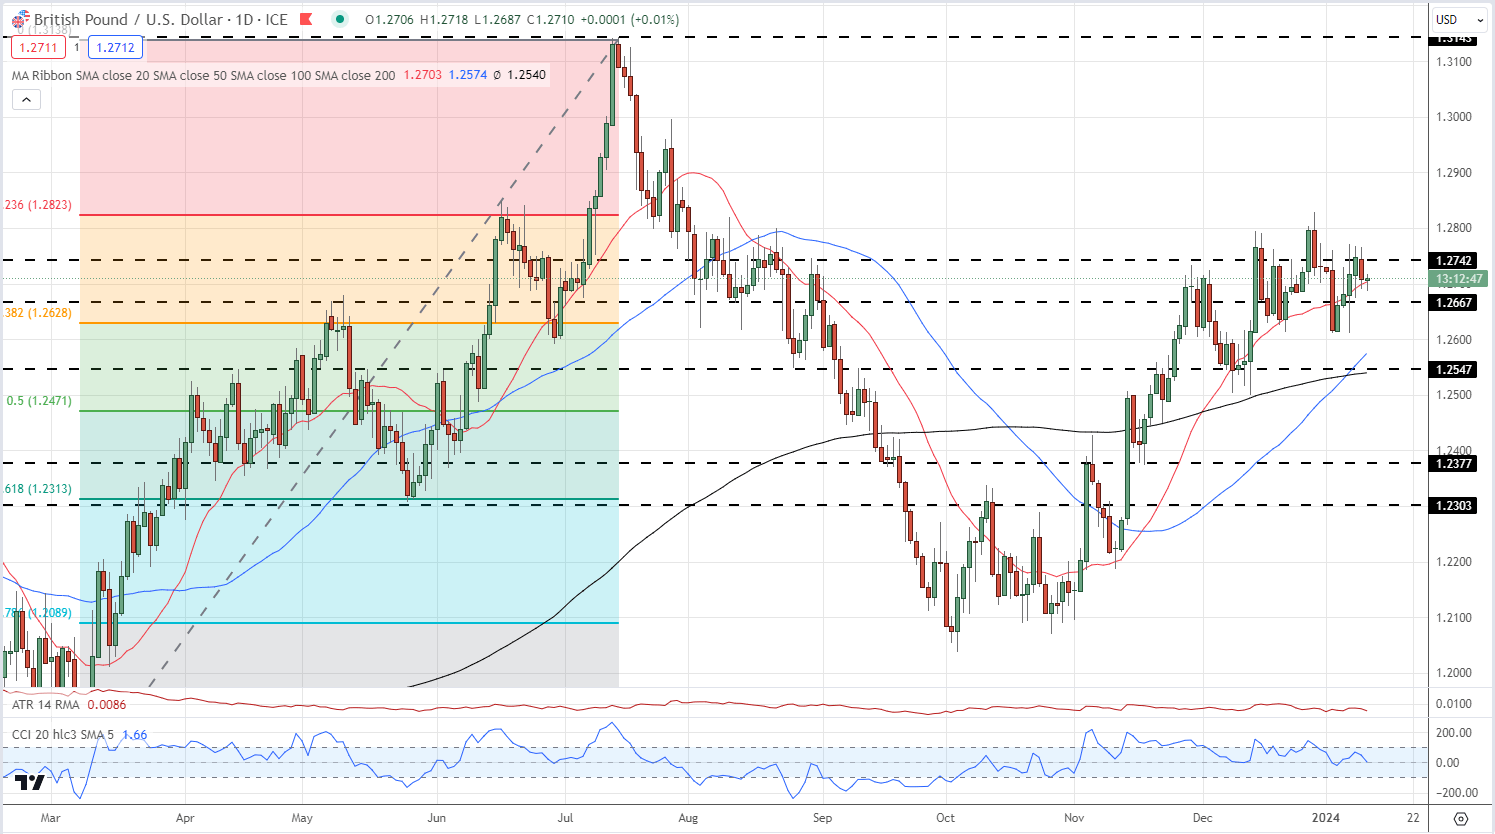
GBP/USD is keeping hold of its recent gains and remains within touching distance of making a fresh multi-month high (1.2828). The 20-day sma is trying to act as support, while the 50-/200-day moving averages made a bullish ‘golden cross’ late last week. The CCI indicator is neutral. Initial support is seen at 1.2667 ahead of 38.2% Fibonacci retracement at 1.2630. A break above 1.2828 would leave 1.3000 as the next target.

The Golden Cross

GBP/USD Daily Chart

image3.png

IG retail trader data shows 50.30% of traders are net-long with the ratio of traders long to short at 1.01 to 1.The number of traders net-long is 16.90% higher than yesterday and 11.84% lower than last week, while the number of traders net-short is 12.70% lower than yesterday and 20.19% higher than last week.

We typically take a contrarian view to crowd sentiment, and the fact traders are net-long suggests GBP/USD prices may continue to fall.

See how daily and weekly sentiment changes can affect GBP/USD price action

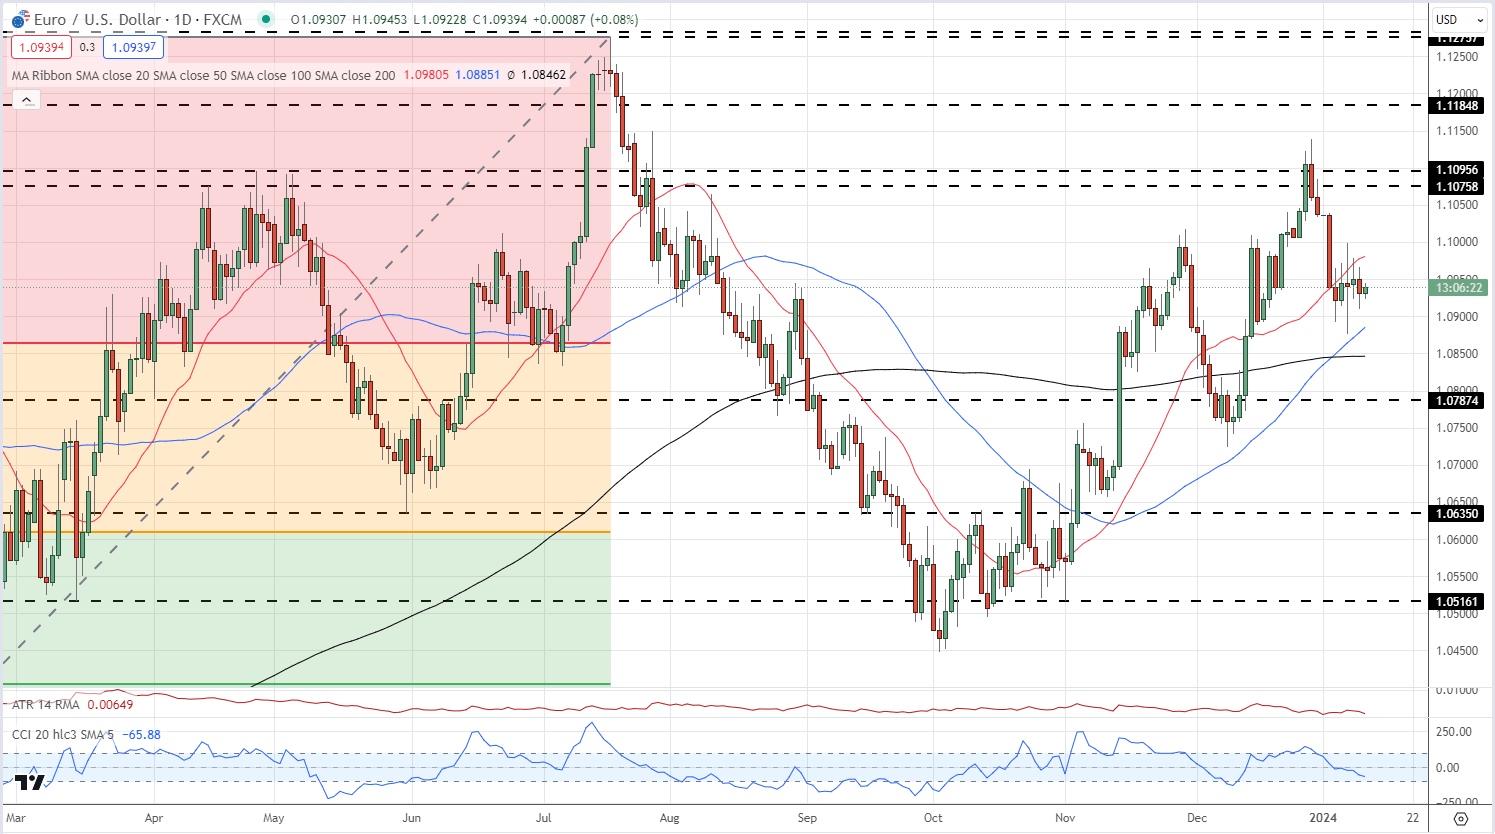
The EUR/USD chart is mixed with the current spot price stuck between the 20- and the 50-/200-day moving averages. As with GBP/USD a ‘golden cross’ was made last week, providing support for the pair, while the CCI indicator is neutral. Initial support is seen around 1.0900.

EUR/USD Daily Chart

image4.png

How to Trade Before a News Release

How to Trade Before a News Release

Trading the ‘news’ before it happens, or in the lead up to an economic data release, is often viewed as less exciting than the fast-paced environment of trading during or after the release. However, there are many underutilized opportunities that present themselves during this less volatile period that forex traders can hunt for. This article will explain how to identify forex trades in the lead up to a news release or announcement using two specific strategies: pre-release trend following strategy and pre-release calm strategy.

Other articles in this series:

Pre-Release Trend Following Strategy

Pre-release trend following strategy

A pre-release trend following strategy focuses on the short-term trend in the lead up to the news release and requires traders to bring up a daily chart with a 10-day simple moving average (SMA).

Traders are expected to enter the trade before the news, in the direction of the short-term trend; aiming to ride any increased volatility further in the direction of the trend, after the news has been released. Additionally, this strategy works if the news results in a low volatility environment as the market is likely to then continue in the direction of the existing trend.

Traders gravitate towards this strategy when the data to be released is anticipated to be in line with expectations. Data that comes out in line with expectations generally reduces the impact of the release and reduces the potential of the news to disrupt the existing trend.

With this strategy, traders have the opportunity of entering at the start of an accelerating trend in order to capitalize on as much of the advancing market as possible.

The risk when using this strategy arises when the news comes out contrary to expectations which has the potential to send the market in the opposite direction with increased volatility.

The strategy can be implemented using the following steps:

  1. Establish the short-term trend: Use a 10-day moving average to assess whether the market is in a short-term uptrend (price trading above the 10-day SMA) or in a short- term downtrend (price trading below the 10-day SMA)
  2. Enter the trade: Enter the trade five minutes before the news release in the direction of the trend
  3. Manage risk: Set stops and limits while adhering to a positive risk-to-reward ratio
  4. Manage the trade: If the volatility created after the news pushes the market quickly towards the target, traders can consider closing half the position at the target level and moving the stop up to the target level in the event that there is still more momentum in the market.

Pre-Release Calm Strategy

Pre-release calm strategy

The pre-release calm strategy looks to trade within a range that develops when the market is relatively quiet leading up to the release. Due to the relative lull in the market, traders often overlook this opportunity and wait to trade after the news when the market is more unpredictable.

The pre-release calm strategy is of a shorter time frame when compared to the pre-release trend strategy, as you enter and exit before the news is released. Since nobody knows for sure what the data is going to show, this strategy suits the more risk averse trader – being in and out of the trade before the data has the opportunity to move the markets in an unfavorable way.

Using a five-minute chart, identify support and resistance levels over the 48 hours prior to the major news release. Often, in the beginning of the month there are central bank rate announcements before the major news release of US non-farm payrolls. This strategy can be implemented in the quiet period in between the announcements and the US non-farm payrolls.

Volume is often light so price will have a tough time pushing through those levels and as a result, the market can often be described as non-directional (trading in a short-term range).

The pre-release calm strategy can be implemented using the following steps:

  1. Adjust chart time frame: Scroll down to the 5-minute chart and observe the 48-hour period before the news release
  2. Analyze the 48-hours prior to release: Identify and draw levels of support and resistance over the 48-hour period to define the short-term range.
  3. Time entries: Traders can look to buy at support and short at resistance, placing stops below support and above resistance. Targets for long trades can be set at resistance and targets for short positions can be placed at support.

Trading the News Before the Release: Conclusion

Trading before the news release allows traders to enter the market efficiently and at their price when the market is less volatile. This approach also allows traders the option of trading short term ranges and short-term trends – providing more opportunity to trade.

However, depending on the importance of the news, it is possible for markets to experience significant volatility before the release. When this occurs traders should consider a post-release strategy instead.

Trading the News FAQs

Sometimes the market is highly volatile leading up to the release, how should I approach this?

When the market is volatile in the lead up to the release, the above strategies are no longer viable. This underscores the importance of analysing the market before adopting a strategy. In this scenario it may be better for traders to monitor the market after the release, once the market has shown its hand and picked a direction or range to trade in. Learn how to trade forex after the news release.

Trading Forex at the News Release

Trading Forex at the News Release

Forex News Trading Strategies

There are two common strategies for trading forex at the news release:

  1. Initial Spike Fade strategy
  2. News Straddle strategy

Each one provides a robust plan for traders to follow, depending on the market environment observed at the time of the release, and how best to approach that particular market.

Before reading further it is essential that you have a good grasp on the basics of news trading. If you are new to trading or simply require a refresher, take a look at our introduction on how to trade forex news.

1. Initial Spike Fade Strategy

This strategy looks to capitalize on an overreaction in the market over the short term by fading the initial move. This strategy suits reversal traders, scalpers and day traders due to fast moving and erratic pricing that often follows a major news release.

Overreactions and subsequent reversals are seen fairly regularly in the forex market as large institutions add to the increased volatility of the initial move. The market as a whole, often spikes as an overreaction and subsequently push price back toward pre-release levels.

Once the market calms down and spreads return to normal, the reversal often gains momentum showing early signs of a potential new trend.

The shortfall associated with this strategy is that the initial spike may turn out to be the start of a prolonged move in the direction of the initial spike. This underscores the importance of using well-defined stops to limit downside risk and get you out of a bad trade quickly.

How to implement initial spike fade strategy:

  1. Select the relevant currency pair: Ensure the major news event corresponds to the desired currency pair to trade, i.e. Non-Farm Payrolls will affect USD crosses.
  2. Switch to a five-minute chart: After selecting the desired market, switch to a 5-minute chart just before the news release.
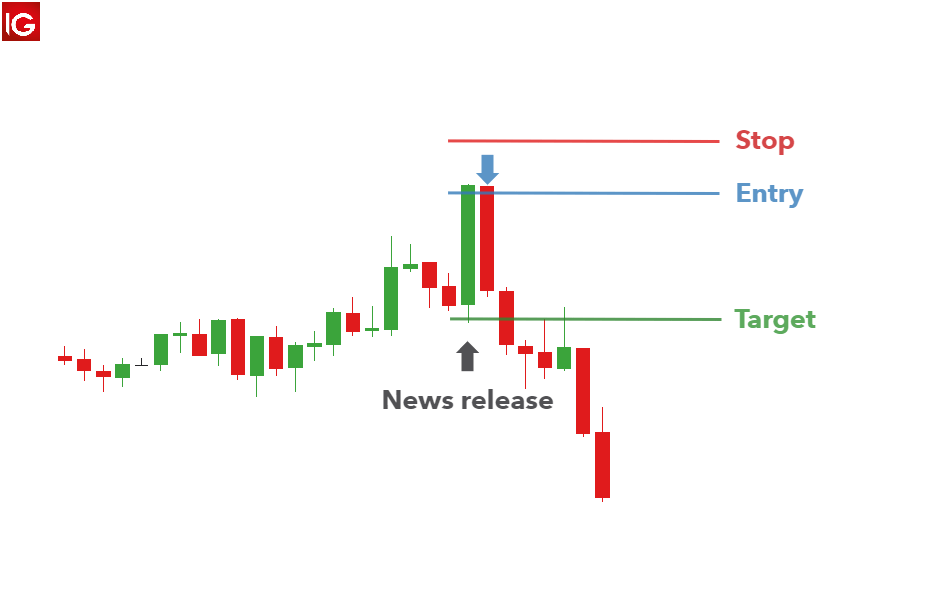
  3. Observe the close of the first five-minute candle: The first five-minute candle is usually quite large. When price approaches either the spike high or the spike low, fade the move by trading in the opposite direction.
  4. Stops and limits: Stops can be placed 15 pips above the high for a short trade or 15 pips below the low for a long trade. Targets can be set at two or three times the distance of the stop.

initial spike fade strategy in forex news trading

2. News Straddle Strategy

The news straddle strategy is perfect for traders expecting a huge surge in volatility but are unsure of the direction. This strategy lends its name from a typical straddle strategy in the world of options trading as it uses the same core strategy – to capitalize on an increase in volatility when direction is uncertain.

The disadvantage of the news straddle approach surfaces when price breaks support or resistance only to reverse soon thereafter. Similarly, price can trigger the entry order and move toward your target only to reverse until a stop it hit.

This strategy can be implemented using the following steps:

  1. Establish a range with support and resistance.
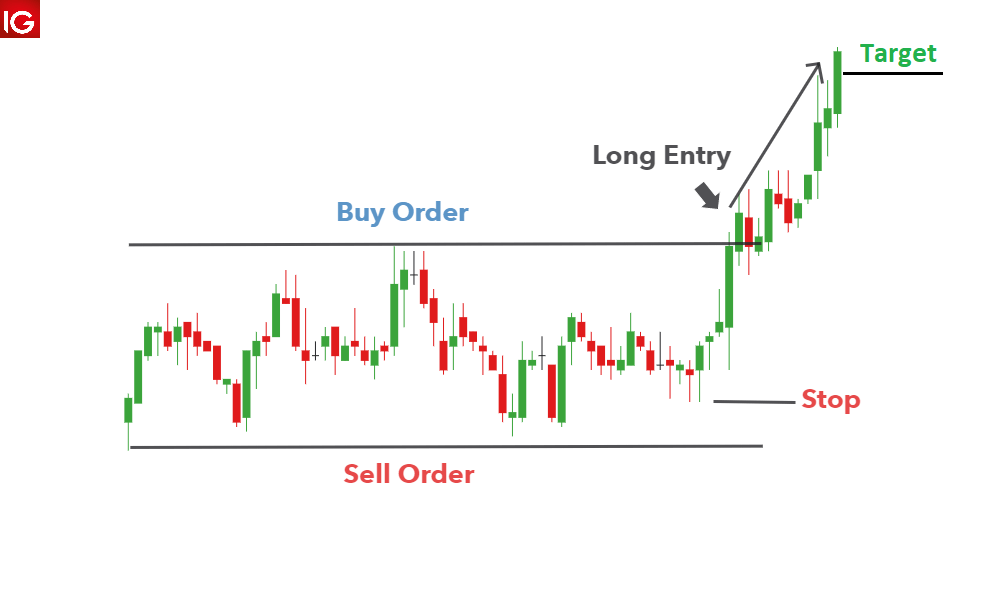
  2. Set two orders to open: Set a working order/ entry order to open a long trade if price breaks above resistance and one to go short if price trades below support.
  3. Remove remaining order after confirming direction: The market has the potential to breakout of the range and once this happens, the one entry order will be triggered, and a trade will be opened. Immediately remove the entry order that was not triggered.
  4. Stops and limits: A tight stop can be placed at the recent range low when going long and recent high when going short. Limits can be placed in line with a positive risk to reward ratio.

Straddle news trading strategy

Trading the News During the Release: Conclusion

Trading forex news at the news release has the potential to overwhelm traders with increased volatility in a short period of time. However, through the adoption of a solid strategy, traders can approach these volatile periods with greater confidence and mitigate risk of a runaway market through the use of guaranteed stops (where available).

Take a look at what our in-house analysts have forecasted as the top trading opportunities for the year.

Trading Forex News Releases FAQs

How can I tell which direction the market will trade after at the release?

Forecasting the economic news release is one thing, predicting how traders will react to the news release is quite difficult. When estimations are unsurprising or more or less similar to the previous recorded number, the market tends to digest this information and it is reflected in the lead up to the release. However, there is no guarantee that the market direction/trend will be maintained even if the news comes out exactly as was estimated. This is because different market participants can draw different conclusions that will influence their trades.

Someone may consider data that prints in line with expectations as a bad thing and someone else may view it as a good thing. The bottom line is that traders need to have a strategy in place with predetermined risk parameters.

How to Trade After a News Release

How to Trade After a News Release

Post-release trading strategies

1. Trend following strategy

This strategy involves the use of multiple time frames, as well as, well-defined levels of support and resistance that come into play after a news release.

Traders can adopt this strategy when the current market price is approaching a well-defined level of support or resistance but isn’t quite there yet. The volatility after the news release has the potential to push the market toward the trendline. If price respects the trendline, traders can look to trade in the direction of the trend and trade the potential bounce.

The following 4 points are of assistance for this type of trade:

  1. Determine trend direction on a daily chart
  2. Draw support and resistance lines
  3. Select a forex time frame anywhere from 1 – 4 hours
  4. Buy near support in uptrend and sell near resistance in downtrend

Keep in mind that news releases have the potential to break through longstanding levels of support and resistance which underscores the importance of using tight stops when pursuing this strategy.

Post-release trend following strategy

2. Dual spike breakout strategy

This strategy involves waiting for market volatility to reveal a range before trading a break of that range and makes use of a five-minute chart. For illustrative purposes this section incorporates the US Non-Farm Payroll (NFP) release as this often has the greatest potential to move the market.

After the NFP release, wait 15-minutes for three five-minute candles to close. Take note of the highest price and the lowest price of the three closed candles. Next, place an entry order to go long at the highest price and an entry to go short at the lowest price. Once an order is triggered, targets can be set at twice the distance of the high/low channel while stops can be set above resistance for short trades and below support for long trades.

The disadvantage of this strategy is that volatility can push price above or below the short-term range, triggering an entry order, and then immediately reversing to hit a stop loss.

This strategy can be applied in the following way:

  1. Customize the chart settings to show 5- minute charts
  2. Take note of the highs and lows of the first three candles
  3. Set entry orders when price breaks above or below the range
  4. Set stops and limits
  5. Delete the unfilled order

Dual spike forex news trading strategy

<alt image desc> Dual spike forex news trading strategy

3. News Reversal Strategy

The market can trade in one direction immediately after a major news release only to reverse and trade in the opposite direction.

The news reversal strategy looks to trade the news after the release and focuses on a sudden, sustained reversal in direction after a strong initial move in price.

The reversal could be the result of algorithms or, the market as a whole, feeling that there was an overreaction in price – prompting trades in the opposite direction.

The downside of this strategy is that no reversal takes place and the price continues trading in the direction on the initial spike.

How to implement the news reversal strategy:

  1. Initial spike in price: News with great market moving potential generally lead to a spike in price as the news is released.
  2. Look out for a reversal: Traders can wait 10-15 minutes for the reversal to bring price back to where it was before the release.
  3. Entry: Enter as price breaks above/below pre-release levels.
  4. Set multiple target levels: Traders should consider setting multiple target levels. As one is triggered, traders can take profit on half of the position and adjusting the stop on the remaining position to breakeven.

News reversal trading strategy

Trading forex after the release: Conclusion

Trading the news after the release can be a more conservative way to approach news trading. This is due to the emotions from the news release subsiding allowing a trader time to plan a technical set up for their trade. Regardless of your trading approach to news trading, risk management and utilizing small amounts or no leverage is critical to maintaining capital in your account to make the next trade.

Technical vs Fundamental Analysis in Forex

Technical vs Fundamental Analysis in Forex

Fundamental Analysis

Fundamental analysis involves assessing the economic well-being of a country, and by extension, the currency. It does not take into account currency price movements. Rather, fundamental forex traders will use data points to determine the strength of a particular currency.

A fundamental forex trader will analyze the country’s inflation, trade balance, gross domestic product, growth in jobs and even their central bank’s benchmark interest rate.

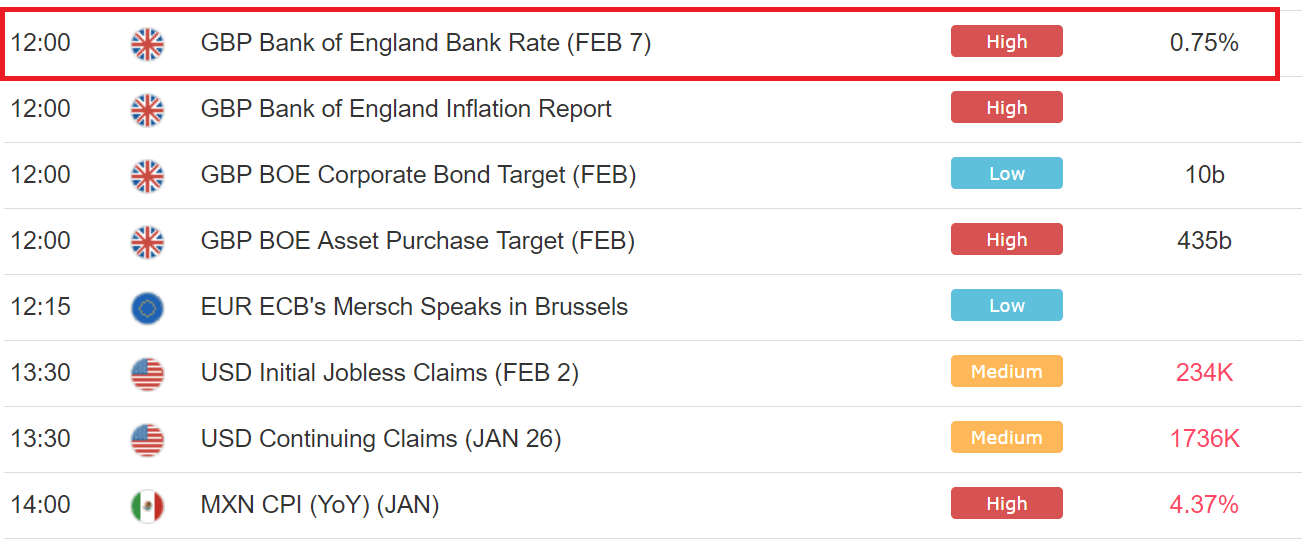
Below is an example of an economic calendar where fundamental traders will be able to keep up to date with the latest data releases. There are many data releases on any given day which is why traders should know how to filter the calendar to show relevant information only.

Fundamental analysis economic calendar

By assessing the relative trend of this and other data points, a trader is analyzing the relative health of the country’s economy and whether to trade the future movement of that country’s currency.

The table below summarizes the general effects that different economic data tends to have on the strength of a currency. However, this is not guaranteed as there are many factors that influence currency movements.

How economic data affects currencies

Expectations Effect on currency
Gross Domestic Product (GDP) Better than expected Positive
Consumer Price Inflation (CPI) Better than expected *Positive
Trade Balance Trade deficit (imports > exports) Negative
Central Bank benchmark rate Increase in interest rate Positive
ISM Manufacturing Index Better than expected Positive
PPI Producer Price Index Better than expected Positive

*Developed nations welcome moderate inflation as it is a sign of a growing economy. Developing nations view decreasing, or maintained, inflation as a positive statistic as this keeps price levels in check.

Technical Analysis

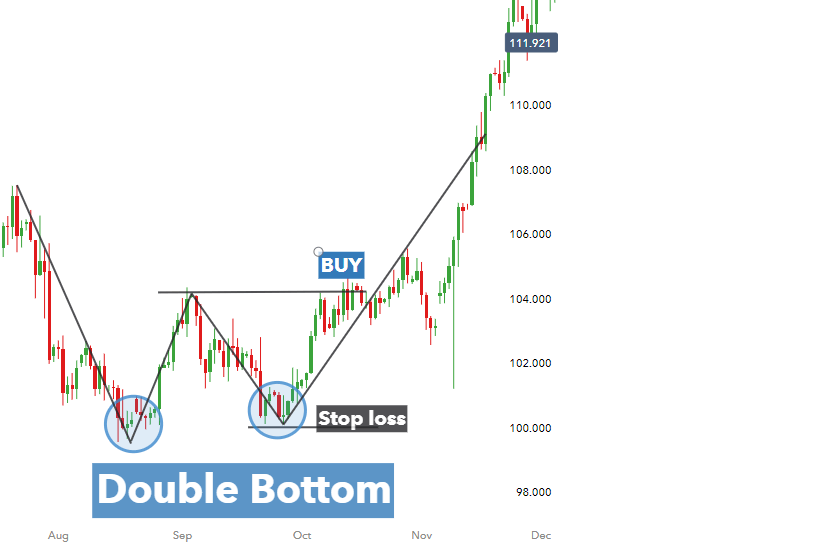
Technical analysis involves pattern recognition on a price chart. Technical traders look for price patterns such as triangles, flags, and double bottoms. Based on the pattern, a trader will determine the entry and exit points. Unlike fundamental traders, a technical trader is not as concerned about why something is moving because the trends and patterns on the charts are their signals.

Below is an example of a chart pattern – the double bottom pattern. The market makes the first low, rebounds slightly before creating a new low and subsequently gains upward momentum as the trend reverses. Technical traders will look to set a stop loss at the recent (lowest) low and wait for the market to produce higher highs and higher lows before placing the long trade.

Head and shoulders pattern in technical analysis

In practice, technical traders will need to identify the pattern as shown below on the USD/JPY daily chart where the “W” shape can be seen.

Double bottom chart pattern for USDJPY in technical analysis

A technical forex trader will assess the price action, trend, support and resistance levels observed on a chart. Many of the patterns used in technical analysis of forex markets can be applied to other markets as well.

Additionally, traders make use of indicators and oscillators which are added to a price chart when analyzing foreign exchange markets. Moving averages, Bollinger Bands, MACD, Relative Strength Index (RSI), and stochastic tend to be some of the more common tools in a technical traders tool box. Indicators are preferred by technical traders because they are easy to use and provide clear signals.

The benefits of technical analysis

Technical analysis does not include ‘black magic’ that many fundamentalists claim. Getting started in technical analysis can be done quickly by assessing the direction and strength of trends. Traders will use the trend analysis to help them determine which pair to trade and the direction to trade it.

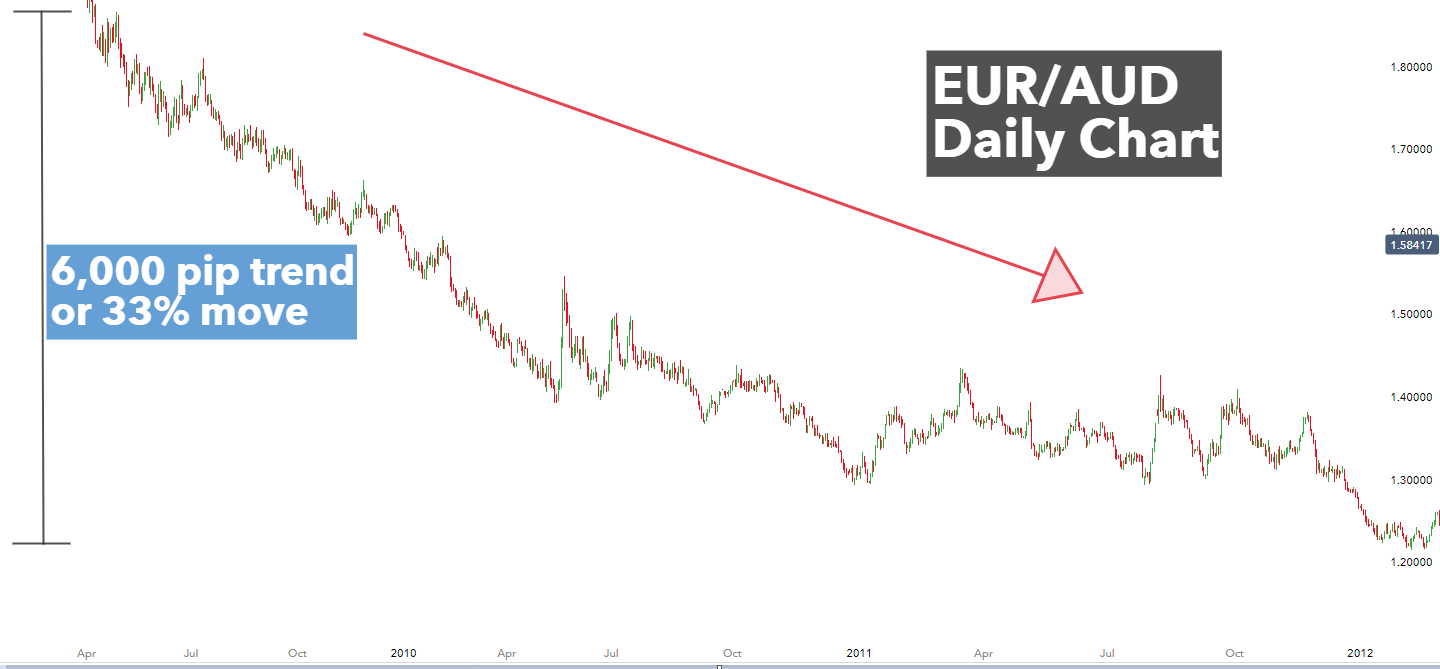
Below, is an example of how a technical trader would notice this 6,000 pip trend where the AUD is very strong relative to a very weak EUR (which is why the currency pair is moving down). Furthermore, it is clear to see that the currency pair is trading in a strong downward direction. This is referred to as a tend and traders make use of key levels, levels of support and resistance, and indicators to identify trends as soon as possible and with accuracy.

EUR/AUD daily chart showing strong downtrend

Finding out how to identify strong and weak currencies will provide traders with an indication of which currency pairs are most likely to trend and therefore lead to higher probability trades. A trader would trade in the direction of this particular trend by selling the EUR/AUD pair.

Technical vs Fundamental Analysis in Forex: Conclusion

Fundamental and technical analysis involve very different strategies and approaches to trading; offering unique value and insights to support trading decisions, and when to enter or exit a trade. While some traders prefer to use these types of analysis separately based on their preferred trading style and goals, many use a combination of the two. The benefits of combining fundamental and technical analysis are wide ranging.

USD/JPY Price Outlook: The Pair Faces Major Support Cluster Pre-CPI

USD/JPY Price Outlook: The Pair Faces Major Support Cluster Pre-CPI

Light Economic Calendar Looks to US CPI for Direction

It is a rather calm week in the FX space as can be expected for this time of year and given the relatively low amount of high impact economic data, apart from US CPI and UK GDP while you can throw in the start of the US earnings season to the mix as well.

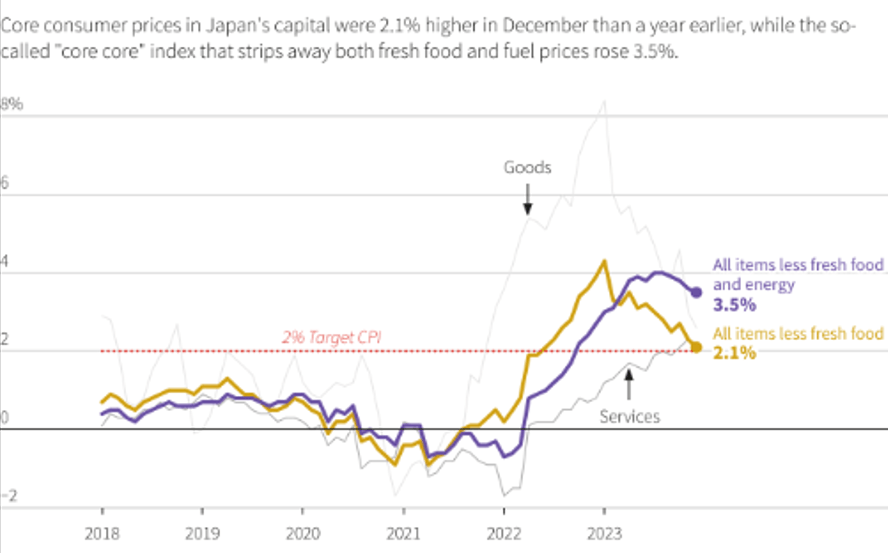
Speaking of economic data, inflation figures for Tokyo suggested that inflation in the capital is struggling to make progress as it has broadly been in decline for some months already. All items less fresh food (core CPI) and all items less fresh food and fuel (core core) declined to 2.1% and 3.5%, respectively.

The Bank of Japan (BoJ) is in the process of assessing the urgency around a pivotal policy shift (hiking rates into positive territory) to combat persistently high inflation – something that cannot be confirmed yet. Price data in Tokyo helps to inform wider national measures as Tokyo accounts for around 20% of Japanese GDP and forms an integral part of the economy.

While national CPI has breached the 2% target for over a year now, the BoJ is yet to be convinced that price pressures will persist above target but is also looking for compelling evidence that the inflation profile has shifted away from a ‘cost push’ issue, towards a ‘demand pull’ phenomenon. Persistently rising wage growth is also imperative if the BoJ is to reverse accommodative policy.

Tokyo’s Core Inflation Slows Further (yellow/gold line)

image1.png

Source: LSEG,

Elevate your trading skills and gain a competitive edge. Get your hands on the Japanese Yen Q1 outlook today for exclusive insights into key market catalysts that should be on every trader’s radar:

USD/JPY at Major Decision Point Ahead of US CPI

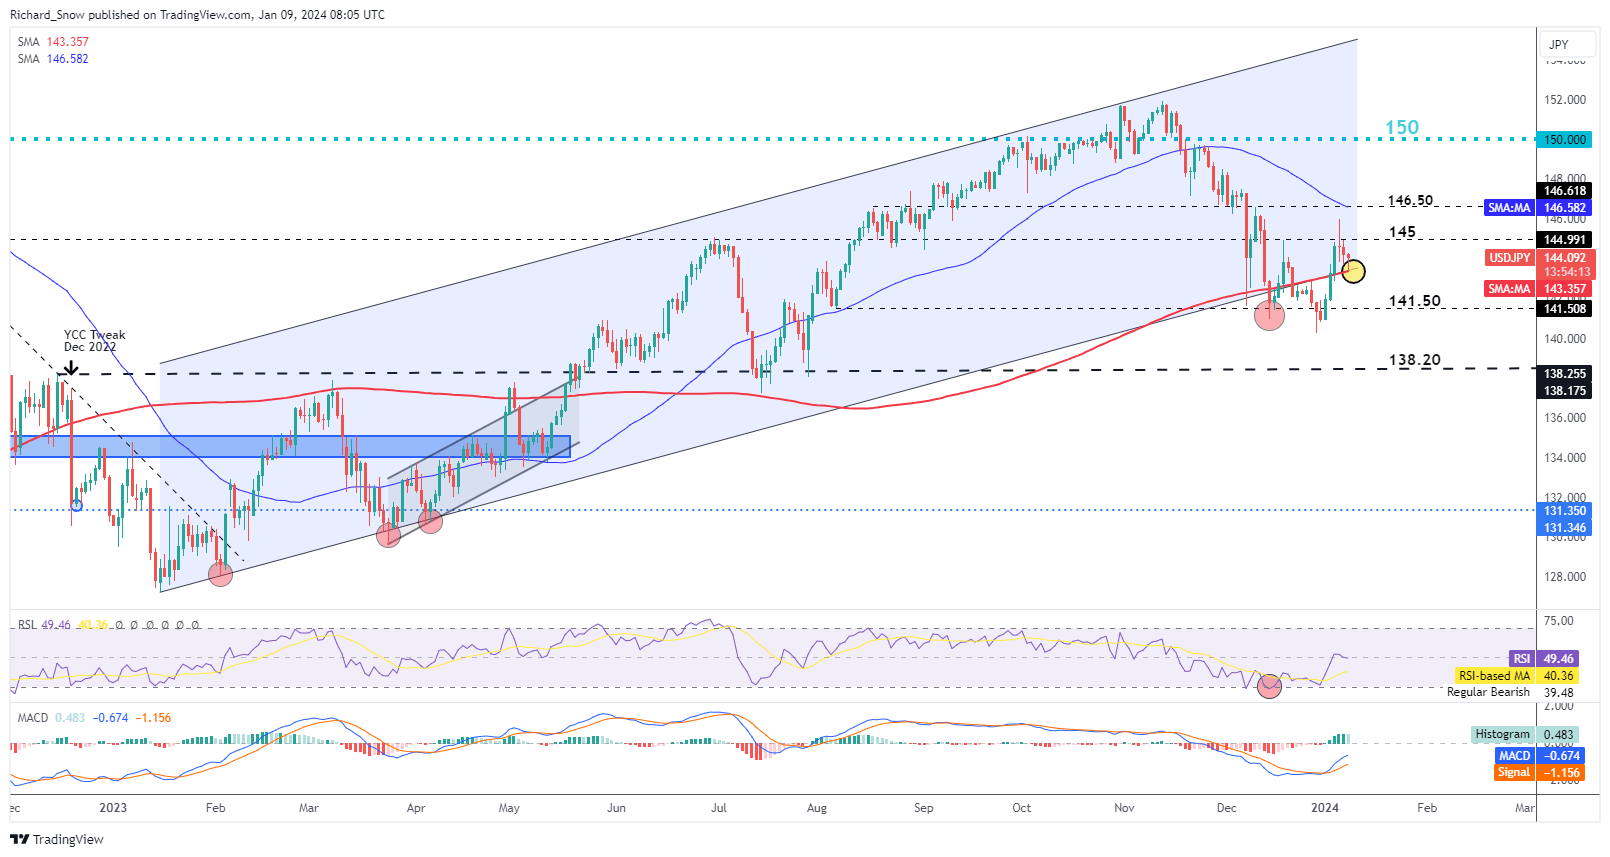
USD/JPY turned higher after reaching the late December swing low but momentum was culled last Friday after the ISM services PMI report revealed a sharp drop in the composite measure as well as the employment component of the report. Admittedly, the drop can be attributed to fewer hires and less so to increased layoffs, but the lower reading speaks to a labour market that is easing, while remaining resilient overall.

Today, the pair is slightly softer and tests an immediate cluster of support which is comprised of the 200 simple moving average (SMA) and channel support. Both markers overlap at the 143.35 level. The threat of a BoJ policy change has cooled during the early days of 2024 after an earthquake hit the island.

Channel support could offer clues about future price action should it hold past Thursday when the US is scheduled to post core and headline inflation figures for December. A lower core print is anticipated while headline CPI is expected to hold flat with any surprised to the downside likely to see that cluster of support come under pressure.

USD/JPY Daily Chart at Major Decision Point

image2.png

The CPI and Forex: How CPI Data Affects Currency Prices

The CPI and Forex: How CPI Data Affects Currency Prices

What is CPI and why does it matter to forex traders?

The Consumer Price Index, better known by the acronym CPI, is an important economic indicator released on a regular basis by major economies to give a timely glimpse into current growth and inflation levels.

Inflation tracked through CPI looks specifically at purchasing power and the rise of prices of goods and services in an economy, which can be used to influence a nation’s monetary policy.

CPI is calculated by averaging price changes for each item in a predetermined basket of consumer goods, including food, energy, and also services such as medical care.

It is a useful indicator for forex traders due to its aforementioned effect on monetary policy and, in turn, interest rates, which have a direct impact on currency strength. The full utility of knowing how to interpret CPI as a forex trader will be explored below.

CPI release dates

CPI release dates usually occur every month, but in some countries, such as New Zealand and Australia, quarterly. Some nations also offer yearly results, such as Germany’s index. The US Bureau of Labor Statistics has reported the CPI monthly since 1913.

The following table shows a selection of major economies and information about their CPI releases.

Country/jurisdiction Compiling body Frequency of releases
Australia Australian Bureau of Statistics Quarterly
Canada Statistics Canada Monthly
China National Bureau of Statistics of China Monthly
Eurozone European Central Bank Twice monthly
Germany Federal Statistical Office of Germany Monthly, yearly
Italy Istat Monthly
India Ministry for Statistics and Programme Implementation Monthly
Japan Statistics Japan Monthly
UK Monetary Policy Committee Monthly
US US Bureau of Labor Statistics Monthly

Why forex traders should follow CPI data

Understanding CPI data is important to forex traders because it is a strong measure of inflation, which in turn has a significant influence on central bank monetary policy.

So how does CPI affect the economy? Often, higher inflation will translate to higher benchmark interest rates being set by policymakers, to help dampen the economy and subdue the inflationary trend. In turn, the higher a country’s interest rate, the more likely its currency will strengthen. Conversely, countries with lower interest rates often mean weaker currencies.

The release and revision of CPI figures can produce swings in a currency’s value against other currencies, meaning potentially favorable volatility from which skilled traders can benefit.

Also, CPI data is often recognized as a useful gauge of the effectiveness of the economic policy of governments in response to the condition of their domestic economy, a factor that forex traders can consider when assessing the likelihood of currency movements.

The CPI can also be used in conjunction with other indicators, such as the Producer Price Index, for forex traders to get a clearer picture of inflationary pressures.

What to consider when trading forex against CPI data

When using CPI data to influence forex trading decisions, traders should consider the market expectations for inflation and what is likely to happen to the currency if these expectations are met, or if they are missed.

Similar to any major release, it may be beneficial to avoid having an open position immediately before. Traders might consider waiting for several minutes after the release before looking for possible trades, since forex spreads could widen significantly right before and after the report.

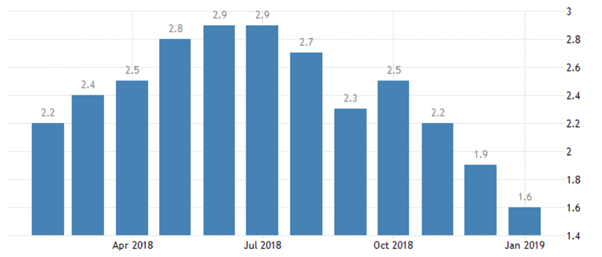
Below is a chart displaying the monthly inflation rates for the US. For the latest month, expectations are set at 1.6% inflation compared to last year’s data. If CPI is released higher or lower than expectations this news event does have the ability to influence the market.

Chart to show US inflation levels in 2018/19. Source: TradingEconomics.com. US Bureau of Labor Statistics

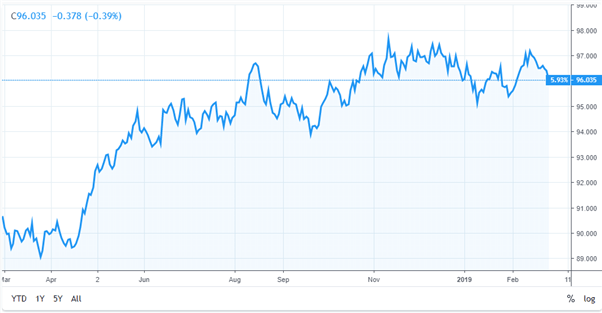
One way the effects of CPI data can be interpreted is by monitoring the US Dollar Index, a 2018/19 example chart for which is below. If CPI is released away from expectations, it is reasonable to believe this may be the catalyst to drive the Index to fresh highs, or to rebound from resistance.

Since the Index is comprised of EUR/USD, USD/JPY, and GBP/USD, by watching the US Dollar we can get a full interpretation of the events outcome.

As can be observed in the example above, as inflation rose during the first half of 2018, the US Dollar Index went up accordingly. But with US inflation drifting lower in the following months and with a missed target of 2%, this pushed US interest rate hikes off the agenda. As a result, the dollar struggled and weakened against a basket of other currencies.

Not every fundamental news release works out through price as expected.

Once the CPI data has been released and analyzed, traders should then look to see if the market price is moving through or rebounding off any areas of technical importance. This will help traders understand the short-term strength of the move and/or the strength of technical support or resistance levels, and help them make more informed trading decisions.

How to use the PPI in Forex Trading

How to use the PPI in Forex Trading

Using PPI to trade forex: Talking points

  • PPI stands for the Producer Price Index, which is an important piece of economic data
  • PPI data is released during the second week of each month.
  • Forex traders can use PPI as a leading indicator to forecast consumer inflation measured by the Consumer Price Index (CPI).

PPI is an important piece of economic data due to its signaling effect on future expected inflation. Traders monitor PPI in forex trading because of the positive relationship between inflation and interest rates, but ultimately, traders are concerned with how the resultant interest rate changes are likely to affect currency pairs. Continue reading to learn more about the PPI index and how it affects the foreign exchange market.

What is PPI and what does it measure?

PPI stands for Producer Price Index and measures the change in the price of finished goods and services sold by producers. PPI data represents the monthly change in the average price of a basket of goods purchased by manufacturers.

How is PPI calculated?

PPI examines three production areas; commodity-based, industrial-based, and stage-of-processing-based companies. Released by the Bureau of Labor Statistics, PPI is created using data collected from a mailed survey of retailers selected via a process of systematic sampling of all firms listed with the Unemployment Insurance System.

Traders can see changes in PPI expressed as a percentage change from the previous year, or on a month to month basis.

PPI and inflation

A positive change in the PPI index implies that costs are rising and, in the end, price increases get passed down to consumers. If this effect is large enough, there will be an increase in future CPI figures to reflect that the general level of prices has increased.

PPI is a leading indicator of inflation

Inflation and the effect on the economy

An increase in the general price level is good for an economy but only when this is contained. When demand for goods and services increases, businesses must increase capital expenditure and hire more workers in order to increase their output to meet higher demand. The problem arises when prices increase drastically, resulting in a decrease in the purchasing power of a country’s currency. $1 can buy less than it could one year ago, for example.

In the 1950s, gasoline was $0.27, while apartment rent was $42/month and a movie ticket was $0.48. These figures are nowhere near to where they are today, and this reflects how inflation erodes the value of local currency. In an attempt to combat the erosion of purchasing power, central banks effectively reduce inflation by raising the benchmark interest rate.

How does PPI impact currencies?

When it comes to money there is always a trade-off: individuals can save money and earn interest, or they can spend money immediately and forgo any interest payments.

If PPI is on the rise it may cause the interest rates to rise. When interest rates go up, electing to save money looks more attractive as the reward (interest) is greater than before. Spending money becomes costlier because consumers would effectively be losing out on the higher interest rate when they choose to spend money instead of saving. As a result, increased PPI may filter down into increased rates and a stronger currency.

Using the Euro as an example, forex traders know that higher interest rates results in increased financial flows by foreign investors wanting to buy the higher yielding Euro. This effect tends to drive the value of the Euro up as the demand for the Euro has increased.

A popular strategy chasing higher interest rates is the “carry trade” strategy; whereby traders borrow funds in a currency that has a low interest rate and buy a currency with a higher interest rate.

Money follows yield and traders will look to take advantage of this.

How PPI affects the US dollar

The Producer Price Index tends to have little effect on the US dollar initially. This is because in the real economy there is a time lag between the increase in prices from producers, and the end result of higher inflation resulting from consumers having to fork out more at the tills.

DailyFX economic calendar showing Producer Price Index (PPI)

However, don’t be misled by the “low priority” impact assessment of this data release. Astute traders are able to forecast the knock-on effects PPI is likely to have on CPI and interest rates and trade accordingly. Thus, the most valuable component of the PPI data is the signaling effect it provides to the market.

Gold Trading: Three Top Tips for Trading Gold

Gold Trading: Three Top Tips for Trading Gold

Gold Trading Tips

Few markets on Earth have the historical appeal and attraction as Gold. While traders have numerous trading options today, in a number of different currencies or asset classes or geographies, Gold has been a long-standing store of value that’s piqued speculators’ interest for about as long as human beings have traded with each other.

We previously looked at some of the basics around Gold trading in the What is Gold article a little earlier in this sub-module. And we also have a ‘How to Trade Gold’ article on the Gold page of DailyFX. But, in this article, we’re going to get a bit more granular as we investigate Gold Trading Strategies, Tips and Tactics.

Gold Trading Tips

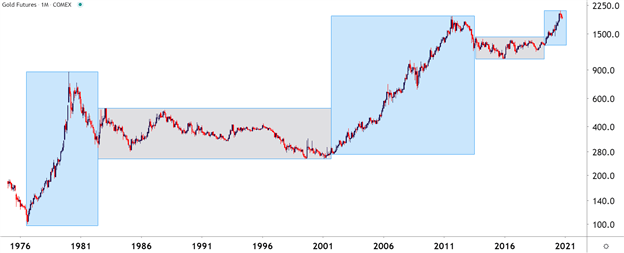
Probably one of the more obvious aspects of Gold, particularly on a longer-term basis, is the cycle sensitivity that will often show around the metal – and this isn’t a new phenomenon. As markets themselves are cyclical animals, Gold often moves to a similar type of tune, although timing may be differentiated from other markets at the time. Looking at Gold prices over the past 45 years, and this becomes a bit more clear. On the below chart, trends and ranges have been identified by blue or grey boxes, and that leads us into tip number one:

Gold Trading Tip #1: Adapt to the Present Condition

The key takeaway here is the importance of adaptation: Because if a trend trader approaches Gold with their typical approach while Gold markets are in a range, there’s high odds they could see unfavorable results. If Gold markets are mean-reverting and range-bound, the trader would likely want to approach the matter with a range-based approach. But, when Gold markets are trending, such as the case from 2001-2011 or 1976-1980, then traders are going to want to utilize trend strategies to adapt to the present condition.

Gold Futures Monthly Chart
Gold Trading Tip #2: Watch the US Dollar

The US Dollar is traded in a number of markets but, in the largest venues, Gold is traded in US Dollars. As a matter of fact, one common equation on CFD platforms presents a quote for Gold prices as ‘XAU/USD.’ The chemical symbol for Gold on the periodic table of elements is ‘AU’ and the denominator in that quote is the US Dollar, highlighting how Gold is being priced in terms of US Dollars.

This also means that, all factors held equal, and if Gold made no move at all but the US Dollar increased in value – the price of Gold could go down. Because in the function above, the value of the denominator, or USD, would increase in value thereby decreasing the value of the function as a whole.

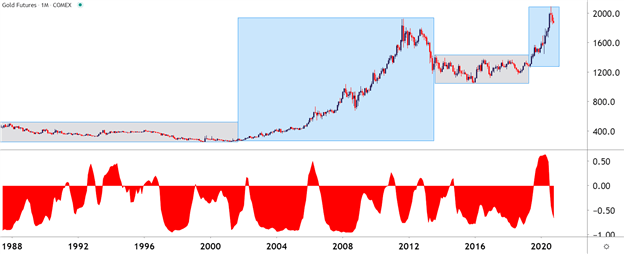
So, there could be a tendency for Gold to display an inverse correlation with the US Dollar. This isn’t all of the time, there are scenarios where both Gold and the Dollar may increase in value although those are somewhat rare, historically speaking.

On the below chart, that correlation is highlighted in the bottom portion of the image. Reads or values above the zero line indicate positive correlation which, again, is somewhat rare but not unheard of. Reads below zero highlight inverse correlation, with a value of -1 highlighting a perfect inverse relationship.

Gold Monthly Price Chart: An Inverse Relationship with the US Dollar
Gold Trading Tip #3: Know Your Time Frames

On the above charts we’re looking at the bigger picture behind Gold prices using the Monthly variety. But these conditions and market changes can take place on shorter-terms, as well, and it’s key for traders to have some type of consistent framework for their analysis so that they can properly implement their strategies in the ways that they want.

As we looked at in the multiple time frames article, traders should analyze markets from more than a single vantage point. The above monthly variety can be helpful to see the bigger picture – but for actually setting up trades and implementing strategies, traders will likely want to look to shorter time frames.

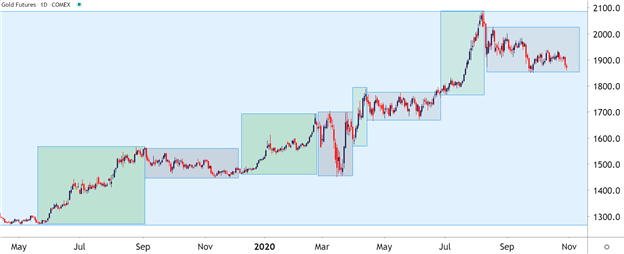
In the above graphic, the blue box on the right side of the chart shows a trend that’s been going for a little over two years now. But, looking at the shorter-term daily chart below to get a more granular look at that two-year-outlay shows that Gold prices were not trending the entire time. As a matter of fact, the same type of trend-range-trend-range relationship presented itself inside of this longer-term trend.

This is again important for traders when setting up strategy because for those that are looking to trade a trend, waiting for the monthly chart to highlight that potential may be too late. On the below chart, that blue box has been expanded so we can take a more granular look at the trend; but this time, I’ve added green boxes around the shorter-term trends and grey boxes around the mean-reverting or range-bound periods.

Gold Daily Price Chart
Gold Trading Strategies

Perhaps more important than the specific strategy that one is using to analyze or set up trades in Gold is the ‘fit’ to that specific market condition. For instance, if we look at the above image and focus on the green boxes, when the short-term trend is moving in the direction of the longer-term trend, traders are going to want to follow the age-old adage of ‘buying low and selling high.’ In the grey portions, however, when prices are ranging, traders want to similarly buy low and sell high but they’re going to want to do that in a slightly different way; closing the entirety of the long position while ‘high’ and then looking at potentially getting short to play the other side of the range.

Right up front – this means that no trader is always going to be ‘right’ because conditions, similar to trends, will change; and its impossible to know that until after the fact. This is where items like trade and risk management come into play, potentially helping to mitigate the downside in those instances where something changes or shifts away from their expectations.

Simplifying Market Behaviors by Assigning ‘Conditions’

With any market, if you think about it, there’s really only a couple of things that prices might do: Trend or not. Either prices are trending in a directional move for some reason, or they’re not trending at all: And the transitory state between mean-reversion and trends are breakouts, which are technically a market condition, itself. So, in that effort of simplification, analysts can break down market conditions into three specific types:

  1. Trend – a directional move is showing and there’s often a fundamental reason for it as traders are bidding higher-highs and higher-lows (or selling lower-lows and lower-highs).
  2. Range/Mean-Reversion – devoid of a driver, prices will often display no trend, which can open the door for range-bound or mean-reversion strategies.
  3. Breakouts – this is what happens when new information gets priced-in, and this can create a breakout move from a range and into a new trend. That new trend may last for a while or it may merely propel price action into a new range.

Bespoke Approach for the Proper Condition

Knowing what state a market is in isn’t enough, as traders are usually going to want to cater their approach to that specific condition. For instance, a trader focusing on breakouts likely won’t be able to withstand as much excursion as a trader picking on range/mean reversion setups.

At DailyFX, we help traders learn more about strategies for each of these conditions. But, perhaps the most important aspect of customizing a strategy to a specific traders’ needs is the risk management component, which is explored in-depth our Traits of Successful Traders research series, which is available completely free-of-charge and can be accessed by clicking on the link below: