Gold Prices Forecast: XAU/USD Traders Adapting to Revised Fed Rate Cut Forecasts

Gold Prices Forecast: XAU/USD Traders Adapting to Revised Fed Rate Cut Forecasts

Gold Prices Rise Amid Mixed Economic Signals

Gold (XAU/USD) prices are showing a modest increase early Thursday as bond yields and the U.S. Dollar weaken, while investors await further job data to understand the Federal Reserve’s upcoming monetary policy moves. Middle East tensions also bolster the demand for gold as a safe haven.

Federal Reserve’s Outlook

The Federal Reserve’s December meeting minutes indicate a shift towards controlling inflation and concerns about overly restrictive monetary policy. Despite this, there’s still uncertainty about the timeline for rate cuts, with a general consensus on maintaining a restrictive stance in the short term.

Trading Derivatives carries a high level of risk to your capital and you should only trade with money you can afford to lose. Trading Derivatives may not be suitable for all investors, so please ensure that you fully understand the risks involved, and seek independent advice if necessary. A Product Disclosure Statement (PDS) can be obtained either from this website or on request from our offices and should be considered before entering into a transaction with us. Raw Spread accounts offer spreads from 0.0 pips with a commission charge of USD $3.50 per 100k traded. Standard account offer spreads from 1 pips with no additional commission charges. Spreads on CFD indices start at 0.4 points. The information on this site is not directed at residents in any country or jurisdiction where such distribution or use would be contrary to local law or regulation.

Treasury Yield Fluctuations

Treasury yields are stabilizing early Thursday after recent volatility, impacting gold prices. The 10-year Treasury yield, which briefly topped 4%, is now at 3.911. This decrease, from last year’s high of over 5%, has been a key factor in gold’s recent rally.

US Dollar and Market Sentiment

The U.S. dollar is almost unchanged early Thursday as markets reassess Federal Reserve rate cut expectations. The Fed’s cautious approach towards rate cuts, combined with global growth concerns and risk-off sentiment, contributes to the dollar’s stability.

Economic Indicators

Wednesday’s economic reports, including the JOLTS jobs report and ISM Manufacturing data, show a contracting U.S. manufacturing sector and a decrease in job openings, signaling a potential easing in labor market conditions. Investors will be closely monitoring upcoming jobless claims and non-farm payrolls reports to gauge the Fed’s leeway in rate adjustments.

Short-Term Forecast: Adjusted Expectations for Gold

In the short term, XAU/USD traders are adjusting their positions in response to changing expectations regarding the Federal Reserve’s rate cuts. With the CME Group’s FedWatch tool now indicating a 72% chance of a rate cut in March, down from a previous 90%, there’s a noticeable shift in market sentiment. This adjustment in rate cut expectations is leading traders to reassess gold’s up trend, potentially leading to a downward adjustment in gold prices. The market will continue to react to evolving economic data and Fed signals in the coming days.

Technical Analysis
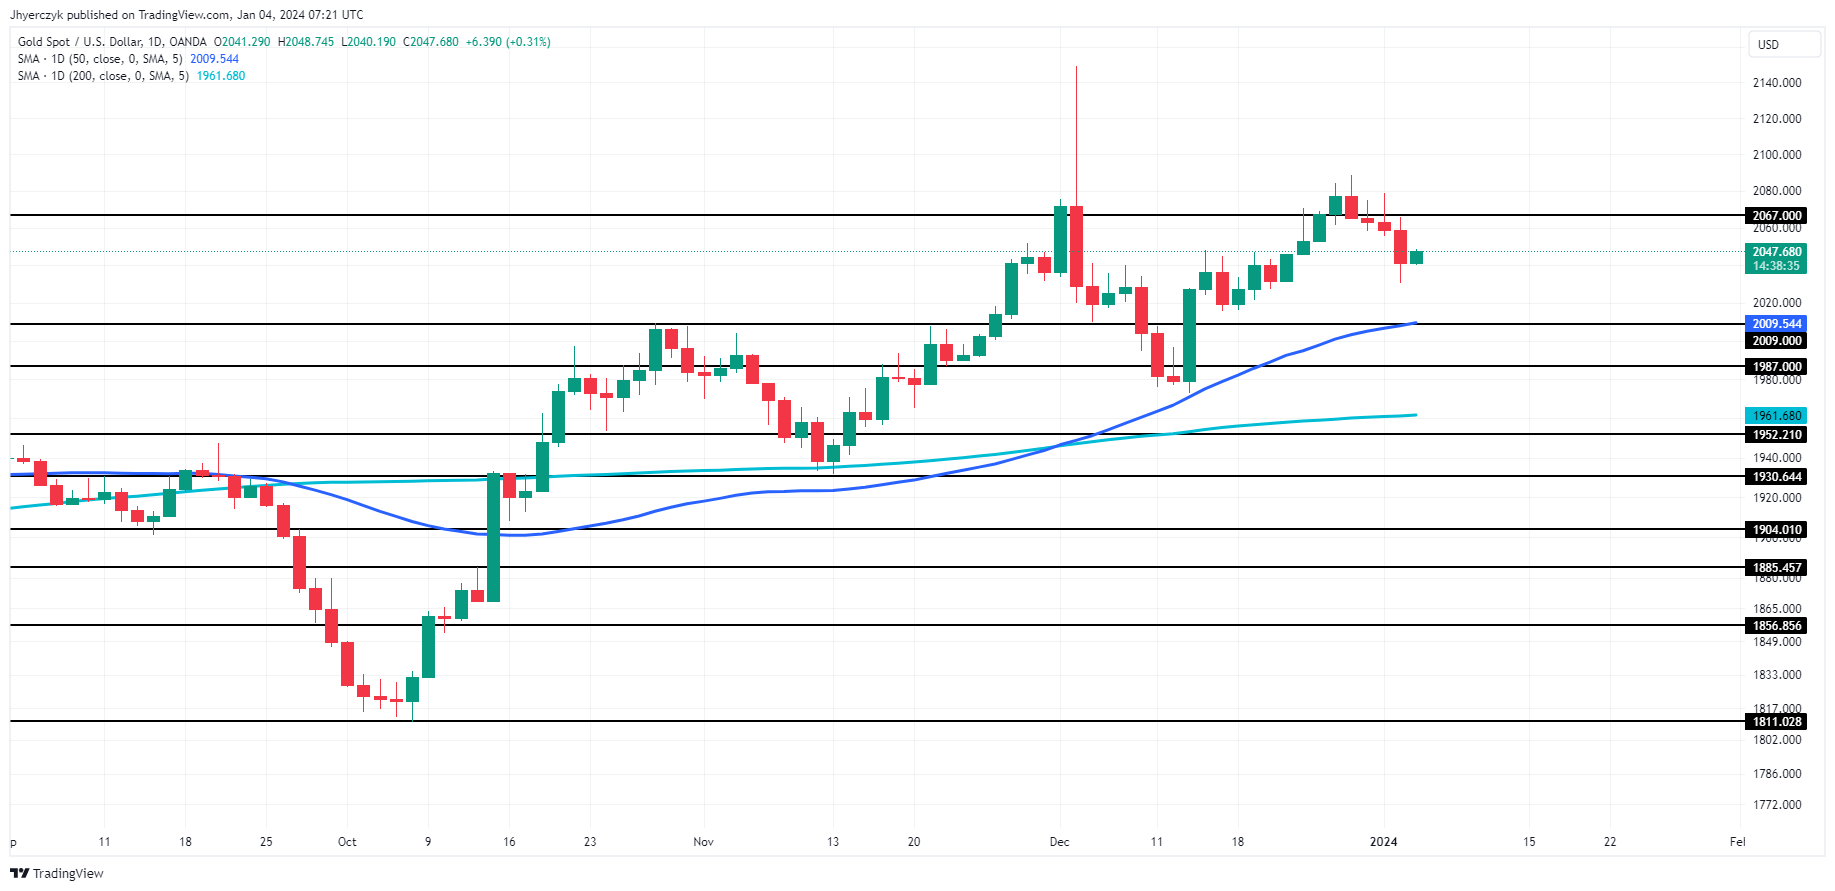
Daily Gold (XAU/USD)In the current Gold (XAU/USD) market, the sentiment is cautiously bullish with the price at 2047.41. This level sits above the established 200-day moving average of 1961.68, indicating a positive trend.

The market, however, is facing a critical juncture as it nears a support cluster around 2009.54 and 2009.00. A successful test of this area might lead to a technical bounce, reinforcing the bullish stance.

Conversely, a break below 2009.00 could shift the market momentum, potentially accelerating a downward move. This delicate balance positions the market at a key decision point, with immediate price action likely to dictate the short-term trend.

China Caixin Services PMI Highlights a Marked Pickup in Sector Activity

China Caixin Services PMI Highlights a Marked Pickup in Sector Activity

China Service Sector Activity Accelerated in December

On Thursday, the China Caixin Services PMI drew investor interest. Concerns about the Chinese economy resurfaced in the New Year, with the NBS private sector PMIs setting the tone.

However, the Caixin Services PMI increased from 51.5 to 52.9 in December. Economists forecast an increase to 51.6.

According to the Services PMI Survey,

  • Service sector activity expanded at the fastest pace for five months.
  • Service sector companies reported improved market conditions, driving new business, and a pickup in service sector activity.
  • Overseas demand for Chinese services increased at the most marked pace since June.
  • Increasing demand allowed firms to increase staffing levels, the first increase in staffing levels for three months.
  • Input costs increased at a faster pace while selling prices rose at a softer rate.
  • Competition to attract new business affected selling price trends.
  • Firms were upbeat about the 12-month outlook. Firms expect output to increase during 2024. Nonetheless, positive sentiment remained below the long-run average.

The pickup in service sector activity reflected the positive effects of Beijing’s stimulus on the economy. Significantly, the more influential Caixin survey-based report painted a rosier picture than the NBS survey-based report. The NBS Non-Manufacturing PMI increased from 50.2 to 50.4.

In December, the Caixin Manufacturing PMI also increased, albeit modestly, from 50.7 to 50.8.

AUD/USD Reaction to the China Caixin Services PMI

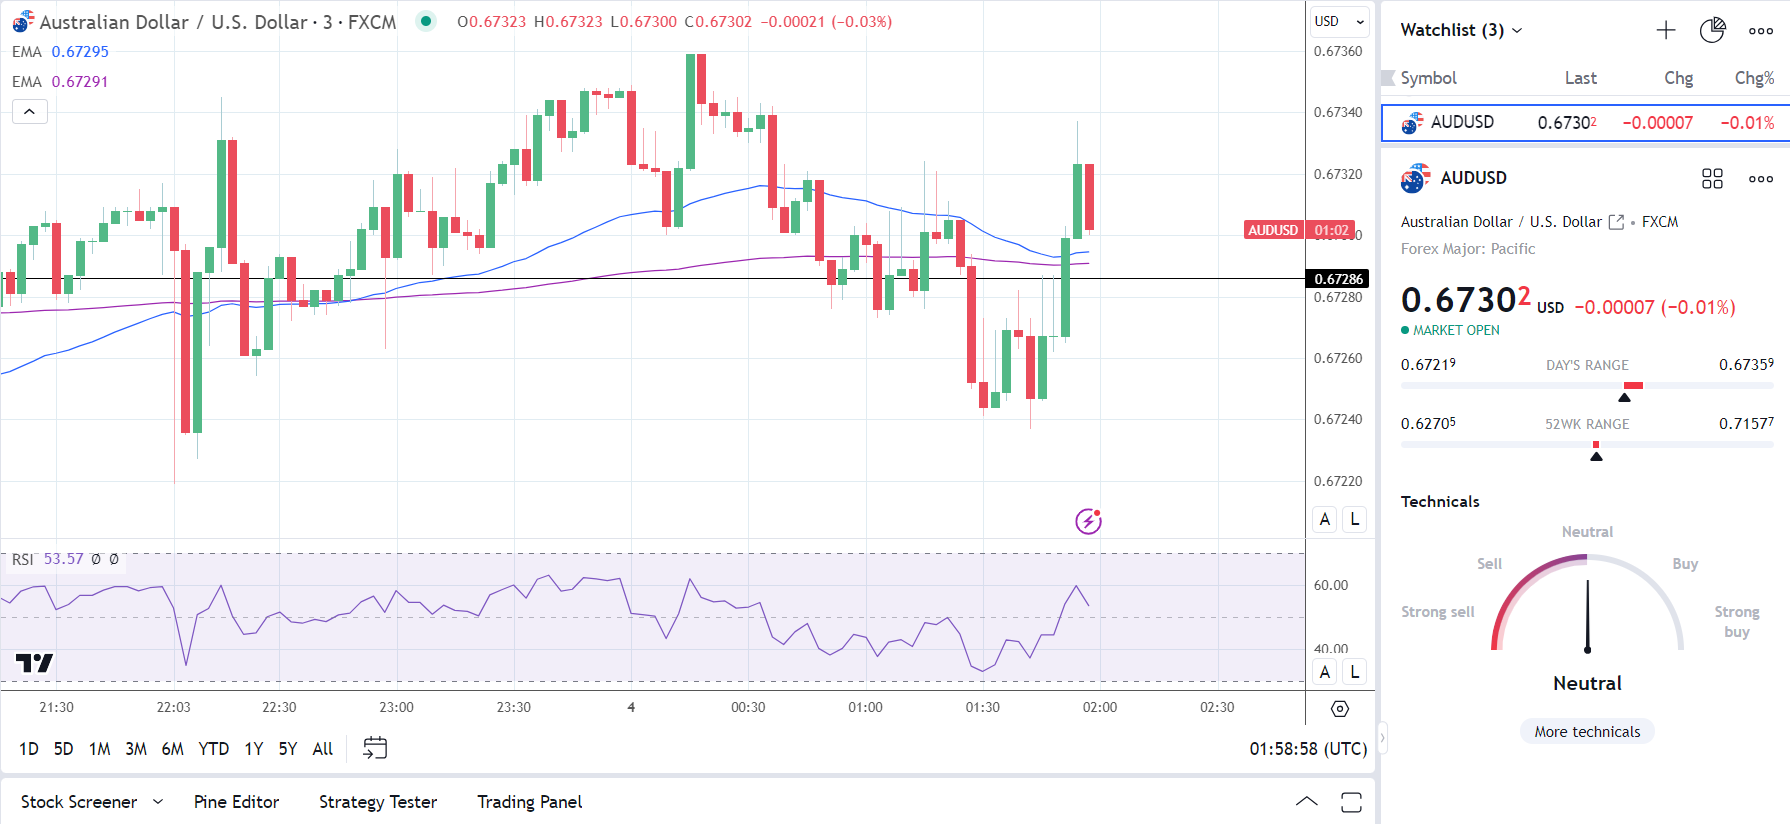
Before the China Caixin Services PMI, the AUD/USD fell to a low of $0.67219 before rising to a high of $0.67359.

However, in response to the December numbers, the Aussie dollar rallied from $0.67246 to $0.67337.

At the time of writing, the Aussie dollar was down 0.01% to $0.67302.

AUD/USD reacts positively to the Caixin Services PMI.
040124 AUDUSD 3 Minute Chart

Up Next

On Thursday, US labor market economic indicators warrant investor attention. ADP employment change and initial jobless claims will garner investor interest. Tight labor market conditions could further reduce the bets on a Q1 Fed rate cut.

However, US service sector PMI numbers will also influence the Fed interest rate trajectory.

US Dollar’s Revival Threatened by Fed Minutes; Setups on USD/JPY, EUR/USD, Gold

US Dollar’s Revival Threatened by Fed Minutes; Setups on USD/JPY, EUR/USD, Gold

The U.S. dollar, as measured by the DXY index, extended its rebound on Wednesday, but ended the day well off the session high after the Fed minutes triggered a pullback in yields. For context, the account of the last FOMC meeting revealed that interest rates could stay high for longer, but also that policymakers see inflation risks moving toward greater balance, the first step before launching an easing cycle.

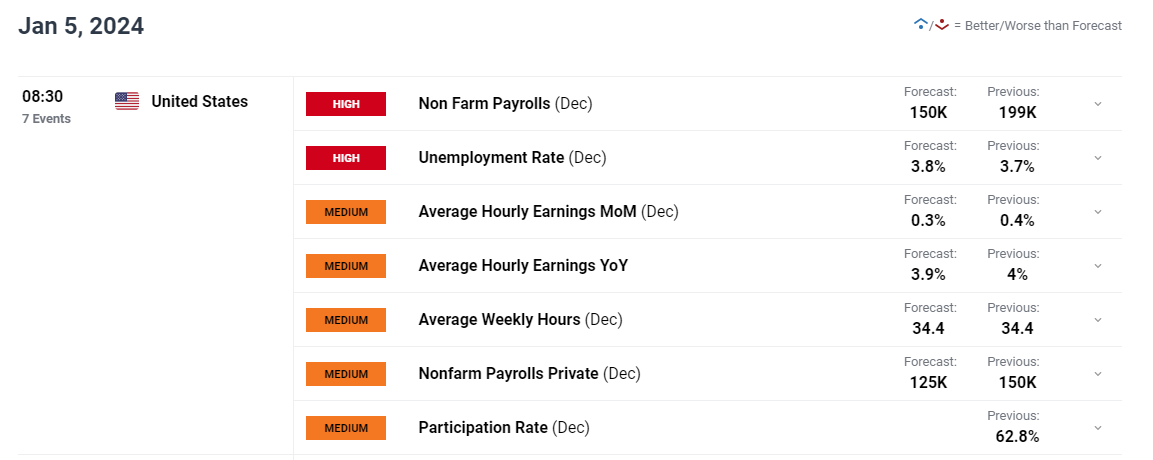
With the Fed’s policy outlook a state of flux, it is important to keep a close eye on macro data, considering that incoming information on the economy will be the main variable guiding the U.S. central bank’s next moves and the timing of the first rate cut. That said, the next important report worth following will be the December nonfarm payrolls survey (NFP), which will be released on Friday morning.

In terms of consensus estimates, U.S. employers are forecast to have added 150,000 jobs last month after hiring 199,000 people in November. The unemployment rate, for its part, is seen ticking up to 3.8% from 3.7% previously, indicating a better balance between supply and demand for workers – a situation that should help alleviate future wage pressures.

Wondering about the U.S. dollar’s trajectory? Dive into our Q1 trading forecast for comprehensive insights. Don’t miss out—get your copy today!

For the U.S. dollar to continue its recovery in the coming weeks, labor market figures must show that hiring continues to be strong and dynamic. This scenario would drive yields higher by signaling that the economy remains resilient and able to forge ahead without the immediate need for central bank support. That said, any NFP figure above 200,000 should be bullish for the greenback.

On the flip side, if job growth underwhelms and misses projections by a wide margin (e.g., anything below 100K), we should expect the opposite reaction: a weaker U.S. dollar. This result would validate bets on deep rate cuts by confirming that growth is downshifting and that the Fed needs to intervene in time to prevent a hard landing.

UPCOMING US JOBS REPORT

image1.png

For a complete overview of the yen’s technical and fundamental outlook over the next three months, make sure to download your complimentary Q1 trading forecast now!

USD/JPY TECHNICAL ANALYSIS

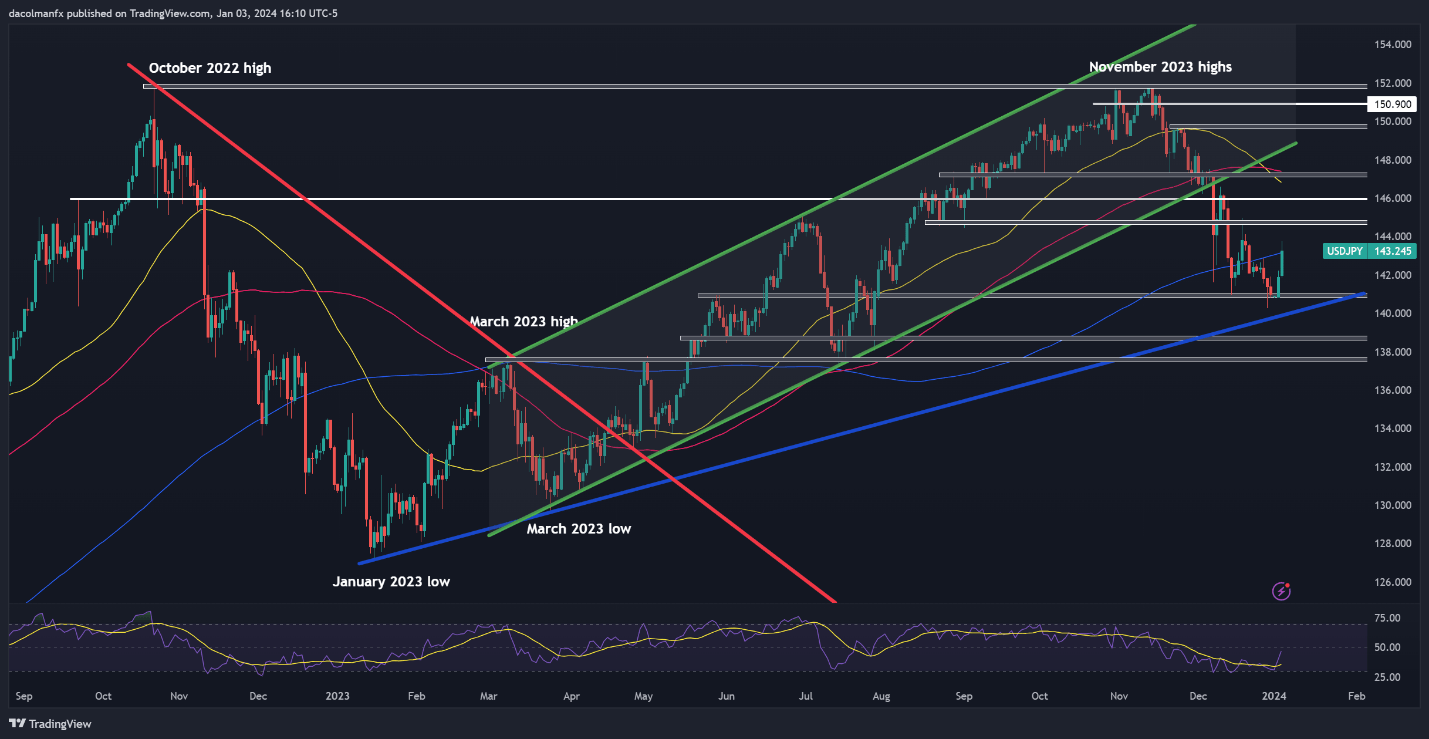
USD/JPY rallied and pushed past its 200-day simple moving average on Wednesday, though the advance lost some momentum in late afternoon trading. In any case, if the bullish breakout is sustained, bulls could regain commanding control of the market, setting the stage for a possible rally towards 144.80. On further strength, we can’t rule out a move towards the 146.00 handle.

Conversely, if sellers reemerge and drive USD/JPY below its 200-day SMA, sentiment around the U.S. dollar could sour, setting the right conditions for a pullback towards 140.95. The pair is likely to establish a base in this area before bouncing, but a decisive breakdown could send the exchange rate staggering toward trendline support at 140.00.

USD/JPY TECHNICAL CHART

A screenshot of a graph  Description automatically generated

Interested in learning how retail positioning can offer clues about EUR/USD’s directional bias? Our sentiment guide contains valuable insights into market psychology as a trend indicator. Download it now.

EUR/USD TECHNICAL ANALYSIS

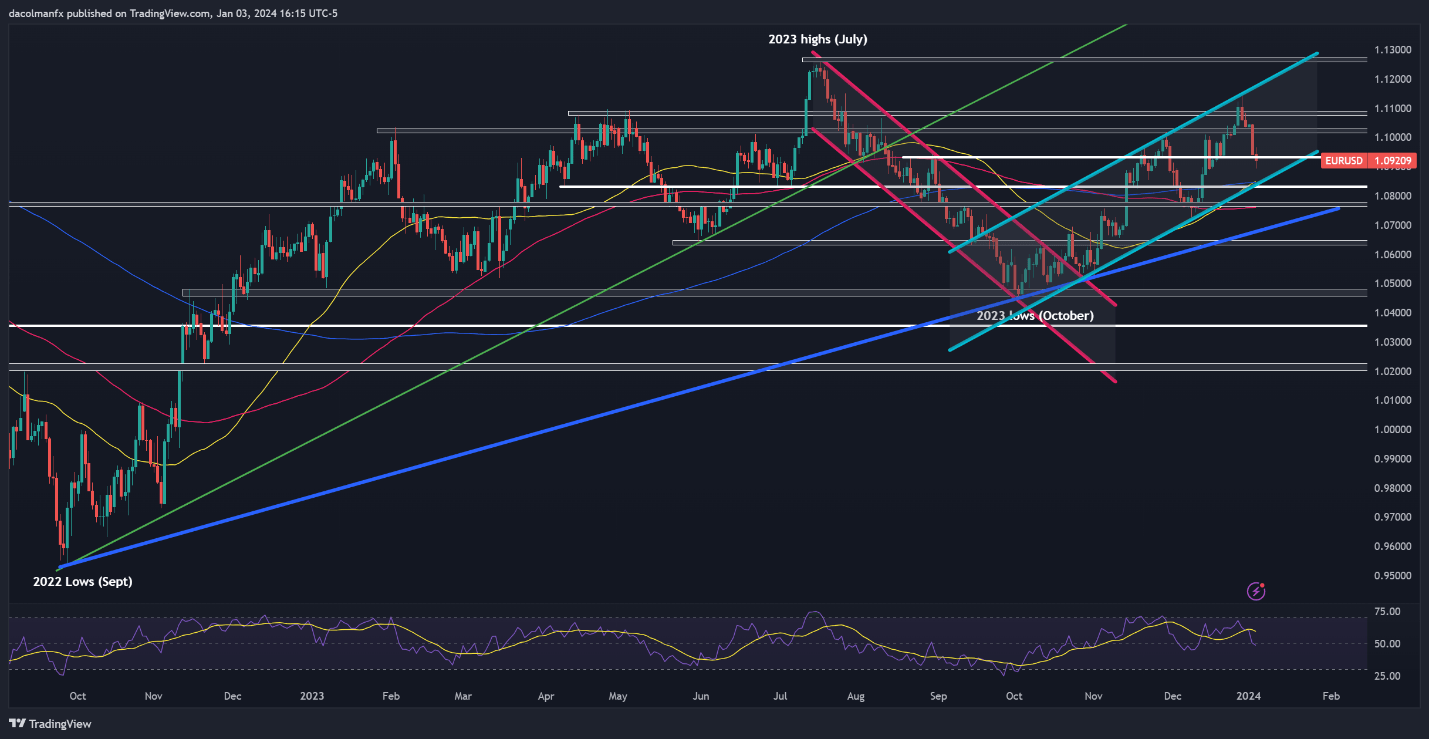
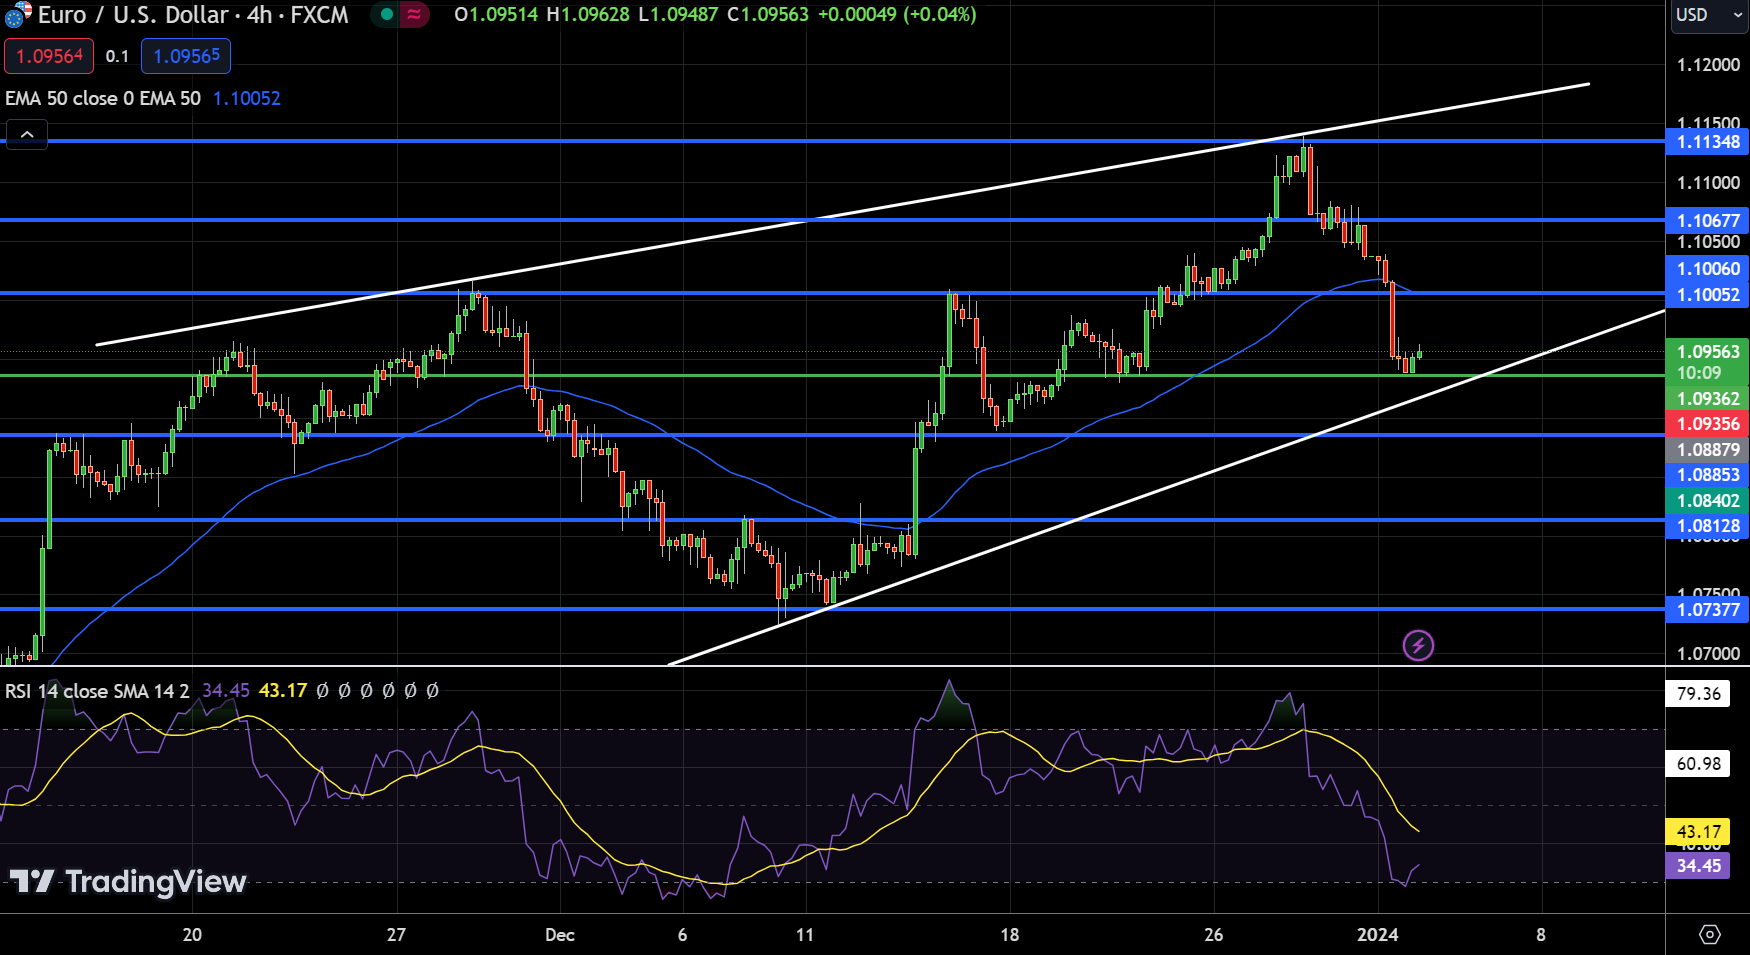
EUR/USD climbed to multi-month highs in late December, but failed to maintain its advance, with the pair taking a turn to the downside after failing to clear channel resistance near 1.1140. Following this bearish rejection, prices have started to trend lower, slipping below support at 1.0935 on Wednesday. If such a move is sustained, EUR/USD may head towards channel support at 1.0840 in short order.

On the other hand, if buyers stage a turnaround and spark a bullish reversal, initial resistance is visible at 1.0935, followed by 1.1020. On further strength, the bulls may be emboldened to mount an attack on 1.1075/1.1095. Sellers would need to defend this ceiling at all costs– failure to do so could prompt an upswing toward December’s high at 1.1140 (also channel resistance).

EUR/USD TECHNICAL CHART

image3.png

EUR/USD Chart Created Using TradingView

Want to know how to trade precious metals? Get the “How to Trade Gold” guide for expert insights and strategies!

GOLD TECHNICAL ANALYSIS

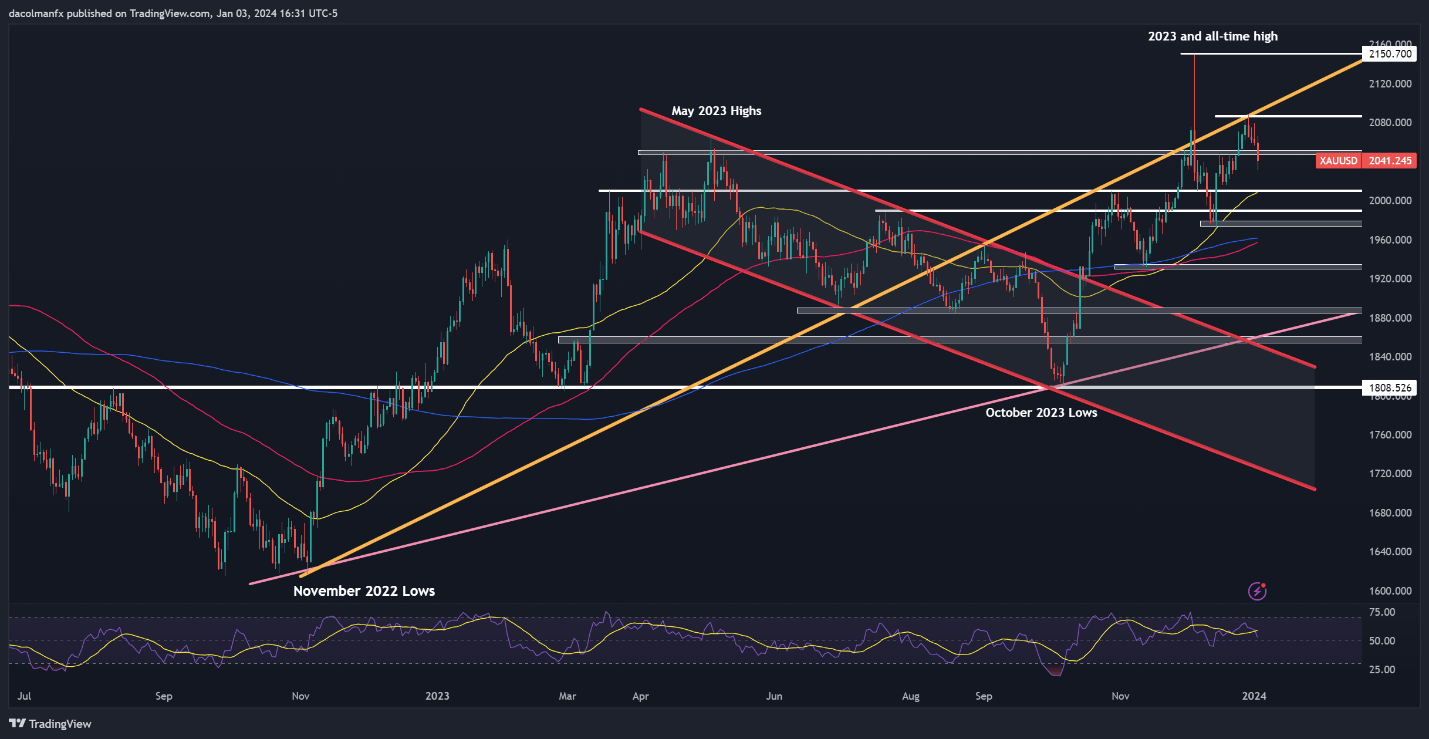
Gold experienced a notable downturn on Wednesday, slipping below crucial technical support between $2,050 and $2,045. Should XAU/USD linger beneath this range for long, sellers might find momentum to steer prices toward the 50-day simple moving average near $2,010. On further weakness, all eyes will be squarely set on $1,990, followed by $1,975.

On the flip side, if selling pressure abates and buyers regain control of the wheel, initial resistance is located at $2,045-$2,050. Though taking out this technical barrier might prove difficult for the bulls, it will not be impossible, with a breakout likely exposing December’s high. Continued upward impetus might then draw attention to the all-time high near $2,150.

GOLD PRICE TECHNICAL CHART

A screen shot of a graph  Description automatically generated

What is a Short Squeeze and How to Trade It?

What is a Short Squeeze and How to Trade It?

What is a short squeeze?

The definition of a short squeeze can be termed as the strain experienced by short sellers to cover (by buying to close) their respective positions due to a sharp rise in stock prices.

For example, Investor A borrows 10 shares of Company Z at $5 per share. A few days later, Company Z shares rise to $10 per share which means that Investor A is currently running a $50 loss. The logic behind a short squeeze is that when short sellers (individuals forecasting share price declines) run losing negative positions due to price appreciation, the domino effect of these investors buying back shares to close positions as to not incur further loss causes an exponential rise in stock prices.

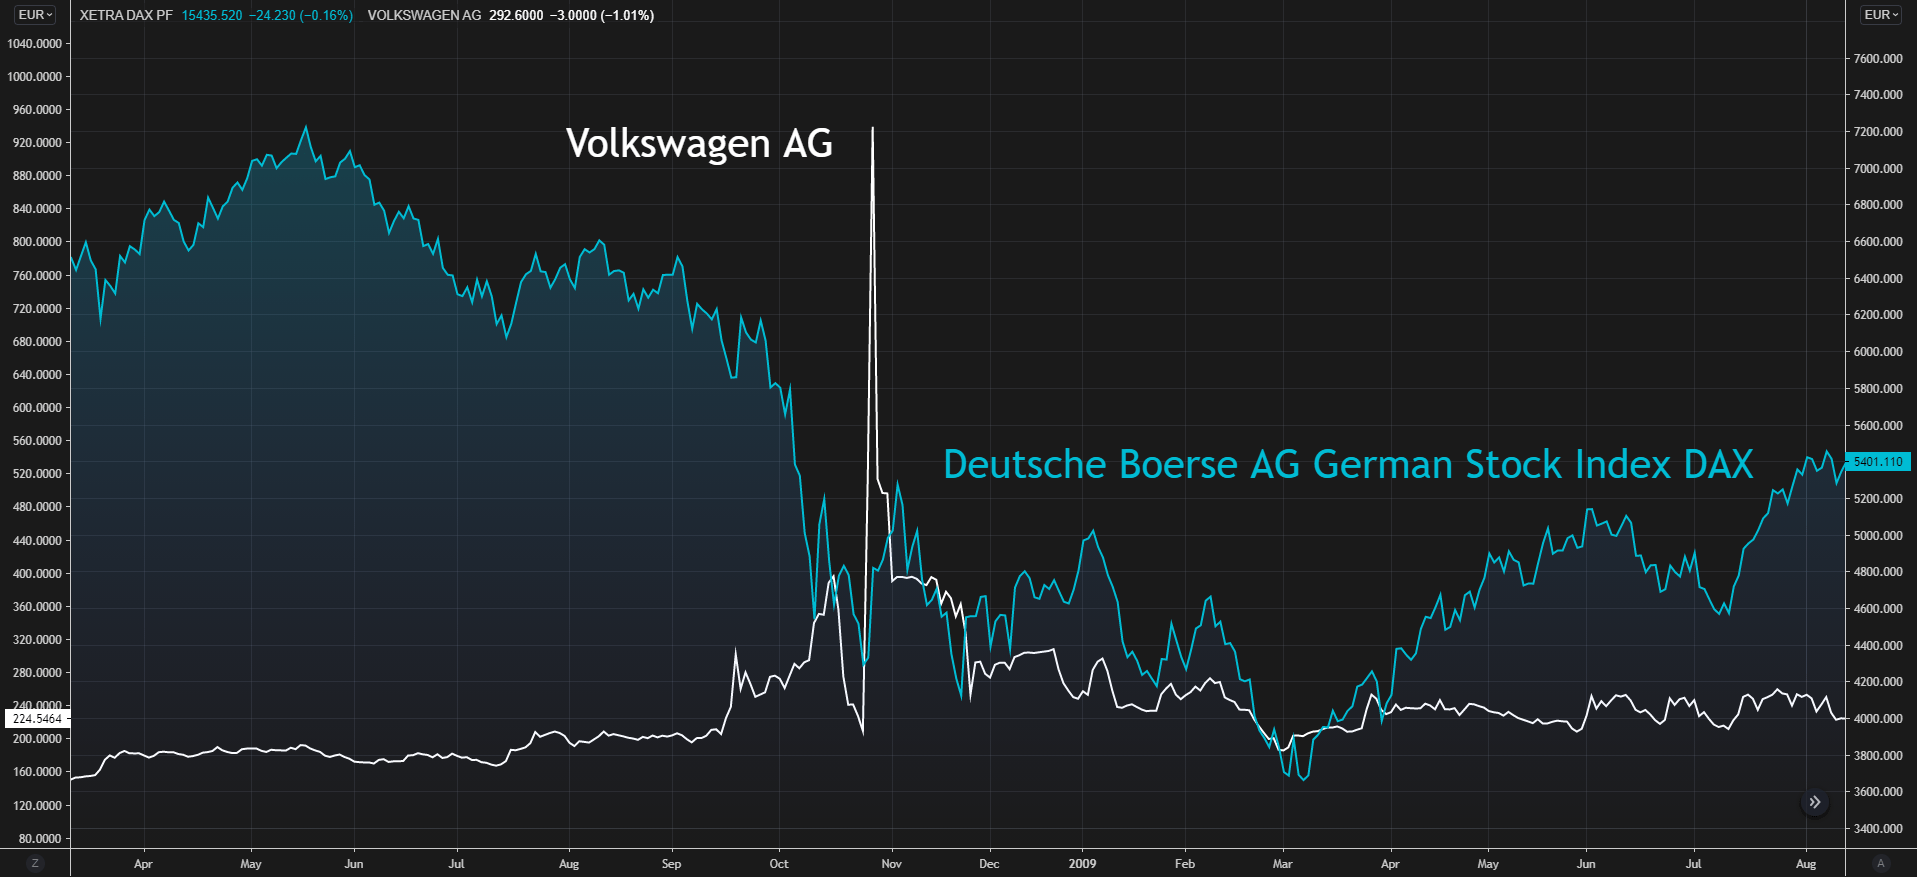
A good example is the Volkswagen AG (VOW.DE) short squeeze of 2008 whereby Porsche purchased large volumes of Volkswagen shares driving up prices roughly fourfold ultimately causing short sellers to lose billions in the process. The chart below shows the relative price increase between Volkswagen AG and the German DAX index.

Volkswagen AG vs DAX Index:

volkswagen AG short squueze vs DAX

When many short sellers attempt to buy back simultaneously, there is no cap on how high stock prices may rise. This often gives rise to opportunistic investors trying to capitalize on the short squeeze by buying during the price ascension.

What causes a short squeeze?

From the explanation above we can summarize the events leading up to a short squeeze scenario in the list below:

  • Investors identify what they believe to be an overvalued share and take short positions on the particular share – in expectation of a price drop whereby they may buy back the shares at a lower price (sell high, buy low).
  • Share price moves in the adverse direction to investor forecasts causing a rapid price rise.
  • Short sellers then realize that the position is not profitable and try to buy back shares at a minimal loss, thus causing further price escalation.

Is a short squeeze illegal?

According to the Securities and Exchange Commission short selling is illegal as the law states.

“ Selling stock short and failing to deliver shares at the time of settlement with the purpose of driving down the security’s price . This manipulative activity, in general, would violate various securities laws, including Rule 10b-5 under the Exchange Act.”

How to trade a short squeeze

Trading around a short squeeze (often prompted unlawfully by a large external third party) can be extremely dangerous and can result in significant financial loss. However, there are traders who use cautionary signals provided by market movements to forecast potential short squeezes. (To wit: the GameStop saga, which had traders on different sides of the action.) This high risk activity does carry the potential for high reward in certain cases. Some investors attempt to pre-empt an upcoming short squeeze by monitoring several key indicators. Primarily the main indicator would be:

Market Sentiment

Market sentiment reveals the markets inclination toward a specific financial instrument – in this case a share. The below are two potential methods of assessing, timing and interpreting possible signs of an impending short squeeze.

Short interest ratio:

This ratio simply put is a mathematical indicator that tells investors the average number of days it takes for short sellers to buy back borrowed shares. This ratio is calculated by the total number of shorted stocks divided by the average daily trading volume. For example, if there are 10000 shorted stocks on Company A with an average daily trading volume of 1000, then the short interest ratio would equal to 10. As a rule of thumb, a short interest ratio of 10 and higher is regarded as high and therefore the more short positions to cover – higher probability of a short squeeze.

Short interest percentage:

This percentage figure provides investors with a current gauge as to how many short sellers there are on a particular stock. That is, is there are 10000 short sellers on Company A with 1000000 outstanding shares then the short interest percentage figure would be 1%. The higher the figure, the more difficult it would be fore short sellers to buy back shares should prices increase.

How to protect against a short squeeze?

As mentioned, a short squeeze can cause large financial loss however, there are ways to mitigate excessive losses by means of two simple additives.

1. Stop loss: A stop loss is a level whereby a position will be closed should price hit a certain aforementioned level. For example, if a share is shorted at $10 a stop loss may be placed at $15 which means if the share price reaches $15 a purchase will ensue and the position will be closed at a loss of $5.

2. Hedging: This may seem counterintuitive as it is essentially netting off any gains however, purchase orders may be set in at a specified level to curtail losses up to a desired amount. For example, an order to buy the above share at $15 will effectively function as a stop loss.

Note: Traders should be aware of risks to stop loss orders. They are vulnerable to short-term fluctuations in price that could activate the stop price. All stop orders will be filled, though there is no guarantee of the price. What’s more, if your level is reached, your stop order cannot be filled at a better price than your stop, only the same price or worse, and this could impact your original risk-reward ratio.

Forex Correlation: Using Currency Correlation in Forex Trading

Forex Correlation: Using Currency Correlation in Forex Trading

What is currency correlation?

Currency correlation, or forex correlation, denotes the extent to which a given currency is interrelated with another, helping traders understand the price movements of currencies over time and influencing their forex decisions.

Currencies are traded in pairs, meaning no single currency pair is ever isolated. This means traders need to understand how currency pairs move in relation to others, particularly if they are trading multiple pairs at the same time.

Using currency correlation in forex trading

When using currency correlation in forex trading, traders can gain knowledge of the positions that cancel each other out, so they know to avoid those positions. Traders can also use currency pair correlation for diversifying a portfolio. More on these strategies will be discussed below.

Fx correlation is represented on a numerical scale. This ‘correlation coefficient’ ranges between -1 and +1 and shows the degree of correlation. For example, +1 would be a positive linear correlation, and implies that the two currencies will always move in the same direction. A correlation coefficient of -1 implies the currency pair will always move in the opposite direction, while if the correlation is 0, the relationship between the currencies in the pair will be random, with no correlation.

As an example, a positive correlation of, say, 0.50 between AUD/USD and EUR/USD would mean that when AUD/USD rallies, EUR/USD has also rallied 50% of the time, according to previous data. This can be observed in the charts below.

The below chart shows the currency correlation between EUR/USD (blue) and GBP/USD (red). The currency coefficient measure can be seen in the red secondary chart, revealing that while the currency pair moves in a similar direction most of the time, it is sometimes negatively correlated. The peaks represent the points in the chart showing positive correlation, with the troughs showing negative correlation.

EUR/USD-GBP/USD chart showing currency coefficient

Meanwhile, this second chart shows the currency correlation between USD/CHF (gold) and EUR/USD (blue). The currency coefficient shows that while this correlation is mainly negative, it is occasionally positively correlated.

SD/CHF-EUR/USD chart showing currency coefficient

Reading a currency correlation table

Currency correlation tables show the relationship between main forex pairs and other pairs over different time periods but, as seen in the charts above, currency correlations can and do change over time.

For example, the following table shows GBP/USD against five prominent currency pairs over a sample of 20 days, 60 days and 90 days:

GBP/USD EUR/USD USD/JPY USD/CHF USD/CAD AUD/USD NZD/USD
20 days -0.16 0.25 0.50 -0.35 -0.33 -0.57
60 days 0.77 -0.29 -0.58 -0.67 -0.12 -0.46
90 days 0.61 0.20 -0.36 -0.45 -0.01 -0.03

Source: https://tradecaptain.com/correlation-studies

GBP/USD and USD/CHF, as an example, shows a positive correlation over the shorter timeframe of 20 days. However, the pairing is overall regarded as a negative correlation for similar reasons to USD/CHF and EUR/USD. CHF is a safe haven currency and can appreciate dramatically when economic turmoil hits and equities fall, which is one reason that might explain the negative figures.

Why traders use currency correlation

Traders typically use currency correlation for inter-market trading, hedging a position, and diversifying risk.

Inter-market trading

Identifying markets that are closely correlated with each other can be useful because, if patterns are not clear in one market, clearer patterns can be used in the second market to help traders place trades in the first.

The commodities market can be particularly useful for correlation and an example of inter-market trading is the pair of USD/CAD and oil . Since Canada is the largest exporter of oil to the US, the currency pair is sensitive to the commodity price, and when the oil price rises CAD will tend to strengthen against USD. Another example is the correlation of the Australian Dollar (AUD) with gold, with price rises in the precious metal equating to rises in AUD due to the country being one of the leading gold producers in the world.

Currency correlation is useful for traders

Hedging a position

Hedging a position is also a reason to trade forex correlations. If you are bullish about AUD and want to buy AUD/USD, then buying USD/CHF to hedge off some of the USD exposure may be a wise move.

Different pip or point values can be used to a trader’s advantage when hedging exposure. Where the value of a pip move for a given pair may be $10 for a lot of 100,000 units, a negatively correlated pair with the value of a pip move at $9.20 for the same number of units can represent a useful hedge.

Diversifying risk

Traders can also use currency correlation for diversifying risk. For example, having three trades on (GBP/NZD, USD/JPY, and EUR/JPY) means you can run an analysis between the three markets to make sure they are not correlated, effectively diversifying your trades.

Employment: The Key Driver of Economic Growth and Prosperity

Employment: The Key Driver of Economic Growth and Prosperity

What is Employment?

Employment is considered to be a key economic driver and is an important measure of economic growth. According to the International Labor Organization, unemployment is defined as ‘’people of working age who are without work, available for work and actively seeking employment.” So, thereby, those that have jobs are considered employed while those that do not have a job but are currently looking for one are considered unemployed. Although the unemployment rate is not infallible, it is an important factor to consider when performing fundamental analysis and can be likened to the basic economic principle of supply and demand.

Because the change in supply/demand of labor has a direct impact on both growth and consumer spending; unemployment, gross domestic product (GDP) and Inflation are often perceived to be inter-related and all form part of the primary macroeconomic objectives set out by policymakers. Data releases with employment statistics are some of the most important events on the economic calendar and are followed closely by both Central Banks and market participants.

Economic Impact of Unemployment

For the US, the Federal Reserve Bank (“The Fed”) relies on employment data when assessing potential adjustments to monetary policy. For example, if US unemployment rate is high, the Central Bank will look to boost the economy with expansionary monetary policy, which often entails reducing interest rates, which can make investing in growth that much more attractive given that rates (opportunity cost) are lower.

The knock on effect of expansionary monetary policy on economic output is demonstrated in the diagram below:

Economic cycle with expansionary monetary policy

Employment to Inflation

On the other end of the spectrum, strong employment and low rates of unemployment do not necessarily spell for tighter monetary policy or higher rates. There is another factor of concern in that equation, and that’s when inflation begins to enter into the mix.

As the unemployment rate drops, businesses will have a more difficult time finding employees. This should lead to competition for those workers, and this will often show in the form of higher wages, which is considered as inflation.

Inflation is usually the bigger motivator for Central Bankers to hike rates and tighten policy, as this gives them reason for looking to protect the financial system from capital erosion via negative real rates and/or runaway inflation.

In the US, this is often followed through the Non-farm Payrolls report in terms of ‘Average Hourly Earnings (AHE).’

Employment Reports: Non-Farm Payrolls

The Non-Farm Payroll (NFP) report (released by the Bureau of Labor Statistics on the first Friday of every month at 08:30 EST) is one of America’s most influential economic announcements as it is seen as a direct representation of US economic growth. NFP is widely followed due to its early release, highlighting data for the most recently completed month and it’s often one of the first barometers that market participants have for that period. However, the unincorporated self-employed, unpaid volunteers or employees of family, farm workers and domestic workers are all excluded from NFP; and given the early nature of the report, it’s often subject to revisions in later months.

The NFP report comprises data from the Current Employment Statistics (CES) program from the U.S which surveys approximately 141,000 businesses and government agencies. This represents approximately 486,000 individual work sites, with the objective of providing detailed industry data on employment, hours, and earnings of workers on nonfarm payrolls, which accounts for 80% of the US workforce. Workers from the manufacturing, construction and goods sectors are included in the NFP report. The release of NFP, the US unemployment rate and Average Hourly Earnings (AHE) at the beginning of the month makes this data even more significant since it sets the tone for markets under the watchful eye of the Federal Reserve.

Economic Calendar

DailyFX Economic Calendar


Why Do Trends in Markets Form?

Why Do Trends in Markets Form?

Understanding the range

To understand why trends form on a chart, we start with a frequent precursor to a trend. It typically begins with a dull, rangebound market. A rangebound market often shows up when known drivers are properly priced-in to the backdrop. This allows for sideways price movements where no new highs or new lows are coming into play. In a choppy market there is an equilibrium between buyers and sellers in the absence of an underlying driver or theme. The market is effectively in limbo. It is usually marked by low volatility, and outside of specific strategies designed to take advantage of low volatility, this type of market leaves much to be desired in terms of opportunity.

From range to breakout

In a breakout market there is a gear switch towards a fundamental theme where market participants are forced into action as risks make a shift in one direction or the other from dull market conditions. The shift can come from a large catalyst or a buildup of pressure over time. You can think of a rangebound market going into a breakout market as a pile of sand that has had its final grain dropped on it before it collapses.

A trending market is the breakout maturing a theme, which strengthens and becomes sustainable. The strength of the theme draws further participation into the market and becomes self-reinforcing. A good trend won’t be derailed by small fundamental events and data releases. These are only short-lived bumps in the road with market participants’ attention quickly turning back towards the broader underlying theme.

In the beginning of a trend, the theme isn’t visible to many, typically only to the most astute market participants. But as the trend matures, it becomes apparent to an increasingly less sophisticated crowd of traders until the trend eventually reaches a point of exhaustion and changes course. For a more in-depth look at this process, check out Market Cycles | Phases, Stages, and Common Characteristics.

USD/JPY from 2017 to 2022 is a good example of a market that went from dormant for a long period of time to a breakout/trending market. USD/JPY volatility dried up and trading was choppy from around the beginning of 2017 until early 2021. In early 2021 USD/JPY started to break out and trend higher before posting a sharp rally in 2022 when U.S. inflation and interest rates took off sharply.

USD/JPY 2017 to 2021 Choppy Range Turning into a Powerful Trend

USD/JPY Charts

Trends can also form suddenly when markets quickly reverse. These are a result of market participants having to adjust their positioning due to the perception of a rapidly changing backdrop. Stock markets for instance can swiftly go from a bear market to a bull market after panic selling dries up.

S&P 500 Bear Market Swiftly Turning into Bull Market

Generally speaking, trends can offer excellent opportunities for traders if approached with the proper strategy. They occur on every time frame, so there is always a trend emerging. There are many considerations to take into account when trading trending markets. We cover them in depth in the Trend Trading Guide. Check out the banner below find out more about how to become a better trend trader.

EUR/USD advances above 1.0950, US data, Fed Minutes eyed

EUR/USD advances above 1.0950, US data, Fed Minutes eyed

EUR/USD is trading firmer above 1.0950 in the European session on Wednesday. The US Dollar consolidates previous gains amid a downbeat mood, keeping the pair afloat. The focus shifts to the top-tier US ISM PMI and the Fed Minutes for fresh impetus.

The Relative Strength Index on the 4-hour chart rose slightly above 30 after falling below that level on Tuesday, suggesting that the bearish bias remains intact following a technical correction. Additionally, the 20-period Simple Moving Average (SMA) is about to make a bearish cross with the 50-period SMA on the same chart, highlighting a buildup of bearish pressure.

On the downside, 1.0950 (Fibonacci 23.6% retracement of the latest uptrend) aligns as immediate support. The 100-period SMA reinforces this level as well. If EUR/USD falls below 1.0950 and starts using that level as resistance, sellers could remain interested. In this scenario, 1.0920 (200-period SMA), 1.0900 (psychological level, static level, lower limit of the ascending regression trend channel) and 1.0850 (Fibonacci 38.2% retracement) could be seen as next supports.

On the upside, resistances are located at 1.1000 (psychological level, static level), 1.1025 (20-period SMA, 50-period SMA, mid-point of the ascending channel) and 1.1100 (psychological level, static level).

EUR/USD declined sharply on Tuesday and touched its lowest level in nearly two weeks at 1.0938 as the US Dollar (USD) staged a decisive correction following the poor performance seen in the last couple of weeks of 2023. Early Wednesday, the pair holds steady at around 1.0950.

In the absence of high-tier data releases, the USD benefited from souring market mood and the steady recovery seen in the US Treasury bond yields on Tuesday. The US Dollar Index, which lost about 2% in December, gained nearly 1% on the first trading day of 2024.

In the second half of the day, the US economic docket will feature the ISM Manufacturing PMI data for December and JOLTS Job Openings report for November.

Investors expect the ISM Manufacturing PMI to edge higher to 47.1 from 46.7 in November. A reading above 50 could provide a boost to the USD with the immediate reaction. On the other hand, a noticeable decline in the number of job openings could hurt the USD.

Later in the American session, the Federal Reserve (Fed) will release the minutes of the December policy meeting. In the post-meeting press conference, Fed Chairman Jerome Powell said that policymakers were thinking and talking about when it will be appropriate to cut rates. In case the publication confirms that officials discussed the timing of a policy pivot, the USD could find it difficult to stay resilient against its rivals. According to the CME Group FedWatch Tool, markets are currently pricing in a 25% probability that the Fed will leave the policy rate unchanged in March.

EUR/USD and GBP/USD Price Forecast: Global Events and Manufacturing Data Impact

EUR/USD and GBP/USD Price Forecast: Global Events and Manufacturing Data Impact

Quick Fundamental’s Outlook

The fundamental analysis of the EUR/USD and GBP/USD pairs involves considering recent geopolitical and economic events. Saudi Arabia’s recent accession to the BRICS bloc, which now also includes the UAE, Egypt, Iran, and Ethiopia, may influence global economic dynamics, potentially impacting these currency pairs.

For the EUR/USD, data such as the Spanish, Italian, French, and German Manufacturing PMIs, and the Eurozone’s M3 Money Supply and Private Loans figures, suggest a mixed economic outlook in the Eurozone. Weaker manufacturing data could pressure the Euro, while any positive financial data might support it.

Trading Derivatives carries a high level of risk to your capital and you should only trade with money you can afford to lose. Trading Derivatives may not be suitable for all investors, so please ensure that you fully understand the risks involved, and seek independent advice if necessary. A Product Disclosure Statement (PDS) can be obtained either from this website or on request from our offices and should be considered before entering into a transaction with us. Raw Spread accounts offer spreads from 0.0 pips with a commission charge of USD $3.50 per 100k traded. Standard account offer spreads from 1 pips with no additional commission charges. Spreads on CFD indices start at 0.4 points. The information on this site is not directed at residents in any country or jurisdiction where such distribution or use would be contrary to local law or regulation.

In the case of GBP/USD, the UK’s BRC Shop Price Index remaining stable and the Final Manufacturing PMI aligning with expectations indicate a steady economic scenario in the UK. However, global events, like the Saudi accession to BRICS, may introduce volatility to the pair.

Investors should also consider upcoming data releases like the German Unemployment Change, the US ISM Manufacturing PMI, JOLTS Job Openings, and ISM Manufacturing Prices, along with the FOMC Meeting Minutes, to gauge future movements of these pairs.

These indicators will provide insights into the economic health of both regions, influencing the EUR/USD and GBP/USD currency pairs.

EUR/USD Technical Outlook

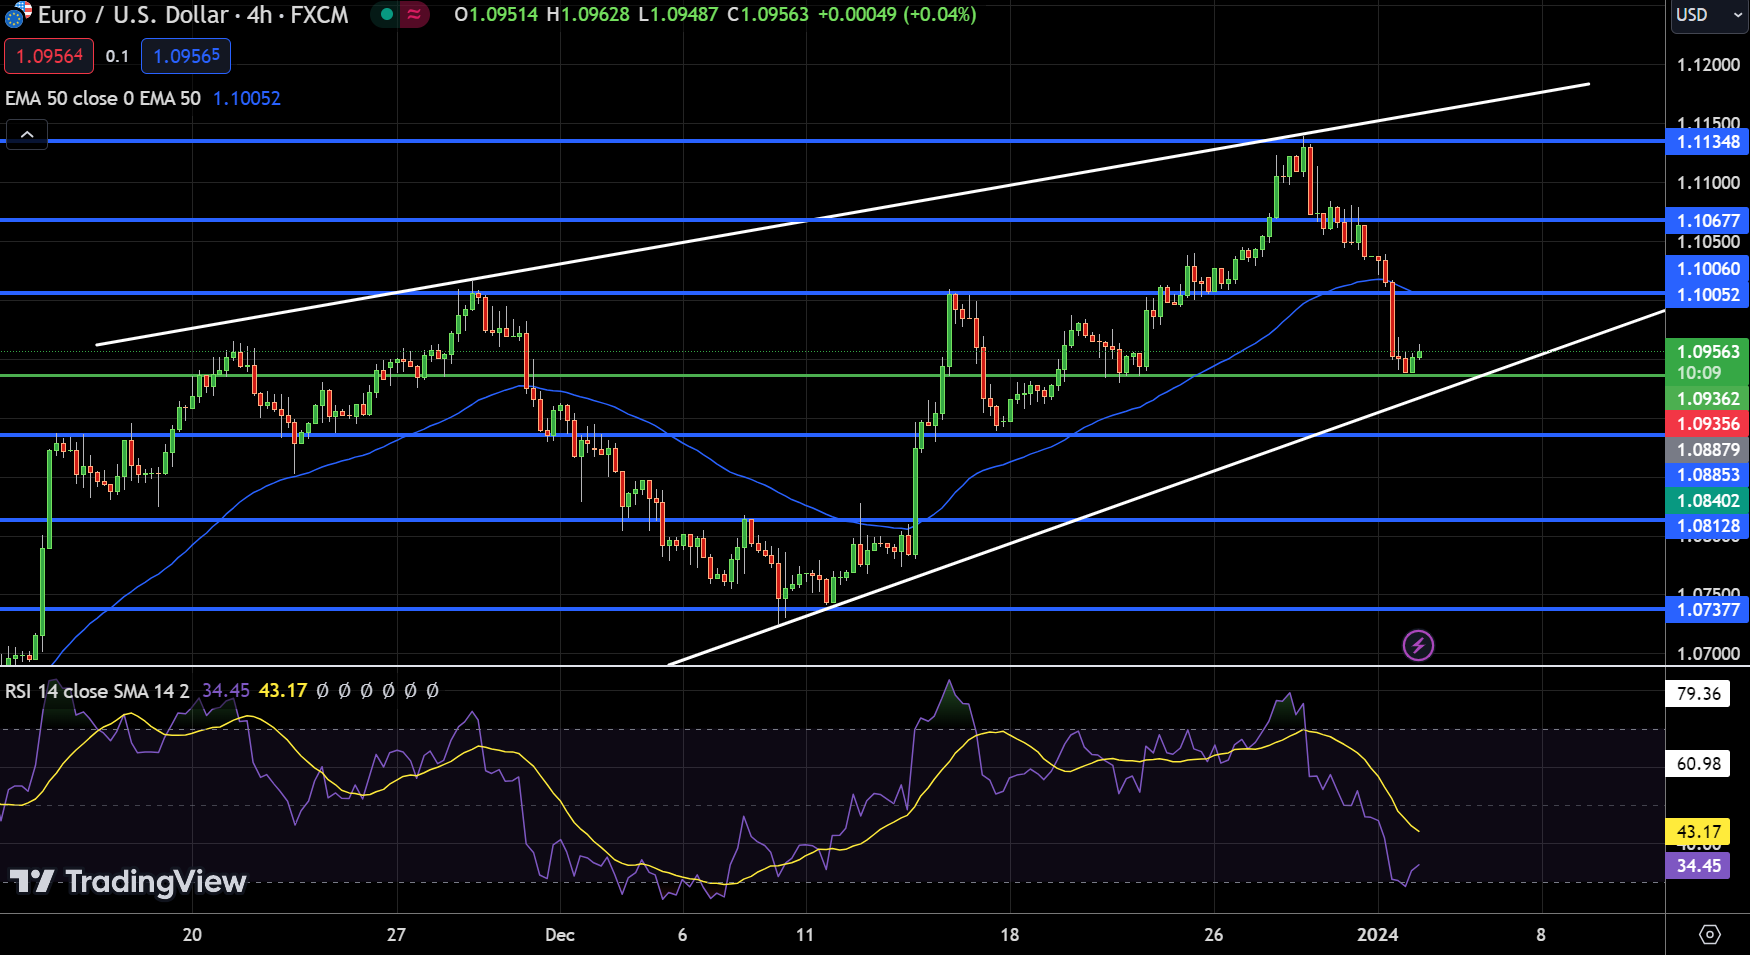
As of January 3, the EUR/USD pair shows a modest uptick, trading at 1.09563 with a slight 0.04% increase. It orbits around a pivot point of $1.0936, facing resistance at $1.1005, $1.1068, and $1.1135, and support at $1.0885, $1.0813, and $1.0738.

EUR/USD
EUR/USD Price Chart – Source: TradingviewThe Relative Strength Index (RSI) at 34 indicates a bearish sentiment, leaning towards oversold conditions. Currently, the pair is trading just below its 50-Day Exponential Moving Average (EMA) of $1.1005, suggesting a short-term bearish trend.

However, an upward trendline around the pivot point could support a potential shift towards bullish momentum. The overall trend remains cautiously optimistic, with a bullish outlook above the $1.0936 mark.

GBP/USD Technical Outlook

On January 3, the GBP/USD pair exhibited a slight gain, trading at 1.2633, a 0.03% increase. The pair is navigating around a pivot point of 1.26121, facing immediate resistance at 1.26990, 1.27651, and 1.28275, while support levels are established at 1.25356, 1.24748, and 1.23983.

GBPUSD
GBP/USD Price Chart – Source: TradingviewThe Relative Strength Index (RSI) stands at 38, suggesting a bearish sentiment leaning towards oversold conditions. Notably, the pair trades below its 50-Day Exponential Moving Average (EMA) of 1.26962, indicating a short-term bearish trend.

However, an upward trendline near the pivot point could indicate a potential shift towards bullish momentum. The overall outlook for GBP/USD remains cautiously optimistic, leaning bullish above the pivot point of 1.26121.

XRP News: SEC vs. Ripple Uncertainty and Legal Battles – What Lies Ahead?

XRP News: SEC vs. Ripple Uncertainty and Legal Battles – What Lies Ahead?

The Tuesday Overview

On Tuesday, XRP declined by 0.83%. Partially reversing a 2.37% rally from Monday, XRP ended the day at $0.6245.

SEC v Ripple: Uncertainty Left XRP in Negative Territory

There were no SEC v Ripple case-related updates for investors to consider on Tuesday. The lack of case-related news left investors considering the road ahead for Ripple in the Courts. Uncertainty about the penalty for XRP sales to US institutional investors lingers.

Trading Derivatives carries a high level of risk to your capital and you should only trade with money you can afford to lose. Trading Derivatives may not be suitable for all investors, so please ensure that you fully understand the risks involved, and seek independent advice if necessary. A Product Disclosure Statement (PDS) can be obtained either from this website or on request from our offices and should be considered before entering into a transaction with us. Raw Spread accounts offer spreads from 0.0 pips with a commission charge of USD $3.50 per 100k traded. Standard account offer spreads from 1 pips with no additional commission charges. Spreads on CFD indices start at 0.4 points. The information on this site is not directed at residents in any country or jurisdiction where such distribution or use would be contrary to local law or regulation.

Hopes of an early settlement have faded as the SEC and Ripple proceed through remedies-related discovery. The parties must conclude remedies-related discovery by February 12, 2024. Remedy-related brief filings between March 13 and April 19 will give investors a view of the SEC and Ripple’s positions vis-à-vis the range for a penalty. After April 19, Judge Analisa Torres will deliberate on the penalty Ripple must pay.

The crypto community will react to a court-imposed Ripple penalty. However, the SEC’s plan to appeal the Programmatic Sales of XRP ruling remains the focal point. In the SEC v Terraform Labs case, the court ruling that Luna and TerraUSD are securities has created more confusion.

On the one hand, progress toward a BTC-spot ETF market is positive. On the other hand, increasing regulatory uncertainty could continue to cap the upside for XRP in the near term.

A successful appeal against the Programmatic Sales ruling could materially impact XRP and the broader crypto market. An appeal could extend the SEC v Ripple case into 2025.

However, the SEC v Coinbase (COIN) case could deliver swift regulatory certainty. On January 17, Judge Failla will hear oral arguments on the Coinbase motion to dismiss (MTD). If Judge Failla grants the MTD, the SEC could lose its free reign to regulate US crypto exchanges. Such an outcome would be a boon for XRP and the broader market.

In August, Coinbase filed an MTD arguing the SEC lacks the statutory authority to regulate crypto exchanges. Senator Cynthia Lummis filed an amicus curiae brief supporting the Coinbase MTD.

XRP Price Action

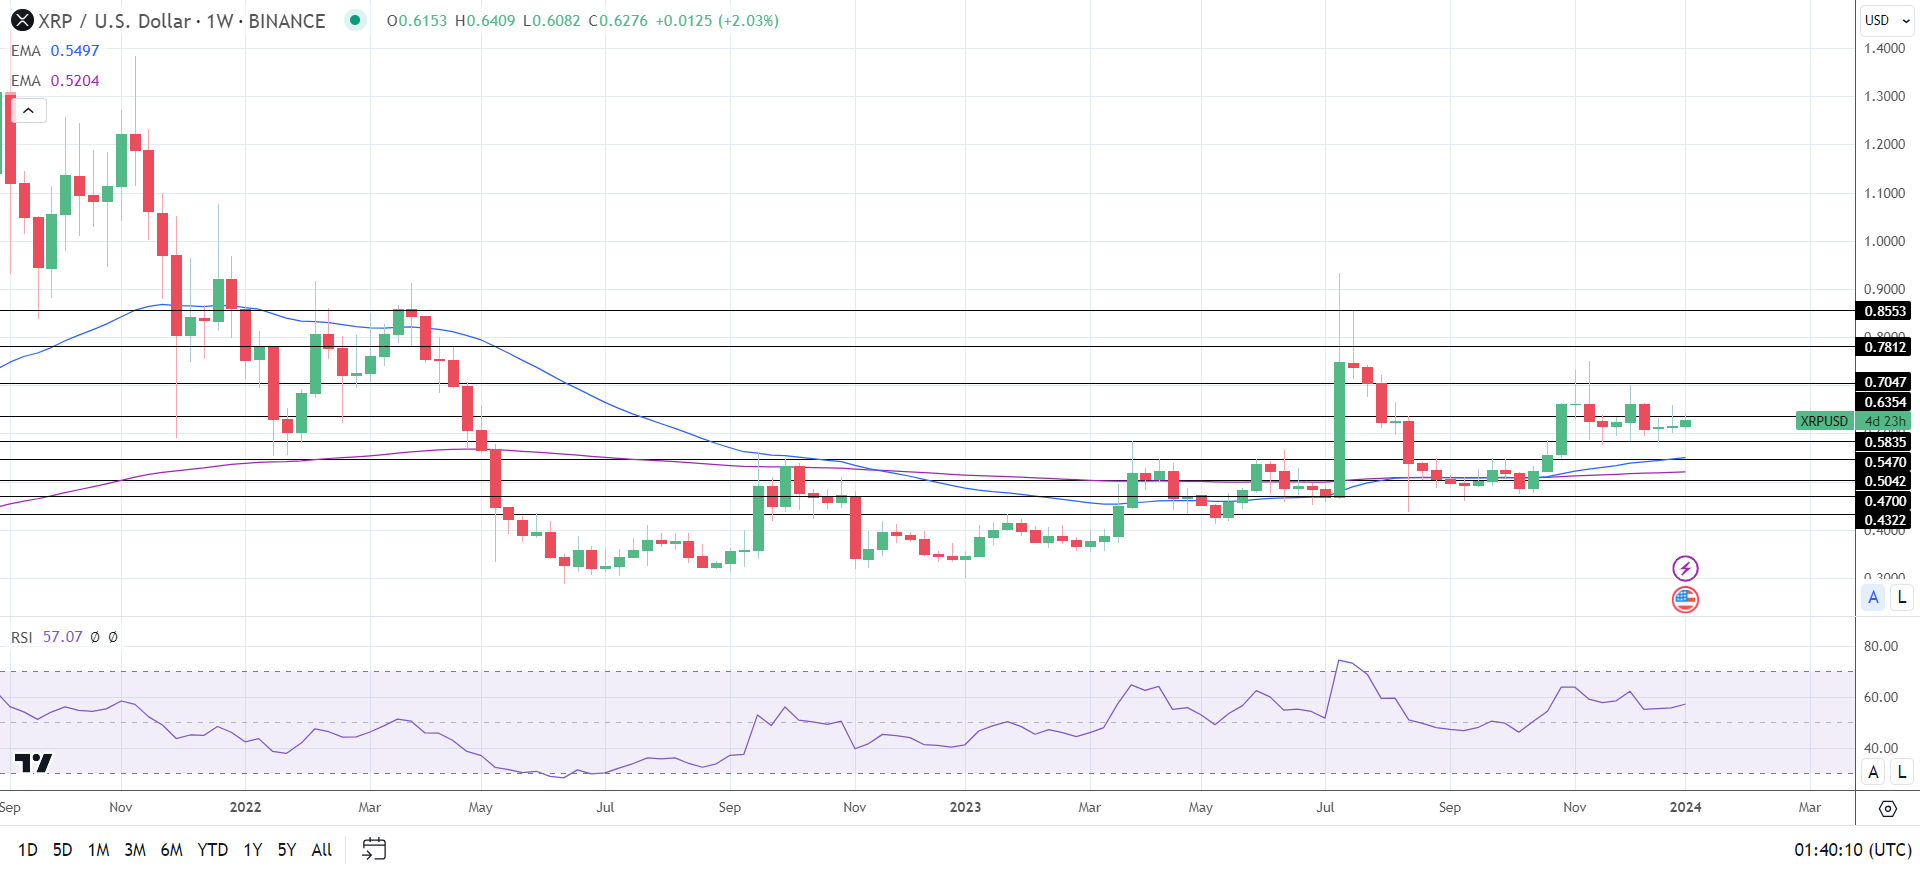
Weekly Chart sends bullish price signals.
XRPUSD 030124 Weekly Chart

Daily Chart

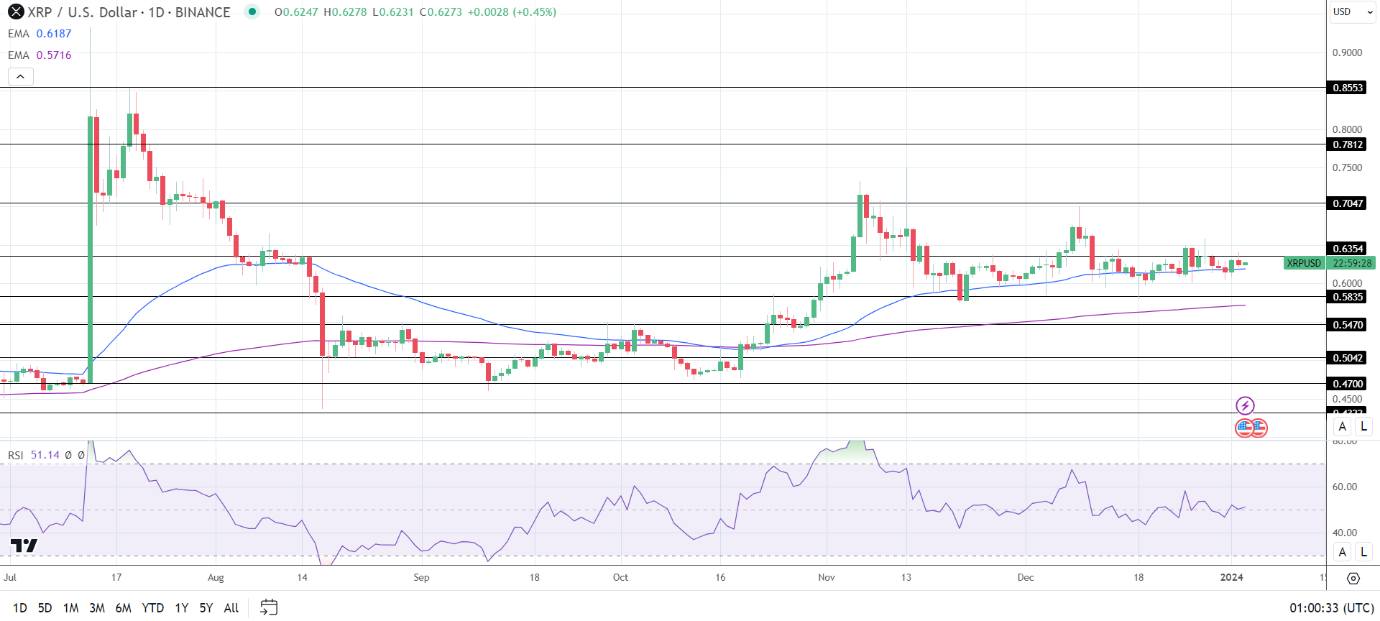
XRP held above the 50-day and 200-day EMAs, sending bullish price signals.

An XRP break above the $0.6354 resistance level would support a move toward the $0.7047 resistance level.

On Wednesday, the focus will be on SEC vs. crypto case-related updates, regulatory scrutiny, and crypto-spot ETF-related news.

However, a fall through the 50-day EMA would give the bears a run at the $0.5835 support level.

The 14-day RSI reading, 51.14, suggests an XRP breakout to the $0.65 handle before entering overbought territory.

XRP Daily Chart affirms bullish price signals.
XRPUSD 030124 Daily Chart

4-Hourly Chart

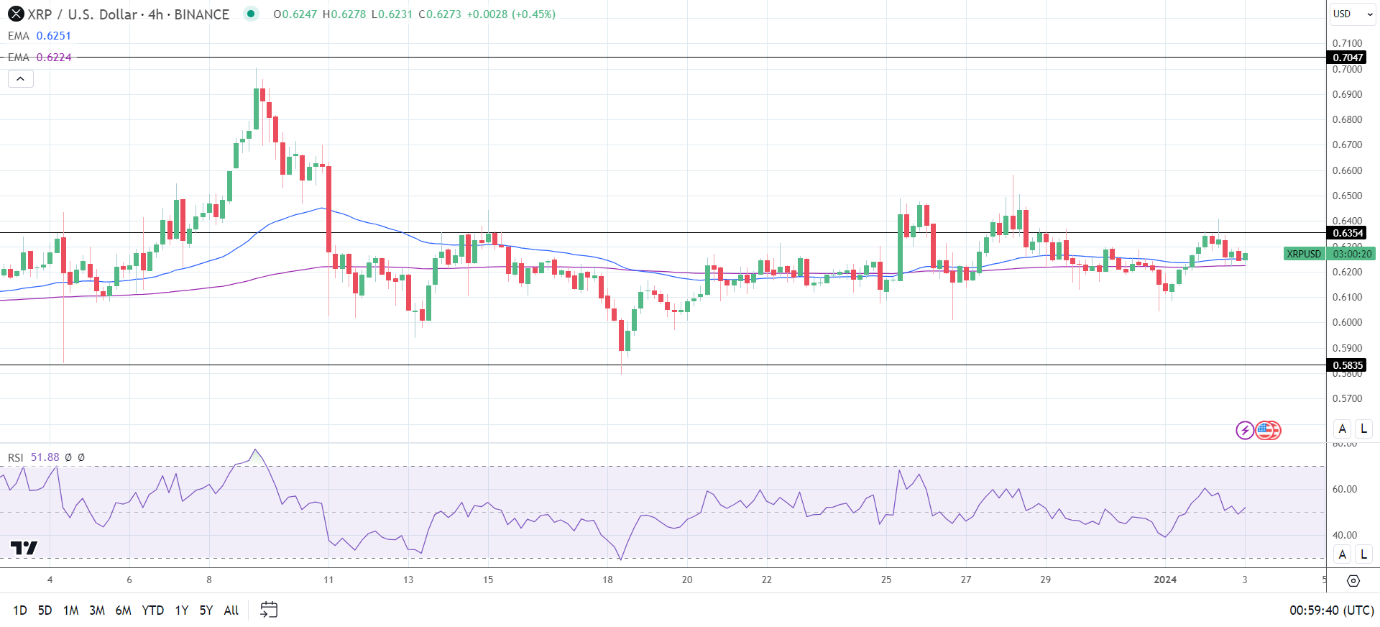
On the 4-hourly, XRP sat above the 50-day and 200-day EMAs, affirming bullish price signals.

An XRP break above the $0.6354 resistance level would bring the $0.7047 resistance level into view.

However, a break below the 50-day and 200-day EMAs would support a fall toward the $0.5835 support level.

The 4-hourly RSI, with a reading of 51.88, suggests an XRP move to $0.65 before entering overbought territory.

XRP 4-Hourly Chart reaffirms bullish price signals.