3 Things I Wish I Knew When I Started Trading Forex

3 Things I Wish I Knew When I Started Trading Forex

Everyone comes to the forex market for a reason, ranging between solely for entertainment to becoming a professional trader. I started out aspiring to be a full-time, self-sufficient forex trader. I had been taught the ‘perfect’ strategy. I spent months testing it and backtests showed how I could make $25,000-$35,000 a year off of a $10,000 account. My plan was to trade forex for a living and let my account compound until I was so well off, I wouldn’t have to work again in my life. I was dedicated and I committed myself to the plan 100%.

Sparing you the details, my plan failed. It turns out that trading 300k lots on a $10,000 account is not very forgiving. I lost 20% of my account in three weeks. I didn’t know what hit me. Something was wrong. Luckily, I stopped trading at that point and was fortunate enough to land a job with a forex broker. I spent the next couple of years working with traders around the world and continued to educate myself about the forex market. It played a huge role in my development to be the trader I am today. Three years of profitable trading later, it’s been my pleasure to join the team at DailyFX and help people become successful or more successful traders.

The point of me telling this story is because I think many traders can relate to starting off in this market, not seeing the results that they expected and not understanding why. These are the three things I wish I knew when I started trading Forex.

1) Forex is not a get rick quick opportunity

Contrary to what you’ve read on many websites across the web, Forex trading is not going to take your $10,000 account and turn it into $1 million. The amount we can earn is determined more by the amount of money we are risking rather than how good our strategy is. The old saying “It takes money to make money” is an accurate one, Forex trading included.

But that doesn’t mean it is not a worthwhile endeavor; after all, there are many successful Forex traders out there that trade for a living. The difference is that they have slowly developed over time and increased their account to a level that can create sustainable income.

I hear about traders all the time targeting 50%, 60% or 100% profit per year, or even per month, but the risk they are taking on is going to be pretty similar to the profit they are targeting. In other words, in order to attempt to make 60% profit in a year, it’s not unreasonable to see a loss of around 60% of your account in a given year.

“But Rob, I am trading with an edge, so I am not risking as much as I could potentially earn” you might say. That’s a true statement if you have a strategy with a trading edge. Your expected return should be positive, but without leverage, it is going to be a relatively tiny amount. And during times of bad luck, we can still have losing streaks. When we throw leverage into the mix, that’s how traders attempt to target those excessive gains. Which in turn is how traders can produce excessive losses. Leverage is beneficial up to point, but not when it can turn a winning strategy into a loser.

2) Leverage can be a winning strategy to lose money

This is a lesson I wish I had learned earlier. Excessive leverage can ruin an otherwise profitable strategy.

Let’s say I had a coin that when heads was hit, you would earn $2, but when tails was hit, you would lose $1. Would you flip that coin? My guess is absolutely you would flip that coin. You’d want to flip it over and over. When you have a 50/50 chance between making $2 or losing $1, it’s a no-brainer opportunity that you’d accept.

Now let’s say I have the same coin, but this time if heads is hit, you would triple your net worth; but when tails was hit, you would lose every possession you own. Would you flip that coin? My guess is you would not because one bad flip of the coin would ruin your life. Even though you have the exact same percentage advantage in this example as the example above, no one in their right mind would flip this coin.

The second example is how many Forex traders view their trading account. They go “all-in” on one or two trades and end up losing their entire account. Even if their trades had an edge like our coin flipping example, it only takes one or two unlucky trades to wipe them out completely. This is how leverage can cause a winning strategy to lose money.

So how can we fix this? A good start is by using no more than 10x effective leverage.

3) Using sentiment as a guide can tilt the odds in your favor

The 3rd lesson I’ve learned should come as no surprise to those that follow my articles… using the IG client sentiment tool (IGCS). I’ve written many articles about this topic. It’s the best tool I’ve ever used and is still a part of almost every trading strategy I am using, present day.

IGCS is a free tool that tells us how many traders are long compared to how many traders are short each major currency pair. It’s meant to be used as a contrarian index where we want to do the opposite of what everyone else is doing. Using it as a direction filter for my trades has turned my trading career completely around.

Learn from my mistakes

If I could tell my younger self three things before I began trading forex, this would be the list I would give. Utlimately though, if you are just starting out in the forex market, the best thing you can do is take time to learn as much as you can, starting with the basics. Read guides, keep up to date with the latest news and follow market analysts on social media.

Forex Trading Tips FAQs

How much money can you make trading forex?

Due to the availability of leverage, forex traders can make a return on a single trade that is multiples of the margin they used to open the trade. However, leverage is a double edged sword in that big gains can also mean big losses. Therefore, reliance on excessive leverage as a strategy typically leads to destruction of your account capital over the long run. This is because it only takes one adverse market move to drive the market far enough and trigger substantial losses.

Your expectations on a return on investment is a critical element. When traders expect too much from their account, they rely on excessive leverage and that typically triggers a losing account over time. View forex like you would any other market and expect normal returns by using conservative amounts of no leverage.

Since forex is a 24 hour market, the convenience of trading based on your availability makes it popular among day traders, swing traders, and part time traders. Regardless of your style, use small (if any) amounts of leverage.

If you were to expand the list to a fourth thing learned when starting to trade FX, what would it be?

I touched on leverage above. We researched millions of live trades and compiled our results in a Traits of Successful Traders guide. In the guide we touch on risk to reward ratios and how it is important. With humans being human, we also touch on the psychological element that goes along with trading and why we may still make poor choices even if we know what is right. Sometimes our biggest obstacle is between our ears.

How to Create a Trading Plan in 7 Steps

How to Create a Trading Plan in 7 Steps

Trading Plan – Main Talking Points

  • What is a trading plan?
  • How to create a trading plan
  • Trading plans: A Summary

What is a Trading Plan?

A trading plan is essentially a framework that guides traders through the entire trading process. It sets the conditions under which a trader enters trades, identifies markets, exits trades and manages risks along the way. The trading plan ensures accountability and keeps traders focused on their personal strategy.

trading plan on the wall

How to Create a Trading Plan

1) Choose Your Analytical Approach

The analytical approach answers the question, “how do you identify trade set-ups?”. It could be a combination of price support and resistance, trend lines, chart patterns, Fibonacci levels, moving averages, Ichimoku Clouds, Elliott Wave Theory, sentiment or the use of fundamentals etc.

This initial step of the trading plan helps traders to narrow their focus on a handful of scenarios that the trader is comfortable with. Thereafter, traders can look for opportunities to trade based on preferred trade set ups.

2) Select Your Favourite Trade Set Ups

The trade setup is at the core of the trading process. But first, think of the analytical approach as the event that triggers the trade setup. An example of this would be viewing a consolidation pattern (listed in the analytical approach as a chart pattern) which then gives rise to subsequent action from the trader, i.e. the trader will decide to trade the breakout or wait for a pullback or combine breakouts with pullbacks only after the chart pattern has successfully played out.

Set ups are based on a number of factors that collectively lead to higher probability trades. If you are new to forex trading, this process may take some time to figure out but it is essential for traders to find a trade setup that works best for them.

3) Limit the Markets to Focus on

When starting out, it is important for traders to limit the number of markets in focus. No market is the same and limiting the scope of markets can assist traders to understand the nuances of the market in question. Traders can even focus on specific time frames in a single market to familiarize themselves with its characteristics and movements.

4) Think About Your Holding Period

Time frames will depend on the type of trader. Traders that focus on short-term trades (trades opened and closed on the same day) include scalpers and day traders. Medium-term traders usually hold trades for a few hours up to a few days and are referred to as swing traders. Long-term trading involves time frames ranging from a number of days, weeks, months and in some cases, years.

Planning is essential to any trading plan

5) Know Your Risk Tolerance

Each step in the trading plan is important, however, if risk management is missing, the whole plan will fall apart. In this step, traders will need to discover their personal risk tolerance which corresponds with how far a trader is willing to set stop losses when limiting downside risk.

At DailyFX, we researched over 30 million live trades to discover that traders with a minimum risk to reward ratio of 1:1 were three times more likely to turn a profit than traders without any defined risk-to-reward. This and other information all traders should know can be found in our Traits of Successful Traders report.

6) Plan How You Will Handle Adversity (and Success)

All traders will eventually experience the dreaded drawdown, so it is important for traders to set a few rules to follow once this happens in order to manage emotions. An effective way to do this is to quantify an amount, or percentage loss, that would force the trader to take a step back and evaluate what went wrong/ is going wrong. Do not fall into the trap of setting this figure along the way, rather quantify this upfront.

Now the good news – what to do when trades are successful. Confidence is good, but overconfidence can quickly turn winning trades into losing trades. If the market moves favorably it is not unusual to increase risk/exposure however, this should be kept to a minimum.

7) Have a Routine For Staying on Track

Traders should set aside time to reflect on the week’s events and analyze individual trades. It’s a good idea to regularly review the trading plan and make tweaks if necessary. Periodical trade review and journaling are excellent ways to ensure you are following the process outlined in the trading plan. Make a note or save charts relating to successful/unsuccessful trade set ups that can be reviewed later on.

Trading plans should be rigid to begin with but should become a little more malleable as the trader becomes more familiar with the market in focus. The purpose of a trading plan is to give you a strong foundation and boundaries to operate within.

10 Trading Mistakes to Avoid in Forex Trading

10 Trading Mistakes to Avoid in Forex Trading

Human error in the forex market is common and often leads to familiar trading mistakes. These trading mistakes crop up particularly with novice traders regularly. Being aware of these errors can help traders become more efficient in their forex trading. Although all traders make trading mistakes regardless of experience, understanding the logic behind these mistakes may limit the snowball effect of trading impediments. This article will outline the top ten trading mistakes and ways to overcome them. These mistakes are part of a constant learning process whereby traders need to habitually familiarise themselves with them to avoid repeat wrongdoings.

The video included highlights six trading mistakes, however, there will be more covered in the article below. It is important to note that trading comes with the inevitability of loss, but these may be minimized with the exclusion of human error/mistakes.

Before committing to forex trading, consider these 10 widespread trading mistakes you must evade as they contribute to a large proportion of unsuccessful trades.

trading mistakes

Mistake 1: No trading plan

Traders without a trading plan tend to be haphazard in their approach because there is no consistency in strategy. Trading strategies have predefined guidelines and approaches to every trade. This prevents traders from making irrational decisions due to adverse movements. Devoting to a trading strategy is key because veering away may lead to traders plunging themselves into unchartered territory with regard to trading style. This eventually results in trading mistakes due to unfamiliarity. Trading strategies should be tested on a demo account. Once traders are comfortable and understand the strategy, this can be translated to a live account.

Mistake 2: Over-leveraging

Margin/leverage refers to the use of loaned money to open forex positions. While this feature requires less personal capital per trade, the possibility of enhanced loss is real. The use of leverage magnifies gains and losses, so managing the amount of leverage is key. Learn more on what is leverage in the forex market.

Brokers play an important role in protecting their customers. Many brokers offer unnecessarily large leverage levels such as 1000:1 which puts novice and experienced traders at significant risk. Regulated brokers will cap leverage to appropriate levels guided by respected financial authorities. This should be taken into consideration when selecting a fitting broker.

Mistake 3: Lack of time horizon

Time investment works hand in hand with the trading strategy being implemented. Each trading approach aligns itself to varying time horizons, therefore understanding the strategy will lead to gauging the estimated time frame used per trade. For example, a scalper will target shorter time frames whilst position traders favour longer time frames. Explore the forex strategies for varying time horizons.

Mistake 4: Minimal research

Forex traders are required to invest in proper research to employ and execute a specific trading strategy. Studying the market as it should be, will bring light to market trends, the timing of entry/exit points, and fundamental influences as well. The more time dedicated to the market, the greater the understanding of the product itself. Within the forex market, there are subtle nuances between the different pairs and how they work. These differences need a thorough examination to succeed in the market of choice.

Reacting to media and baseless advice should be avoided without verification from the employed strategy and analysis. This is a common occurrence with traders. This does not mean these tips and media releases should not be considered but rather investigated systematically before acting on the information.

Mistake 5: Poor risk-to-reward ratios

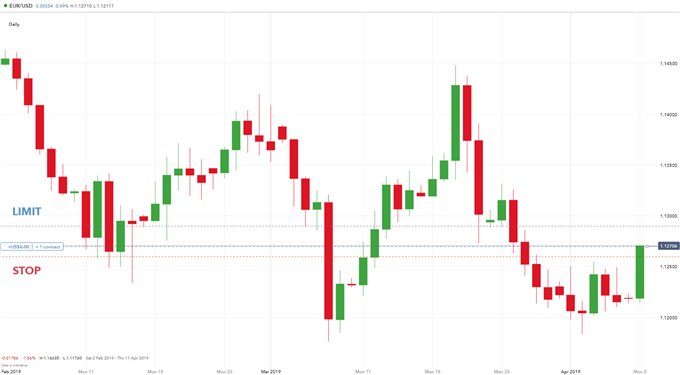
Positive risk-to-reward ratios are often overlooked by traders which can result in poor risk management. A positive risk-to-reward ratio such as 1:2 refers to potential profit being double the potential loss on the trade. The chart below shows a long EUR/USD trade with a 1:2 risk-to-reward ratio. The trade was opened at a level of 1.12698 with a stop at 1.12598 (10 pips) and a limit of 1.12898 (20 pips). An effective indicator to help identify stop and limit levels in forex is the Average True Range (ATR) which uses market volatility to base entry and exit points.

Having a ratio in mind helps to manage expectations of traders, this is important because, after much research by DailyFX, improper risk management has proven to be the number one mistake made by traders.

EUR/USD 1:2 risk-to-reward ratio:

EUR/USD risk-t-reward ratio

Mistake 6: Emotion based trading

Emotional trading often leads to irrational and unsuccessful trading. Traders frequently open additional positions after losing trades to compensate for the previous loss. These trades usually have no educational backing either technically or fundamentally. Trading plans are there to avoid this type of trading therefore, the plan must be followed closely.

Mistake 7: Inconsistent trading size

Trading size is crucial to every trading strategy. Many traders trade unsuitable sizes in relation to their account size. Risk then increases and could potentially erase account balances. DailyFX recommends risking a maximum of 2% of the total account size. For example, if the account contains $10,000 then a maximum of $200 of risk is suggested per trade. If traders observe this general rule, the pressure of overexposing the account will be removed. The inherent risk of overexposing the account on a particular market is extremely dangerous.

Mistake 8: Trading on numerous markets

Trading on a few markets lets traders gain the necessary experience to become proficient at these markets without scratching the surface of a few markets. Many novice forex traders look to trade on multiple markets without success due to a lack of understanding. This is something that should be done on a demo account if need be. Noise trading (irrational trading) often leads traders to place trades without the proper fundamental/technical justification on varying markets. For example, the Bitcoin craze of 2018 sucked in a lot of noise traders at the wrong time. Unfortunately, many traders entered at the ‘FOMO or Euphoria’ stage of the market cycle which resulted in significant losses.

Mistake 9: Not reviewing trades

Frequent use of a trading journal will allow traders to identify possible strategic flaws along with successful facets. This will enhance the trader’s overall understanding of the market and strategy for future. Reviewing trades not only highlights errors but beneficial aspects as well which must be reinforced constantly.

Mistake 10: Selecting an unsuitable broker

There are numerous CFD brokers globally, so choosing the right one can be difficult. Financial stability and proper regulation are essential before opening an account with a broker. This information should be readily available on the broker’s website. Many brokers are regulated in countries where guidelines are weak, to circumvent regulations in stricter jurisdictions such as the US (Commodity Exchange Act) and the UK (FCA).

Safety is the primary focus; however, a comfortable platform and ease of execution is also central to choosing a broker. Becoming accustomed with the platform and costing should be given ample time prior to trading with live funds.

USD: The activity data will now be key – ING

USD: The activity data will now be key – ING

Fed Chair Jerome Powell used his speech at the Jackson Hole symposium to pre-announce the start of the Fed’s easing cycle in September. Short-dated US rates fell about 15bp into Monday’s session and the DXY dollar index sold off around 1%. In effect, Powell declared the inflation battle won, with the attention now turning squarely to the US labour market. The latter featured heavily in Powell’s speech, ING’s FX strategist Chris Turner notes.

A US soft landing is priced

“Notably, US one-month OIS rates price two years forward remain at their lows at 3.00%. This pricing looks consistent with a soft landing and assumes some orderly – perhaps 25bp per meeting – Fed rate cuts through to autumn 2025. Arguably near 100, the DXY prices that scenario in and for DXY to break convincingly under 100, fears of a US recession will have to build. And in the middle of all this, we have US elections in early November.”

“Therefore, much lower USD levels from here require much weaker US activity data, where focus will be given to the August jobs report on 6 September. This week sees some second-tier US activity data in the form of consumer confidence (Tuesday and Friday), plus the weekly initial claims data (Thursday) and personal income and spending data (Friday). Given Powell’s speech on Friday, the release of the core PCE deflator probably takes on a less pivotal role now.”

“We note the USD is at some significant medium-term support levels. We do not think it needs to rally much from here, but equally, the catalyst for a major downside break-out may not be present this week. DXY looks set to consolidate in a 100.50-101.90 range for now.”

Major pairs hold steady as focus shifts to US Consumer Confidence data

Major pairs hold steady as focus shifts to US Consumer Confidence data

Major currency pairs continue to trade in relatively tight ranges early Tuesday after closing the first day of the week little changed. The US economic calendar will feature Housing Price Index data for June, the Conference Board’s Consumer Confidence Index and the Richmond Fed Manufacturing Index for August. Later in the American session, the US Treasury will hold a 2-year note auction.

US Dollar PRICE Last 7 days

The table below shows the percentage change of US Dollar (USD) against listed major currencies last 7 days. US Dollar was the weakest against the New Zealand Dollar.

USD EUR GBP JPY CAD AUD NZD CHF
USD -0.71% -1.59% -1.10% -1.16% -0.62% -1.93% -1.74%
EUR 0.71% -0.88% -0.39% -0.44% 0.11% -0.92% -1.04%
GBP 1.59% 0.88% 0.48% 0.45% 1.01% -0.05% -0.17%
JPY 1.10% 0.39% -0.48% -0.05% 0.49% -0.55% -0.67%
CAD 1.16% 0.44% -0.45% 0.05% 0.54% -0.48% -0.62%
AUD 0.62% -0.11% -1.01% -0.49% -0.54% -1.02% -1.18%
NZD 1.93% 0.92% 0.05% 0.55% 0.48% 1.02% -0.14%
CHF 1.74% 1.04% 0.17% 0.67% 0.62% 1.18% 0.14%

The heat map shows percentage changes of major currencies against each other. The base currency is picked from the left column, while the quote currency is picked from the top row. For example, if you pick the US Dollar from the left column and move along the horizontal line to the Japanese Yen, the percentage change displayed in the box will represent USD (base)/JPY (quote).

The upbeat Durable Goods Orders data for July and the mixed action seen in Wall Street’s main indexes helped the US Dollar (USD) stay resilient against its rivals on Monday. Following the previous week’s sharp decline, the USD Index closed in positive territory on Monday and was last seen moving sideways slightly below 101.00. Meanwhile, US stock index futures trade flat on the day in the European morning. Reuters reported earlier in the day that US Air Force General C.Q. Brown, chairman of the Joint Chiefs of Staff, said that fears of a near-term broader Middle East conflict have ebbed after Israel and Lebanon’s Hezbollah exchanged fire without further escalation.

The data from Germany showed that the GfK Consumer Confidence Index declined to -22 for September from -18.6. This reading came in worse than the market expectation of -17.5. In the meantime, Germany’s Destatis confirmed that the Gross Domestic Product (GDP) contracted 0.1% on a quarterly basis in the second quarter. EUR/USD holds steady above 1.1150 after closing marginally lower on Monday.

GBP/USD edged lower on Monday but managed to stabilize at around 1.3200 early Tuesday.

Japan’s Finance Minister Shunichi Suzuki said on Tuesday that FX rates are determined by various factors, not just monetary policies and interest rate differentials but also by geopolitical risks, market sentiment and others. After closing marginally higher on Monday, USD/JPY trades in a narrow band near 145.00 in the early European session.

Gold failed to preserve its bullish momentum after rising toward $2,530 early Monday and closed the day with small gains. Gold stays on the back foot on Tuesday and retreats toward $2,500

Gold slides on reduced haven demand, better US data

Gold slides on reduced haven demand, better US data

Gold (XAU/USD) trades marginally lower in the $2,510s on Tuesday as tensions in the Middle East dissipate, reducing haven demand for the yellow metal. This comes after Israel and Hezbollah’s tit-for-tat missile exchange fails to escalate, though ongoing threats from Iran hover.

Gold may also be edging lower after the release of better-than-expected US Durable Goods Orders data on Monday. The 9.9% rise recorded in July was the highest reading since May 2020 and helped dispel some of the pessimism surrounding the US economy. This, in turn, probably acted as an antidote to expectations the Federal Reserve (Fed) will need to cut interest rates aggressively to avoid a hard landing.

A more gradual programme of cuts would limit the upside for Gold, which is a non-interest paying asset that tends to be viewed more attractively the lower rates are.

The probability of the Fed making a mega 0.50% interest rate cut in September rather than the standard 0.25% reduction has eased back down below 30%. It had risen up to around 35% after Federal Reserve (Fed) Chairman Jerome Powell made the clearest signal yet that cuts were in pipeline at his speech in Jackson Hole on Friday.

Gold slips on reduced haven demand, strong US data

Gold edges lower on Tuesday as safety demand eases. US Air Force General C.Q. Brown, chairman of the Joint Chiefs of Staff, said early Tuesday that fears of a near-term broader Middle East conflict between Israel and Lebanon’s Hezbollah have eased following a lack of escalation. Nonetheless, the US top General warned that “Iran still poses a significant danger as it weighs a strike on Israel,” according to Reuters.

The US Dollar Index (DXY), which measures the strength of the Dollar against a trade-weighted basket, is off its lows, recovering marginally to 100.88 on Tuesday. Gold is negatively correlated to the US Dollar (USD) as it is priced in USD.

Gold to rally in medium-term but risk of correction looms – TD Securities

Gold is likely to go higher but is also at risk of a sharp pullback due to extreme long positioning, according to Bart Melek, Head of Commodity Strategy at TD Securities.

“More upside is in the cards in coming months, but fund heavy long positioning represents a short-term correction risk,” says the strategist.

Given the Fed’s new focus is on its other mandate to provide “full employment”, there is a risk that strong employment figures could trigger an unwinding of these longs and a correction.

“A stronger-than-expected Payrolls print or any other event, which reduces the expectations of rate cuts, could trigger these players to take profits, causing a significant correction,” adds Malek.

TD Securities’ long-term upside target for Gold is $2,700, with the potential for major central bank players such as the People’s Bank of China (PBoC) providing the demand to push the precious metal up to those highs.

One possibility might be that the PBoC (and other major investors) who stopped accumulating Gold back in May – presumably because it was hoping prices would come back down to more favorable levels – may decide not to wait any longer due to fear of missing out, and start buying at current levels again, adds Malek.

Technical Analysis: Gold consolidates above top of former range

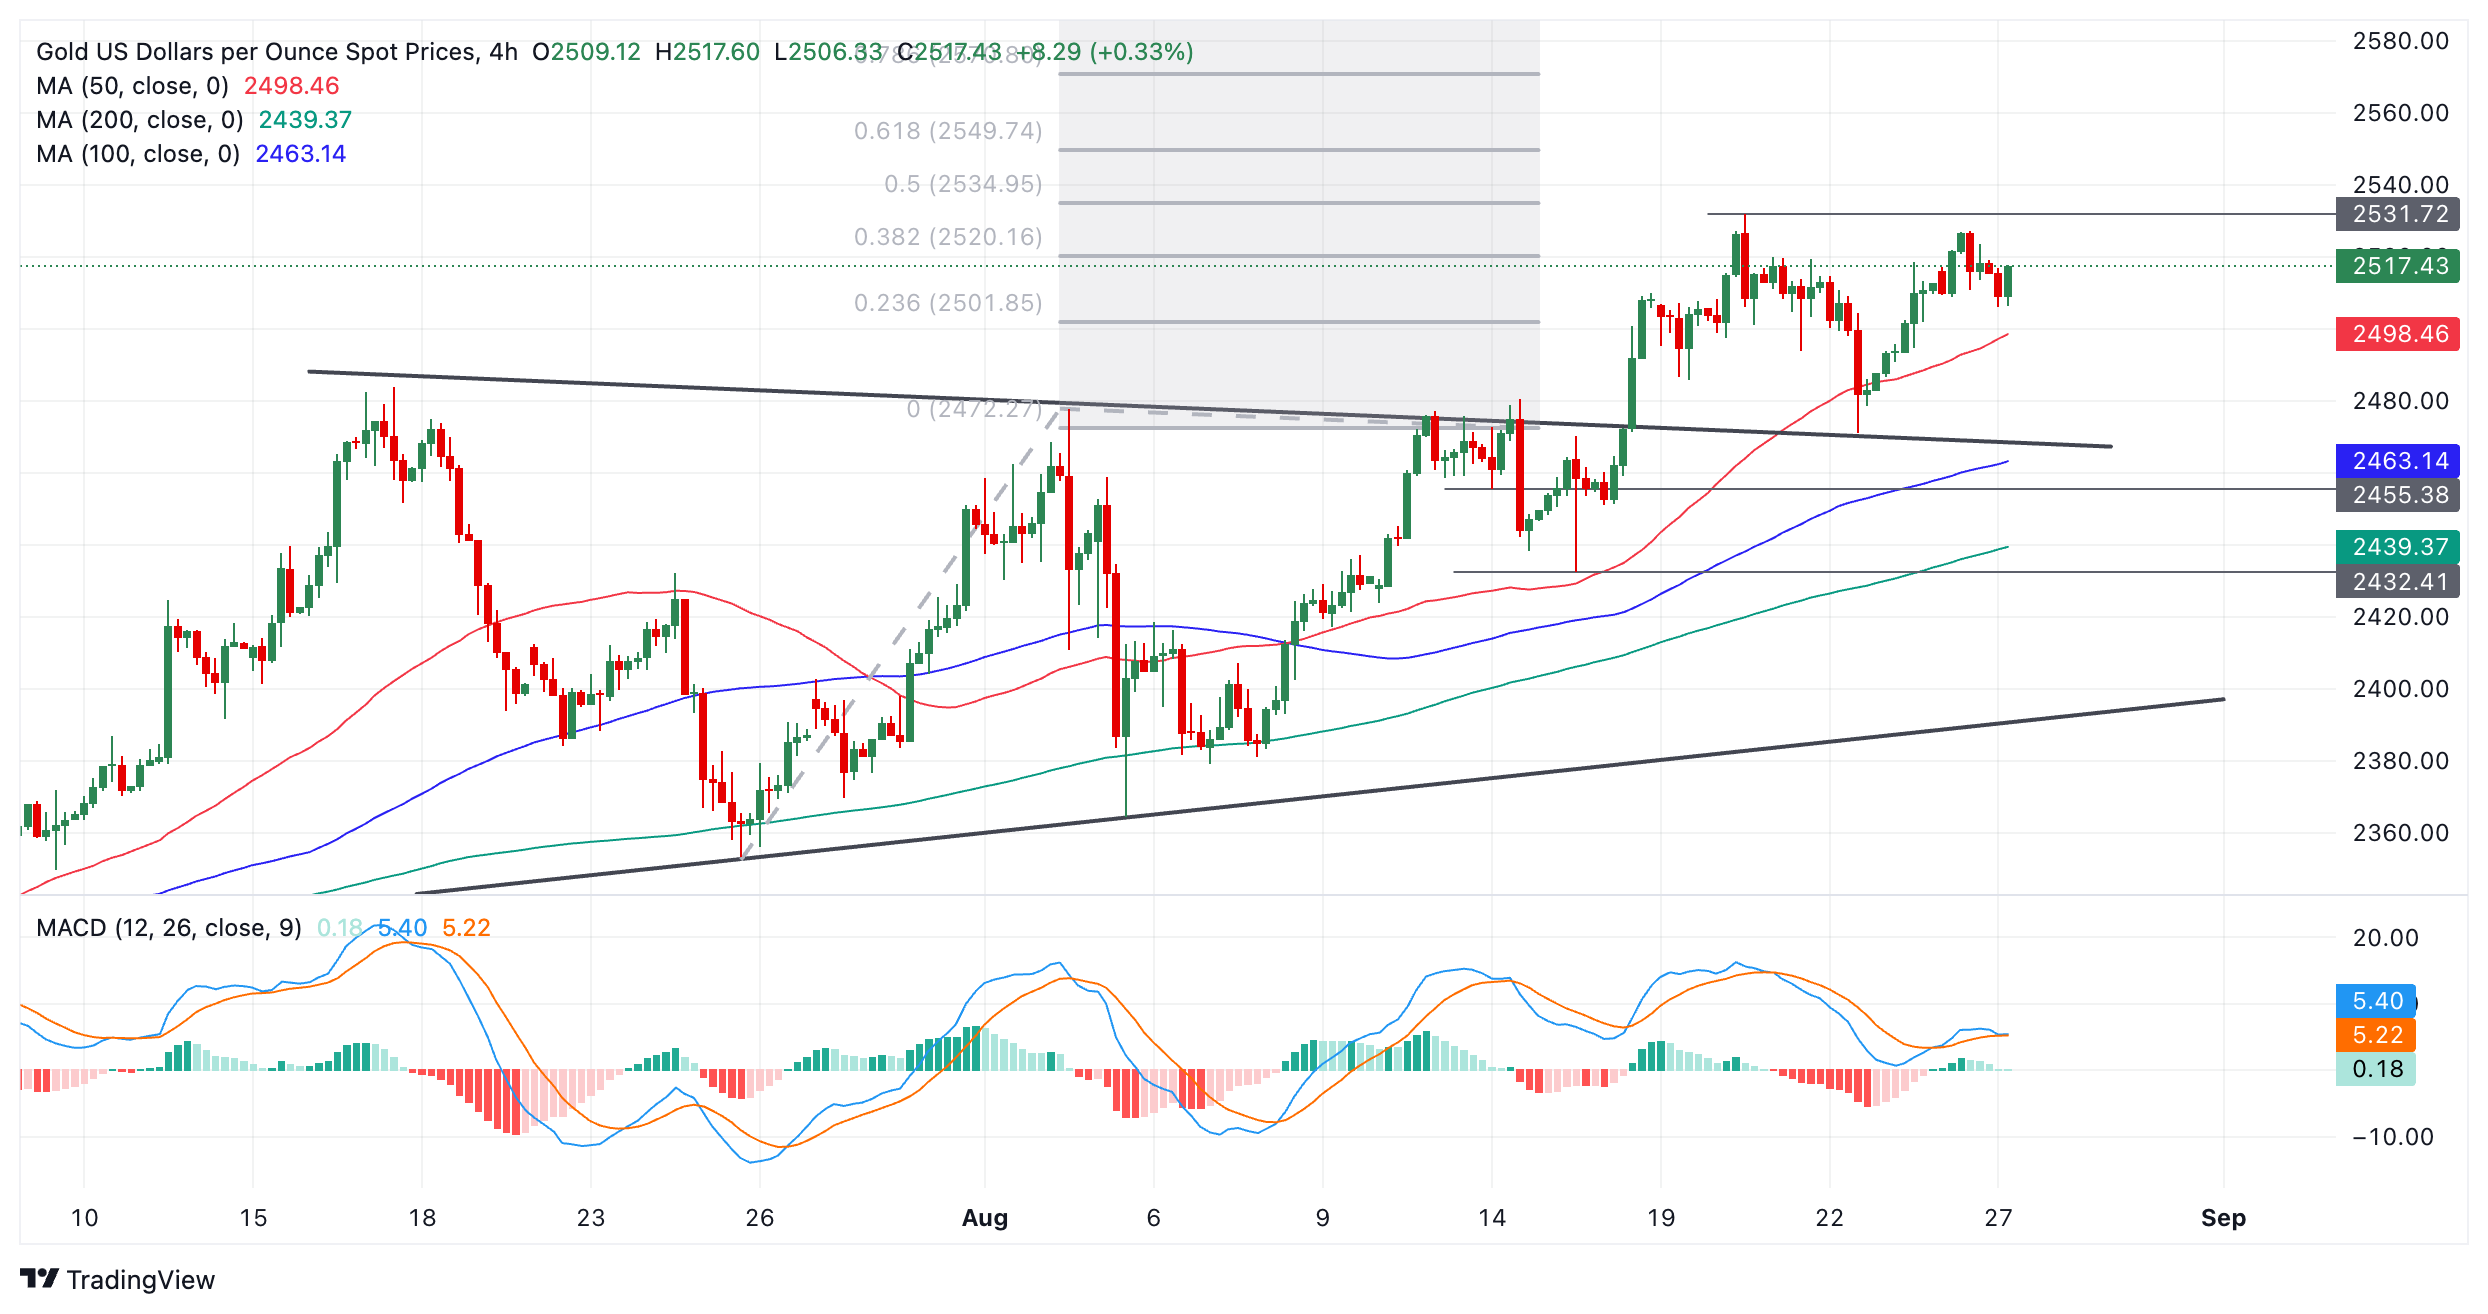
Gold (XAU/USD) continues trading above support from the top of its old range. Despite trading sideways recently, the pair remains in a short-term uptrend and given “the trend is your friend” this continues to favor longs over shorts.

XAU/USD 4-hour Chart


The breakout of the range, which looks like an incomplete triangle pattern, on August 14 generated an upside target at roughly $2,550. This was calculated by taking the 0.618 Fibonacci ratio of the range’s height and extrapolating it higher. This target is the minimum expectation for a follow-through after a breakout based on principles of technical analysis.

A break above the $2,531 all-time high from August 20 would provide added confirmation of a continuation higher towards the $2,550 target.

Alternatively, a break back inside the range would negate the upside projected target. Such a move would be confirmed on a close below $2,470 (August 22 low). It would change the picture for Gold and bring the short-term uptrend into doubt.

Gold is in a broad uptrend on medium and long-term time frames, however, which further supports an overall bullish outlook for the precious metal.

Tron’s on-chain activity benefits from recent price rally

Tron’s on-chain activity benefits from recent price rally

Tron (TRX) price rose 24% last week and showed a slight pullback to trade at $0.16 as of Tuesday. However, on-chain data suggest the bullish trend is likely to continue, evidenced by the increasing trading volume and daily revenue generated by the network.

Tron’s on-chain data hints continuation of positive trend 

Crypto intelligence tracker Artemis Terminal data shows that Tron’s Total Value Locked (TVL) increased from $8.3 billion on Friday to 8.6 billion on Monday, extending a rise that started on August 5.

This 3.6% increase in TVL indicates growing activity and interest within the Tron ecosystem, mainly due to its newly launched meme coin platform SunPump on August 13. It suggests that more users deposit or utilize assets within TRX-based protocols, adding credence to the bullish outlook.

TRX TVL chart

TRX TVL chart

Another aspect bolstering the platform’s bullish outlook is a recent surge in traders’ interest and liquidity in the TRX chain. Artemis Terminal data shows that TRX Chain’s decentralized exchange (DEX) trading volume rose from $237.9 million on Friday to $280.4 on Monday, the highest since December 2022.

Tron DEX Trading Volume

Tron DEX Trading Volume

Meanwhile, DefiLlama data shows that Tron generated $5.4 million in revenue on August 21, a new all-time high, further bolstering the bullish outlook.

Tron Daily Revenue chart

Tron Daily Revenue chart

Despite rising DEX trading volume, a new all-time high in daily revenue collected, and increasing TVL, TRX’s Development Activity has remained low, which might raise apprehensions about the project’s endurance, capacity for innovation, and engagement with the community in the foreseeable future. This indicates that investors should also be cautious about expecting an immediate price rally.

TRX Development Activity


EUR/USD holds steady above 1.1150 amid quiet markets

EUR/USD holds steady above 1.1150 amid quiet markets

EUR/USD is holding steady above 1.1150 in the European morning on Tuesday. The US Dollar struggles to extend recovery, supporting the pair amid a cautiously optimistic market mood. The focus shifts to mid-tier US economic data.

Further north, EUR/USD is expected to challenge its 2024 high of 1.1201 (August 26), ahead of the 2023 top of 1.1275 (July 18).

The pair’s next downside target is the weekly low of 1.0881 (August 8), which comes before the key 200-day SMA at 1.0848 and the weekly low of 1.0777 (August 1). From here, the low of 1.0666 (June 26) comes before the May bottom of 1.0649 (May 1).

Looking at the broader picture, the pair’s upward trend should continue as long as it remains above the key 200-day SMA.

So far, the four-hour chart shows a slight slowdown in the upward bias. The initial resistance level, 1.1201, precedes 1.1275. However, there is quick support at 1.1098, seconded by the 55-SMA of 1.1078, and then 1.0949. The relative strength index (RSI) decreased to about 62.

EUR/USD paused its multi-week upward momentum and faced some downward pressure after reaching fresh highs just above 1.1200 at the beginning of the week. This small corrective move occurred amidst a tepid resurgence of buying interest in the US Dollar (USD).

That said, the Greenback bounced back from its recent 2024 lows near 100.50 (August 26), as reflected by the US Dollar Index (DXY). This rebound was driven by a decline in risk appetite following Friday’s strong advance in response to the dovish message from Chair Jerome Powell at the Jackson Hole Symposium

It is worth recalling that Powell suggested that “it is time” to shift the monetary policy stance, opening the door to an interest rate cut at the September 18 meeting. Powell argued that it seems unlikely the labour market will contribute to heightened inflationary pressures in the near future, adding that the Fed does not seek or welcome any further cooling in labour market conditions.

Still around the labour market, Richmond Federal Reserve President Thomas Barkin indicated earlier on Monday that the “low-hiring, low-firing” strategy currently adopted by US businesses in their employment decisions is unlikely to endure, highlighting the risk that companies may resort to layoffs if the economy weakens. He noted that concerns about the job market have escalated at the Fed in recent weeks, which is a key reason why Powell remarked in a speech on Friday that interest rate cuts were necessary to prevent further, undesired increases in unemployment.

In line with these potential rate cuts, the CME Group’s FedWatch Tool indicates nearly a 70% chance of a 25 bps reduction at the September 18 meeting.

Adding to the Dollar’s daily recovery, US yields gained some traction across various maturities.

Shifting the focus to the European Central Bank (ECB), its Accounts published last week revealed that while policymakers saw no immediate need to lower interest rates last month, they cautioned that the issue might be revisited in September, given the ongoing impact of high rates on economic growth.

Still around the bank, Governing Council member Robert Holzmann suggested that a rate cut in September is not certain. He noted that if the Fed decides to lower rates, it could facilitate further rate cuts by the ECB. He also pointed out that inflation remains stubborn in certain areas and cautioned that the services sector could obstruct the achievement of the inflation target. Meanwhile, ECB Chief Economist Philip Lane struck a more cautious tone compared to the Fed, remarking that the central bank is making “good progress” in bringing inflation down to its 2% target but may still require a restrictive monetary policy.

In addition to the ECB’s attention, a new poll released last Thursday showed a steep slowdown in the increase of negotiated pay during the second quarter, a critical component in anticipating future inflationary pressures.

If the Fed opts for an additional or greater rate reduction, the policy gap between the Fed and the ECB may narrow in the medium to long term, potentially sending EUR/USD higher, especially because markets expect the ECB to lower rates twice more this year.

However, in the longer term, the US economy is expected to outperform Europe, suggesting that any extended weakness in the dollar may be temporary.

On another front, further gains in the single currency looked propped up by positioning. Indeed, net long positions in the EUR have risen to levels not seen since early June, according to the latest CFTC report, signaling continued bullish sentiment among speculators. Meanwhile, commercial traders (hedge funds) maintained their net short positions, with contracts reaching multi-week highs. EUR/USD began a strong rebound during the period under scrutiny, decisively breaking past the psychological 1.1000 barrier and setting new yearly highs, driven by the renewed and significant decline in the Greenback.

Looking ahead, Germany will take centre stage on this week’s calendar, featuring the release of the final Q2 GDP Growth Rate, Retail Sales, preliminary Inflation Rate, and the labour market report. In the broader Euroland, the advanced Inflation Rate will also attract attention.

USD/JPY and AUD/USD Latest Sentiment Analysis and Positioning

USD/JPY and AUD/USD Latest Sentiment Analysis and Positioning

The analysis suggests taking a contrarian view to crowd sentiment. Since traders are net-short (though only slightly), this typically implies that USD/JPY prices may continue to rise.

Warning of potential trend reversal:

Despite the overall net-short position, traders are becoming less net-short compared to yesterday and last week. This change in sentiment suggests that the current upward price trend in USD/JPY may soon reverse lower.

The conclusion drawn from this data is somewhat mixed. While the contrarian view would suggest further price increases, the recent shifts in positioning (becoming less net-short) warn of a potential downward reversal. This highlights the importance of considering both overall positioning and recent changes when analysing market sentiment.

AUD/USD Analysis

Current positioning:

  • 39.72% of traders are net-long
  • The ratio of short to long traders is 1.52 to 1, indicating a stronger bias towards short positions

Changes in positioning:

  • Net-long traders increased by 7.49% since yesterday but decreased by 13.60% from last week
  • Net-short traders increased by 4.44% since yesterday and 12.43% from last week

Contrarian view:

The analysis again suggests taking a contrarian view to crowd sentiment. Since traders are more significantly net-short on AUD/USD, this typically implies that AUD/USD prices may continue to rise.

Mixed trading bias:

The positioning is less net-short than yesterday (due to the larger percentage increase in net-long positions), but more net-short compared to last week. This combination of current sentiment and recent changes results in a mixed trading bias for AUD/USD.

Key observations:

  • There’s a stronger short bias for AUD/USD compared to the previous USD/JPY data.
  • Short-term (daily) and medium-term (weekly) changes are moving in opposite directions for long positions, adding to the mixed outlook.
  • Since yesterday, The increase in net-long and net-short positions suggests growing interest or volatility in this pair.

The conclusion here is less clear-cut than the previous example. While the contrarian view still suggests potential price increases due to the overall net-short position, the mixed signals from recent changes make it difficult to form a strong directional bias.

Top 8 Forex Trading Strategies and their Pros and Cons

Top 8 Forex Trading Strategies and their Pros and Cons

Main talking points:

  • What is a Forex Trading Strategy?
  • Forex Strategies: A Top-level Overview
  • Price Action Trading
  • Range Trading Strategy
  • Trend Trading Strategy
  • Position Trading
  • Day Trading Strategy
  • Forex Scalping Strategy
  • Swing Trading
  • Carry Trade Strategy

Discover what type of forex trader is buried within your DNA with our interactive DNA FX Quiz

What is a Forex Trading Strategy?

A forex trading strategy defines a system that a forex trader uses to determine when to buy or sell a currency pair. There are various forex strategies that traders can use including technical analysis or fundamental analysis. A good forex trading strategy allows for a trader to analyse the market and confidently execute trades with sound risk management techniques.

Forex Strategies: A Top-level Overview

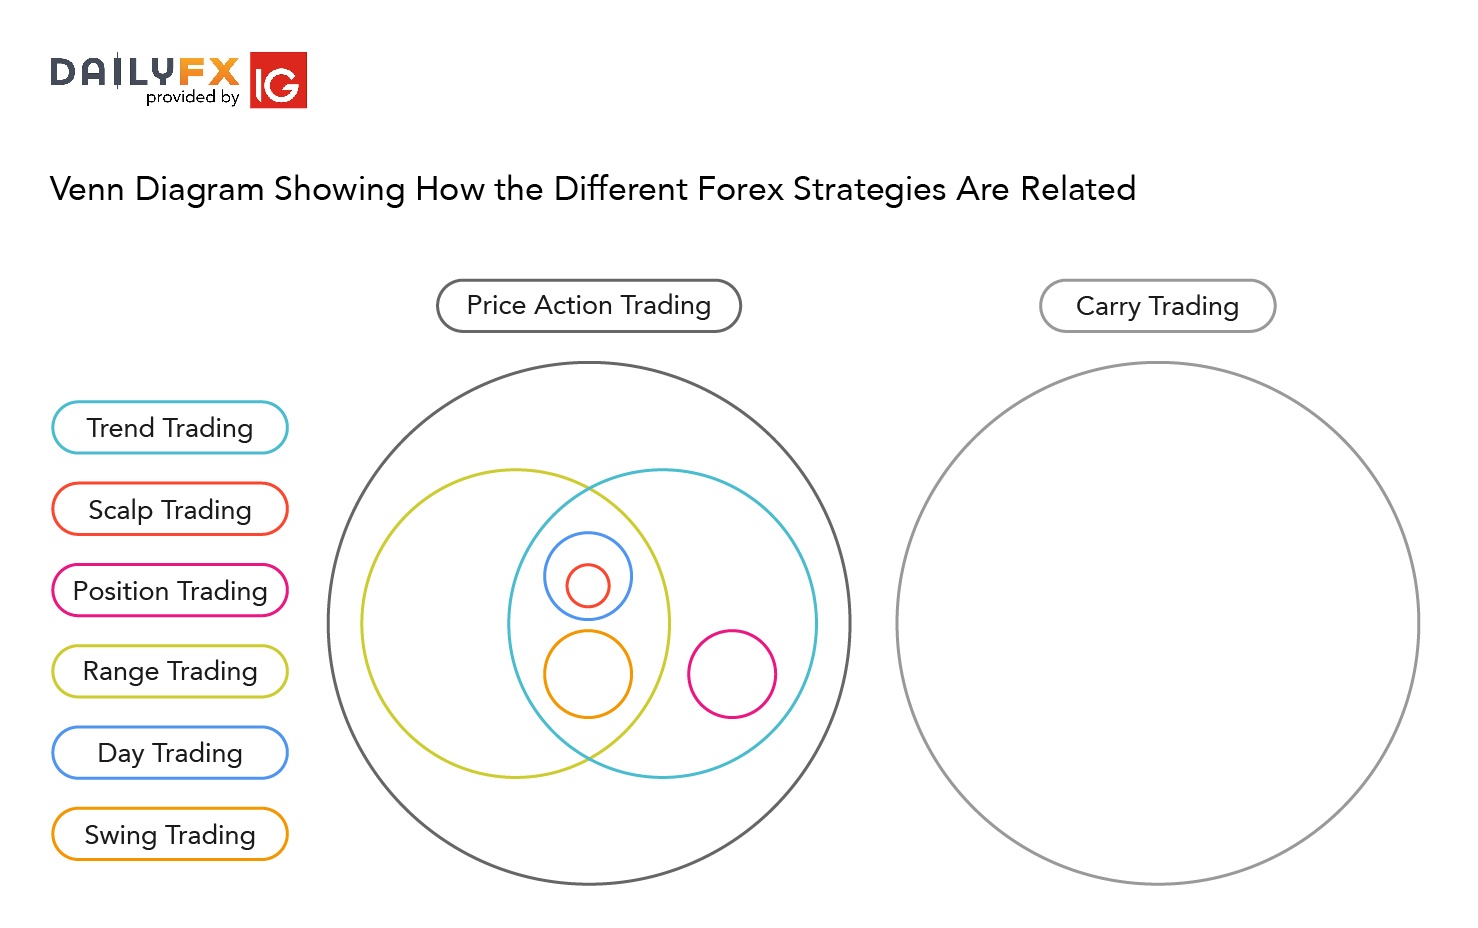
Forex strategies can be divided into a distinct organisational structure which can assist traders in locating the most applicable strategy. The diagram below illustrates how each strategy falls into the overall structure and the relationship between the forex strategies.
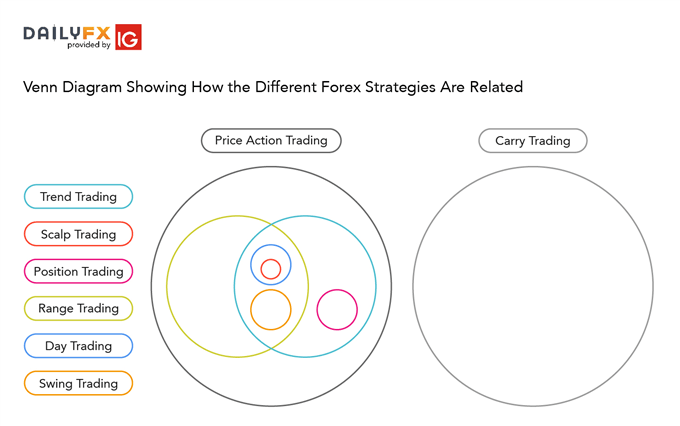
relationship between different forex strategies

Forex Trading Strategies That Work

Forex trading requires putting together multiple factors to formulate a trading strategy that works for you. There are countless strategies that can be followed, however, understanding and being comfortable with the strategy is essential. Every trader has unique goals and resources, which must be taken into consideration when selecting the suitable strategy.

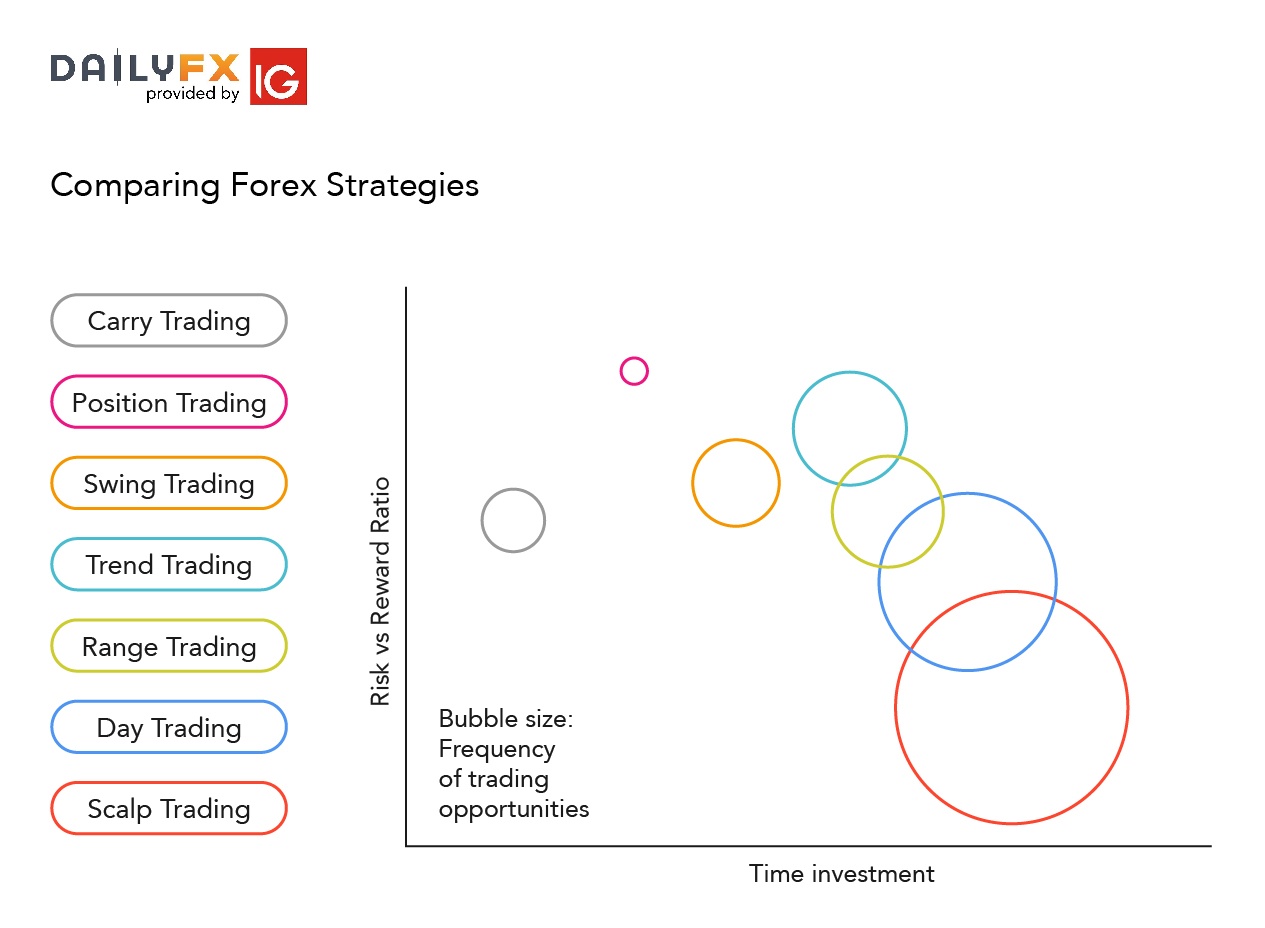
There are three criteria traders can use to compare different strategies on their suitability:

  1. Time resource required
  2. Frequency of trading opportunities
  3. Typical distance to target

To easily compare the forex strategies on the three criteria, we’ve laid them out in a bubble chart. On the vertical axis is ‘Risk-Reward Ratio’ with strategies at the top of the graph having higher reward for the risk taken on each trade. Position trading typically is the strategy with the highest risk reward ratio. On the horizontal axis is time investment that represents how much time is required to actively monitor the trades. The strategy that demands the most in terms of your time resource is scalp trading due to the high frequency of trades being placed on a regular basis.
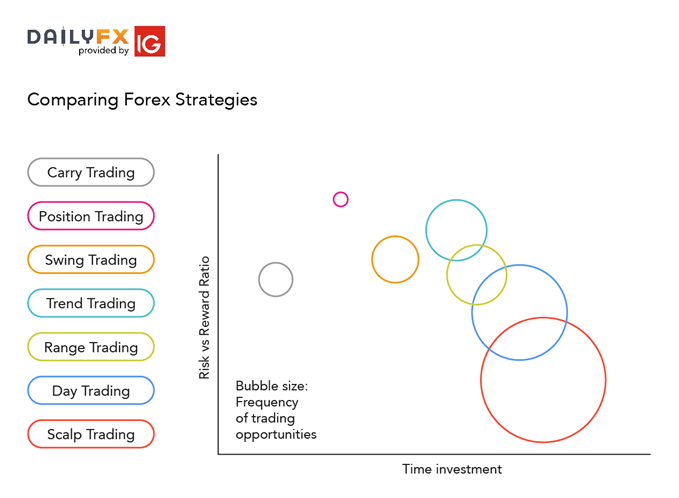
comparing forex strategies

1. Price Action Trading

Price action trading involves the study of historical prices to formulate technical trading strategies. Price action can be used as a stand-alone technique or in conjunction with an indicator. Fundamentals are seldom used; however, it is not unheard of to incorporate economic events as a substantiating factor. There are several other strategies that fall within the price action bracket as outlined above.

Length of trade:

Price action trading can be utilised over varying time periods (long, medium and short-term). The ability to use multiple time frames for analysis makes price action trading valued by many traders.

Entry/Exit points:

There are many methods to determine support/resistance levels which are generally used as entry/exit points:

Within price action, there is range, trend, day, scalping, swing and position trading. These strategies adhere to different forms of trading requirements which will be outlined in detail below. The examples show varying techniques to trade these strategies to show just how diverse trading can be, along with a variety of bespoke options for traders to choose from.

2. Range Trading Strategy

Range trading includes identifying support and resistance points whereby traders will place trades around these key levels. This strategy works well in market without significant volatility and no discernible trend. Technical analysis is the primary tool used with this strategy.

Length of trade:

There is no set length per trade as range bound strategies can work for any time frame. Managing risk is an integral part of this method as breakouts can occur. Consequently, a range trader would like to close any current range bound positions.

Entry/Exit points:

Oscillators are most commonly used as timing tools. Relative Strength Index (RSI), Commodity Channel Index (CCI) and stochastics are a few of the more popular oscillators. Price action is sometimes used in conjunction with oscillators to further validate range bound signals or breakouts.

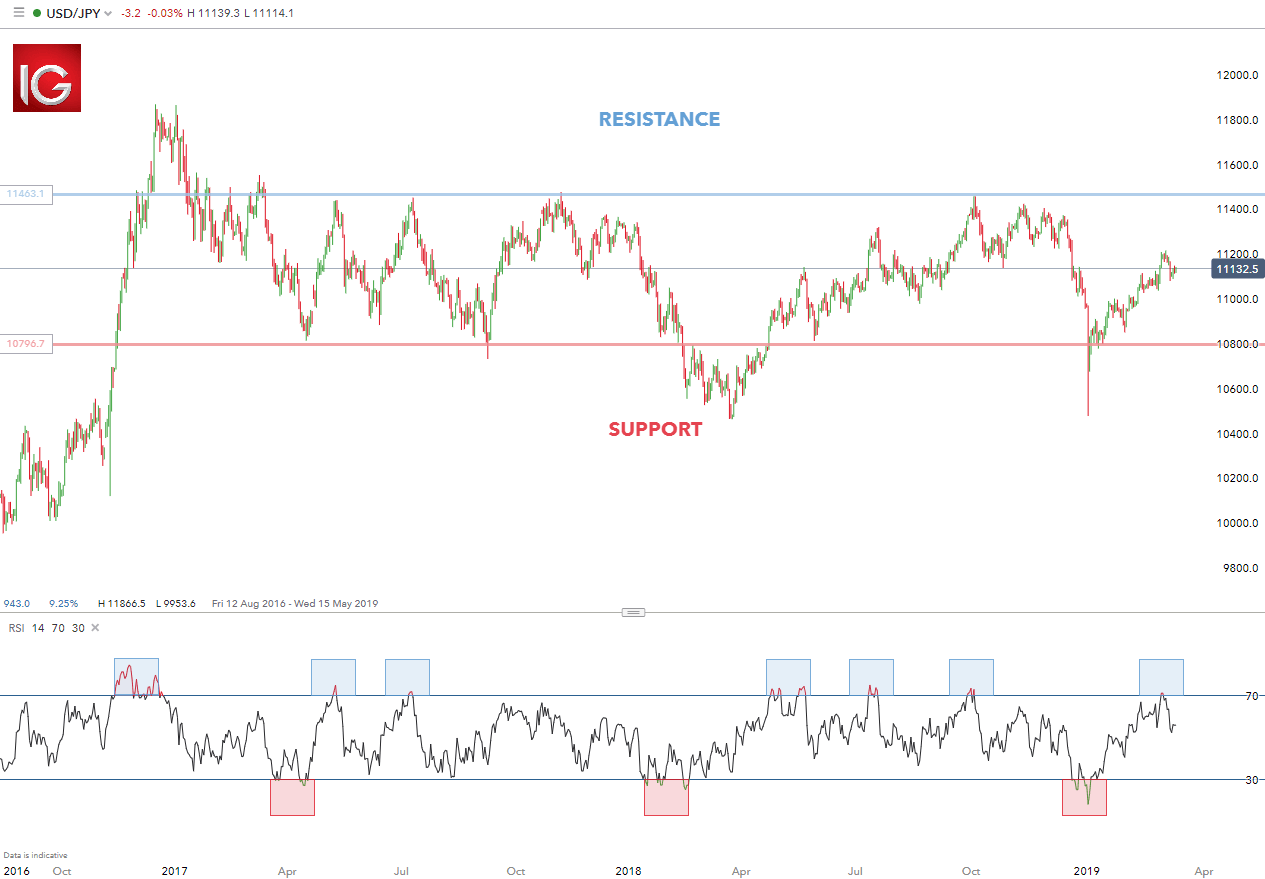
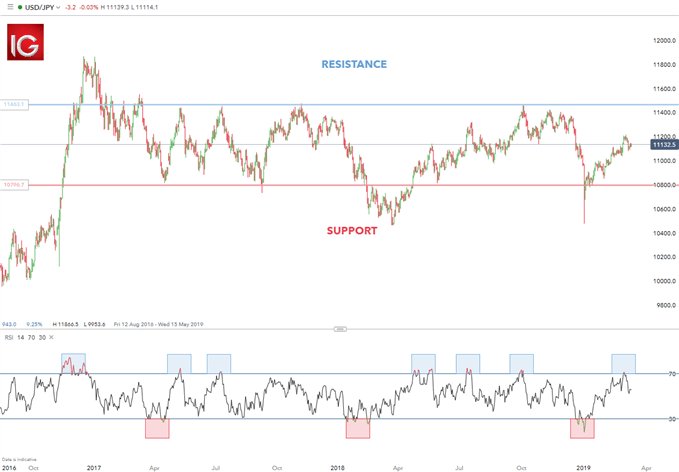
Example 1: USD/JPY Range Trading
range trading USD/JPY

USD/JPY has been exhibiting a prolonged range bound price level over the past few years. The chart above illustrates a clear support and resistance band which traders use as entry/exit points. The RSI oscillator demonstrates timing of entry/exit points as highlighted by the shaded blue and red boxes – blue: overbought and red: oversold.

Range trading can result in fruitful risk-reward ratios however, this comes along with lengthy time investment per trade. Use the pros and cons below to align your goals as a trader and how much resources you have.

Pros:

  • Substantial number of trading opportunities
  • Favourable risk-to reward ratio

Cons:

  • Requires lengthy periods of time investment
  • Entails strong appreciation of technical analysis

3. Trend Trading Strategy

Trend trading is a simple forex strategy used by many traders of all experience levels. Trend trading attempts to yield positive returns by exploiting a markets directional momentum.

Length of trade:

Trend trading generally takes place over the medium to long-term time horizon as trends themselves fluctuate in length. As with price action, multiple time frame analysis can be adopted in trend trading.

Entry/Exit points:

Entry points are usually designated by an oscillator (RSI, CCI etc) and exit points are calculated based on a positive risk-reward ratio. Using stop level distances, traders can either equal that distance or exceed it to maintain a positive risk-reward ratio e.g. If the stop level was placed 50 pips away, the take profit level wold be set at 50 pips or more away from the entry point.

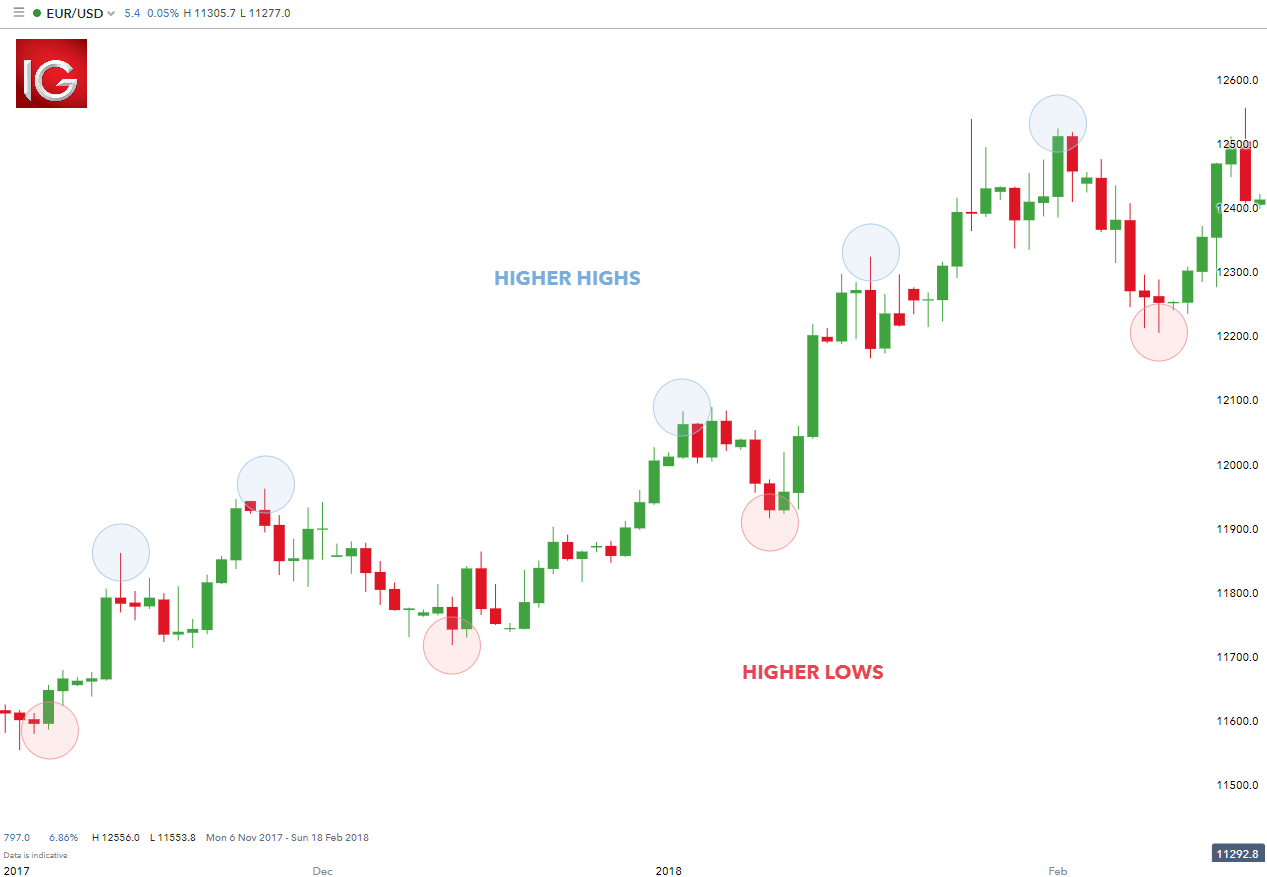
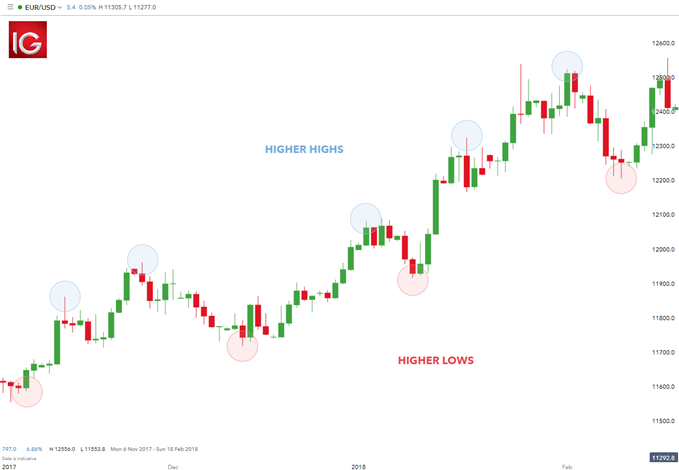
Example 2: Identifying the Trend
trend trading EUR/USD

In the simple example above, EUR/USD exhibits an upward trend validated by higher highs and higher lows. The opposite would be true for a downward trend.

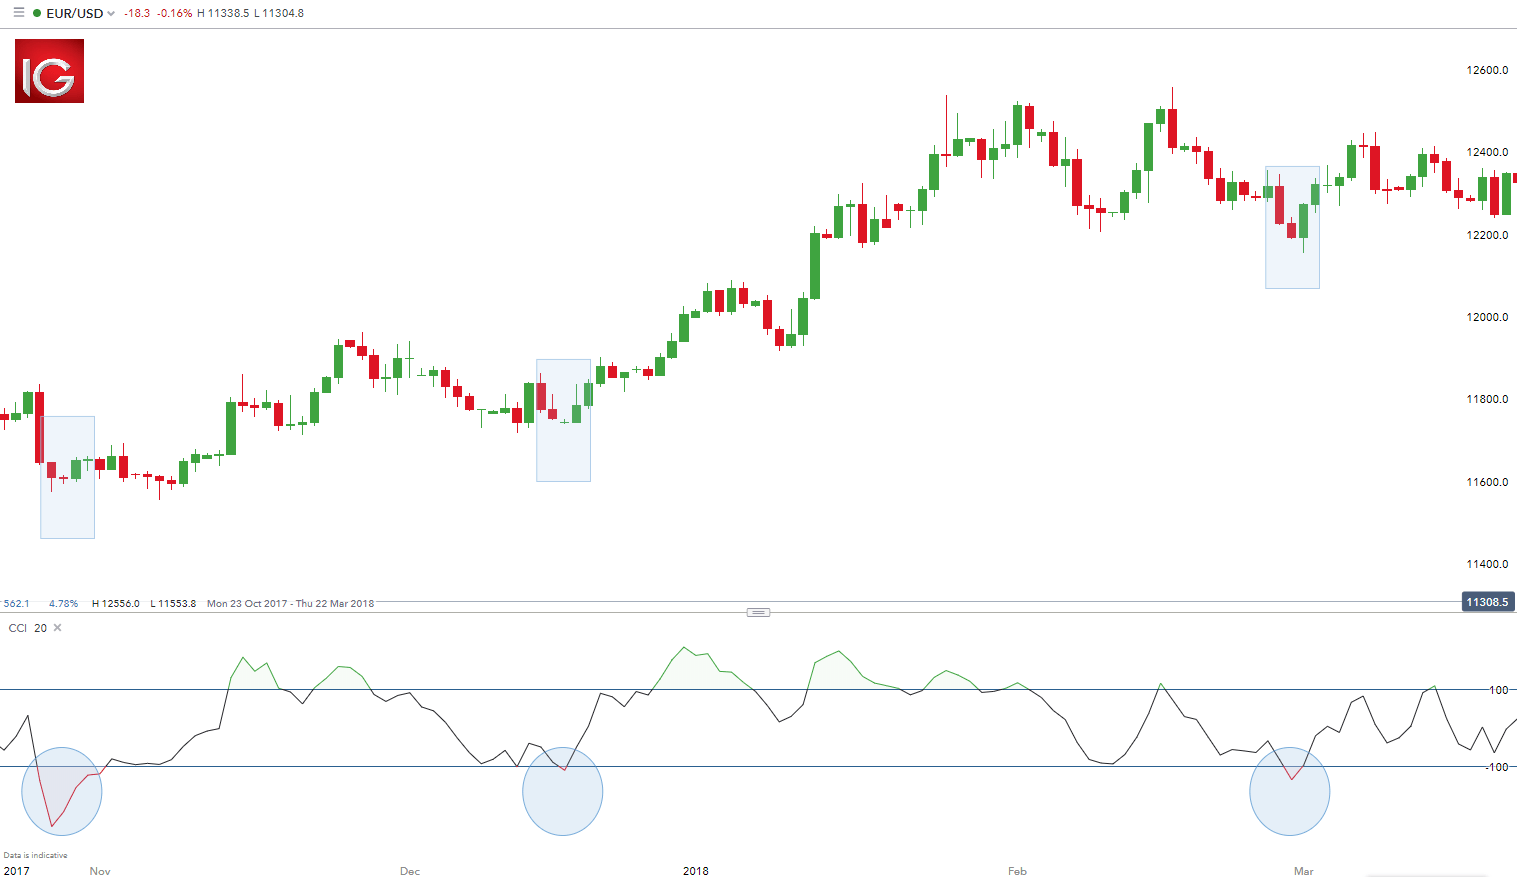
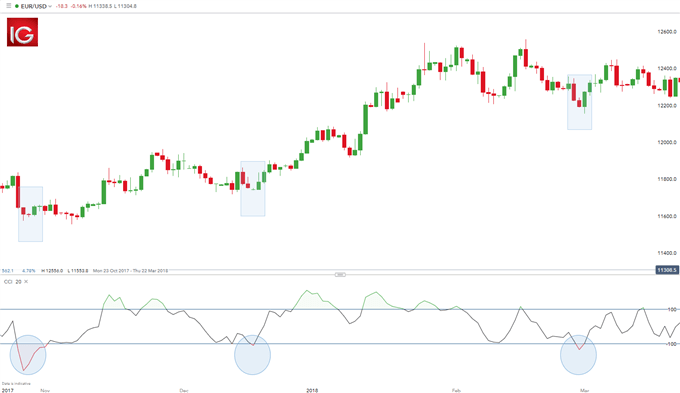
EUR/USD Trading the Trend
trend trading EUR/USD with CCI

When you see a strong trend in the market, trade it in the direction of the trend. For example, the strong uptrend in EUR/USD above.

Using the (CCI) as a tool to time entries, notice how each time CCI dipped below -100 (highlighted in blue), prices responded with a rally. Not all trades will work out this way, but because the trend is being followed, each dip caused more buyers to come into the market and push prices higher. In conclusion, identifying a strong trend is important for a fruitful trend trading strategy.

Trend trading can be reasonably labour intensive with many variables to consider. The list of pros and cons may assist you in identifying if trend trading is for you.

Pros:

  • Substantial number of trading opportunities
  • Favourable risk-to reward ratio

Cons:

  • Requires lengthy periods of time investment
  • Entails strong appreciation of technical analysis

4. Position Trading

Position trading is a long-term strategy primarily focused on fundamental factors however, technical methods can be used such as Elliot Wave Theory. Smaller more minor market fluctuations are not considered in this strategy as they do not affect the broader market picture. This strategy can be employed on all markets from stocks to forex.

Length of trade:

As mentioned above, position trades have a long-term outlook (weeks, months or even years!) reserved for the more persevering trader. Understanding how economic factors affect markets or thorough technical predispositions, is essential in forecasting trade ideas.

Entry/Exit points:

Key levels on longer time frame charts (weekly/monthly) hold valuable information for position traders due to the comprehensive view of the market. Entry and exit points can be judged using technical analysis as per the other strategies.

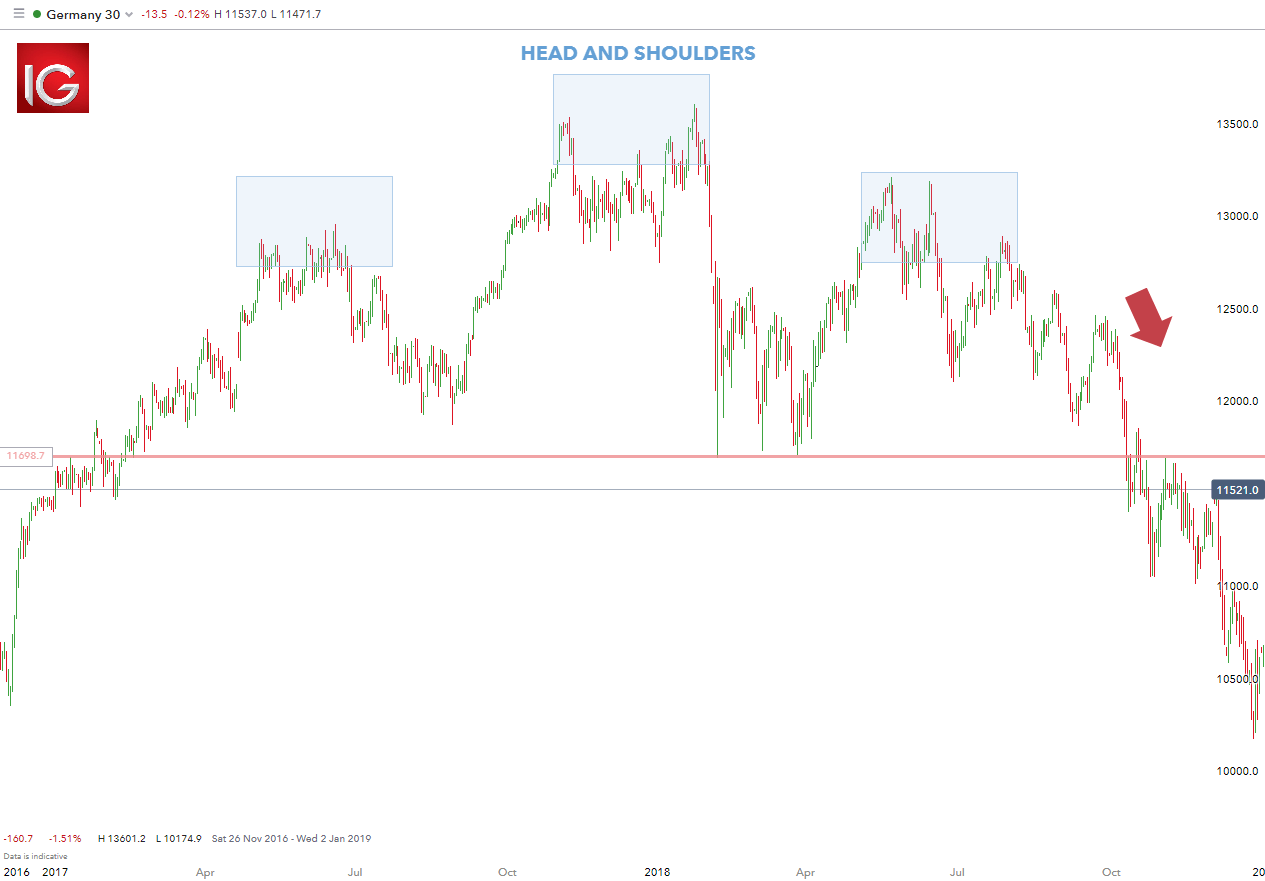
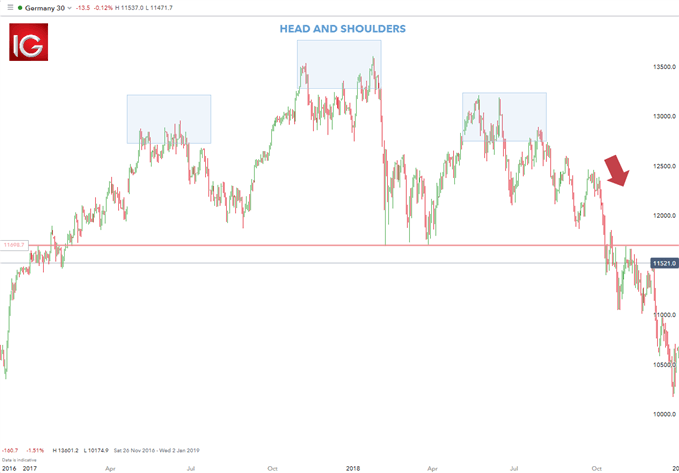
Example 3: Germany 40 (DAX) Position Trading
position trading DAX

The Germany 40 chart above depicts an approximate two year head and shoulders pattern, which aligns with a probable fall below the neckline (horizontal red line) subsequent to the right-hand shoulder. In this selected example, the downward fall of the Germany 30 played out as planned technically as well as fundamentally. Towards the end of 2018, Germany went through a technical recession along with the US/China trade war hurting the automotive industry. Brexit negotiations did not help matters as the possibility of the UK leaving the EU would most likely negatively impact the German economy as well. In this case, understanding technical patterns as well as having strong fundamental foundations allowed for combining technical and fundamental analysis to structure a strong trade idea.

List of Pros and Cons based on your goals as a trader and how much resources you have.

Pros:

  • Requires minimal time investment
  • Highly positive risk-to reward ratio

Cons:

  • Very few trading opportunities
  • Entails strong appreciation of technical and fundamental analysis

5. Day Trading Strategy

Day trading is a strategy designed to trade financial instruments within the same trading day. That is, all positions are closed before market close. This can be a single trade or multiple trades throughout the day.

Length of trade:

Trade times range from very short-term (matter of minutes) or short-term (hours), as long as the trade is opened and closed within the trading day.

Entry/Exit points:

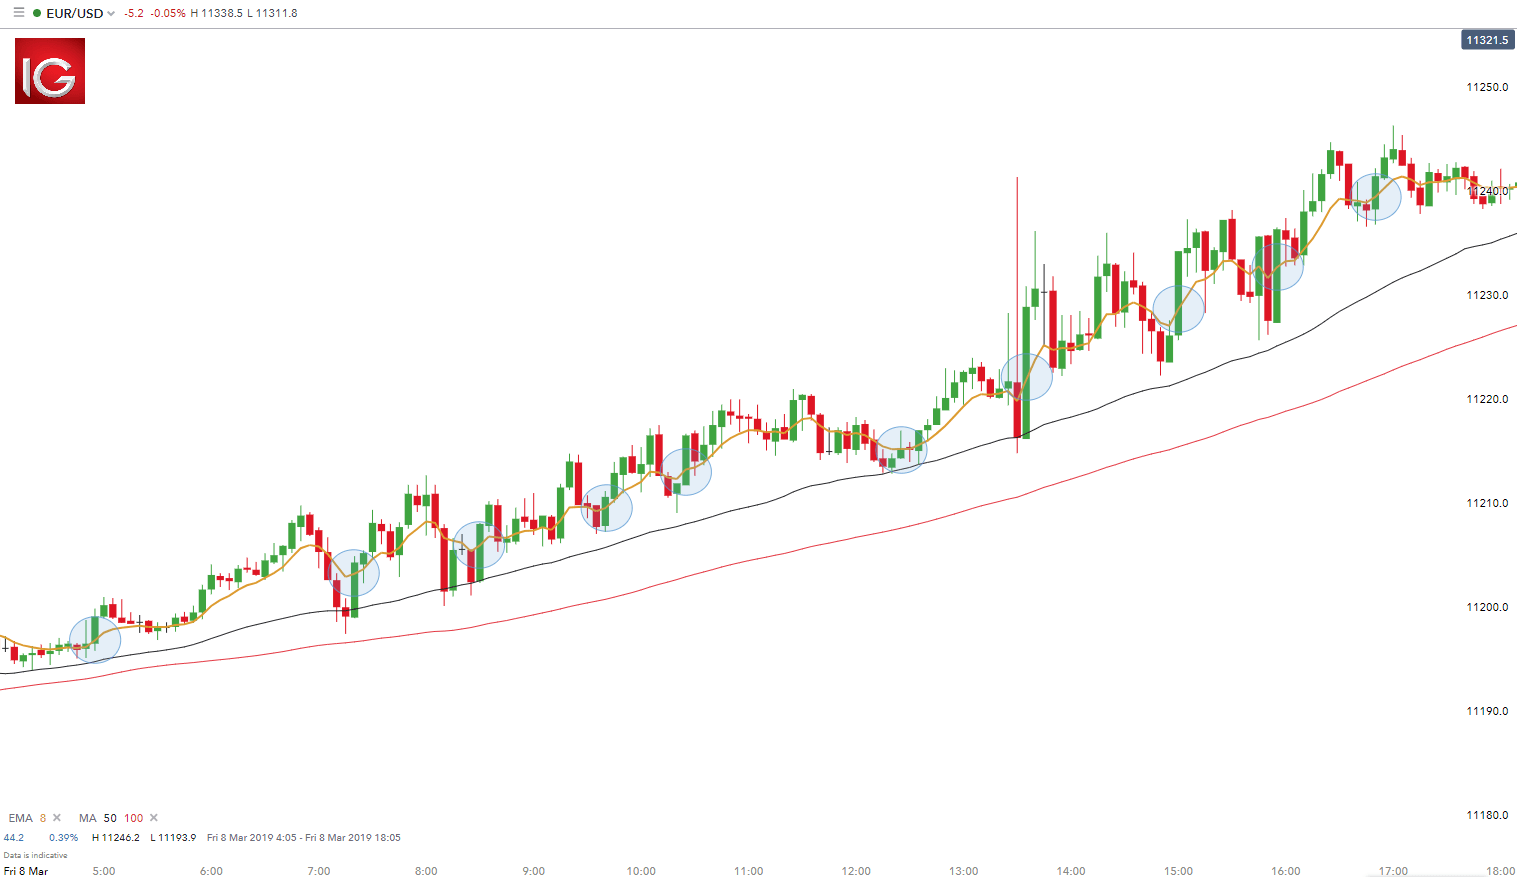
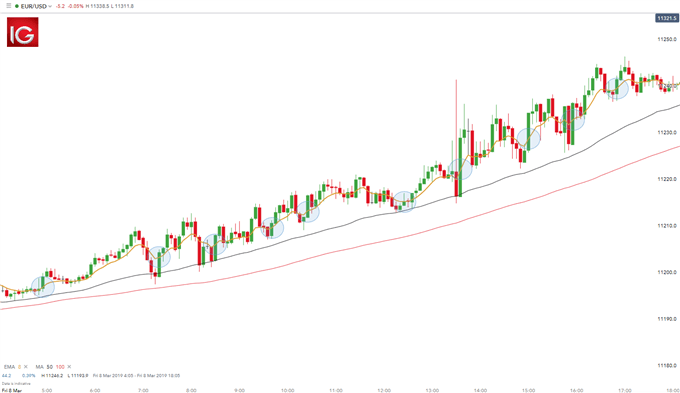
Traders in the example below will look to enter positions at the when the price breaks through the 8 period EMA in the direction of the trend (blue circle) and exit using a 1:1 risk-reward ratio.

Example 4: EUR/USD Day Trading
day trading EUR/USD

The chart above shows a representative day trading setup using moving averages to identify the trend which is long in this case as the price is above the MA lines (red and black). Entry positions are highlighted in blue with stop levels placed at the previous price break. Take profit levels will equate to the stop distance in the direction of the trend.

The pros and cons listed below should be considered before pursuing this strategy. Day trading involves much time and effort for little reward, as seen from the EUR/USD example above.

Pros:

  • Substantial number of trading opportunities
  • Median risk-to reward ratio

Cons:

  • Requires lengthy periods of time investment
  • Entails strong appreciation of technical analysis

6. Forex Scalping Strategy

Scalping in forex is a common term used to describe the process of taking small profits on a frequent basis. This is achieved by opening and closing multiple positions throughout the day. This can be done manually or via an algorithm which uses predefined guidelines as to when/where to enter and exit positions. The most liquid forex pairs are preferred as spreads are generally tighter, making the short-term nature of the strategy fitting.

Length of trade:

Scalping entails short-term trades with minimal return, usually operating on smaller time frame charts (30 min – 1min).

Entry/Exit points:

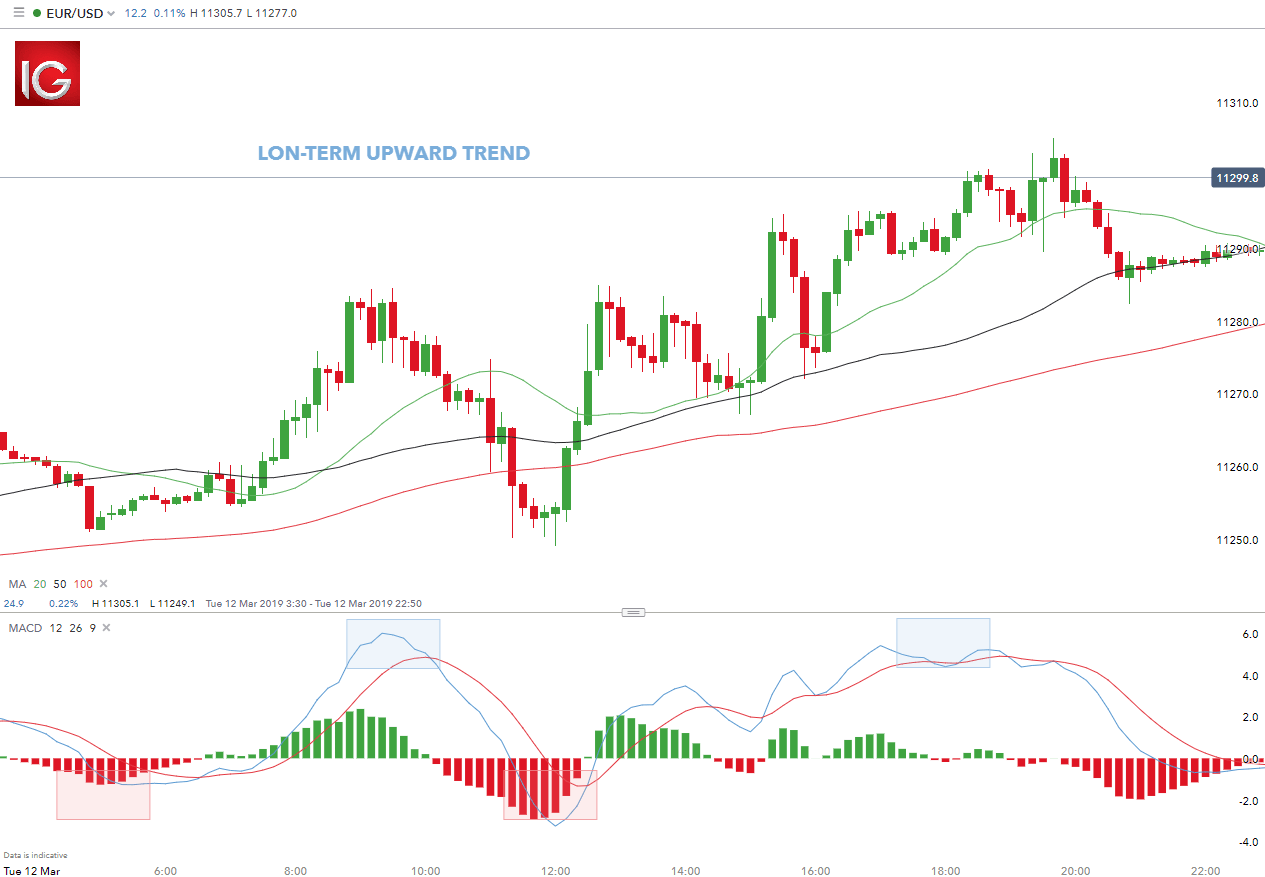
Like most technical strategies, identifying the trend is step 1. Many scalpers use indicators such as the moving average to verify the trend. Using these key levels of the trend on longer time frames allows the trader to see the bigger picture. These levels will create support and resistance bands. Scalping within this band can then be attempted on smaller time frames using oscillators such as the RSI. Stops are placed a few pips away to avoid large movements against the trade. The MACD indicator is another useful tool that can be exercised by the trader to enter/exit trades.

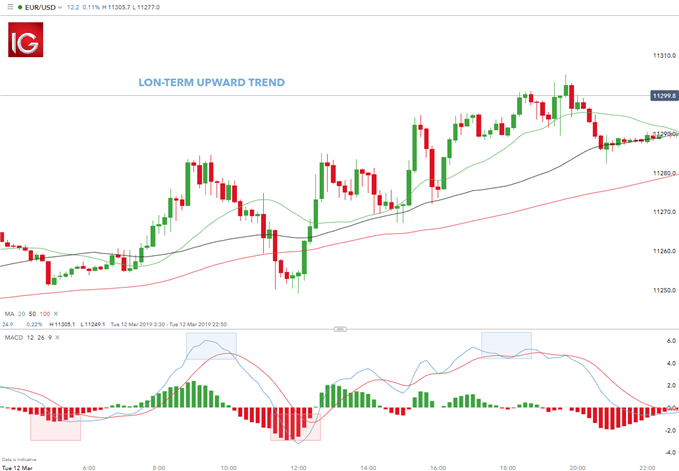
Example 5: EUR/USD Scalping Strategy
scalp trading EUR/USD

The EUR/USD 10 minute above shows a typical example of a scalping strategy. The long-term trend is confirmed by the moving average (price above 200 MA). The smaller time frame is then used to target entry/exit points. Timing of entry points are featured by the red rectangle in the bias of the trader (long). Traders can also close long positions using the MACD when the MACD (blue line) crosses over the signal line (red line) highlighted by the blue rectangles.

Traders use the same theory to set up their algorithms however, without the manual execution of the trader.

With this practical scalp trading example above, use the list of pros and cons below to select an appropriate trading strategy that best suits you.

Pros:

  • Greatest number of trading opportunities from all forex strategies

Cons:

  • Requires lengthy periods of time investment
  • Entails strong appreciation of technical analysis
  • Lowest risk-to reward ratio

7. Swing Trading

Swing trading is a speculative strategy whereby traders look to take advantage of rang bound as well as trending markets. By picking ‘tops’ and ‘bottoms’, traders can enter long and short positions accordingly.

Length of trade:

Swing trades are considered medium-term as positions are generally held anywhere between a few hours to a few days. Longer-term trends are favoured as traders can capitalise on the trend at multiple points along the trend.

Entry/Exit points:

Much like the range bound strategy, oscillators and indicators can be used to select optimal entry/exit positions and times. The only difference being that swing trading applies to both trending and range bound markets.

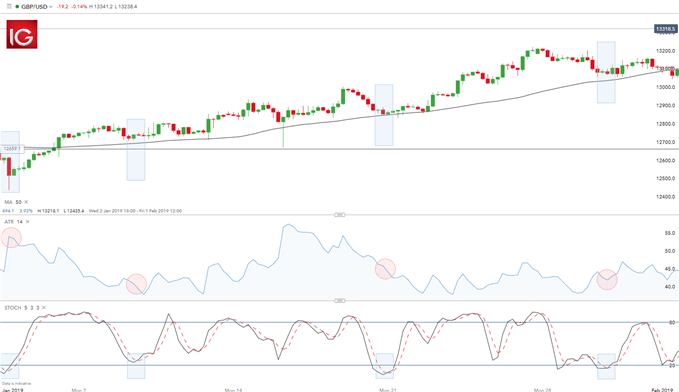
Example 6: GBP/USD Swing Trading Strategy
swing trading GBP/USD

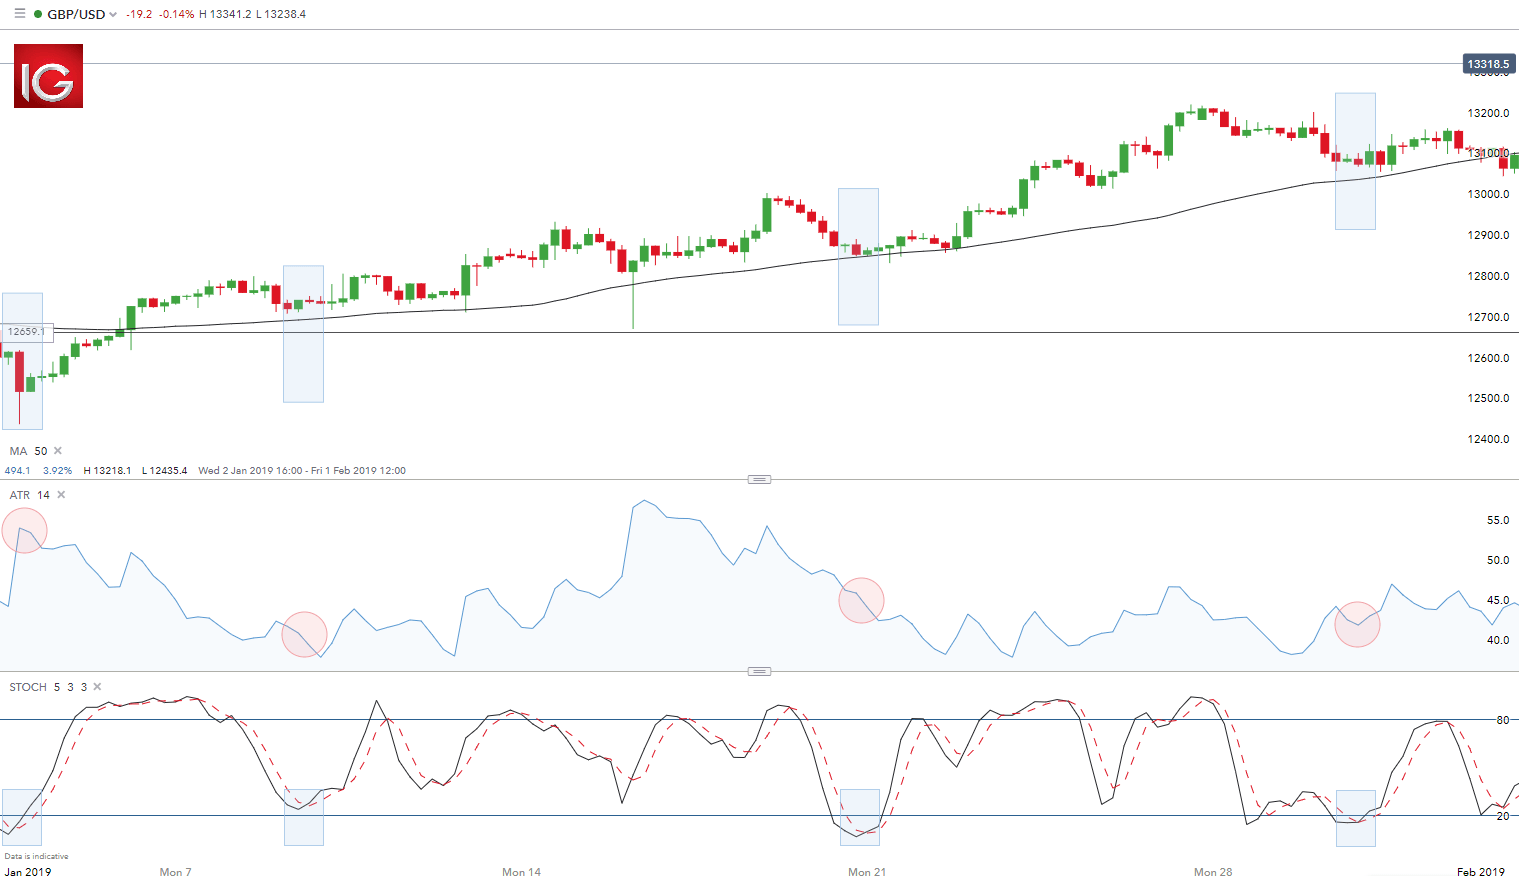
A combination of the stochastic oscillator, ATR indicator and the moving average was used in the example above to illustrate a typical swing trading strategy. The upward trend was initially identified using the 50-day moving average (price above MA line). In the case of an uptrend, traders will look to enter long positions with the old adage of ‘buy low, sell high’.

Stochastics are then used to identify entry points by looking for oversold signals highlighted by the blue rectangles on the stochastic and chart. Risk management is the final step whereby the ATR gives an indication of stop levels. The ATR figure is highlighted by the red circles. This figure represents the approximate number of pips away the stop level should be set. For example, if the ATR reads 41.8 (reflected in the last ATR reading) the trader would look to place the stop 41.8 pips away from entry. At DailyFX, we recommend trading with a positive risk-reward ratio at a minimum of 1:2. This would mean setting a take profit level (limit) at least 83.6 (41.8 x 2) pips away or further.

After seeing an example of swing trading in action, consider the following list of pros and cons to determine if this strategy would suit your trading style.

Pros:

  • Substantial number of trading opportunities
  • Median risk-to reward ratio

Cons:

  • Entails strong appreciation of technical analysis
  • Still requires extensive time investment

8. Carry Trade Strategy

Carry trades include borrowing one currency at lower rate, followed by investing in another currency at a higher yielding rate. This will ultimately result in a positive carry of the trade. This strategy is primarily used in the forex market.

Length of trade:

Carry trades are dependent on interest rate fluctuations between the associated currencies therefore, length of trade supports the medium to long-term (weeks, months and possibly years).

Entry/Exit points:

Strong trending markets work best for carry trades as the strategy involves a lengthier time horizon. Confirmation of the trend should be the first step prior to placing the trade (higher highs and higher lows and vice versa) – refer to Example 1 above. There are two aspects to a carry trade namely, exchange rate risk and interest rate risk. Accordingly, the best time to open the positions is at the start of a trend to capitalise fully on the exchange rate fluctuation. Regarding the interest rate component, this will remain the same regardless of the trend as the trader will still receive the interest rate differential if the first named currency has a higher interest rate against the second named currency e.g. AUD/JPY.

Could carry trading work for you? Consider the following pros and cons and see if it is a forex strategy that suits your trading style.

Pros:

  • Little time investment needed
  • Median risk-to reward ratio

Cons:

  • Entails strong appreciation of forex market
  • Infrequent trading opportunities

Forex Strategies: A Summary

This article outlines 8 types of forex strategies with practical trading examples. When considering a trading strategy to pursue, it can be useful to compare how much time investment is required behind the monitor, the risk-reward ratio and regularity of total trading opportunities. Each trading strategy will appeal to different traders depending on personal attributes. Matching trading personality with the appropriate strategy will ultimately allow traders to take the first step in the right direction.