4 Effective Trading Indicators Every Trader Should Know

4 Effective Trading Indicators Every Trader Should Know

When your forex trading adventure begins, you’ll likely be met with a swarm of different methods for trading. However, most trading opportunities can be easily identified with just one of four chart indicators. Once you know how to use the Moving Average, RSI, Stochastic, & MACD indicator, you’ll be well on your way to executing your trading plan like a pro. You’ll also be provided with a free reinforcement tool so that you’ll know how to identify trades using these forex indicators every day.

Find the best trading ideas and market forecasts from DailyFX.

The Benefits of a Simple Strategy

Traders tend to overcomplicate things when they’re starting out in the forex market. This fact is unfortunate but undeniably true. Traders often feel that a complex trading strategy with many moving parts must be better when they should focus on keeping things as simple as possible. This is because a simple strategy allows for quick reactions and less stress.

If you’re just getting started, you should seek the most effective and simple strategies for identifying trades and stick with that approach.

Quote by Leonardo da Vinci on why simplicity is best, which ties in with using a simple forex trading strategy.

Discover the Best Forex Indicators for a Simple Strategy

One way to simplify your trading is through a trading plan that includes chart indicators and a few rules as to how you should use those indicators. In keeping with the idea that simple is best, there are four easy indicators you should become familiar with using one or two at a time to identify trading entry and exit points:

Using Forex Indicators to Read Charts for Different Market Environments

There are many fundamental factors when determining the value of a currency relative to another currency. Many traders opt to look at the charts as a simplified way to identify trading opportunities – using forex indicators to do so.

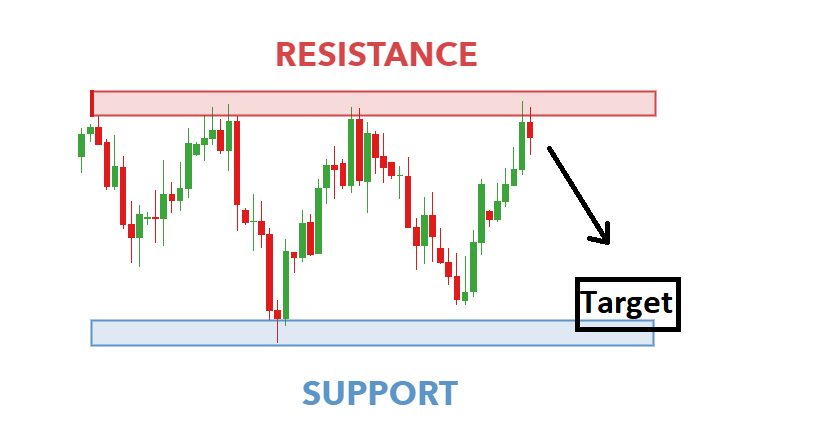
When looking at the charts, you’ll notice two common market environments. The two environments are either ranging markets with a strong level of support and resistance, or floor and ceiling that price isn’t breaking through or a trending market where price is steadily moving higher or lower.

Using technical analysis allows you as a trader to identify range bound or trending environments and then find higher probability entries or exits based on their readings. Reading the indicators is as simple as putting them on the chart.

Trading with Moving Averages

One of the best forex indicators for any strategy is moving average. Moving averages make it easier for traders to locate trading opportunities in the direction of the overall trend. When the market is trending up, you can use the moving average or multiple moving averages to identify the trend and the right time to buy or sell.

The moving average is a plotted line that simply measures the average price of a currency pair over a specific period of time, like the last 200 days or year of price action to understand the overall direction.

Learn Forex: GBPUSD Daily Chart – Moving Average
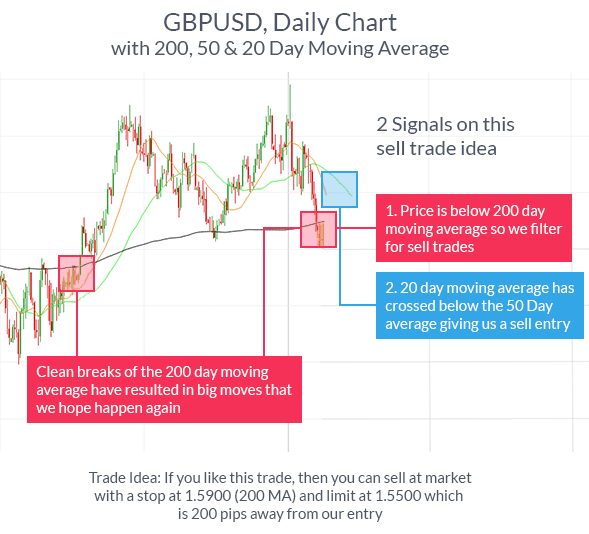
GBPUSD daily chart showing the use of Moving Averages as a forex indicator to measure the average price of a currency over time.

You’ll notice a trade idea was generated above only with adding a few moving averages to the chart. Identifying trade opportunities with moving averages allows you see and trade off of momentum by entering when the currency pair moves in the direction of the moving average, and exiting when it begins to move opposite.

Trading with RSI

The Relative Strength Index or RSI is an oscillator that is simple and helpful in its application. Oscillators like the RSI help you determine when a currency is overbought or oversold, so a reversal is likely. For those who like to ‘buy low and sell high’, the RSI may be the right indicator for you.
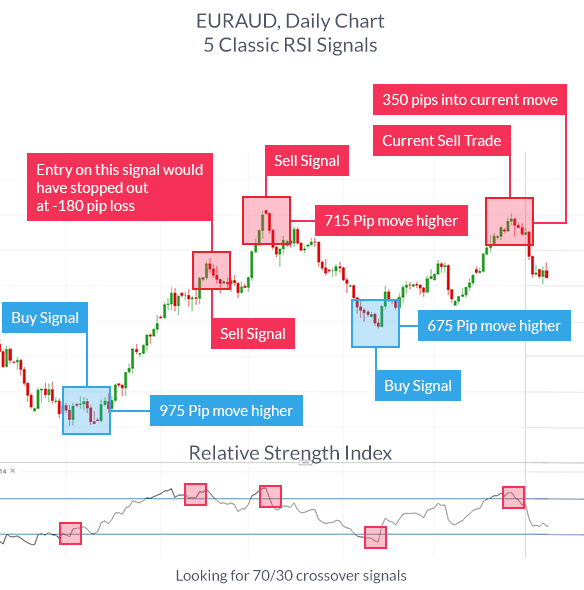
EURAUD daily chart plotted with RSI indicator to identify better exit or entry prices for forex trading.

The RSI can be used equally well in trending or ranging markets to locate better entry and exit prices. When markets have no clear direction and are ranging, you can take either buy or sell signals like you see above. When markets are trending, it becomes more obvious which direction to trade (one benefit of trend trading) and you only want to enter in the direction of the trend when the indicator is recovering from extremes.

Because the RSI is an oscillator, it is plotted with values between 0 and 100. The value of 100 is considered overbought and a reversal to the downside is likely whereas the value of 0 is considered oversold and a reversal to the upside is commonplace. If an uptrend has been discovered, you would want to identify the RSI reversing from readings below 30 or oversold before entering back in the direction of the trend.

Trading with Stochastics

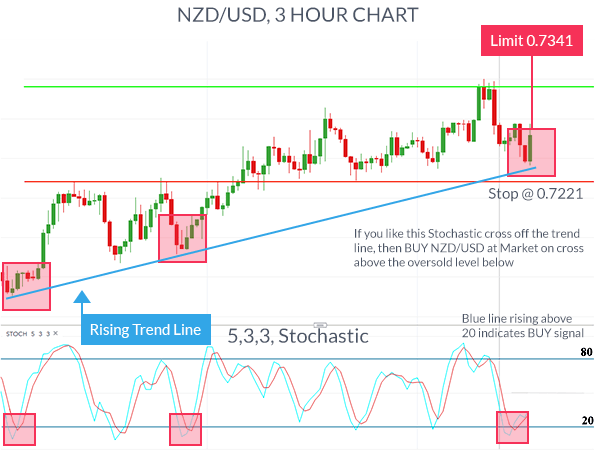
Slow stochastics are an oscillator like the RSI that can help you locate overbought or oversold environments, likely making a reversal in price. The unique aspect of trading with the stochastic indicator is the two lines, %K and %D line to signal our entry.

Because the oscillator has the same overbought or oversold readings, you simply look for the %K line to cross above the %D line through the 20 level to identify a solid buy signal in the direction of the trend.
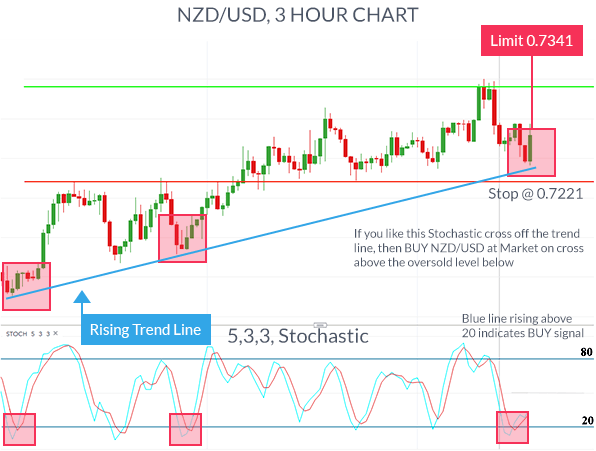
NZDUSD 3 hour chart showing the use of the stochastic indicator to inform of a forex trading strategy.

Trading with the Moving Average Convergence & Divergence (MACD)

Sometimes known as the king of oscillators, the MACD can be used well in trending or ranging markets due to its use of moving averages provide a visual display of changes in momentum.

After you’ve identified the market environment as either ranging or trading, there are two things you want to look for to derive signals from this indictor. First, you want to recognize the lines in relation to the zero line which identify an upward or downward bias of the currency pair. Second, you want to identify a crossover or cross under of the MACD line (Red) to the Signal line (Blue) for a buy or sell trade, respectively.
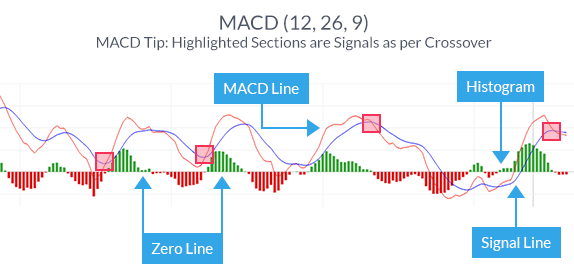
Graph showing a MACD line that identifies the upward or downward bias of a currency pair.

Like all indicators, the MACD is best coupled with an identified trend or range-bound market. Once you’ve identified the trend, it is best to take crossovers of the MACD line in the direction of the trend. When you’ve entered the trade, you can set stops below the recent price extreme before the crossover, and set a trade limit at twice the amount you’re risking.
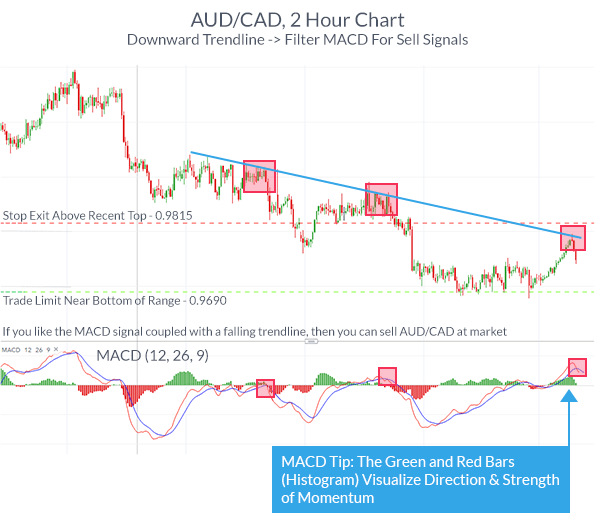
AUDCAD 2 hour chart where the MACD indicator is being used to inform traders of a forex trading strategy.


EUR/USD, GBP/USD, and Gold – Latest Sentiment Analysis

EUR/USD, GBP/USD, and Gold – Latest Sentiment Analysis

EUR/USD, GBP/USD, and Gold Sentiment Analysis

Retail trader data shows 25.76% of EUR/USD traders are net-long with the ratio of traders short to long at 2.88 to 1.The number of traders net-long is 12.88% higher than yesterday and 17.56% lower from last week, while the number of traders net-short is 0.68% higher than yesterday and 19.41% higher from last week.

We typically take a contrarian view to crowd sentiment, and the fact traders are net-short suggests EUR/USD prices may continue to rise. Positioning is less net-short than yesterday but more net-short from last week. The combination of current sentiment and recent changes gives us a further mixed EUR/USD trading bias.

Retail trader data shows 28.27% of GBP/USD traders are net-long with the ratio of traders short to long at 2.54 to 1.The number of traders net-long is 0.48% lower than yesterday and 32.83% lower from last week, while the number of traders net-short is 6.55% higher than yesterday and 41.14% higher from last week.

We typically take a contrarian view to crowd sentiment, and the fact traders are net-short suggests GBP/USD prices may continue to rise. Traders are further net-short than yesterday and last week, and the combination of current sentiment and recent changes gives us a stronger GBP/USD-bullish contrarian trading bias.

Retail trader data shows 54.85% of Gold traders are net-long with the ratio of traders long to short at 1.21 to 1.The number of traders net-long is 8.56% higher than yesterday and 18.90% higher from last week, while the number of traders net-short is 9.27% lower than yesterday and 5.95% lower from last week.

We typically take a contrarian view to crowd sentiment, and the fact traders are net-long suggests Gold prices may continue to fall. Traders are further net-long than yesterday and last week, and the combination of current sentiment and recent changes gives us a stronger Gold-bearish contrarian trading bias.

Gold just off all-time highs after rally extends on geopolitical risk

Gold just off all-time highs after rally extends on geopolitical risk

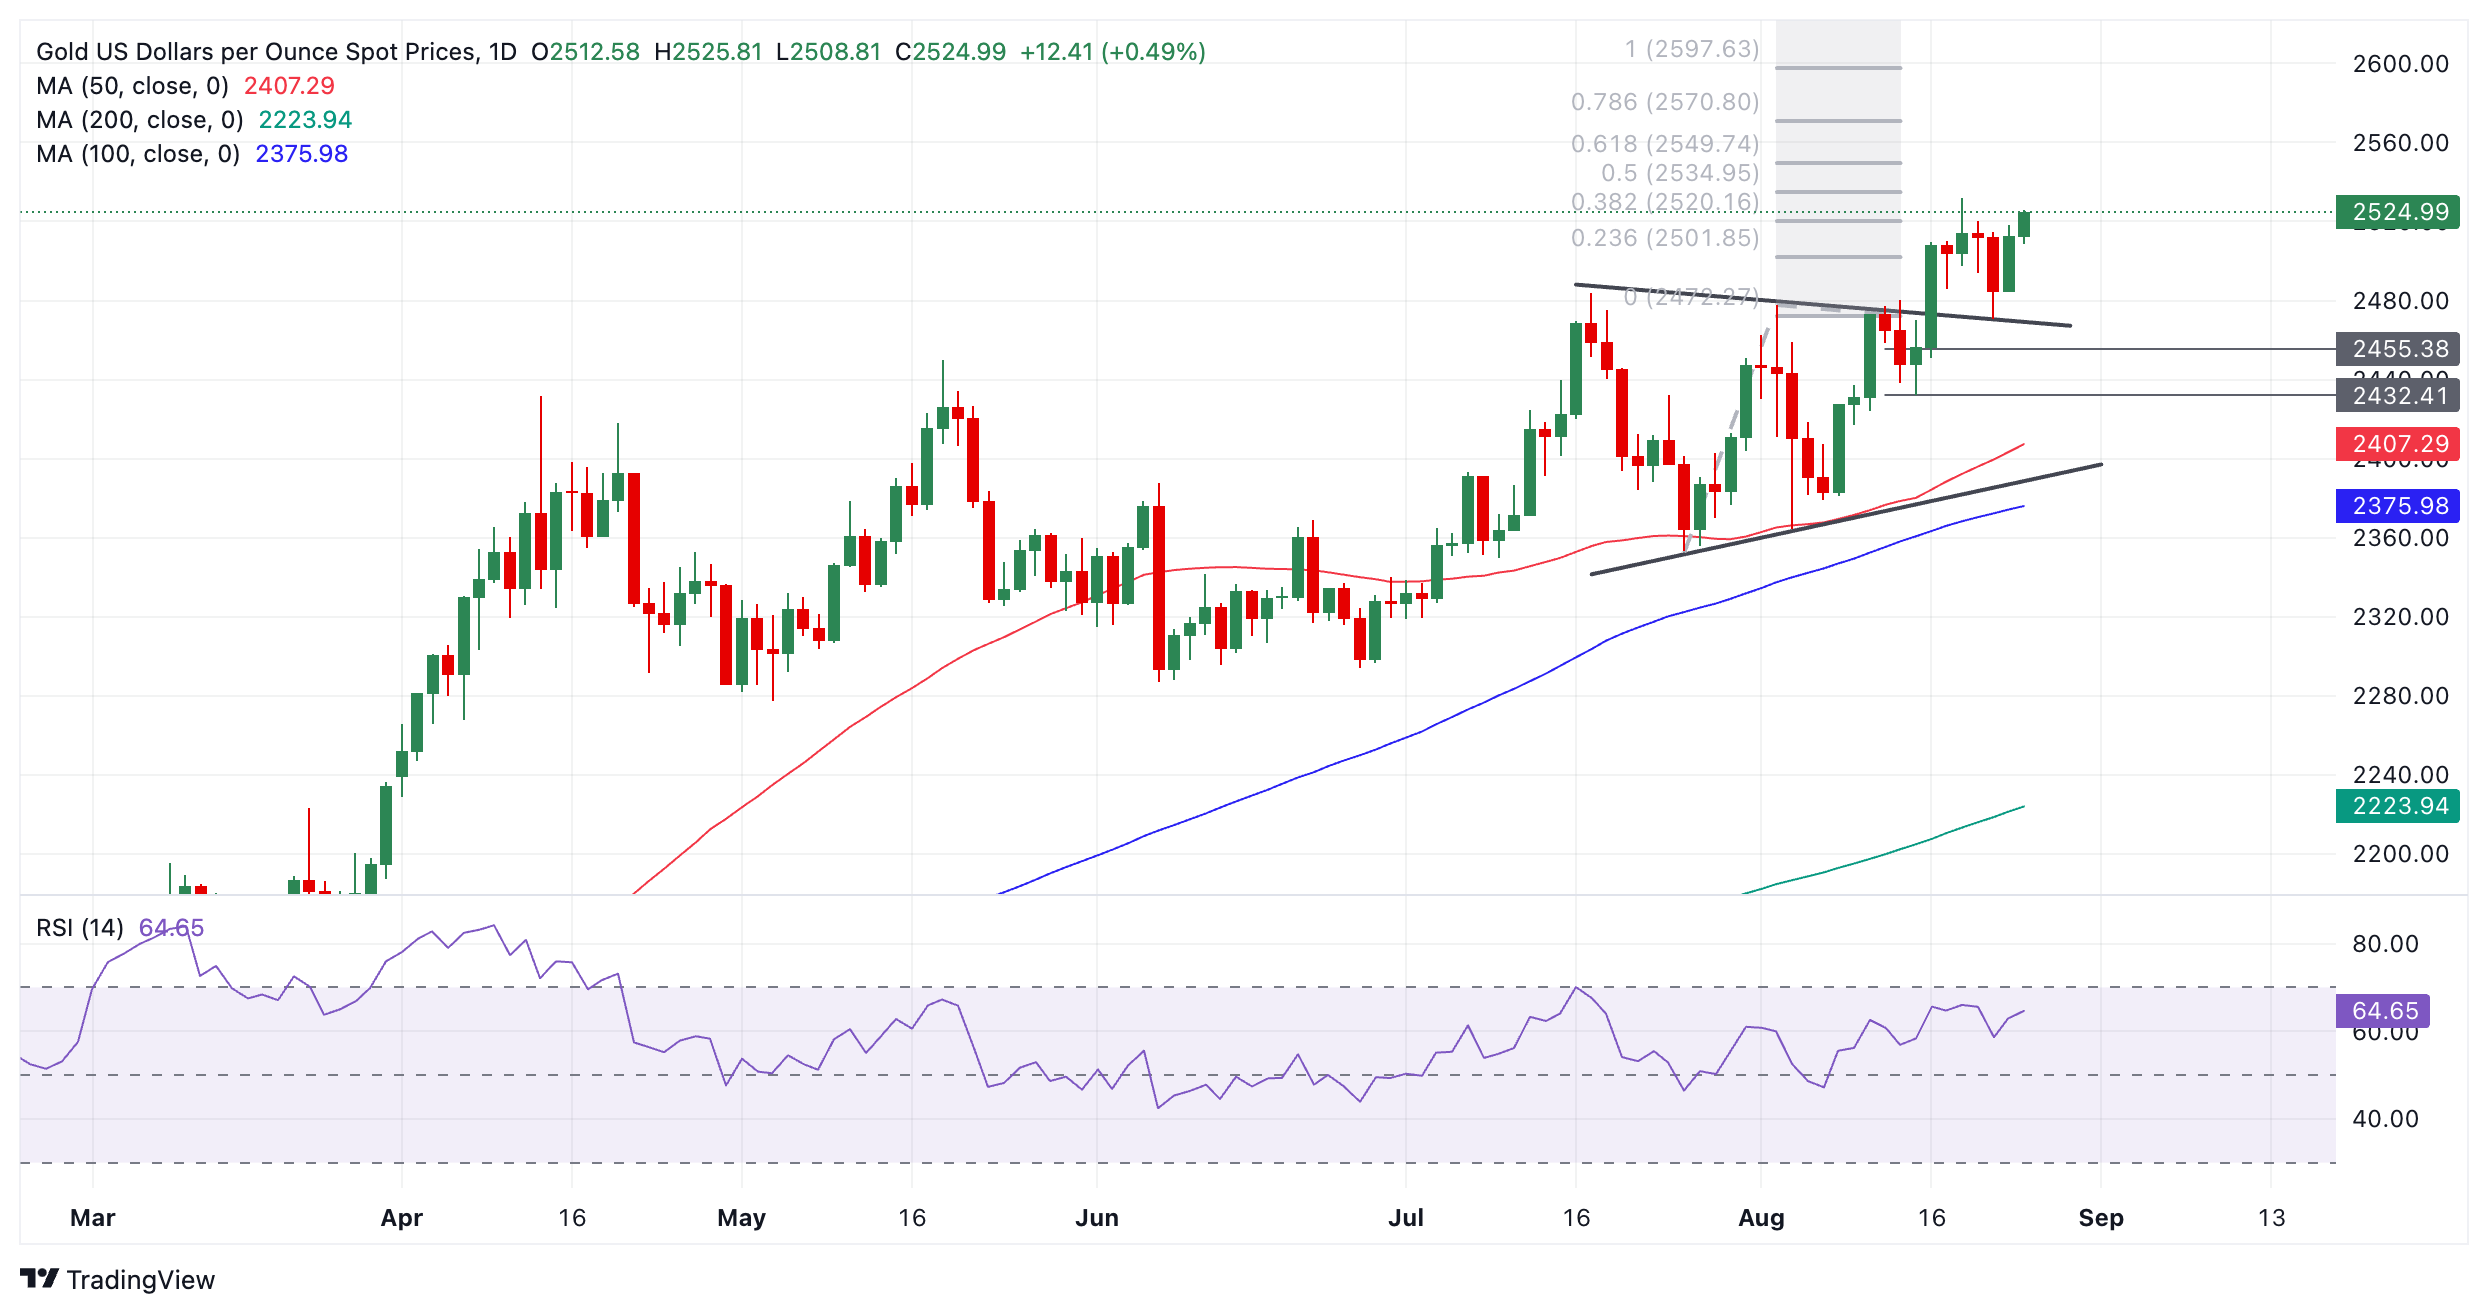
Gold (XAU/USD) trades up into the $2,520s on Monday, just off its all-time highs of $2,531, as a combination of safe-haven demand sparked by rising geopolitical tensions in the Middle East, and increased confidence US interest rates will track lower in the medium-to-long term, make the non-interest paying asset more attractive to investors.

Gold edges higher as risk aversion helps safe-haven demand

Gold trades higher on Monday as geopolitical risk aversion increases investor demand for safe-havens, of which Gold is a notable example.

Rising tensions in the Middle East are a factor, after the Israelis launched a mass pre-emptive strike on Hezbollah positions in Lebanon over the weekend. Hezbollah then retaliated with a hail of missiles and drone strikes in northern Israel. Fears Iran could enter the conflict after weeks of threats also persist.

Powell speech drives Gold higher after sea change in language

Gold rose over a percentage point on Friday after the Chairman of the Federal Reserve (Fed) Jerome Powell made a speech at the Jackson Hole central banking symposium, in which he gave the clearest signals yet that the Fed is going to cut interest rates.

Powell raised concerns that the US labor market is slowing down due to the impact of continuously high interest rates, which have remained at a peak range of 5.25%-5.50% since July 2023. Whilst these had successfully reduced inflation, they were now having a negative impact on company hiring.

“Upside risks to inflation have diminished, downside risks to employment have increased,” said Powell, adding that “Labor market cooling is unmistakable, no longer overheated.”

US government bond yields, which reflect investors’ outlook for inflation and interest rates, fell after his speech. The yellow metal tends to appreciate when yields drop as it reduces the opportunity cost of holding non-interest paying Gold.

The US Dollar Index (DXY), which measures the strength of the Dollar against a trade-weighted basket, – and is negatively correlated to Gold – sank to a new year-to-date low of 100.53 on Monday morning as traders continued to digest Powell’s comments.

Gold has benefited from elevated expectations that the Fed will make a “mega” 0.50% interest-rate cut in September – double the usual 0.25% reduction. From a probability in the mid-20% prior to his speech, the chances of such a bumper cut have risen back up to the mid-30% afterward, according to the CME FedWatch tool, which uses the price of 30-day fed fund futures in its calculations.

Technical Analysis: Gold extends bounce from top of old range

Gold (XAU/USD) extends the rebound from support at the top of its old range. Despite trading sideways recently, the pair remains in an uptrend and given “the trend is your friend” this continues to favor longs over shorts.

XAU/USD Daily Chart

The breakout of the range on August 14 generated an upside target at roughly $2,550, calculated by taking the 0.618 Fibonacci ratio of the range’s height and extrapolating it higher. This target is the minimum expectation for a follow-through after a breakout based on principles of technical analysis.

A break above the $2,531 all-time high from August 20 would provide added confirmation of a continuation higher towards the $2,550 target.

Alternatively, a break back inside the range would negate the upside projected target. Such a move would be confirmed on a close below $2,470 (August 22 low). It would change the picture for Gold and bring the short-term uptrend into doubt.

Gold is in a broad uptrend on medium and long-term time frames, however, which further supports an overall bullish outlook for the precious metal.

EUR/USD stays below 1.1200 after German IFO data

EUR/USD stays below 1.1200 after German IFO data

EUR/USD struggles to gain traction and trades marginally lower on the day below 1.1200 in the European session, even though the IFO sentiment figures from Germany came in slightly better than expected. Investors await Durable Goods orders data from the US.

Further north, EUR/USD is expected to challenge its 2024 high of 1.1174 (August 21), followed by the 1.1200 round mark and the 2023 top of 1.1275 (July 18).

The pair’s next downward target is the weekly low of 1.0881 (August 8), prior to the key 200-day SMA at 1.0846, and the weekly low of 1.0777 (August 1). Down from here comes the June bottom of 1.0666 (June 26), before the May low of 1.0649 (May 1).

Looking at the larger picture, the pair’s upward trend should continue as long as it remains above the crucial 200-day SMA.

So far, the four-hour chart shows a tepid deceleration of the upside bias. The initial resistance level is 1.1174, which precedes 1.1275. On the other hand, there is immediate support at the 55-SMA of 1.1028, followed by 1.0949 and lastly 1.0881. The relative strength index (RSI) retreated to around 56.

EUR/USD halted its multi-day rebound and came under renewed downside pressure following Wednesday’s YTD peaks past 1.1170, all against the backdrop of the resurgence of some bid bias in the US Dollar (USD).

Indeed, the Greenback rebounded from recent 2024 lows in the sub-101.00 zone (August 21), as indicated by the US Dollar Index (DXY), in response to some loss of momentum in the risk complex after investors assessed the FOMC Minutes, which left the possibility of a rate cut by the Fed in September open.

Contributing to the daily rebound in the US Dollar, US yields also managed to gather extra steam, advancing markedly across various maturity periods.

In the meantime, mixed data from advanced PMIs in the euro area appears to have played against the continuation of the pair’s march north, while the ECB Accounts revealed that policymakers saw no need to lower interest rates last month but warned that a new discussion may take place in September as high rates continue to impact growth.

Still around the ECB, a new survey saw that growth in negotiated salaries, a crucial indication for forecasting future pricing pressures, slowed sharply in the second quarter.

Supporting the idea of a rate cut in September as exposed by the FOMC Minutes, Kansas City Fed Bank President Jeff Schmid announced that he is closely scrutinising the causes behind the rise in the unemployment rate and would rely on facts to determine whether to support a rate drop next month. In addition, Boston Fed President Susan Collins added that it would soon be time for the Fed to begin a rate-cutting cycle, indicating that she will likely support a rate decrease at the central bank’s policy meeting next month. Similarly, Federal Reserve Bank of Philadelphia President Patrick Harker showed his readiness to back a September rate decrease if the data met his expectations. Harker stated that, unless there is an unexpected shift in the data before then, he believes it is time to start cutting rates.

Regarding potential rate cuts, the CME Group’s FedWatch Tool shows nearly a 75% probability of a 25 bps reduction at the September 18 meeting.

Should the Fed proceed with larger rate cuts, the policy gap between the Fed and the ECB could narrow over the medium to long term, potentially pushing EUR/USD higher, especially as markets expect two more rate cuts from the ECB this year.

However, in the longer term, the US economy is anticipated to outperform Europe, suggesting that any prolonged weakness in the dollar might be temporary.

Looking ahead, attention will turn to Chair Jerome Powell’s speech at Jackson Hole and Bank of Japan Governor Kazuo Ueda’s testimony before Parliament.

4 Effective Trading Indicators Every Trader Should Know

4 Effective Trading Indicators Every Trader Should Know

The Benefits of a Simple Strategy

Traders tend to overcomplicate things when they’re starting out in the forex market. This fact is unfortunate but undeniably true. Traders often feel that a complex trading strategy with many moving parts must be better when they should focus on keeping things as simple as possible. This is because a simple strategy allows for quick reactions and less stress.

If you’re just getting started, you should seek the most effective and simple strategies for identifying trades and stick with that approach.

Quote by Leonardo da Vinci on why simplicity is best, which ties in with using a simple forex trading strategy.

Discover the Best Forex Indicators for a Simple Strategy

One way to simplify your trading is through a trading plan that includes chart indicators and a few rules as to how you should use those indicators. In keeping with the idea that simple is best, there are four easy indicators you should become familiar with using one or two at a time to identify trading entry and exit points:

  • Moving Average
  • RSI (Relative Strength Index)
  • Slow Stochastic
  • MACD

Once you are trading a live account a simple plan with simple rules will be your best ally.

Using Forex Indicators to Read Charts for Different Market Environments

There are many fundamental factors when determining the value of a currency relative to another currency. Many traders opt to look at the charts as a simplified way to identify trading opportunities – using forex indicators to do so.

When looking at the charts, you’ll notice two common market environments. The two environments are either ranging markets with a strong level of support and resistance, or floor and ceiling that price isn’t breaking through or a trending market where price is steadily moving higher or lower.

Using technical analysis allows you as a trader to identify range bound or trending environments and then find higher probability entries or exits based on their readings. Reading the indicators is as simple as putting them on the chart.

Trading with Moving Averages

One of the best forex indicators for any strategy is moving average. Moving averages make it easier for traders to locate trading opportunities in the direction of the overall trend. When the market is trending up, you can use the moving average or multiple moving averages to identify the trend and the right time to buy or sell.

The moving average is a plotted line that simply measures the average price of a currency pair over a specific period of time, like the last 200 days or year of price action to understand the overall direction.

 Learn Forex: GBPUSD Daily Chart – Moving Average

GBPUSD daily chart showing the use of Moving Averages as a forex indicator to measure the average price of a currency over time.

You’ll notice a trade idea was generated above only with adding a few moving averages to the chart. Identifying trade opportunities with moving averages allows you see and trade off of momentum by entering when the currency pair moves in the direction of the moving average, and exiting when it begins to move opposite.

Trading with RSI

The Relative Strength Index or RSI is an oscillator that is simple and helpful in its application. Oscillators like the RSI help you determine when a currency is overbought or oversold, so a reversal is likely. For those who like to ‘buy low and sell high’, the RSI may be the right indicator for you.

EURAUD daily chart plotted with RSI indicator to identify better exit or entry prices for forex trading.

The RSI can be used equally well in trending or ranging markets to locate better entry and exit prices. When markets have no clear direction and are ranging, you can take either buy or sell signals like you see above. When markets are trending, it becomes more obvious which direction to trade (one benefit of trend trading) and you only want to enter in the direction of the trend when the indicator is recovering from extremes.

Because the RSI is an oscillator, it is plotted with values between 0 and 100. The value of 100 is considered overbought and a reversal to the downside is likely whereas the value of 0 is considered oversold and a reversal to the upside is commonplace. If an uptrend has been discovered, you would want to identify the RSI reversing from readings below 30 or oversold before entering back in the direction of the trend.

Trading with Stochastics

Slow stochastics are an oscillator like the RSI that can help you locate overbought or oversold environments, likely making a reversal in price. The unique aspect of trading with the stochastic indicator is the two lines, %K and %D line to signal our entry.

Because the oscillator has the same overbought or oversold readings, you simply look for the %K line to cross above the %D line through the 20 level to identify a solid buy signal in the direction of the trend.

NZDUSD 3 hour chart showing the use of the stochastic indicator to inform of a forex trading strategy.

Trading with the Moving Average Convergence & Divergence (MACD)

Sometimes known as the king of oscillators, the MACD can be used well in trending or ranging markets due to its use of moving averages provide a visual display of changes in momentum.

After you’ve identified the market environment as either ranging or trading, there are two things you want to look for to derive signals from this indictor. First, you want to recognize the lines in relation to the zero line which identify an upward or downward bias of the currency pair. Second, you want to identify a crossover or cross under of the MACD line (Red) to the Signal line (Blue) for a buy or sell trade, respectively.

Graph showing a MACD line that identifies the upward or downward bias of a currency pair.

Like all indicators, the MACD is best coupled with an identified trend or range-bound market. Once you’ve identified the trend, it is best to take crossovers of the MACD line in the direction of the trend. When you’ve entered the trade, you can set stops below the recent price extreme before the crossover, and set a trade limit at twice the amount you’re risking.

AUDCAD 2 hour chart where the MACD indicator is being used to inform traders of a forex trading strategy.

EUR/USD, GBP/USD, and Gold – Latest Sentiment Analysis

EUR/USD, GBP/USD, and Gold – Latest Sentiment Analysis

Retail trader data shows 25.76% of EUR/USD traders are net-long with the ratio of traders short to long at 2.88 to 1.The number of traders net-long is 12.88% higher than yesterday and 17.56% lower from last week, while the number of traders net-short is 0.68% higher than yesterday and 19.41% higher from last week.

We typically take a contrarian view to crowd sentiment, and the fact traders are net-short suggests EUR/USD prices may continue to rise. Positioning is less net-short than yesterday but more net-short from last week. The combination of current sentiment and recent changes gives us a further mixed EUR/USD trading bias.

Retail trader data shows 28.27% of GBP/USD traders are net-long with the ratio of traders short to long at 2.54 to 1.The number of traders net-long is 0.48% lower than yesterday and 32.83% lower from last week, while the number of traders net-short is 6.55% higher than yesterday and 41.14% higher from last week.

We typically take a contrarian view to crowd sentiment, and the fact traders are net-short suggests GBP/USD prices may continue to rise. Traders are further net-short than yesterday and last week, and the combination of current sentiment and recent changes gives us a stronger GBP/USD-bullish contrarian trading bias.

Retail trader data shows 54.85% of Gold traders are net-long with the ratio of traders long to short at 1.21 to 1.The number of traders net-long is 8.56% higher than yesterday and 18.90% higher from last week, while the number of traders net-short is 9.27% lower than yesterday and 5.95% lower from last week.

We typically take a contrarian view to crowd sentiment, and the fact traders are net-long suggests Gold prices may continue to fall. Traders are further net-long than yesterday and last week, and the combination of current sentiment and recent changes gives us a stronger Gold-bearish contrarian trading bias.

​​​FTSE 100, DAX 40 and S&P 500 Bid Ahead of Powell Speech​​​

​​​FTSE 100, DAX 40 and S&P 500 Bid Ahead of Powell Speech​​​

FTSE rises ahead of Jackson Hole speeches

​The FTSE 100 has seen some profit-taking this week after almost two weeks of buying frenzy. Ahead of speeches by Fed Chair Jerome Powell at 3pm and BoE Governor Andrew Bailey at 4pm at the Jackson Hole symposium, which may provide clarity on central bank monetary policy. Given the content of these speeches, the index may either revisit the 55-day simple moving average at 8,218 or retest Monday’s high at 8,374. This is part of key resistance which rises to the early August peak at 8,404.

​Below 8,218 lies a significant support zone between the late May to early July lows at 8,138-to-8,106.

FTSE 100 Daily Chart

​​DAX 40 still gunning for 18,580 late July peak

​The DAX 40‘s swift rebound from the 17 August low at 17,021 has brought it close to the late July high of 18,580 which remains in sight.

​Minor support can be seen along the 55-day simple moving average at 18,241 ahead of the 9 July low at 18,211.

Dax 40 Daily Chart

​​S&P 500 awaits Fed Chair Jerome Powell speech

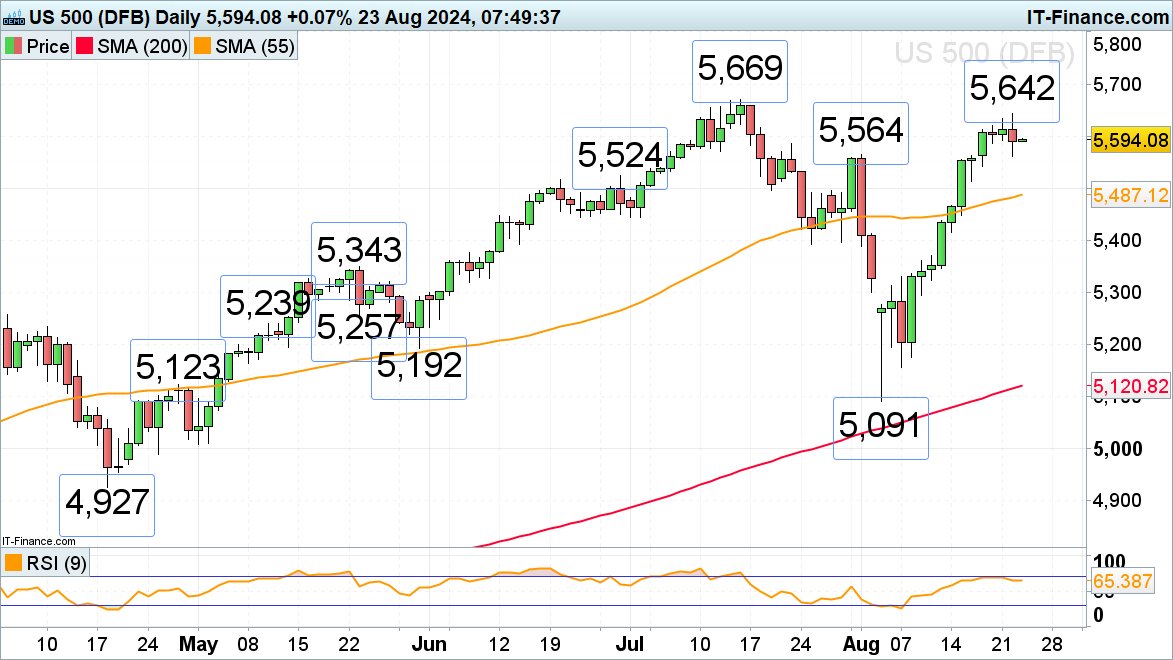
​ The S&P 500‘s rally from the 5 August low at 5,091, which ended one day short of matching a 20-year winning streak, so far took it to Thursday’s high at 5,642. ​​Ahead of Jerome Powell’s 3pm speech on Friday, trading between the 5,462 high and 5,562 low seen on Thursday is likely to occur.

​A rise above 5,642 would probably meet the July record high of 5,669. Potential declines below 5,562 may find support around the late June high at 5,524.

S&P 500 Daily Chart

Technical Indicators Defined and Explained

Technical Indicators Defined and Explained

Technical indicators are chart analysis tools that can help traders better understand and act on price movement. There is a huge range of technical analysis tools available that analyze trends, provide price averages, measure volatility and more.

In this piece, we explore the types of technical indicators available, from RSI to Bollinger Bands®, explain how to respond to technical signals, and reveal the top tips to making the tools an effective part of your trading journey.

Types of Technical Indicators

There are four main types of technical indicators: Trend Following, Oscillators, Volatility and Support/Resistance. They are grouped based on their function, which ranges from revealing the average price of a currency pair over time, to providing a clearer picture of support and resistance levels.

List of Technical Indicators

1. Trend Indicators

Trend following indicators were created to help traders trade currency pairs that are trending up or trending down. We have all heard the phrase ‘the trend is your friend’ – these indicators can help point out the direction of the trend and can tell us if a trend actually exists.

Moving Average Indicator

A Moving Average (MA) is a technical tool that averages a currency pair’s price over a period of time. The smoothing effect this has on the chart helps give a clearer indication on what direction the pair is moving – either up, down, or sideways. There are a variety of moving averages to choose from, with Simple Moving Averages and Exponential Moving Averages being the most popular.

Ichimoku Indicator

Ichimoku is a complicated looking trend assistant that is simpler than it appears. This Japanese indicator was created to be a standalone indicator that shows current trends, displays support/resistance levels, and indicates when a trend has likely reversed. For more, check out our Definitive Guide to Trading Trends with Ichimoku Cloud.

ADX Indictor

The Average Direction Index won’t tell you whether price is trending up or down, but it will tell you if price is trending or is ranging. This makes it the perfect filter for either a range or trend strategy by making sure you are trading based on current market conditions. For more, see our article How to Use ADX to Identify Forex Trends.

2. Oscillator Indicators

Oscillators give traders an idea of how momentum is developing on a specific currency pair. When price treks higher, oscillators will move higher. When price drops lower, oscillators will move lower. Whenever oscillators reach an extreme level, it might be time to look for price to turn back around to the mean.

However, just because an oscillator reaches ‘Overbought’ or ‘Oversold’ levels doesn’t mean we should try to call a top or a bottom. Oscillators can stay at extreme levels for a long time, so we need to wait for a valid sign before trading.

RSI Indicator

The Relative Strength Index is arguably the most popular oscillator to use. A big component of its formula is the ratio between the average gain and average loss over the last 14 periods. The RSI is bound between 0 – 100 and is considered overbought above 70 and oversold when below 30. Traders generally look to sell when 70 is crossed from above and look to buy when 30 is crossed from below. Click here to learn about A Better Way to Use RSI to Signal When to Take a Forex Trade.

Stochastics Indicator

Stochastics offer traders a different approach to calculate price oscillations by tracking how far the current price is from the lowest low of the last X number of periods. This distance is then divided by the difference between the high and low price during the same number of periods. The line created, %K, is then used to create a moving average, %D, that is placed directly on top of the %K. For more, check out our article How to Trade With Stochastic Oscillator.

CCI Indicator

The Commodity Channel Index is different than many oscillators in that there is no limit to how high or how low it can go. It uses 0 as a centerline with overbought and oversold levels starting at +100 and -100. Traders look to sell breaks below +100 and buy breaks above -100. To see some real examples of the CCI in action, take a look at how to Trade Forex with the CCI Indicator.

MACD Indicator

The Moving Average Convergence/Divergence tracks the difference between two EMA lines, the 12 EMA and 26 EMA. The difference between the two EMAs is then drawn on a sub-chart (called the MACD line) with a 9 EMA drawn directly on top of it (called the Signal line). Traders then look to buy when the MACD line crosses above the signal line and look to sell when the MACD line crosses below the signal line as seen here. There are also opportunities to trade divergence between the MACD and price.

3. Volatility Indicators

Volatility measures how large the upswings and downswings are for a particular currency pair. When a currency’s price fluctuates wildly up and down it is said to have high volatility. Whereas a currency pair that does not fluctuate as much is said to have low volatility. It’s important to note how volatile a currency pair is before opening a trade, so we can take that into consideration with picking our trade size and stop and limit levels. Read our article on the Top 10 Most Volatile Currency Pairs for more.

Bollinger Bands® Indicator

Bollinger Bands ® print three lines directly on top of the price chart. The middle ‘band’ is a 20-period simple moving average with an upper and low ‘band’ that are drawn two standard deviations above and below the 20 MA. This means the more volatile the pair is, the wider the outer bands will become, giving the Bollinger Bands® the ability to be used universally across currency pairs no matter how they behave.

ATR Indicator

The Average True Range tells us the average distance between the high and low price over the last set number of bars (typically 14). This indicator is presented in pips where the higher the ATR gets, the more volatile the pair, and vice versa. This makes it a perfect tool to measure volatility. For more, see How to Use ATR in a Forex Strategy.

4. Support/Resistance Indicators

Support and resistance is key to technical analysis. The concept refers to the price levels on charts that form barriers to an asset price being pushed in a given direction. For more, see our article on Identifying Support and Resistance and make sure you consider the indicators below.

Pivot Points

Pivot Points are one of the most widely used in all markets including equities, commodities, and Forex. They are created using a formula composed of high, low and close prices for the previous period. Traders use these lines as potential support and resistance levels, levels that price might have a difficult time breaking through.

Donchian Channels

Price channels or Donchian Channels are lines above and below recent price action that show the high and low prices over an extended period of time. These lines can then act as support or resistance if price comes into contact with them again. For a deeper look at using this tool successfully, read Breakout Trades and the Power of Price Channels.

​​​FTSE 100, DAX 40 and S&P 500 Bid Ahead of Powell Speech​​​

​​​FTSE 100, DAX 40 and S&P 500 Bid Ahead of Powell Speech​​​

FTSE rises ahead of Jackson Hole speeches

​The FTSE 100 has seen some profit-taking this week after almost two weeks of buying frenzy. Ahead of speeches by Fed Chair Jerome Powell at 3pm and BoE Governor Andrew Bailey at 4pm at the Jackson Hole symposium, which may provide clarity on central bank monetary policy. Given the content of these speeches, the index may either revisit the 55-day simple moving average at 8,218 or retest Monday’s high at 8,374. This is part of key resistance which rises to the early August peak at 8,404.

​Below 8,218 lies a significant support zone between the late May to early July lows at 8,138-to-8,106.

FTSE 100 Daily Chart

​​DAX 40 still gunning for 18,580 late July peak

​The DAX 40‘s swift rebound from the 17 August low at 17,021 has brought it close to the late July high of 18,580 which remains in sight.

​Minor support can be seen along the 55-day simple moving average at 18,241 ahead of the 9 July low at 18,211.

Dax 40 Daily Chart

​​S&P 500 awaits Fed Chair Jerome Powell speech

​ The S&P 500‘s rally from the 5 August low at 5,091, which ended one day short of matching a 20-year winning streak, so far took it to Thursday’s high at 5,642. ​​Ahead of Jerome Powell’s 3pm speech on Friday, trading between the 5,462 high and 5,562 low seen on Thursday is likely to occur.

​A rise above 5,642 would probably meet the July record high of 5,669. Potential declines below 5,562 may find support around the late June high at 5,524.

S&P 500 Daily Chart

Technical Indicators Defined and Explained

Technical Indicators Defined and Explained

Technical indicators are chart analysis tools that can help traders better understand and act on price movement. There is a huge range of technical analysis tools available that analyze trends, provide price averages, measure volatility and more.

In this piece, we explore the types of technical indicators available, from RSI to Bollinger Bands®, explain how to respond to technical signals, and reveal the top tips to making the tools an effective part of your trading journey.

Types of Technical Indicators

There are four main types of technical indicators: Trend Following, Oscillators, Volatility and Support/Resistance. They are grouped based on their function, which ranges from revealing the average price of a currency pair over time, to providing a clearer picture of support and resistance levels.

List of Technical Indicators

1. Trend Indicators

Trend following indicators were created to help traders trade currency pairs that are trending up or trending down. We have all heard the phrase ‘the trend is your friend’ – these indicators can help point out the direction of the trend and can tell us if a trend actually exists.

Moving Average Indicator

A Moving Average (MA) is a technical tool that averages a currency pair’s price over a period of time. The smoothing effect this has on the chart helps give a clearer indication on what direction the pair is moving – either up, down, or sideways. There are a variety of moving averages to choose from, with Simple Moving Averages and Exponential Moving Averages being the most popular.

Ichimoku Indicator

Ichimoku is a complicated looking trend assistant that is simpler than it appears. This Japanese indicator was created to be a standalone indicator that shows current trends, displays support/resistance levels, and indicates when a trend has likely reversed. For more, check out our Definitive Guide to Trading Trends with Ichimoku Cloud.

ADX Indictor

The Average Direction Index won’t tell you whether price is trending up or down, but it will tell you if price is trending or is ranging. This makes it the perfect filter for either a range or trend strategy by making sure you are trading based on current market conditions. For more, see our article How to Use ADX to Identify Forex Trends.

2. Oscillator Indicators

Oscillators give traders an idea of how momentum is developing on a specific currency pair. When price treks higher, oscillators will move higher. When price drops lower, oscillators will move lower. Whenever oscillators reach an extreme level, it might be time to look for price to turn back around to the mean.

However, just because an oscillator reaches ‘Overbought’ or ‘Oversold’ levels doesn’t mean we should try to call a top or a bottom. Oscillators can stay at extreme levels for a long time, so we need to wait for a valid sign before trading.

RSI Indicator

The Relative Strength Index is arguably the most popular oscillator to use. A big component of its formula is the ratio between the average gain and average loss over the last 14 periods. The RSI is bound between 0 – 100 and is considered overbought above 70 and oversold when below 30. Traders generally look to sell when 70 is crossed from above and look to buy when 30 is crossed from below. Click here to learn about A Better Way to Use RSI to Signal When to Take a Forex Trade.

Stochastics Indicator

Stochastics offer traders a different approach to calculate price oscillations by tracking how far the current price is from the lowest low of the last X number of periods. This distance is then divided by the difference between the high and low price during the same number of periods. The line created, %K, is then used to create a moving average, %D, that is placed directly on top of the %K. For more, check out our article How to Trade With Stochastic Oscillator.

CCI Indicator

The Commodity Channel Index is different than many oscillators in that there is no limit to how high or how low it can go. It uses 0 as a centerline with overbought and oversold levels starting at +100 and -100. Traders look to sell breaks below +100 and buy breaks above -100. To see some real examples of the CCI in action, take a look at how to Trade Forex with the CCI Indicator.

MACD Indicator

The Moving Average Convergence/Divergence tracks the difference between two EMA lines, the 12 EMA and 26 EMA. The difference between the two EMAs is then drawn on a sub-chart (called the MACD line) with a 9 EMA drawn directly on top of it (called the Signal line). Traders then look to buy when the MACD line crosses above the signal line and look to sell when the MACD line crosses below the signal line as seen here. There are also opportunities to trade divergence between the MACD and price.

3. Volatility Indicators

Volatility measures how large the upswings and downswings are for a particular currency pair. When a currency’s price fluctuates wildly up and down it is said to have high volatility. Whereas a currency pair that does not fluctuate as much is said to have low volatility. It’s important to note how volatile a currency pair is before opening a trade, so we can take that into consideration with picking our trade size and stop and limit levels. Read our article on the Top 10 Most Volatile Currency Pairs for more.

Bollinger Bands® Indicator

Bollinger Bands ® print three lines directly on top of the price chart. The middle ‘band’ is a 20-period simple moving average with an upper and low ‘band’ that are drawn two standard deviations above and below the 20 MA. This means the more volatile the pair is, the wider the outer bands will become, giving the Bollinger Bands® the ability to be used universally across currency pairs no matter how they behave.

Bollinger Bands® is a registered trademark of John Bollinger.

ATR Indicator

The Average True Range tells us the average distance between the high and low price over the last set number of bars (typically 14). This indicator is presented in pips where the higher the ATR gets, the more volatile the pair, and vice versa. This makes it a perfect tool to measure volatility. For more, see How to Use ATR in a Forex Strategy.

4. Support/Resistance Indicators

Support and resistance is key to technical analysis. The concept refers to the price levels on charts that form barriers to an asset price being pushed in a given direction. For more, see our article on Identifying Support and Resistance and make sure you consider the indicators below.

Pivot Points

Pivot Points are one of the most widely used in all markets including equities, commodities, and Forex. They are created using a formula composed of high, low and close prices for the previous period. Traders use these lines as potential support and resistance levels, levels that price might have a difficult time breaking through.

Donchian Channels

Price channels or Donchian Channels are lines above and below recent price action that show the high and low prices over an extended period of time. These lines can then act as support or resistance if price comes into contact with them again. For a deeper look at using this tool successfully, read Breakout Trades and the Power of Price Channels.