Japanese CPI and Ueda’s Comments Prop up the Yen Ahead of Powell’s Address

Japanese CPI and Ueda’s Comments Prop up the Yen Ahead of Powell’s Address

BoJ Encouraged to Stick to the Plan as Inflation Continues above Target

The Japanese currency strengthened, with the Yen gaining as much as 0.7% against the US dollar, following comments from Bank of Japan (BoJ) Governor Kazuo Ueda suggesting further interest rate increases. This development coincided with a recovery in Asian markets, buoyed by improved performance in Chinese stocks.

In Japan, government bond futures experienced a decline while the Topix index saw gains. Addressing lawmakers, the central bank governor maintained that the BoJ’s stance remained unchanged, provided that inflation and economic data aligned with their projections. These remarks followed reassurances from Ueda’s deputy that future rate hikes would be contingent on market conditions, an attempt to calm investors after the central bank’s July rate increase sparked a significant global equity selloff earlier this month.

Adding to the economic picture, Japan’s inflation data for July exceeded forecasts. The consumer price index showed a 2.8% year-on-year increase, matching the previous month’s figure and surpassing the 2.7% rise predicted by economists.
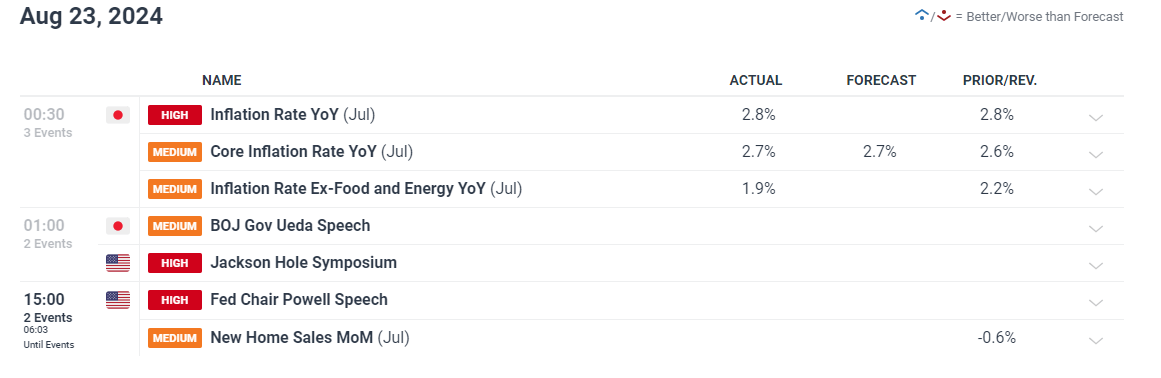
A screenshot of a computer  Description automatically generated

A recent Reuters poll revealed that 57% of surveyed economists expect another rate hike from the BoJ before the end of the year, with those voting for the increase seeing this most likely in December.

With the interest rate differential narrowing, albeit slowly, markets have already started to cover large carry trades that sought to take advantage of cheap money at a time when yen interest rates were in negative territory. The trend is likely to continue as long as inflation and wage growth unfold as anticipated by the BoJ. Higher interest rates in Japan contrast the market’s expectations around incoming rate cuts from the Federal Reserve Bank, likely starting in September.

Intra-day Currency Performance
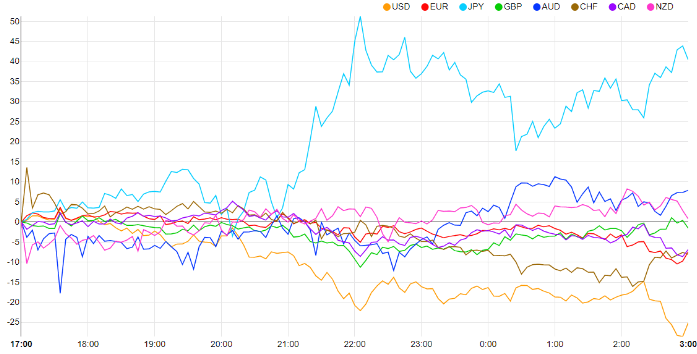
A graph of different colored lines  Description automatically generated

USD/JPY Witnesses a Modest Decline Ahead of Jackson Hole Event

USD/JPY trades a tad lower ahead of Jerome Powell’s Jackson Hole address on the economic outlook. He and other prominent central bankers will provide their insights on current conditions and monetary policy in general.

Given we have already perused the FOMC minutes from July where the majority of the committee agreed that a rate cut in September is appropriate, there could be very little new information being shared today. Under such a scenario it wouldn’t be unusual to see the dollar breathe a sigh of relief and trade a little higher heading into the weekend.

The pair has attempted a pullback after the massive downtrend, which culminated after a softer US CPI print encouraged Japanese officials to intervene in the FX market to strengthen the yen. USD/JPY now trades lower while markets attempt to assess the next move. If the Fed adopt a bearish outlook while the BoJ continue to move forward with one more rate hike in December, it is possible there will be further weakness heading into the end of the year. Support lies at the spike low of 141.70, followed by 140.25 – a prior swing low from December last year. Resistance lies at the recent swing high of 149.40.

USD/JPY Daily Chart
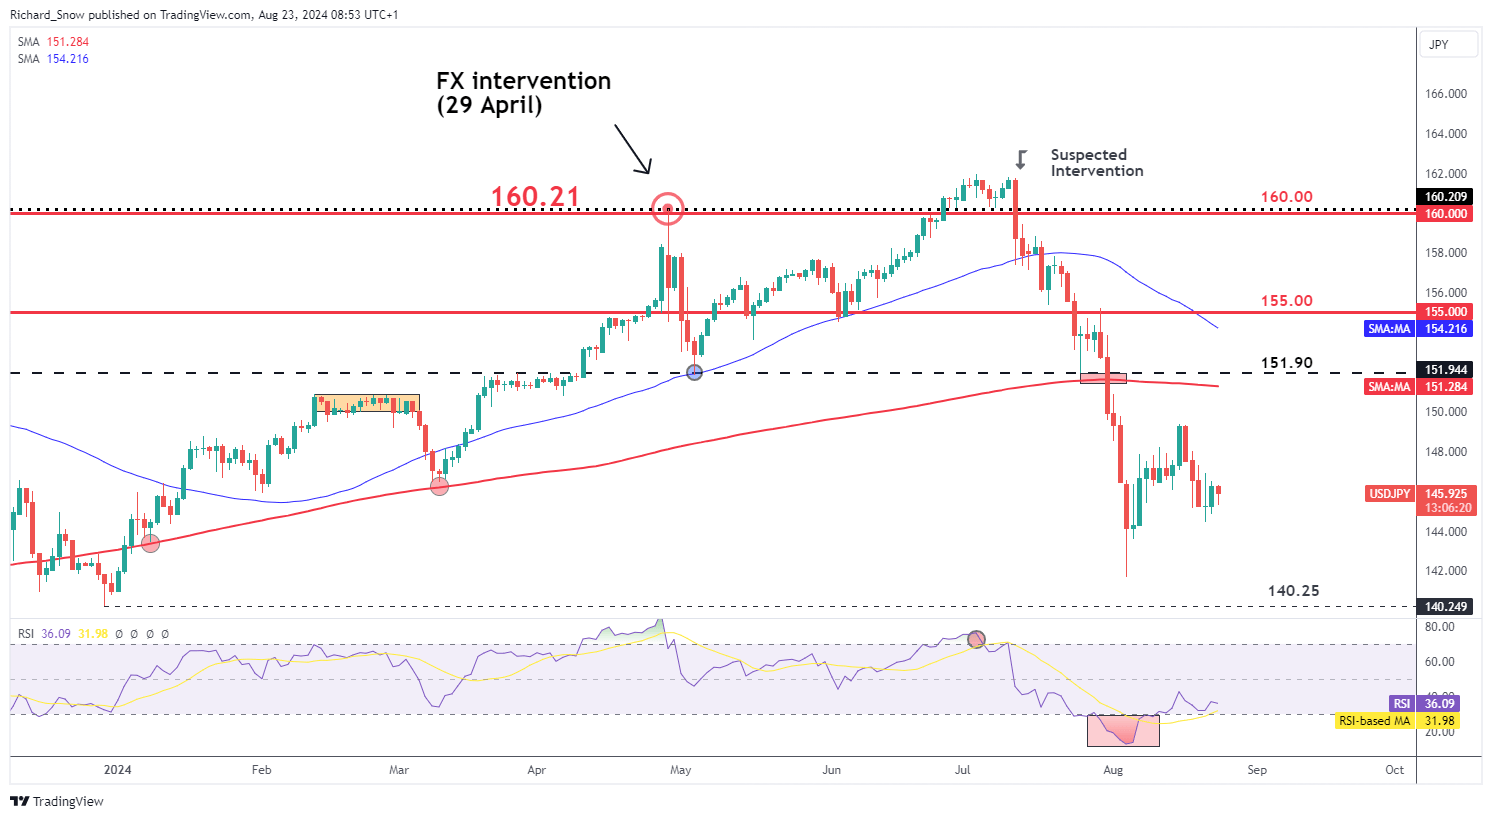
A screenshot of a graph  Description automatically generated


Hammer Candlestick Patterns: A Trader’s Guide

Hammer Candlestick Patterns: A Trader’s Guide

Trading with the Hammer Candle: Main Talking Points

The hammer candlestick pattern is frequently observed in the forex market and provides important insight into trend reversals. It’s crucial that traders understand that there is more to the hammer candle than simply spotting it on a chart. Price action and the location of the hammer candle, when viewed within the existing trend, are both crucial validating factors for this candle.

This article will cover:

  • What is a hammer candle pattern?
  • Advantages and limitations of the hammer chart pattern
  • Using a hammer candlestick pattern in trading
  • Further reading on trading with candlestick patterns

What is a Hammer Candlestick?

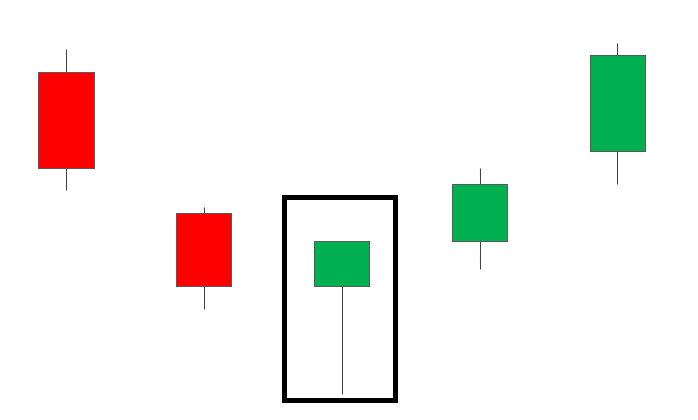
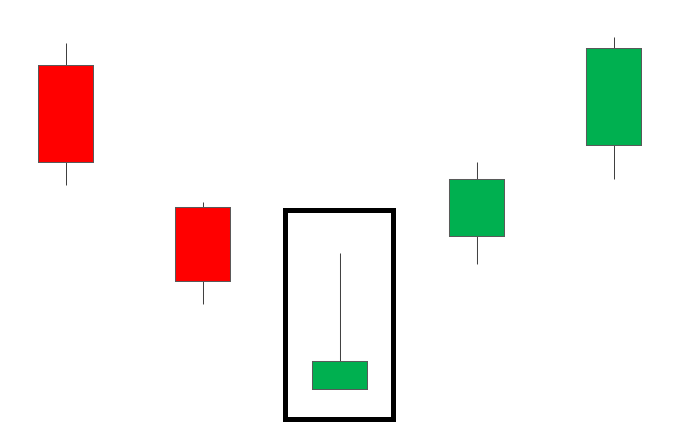
The hammer candlestick is found at the bottom of a downtrend and signals a potential (bullish) reversal in the market.The most common hammer candle is the bullish hammer which has a small candle body and an extended lower wick – showing rejection of lower prices.The other pattern traders look out for is the inverted hammer, which is an upside-down bullish hammer.

Bullish Hammer Candlestick

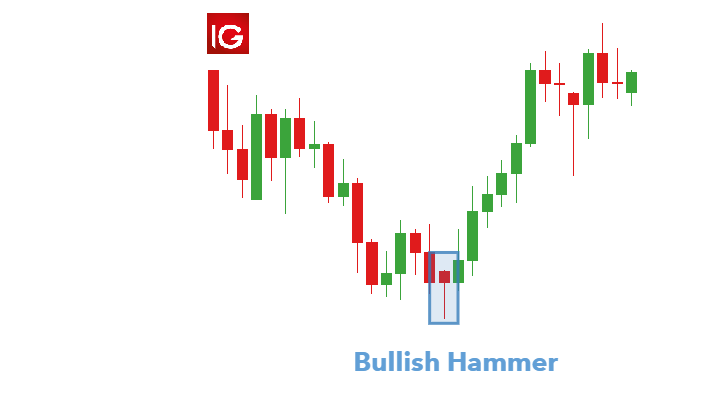
The hammer candlestick appears at the bottom of a down trend and signals a bullish reversal. The hammer candle has a small body, little to no upper wick, and a long lower wick – resembling a ‘hammer’.

The pattern indicates that the price dropped to new lows, but subsequent buying pressure forced the price to close higher, hinting at a potential reversal. The extended lower wick is indicative of the rejection of lower prices.

Hammer candlestick appearing at the bottom of a downtrend

Inverted Hammer Candlestick

The inverted hammer candlestick, like the bullish hammer, also provides a signal for a bullish reversal. The candle is, as the name suggests, an inverted hammer. The candle has a long extended upper wick, a small real body with little or no lower wick.

The candle opens at the bottom of a downtrend before the bulls push price upwards – reflected in the extended upper wick. Price does eventually return down towards the opening level but closes above the open, to provide the bullish signal. Should the buying momentum continue, this will be seen in the subsequent price action moving higher.

Inverted Hammer pattern at the bottom of a downtrend

Advantages and Limitations of the Hammer Candlestick

Hammer candles have their advantages and their limitations; therefore, traders should never rush into placing a trade as soon as the hammer candle has been identified.

Advantages

  • Reversal signal: The pattern indicates the rejection of lower prices. When found in a downtrend it could signal the end of selling pressure and begin to trade sideways or reverse to the upside.
  • Exit signal: Traders that have an existing short position, can viw the hammer candle as an indication that selling pressure is subsiding – presenting the ideal time to close out of the short position.

Limitations

  • No indication of trend: The hammer candle does not take the trend into consideration and therefore, when considered in isolation, can provide a false signal.
  • Supporting evidence: In order to enter into high probability trades, it is important for traders to look for additional information on the chart that supports the case for a reversal. Such confluence can be found by assessing whether the hammer appears near a major level of support, pivot point, significant Fibonacci level; or whether an overbought signal is produced on the CCI, RSI or stachastic indicator.

Using Hammer Candles in Technical Analysis

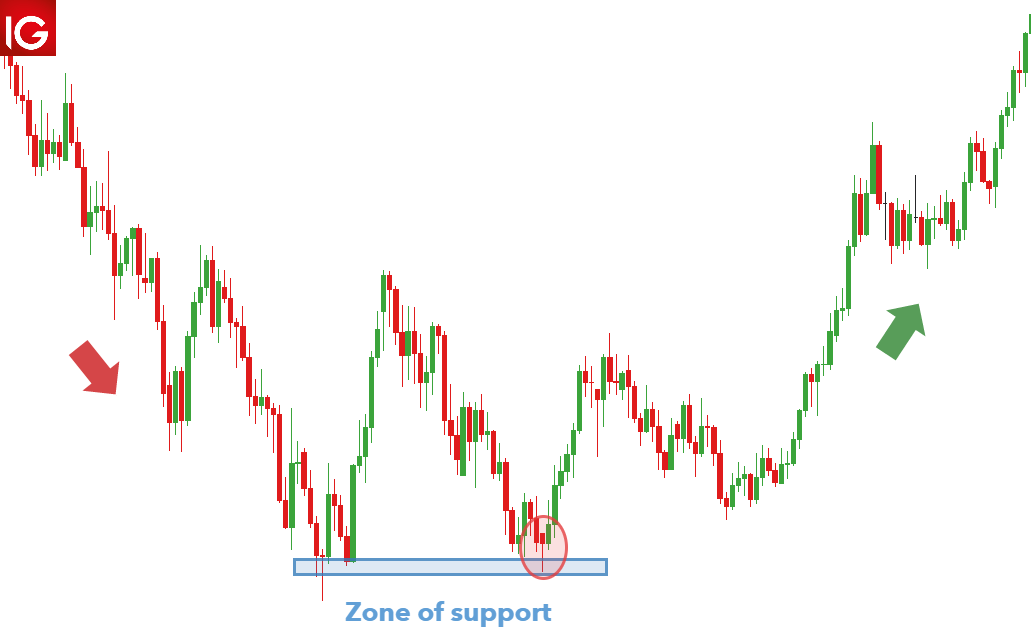
The following example of how to trade the hammer candlestick highlights the hammer candle on the weekly EUR/USD chart.

Hammer candle appearing at the base of a downtrend

Traders can make use of hammer technical analysis when deciding on entries into the market. Looking at a zoomed-out view of the above example, the chart shows how price bounced from newly created lows before reversing higher. The zone connecting the lows acts as support and provides greater conviction to the reversal signal produced by the hammer candlestick.

Stops can be placed below the zone of support while targets can coincide with recent levels of resistance – provided a positive risk to reward ratio is maintained.

hammer candle appearing at support in a downtrend EUR/USD

How to Trade Consistently Without Having the Perfect Strategy

How to Trade Consistently Without Having the Perfect Strategy

The Secrets of Consistent Trading: Talking Points

Having a consistent trading strategy can’t be understated when it comes to the process of trading. This is because uniformity leads to sensible trading decisions. But building an edge in the market has more to do with a consistent method you are comfortable with, as opposed to a perfect system that grabs 100% of the pips in a market movement.

In this article the importance of consistent trading will be covered from the type of analysis and usage of tools, to trade execution and risk management.

What is consistency in trading and why does it matter?

Consistency in trading refers to the constant/repetitive nature of an individual to a set of trading principals. This adherence allows the trader to avoid ‘over-trading’ whilst maintaining appropriate risk management. There are varying characteristics of consistent trading which include:

  • Following a trading strategy
  • Analysis
  • Avoiding over and under-trading
  • Proper risk management
  • Tracking and review of trades

Consistency in trading acts as a catalyst for successful trading because it circumvents emotional influence by the trader. Irrationality and irregularity often lead to inconsistent results as seen in the charts below.

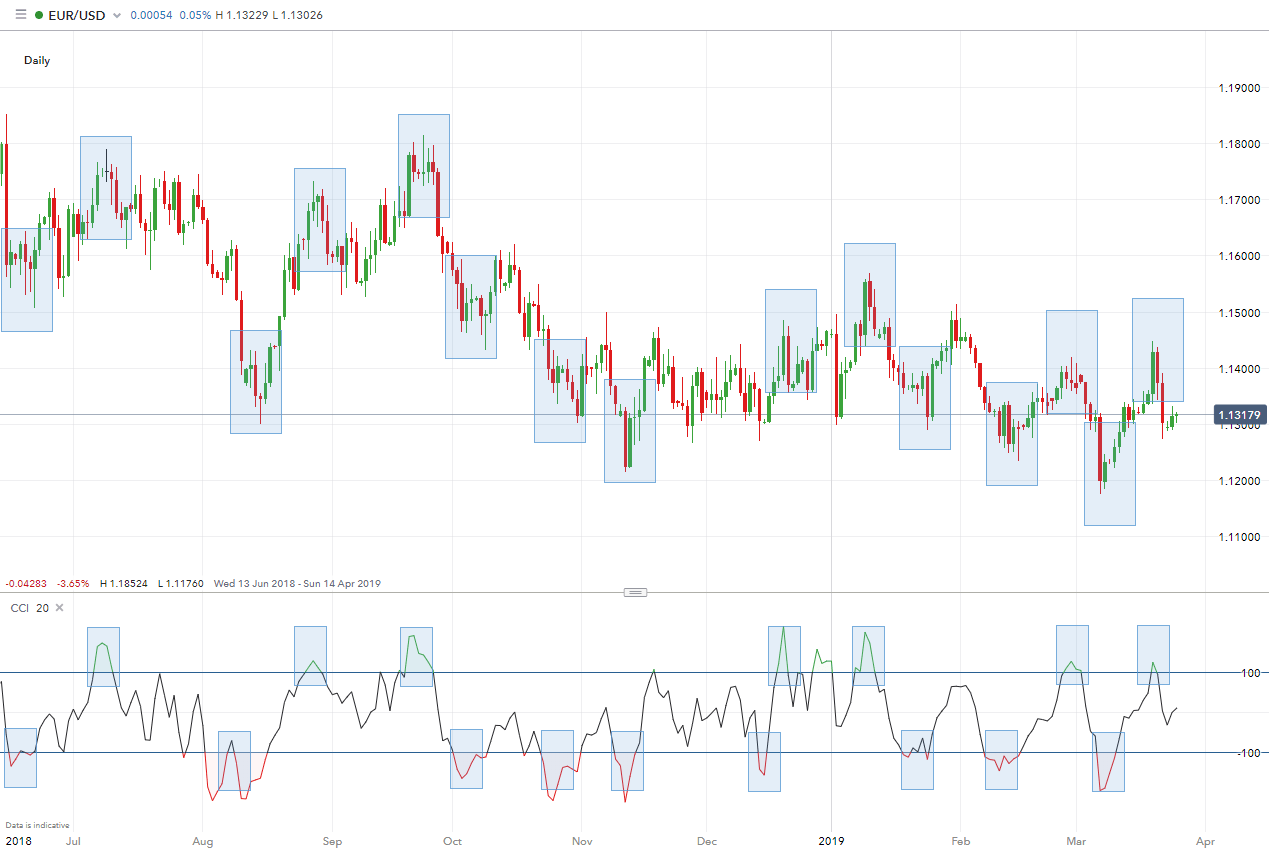
Chart one below depicts an over simplified strategy of using an RSI oscillator to time entry/exit points in a trending market. Chart two makes use of the CCI oscillator for the same market to identify entry/exit points. Chart two shows a significant increase in frequency of overbought and oversold signals – highlighted by the blue rectangles.

This straightforward comparison shows how changing strategies can alter trading decisions and consistency in trading (even with a minor change such as a different oscillator). Trading strategies are generally far more complex than the examples below, therefore deviating away from a trade strategy can result in variable results.

Chart 1: Daily EUR/USD with RSI indicator

consistent forex trading RSI

Chart 2: Daily EUR/USD with CCI indicator

consistent forex trading CCI

How to build a consistent trading strategy

There are a number of ways traders can adopt a consistent approach to trading. Planning ahead, applying risk management and journaling day to day activities and price movements are among the most important.

1. Have a trading plan– A detailed plan of attack provides the framework necessary for a trader to ‘stay on course’. There are facets to trading which a trader can control, and those they have no control over whatsoever. Following a minimalist method of analysis is one such way to stay in control and helps to avoid ‘paralysis by analysis’.

For simplicity, it’s recommended that traders stick to a few core methodologies/tools when analysing price movements. There is a plethora of ways to analyse and view the markets, with no real right or wrong way. The key is to be consistent in whichever approach is preferred.

2. Be consistent when executing trades – There are various ways to execute upon identified opportunities in the markets. For example, when trading breakouts; does the trader buy the first price above a certain level or wait for the candlestick to close first? Or, maybe a combination of the two? Any of the prior is fine, but the more important point is that there is consistency in trade.

3. Risk management – Risk management is the single most important aspect to trading success and where many traders fail. It must be approached consistently if a trader expects to achieve consistent results. Trading is about probabilities: win percentage x win/loss ratio. With that in mind, if traders do not have a consistent risk-per-trade amount, those probabilities will not matter as winners and losers will be on varying amounts of risk.

For example, if a trader makes 2% on one trade, loses 4% on the next, then makes 1% on another, this will result in uneven (and in this case, negative) results – even though two out of three trades were profitable. Risk/reward (stop/target) objectives need to be consistently skewed in the favour of the trader.

4. Keep a journal – An excellent way to ensure consistency is by keeping a trading journal, whether it be daily or weekly. Monitoring activity and factors that are influencing decision-making allows traders to remain consistent in their trading strategy. Traders should review trades periodically by overlaying previous trades with the trading plan for intended correlation.

EUR/USD and GBP/USD Rallies Fuelled by Ongoing US Dollar Weakness

EUR/USD and GBP/USD Rallies Fuelled by Ongoing US Dollar Weakness

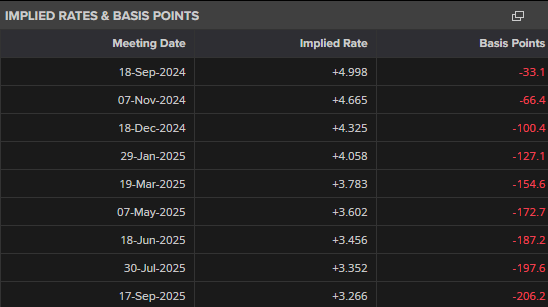
The minutes of the last FOMC meeting are released later in today’s session and will show a more detailed picture of why the Fed decided to keep rates unchanged at 5.25%-5.5%. Since the July meeting, a string of data releases has pointed to growing weakness in the US economy, suggesting that the Fed will start to trim interest rates in September. Financial markets currently price in a 67.5% chance of a 25-basis point and a 32.5% chance of a 50-basis cut.

With today’s FOMC minutes already priced into the market, trader’s attention will turn to chair Powell’s appearance at this year’s Jackson Hole Symposium on Friday. Chair Powell is expected to acknowledge that conditions, and data, are now right for a series of interest rate cuts to start in September. Markets will be keen to see if Powell agrees with current market pricing of 100 basis points of cuts this year, or if he pushes back against current assumptions. With only three FOMC meetings left this year, 100 basis points of cuts would require a 50bp move at one of these meetings.

A screenshot of a graph  Description automatically generated

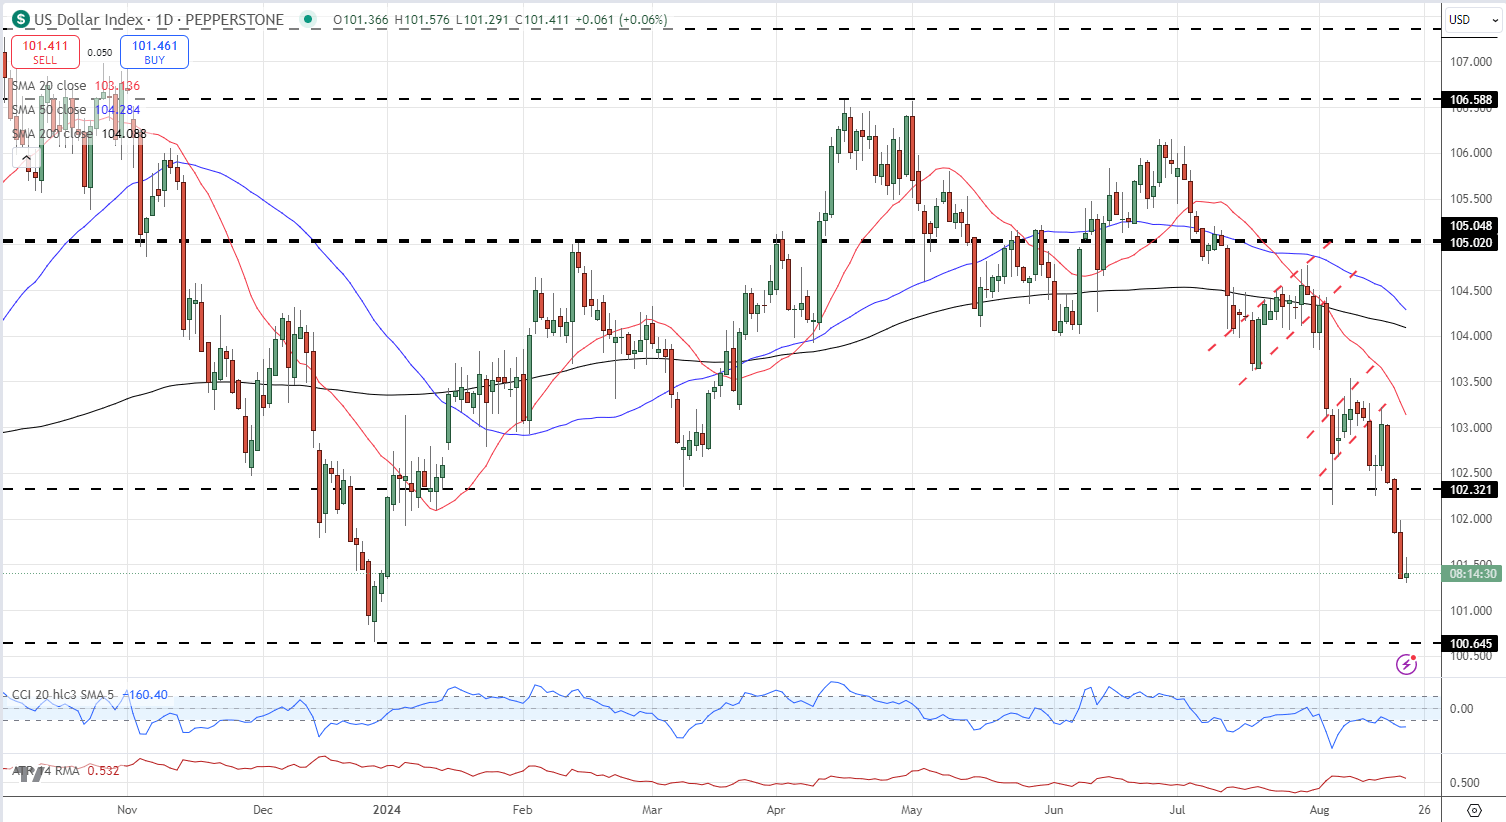
The US dollar index (DXY) has moved sharply lower over the last two months as traders price in a more dovish Fed. The technical outlook for DXY remains negative with two bearish flag formations on the daily chart keeping downward pressure on the dollar.

US Dollar Index (DXY) Daily Chart

A graph with lines and points  Description automatically generated with medium confidence

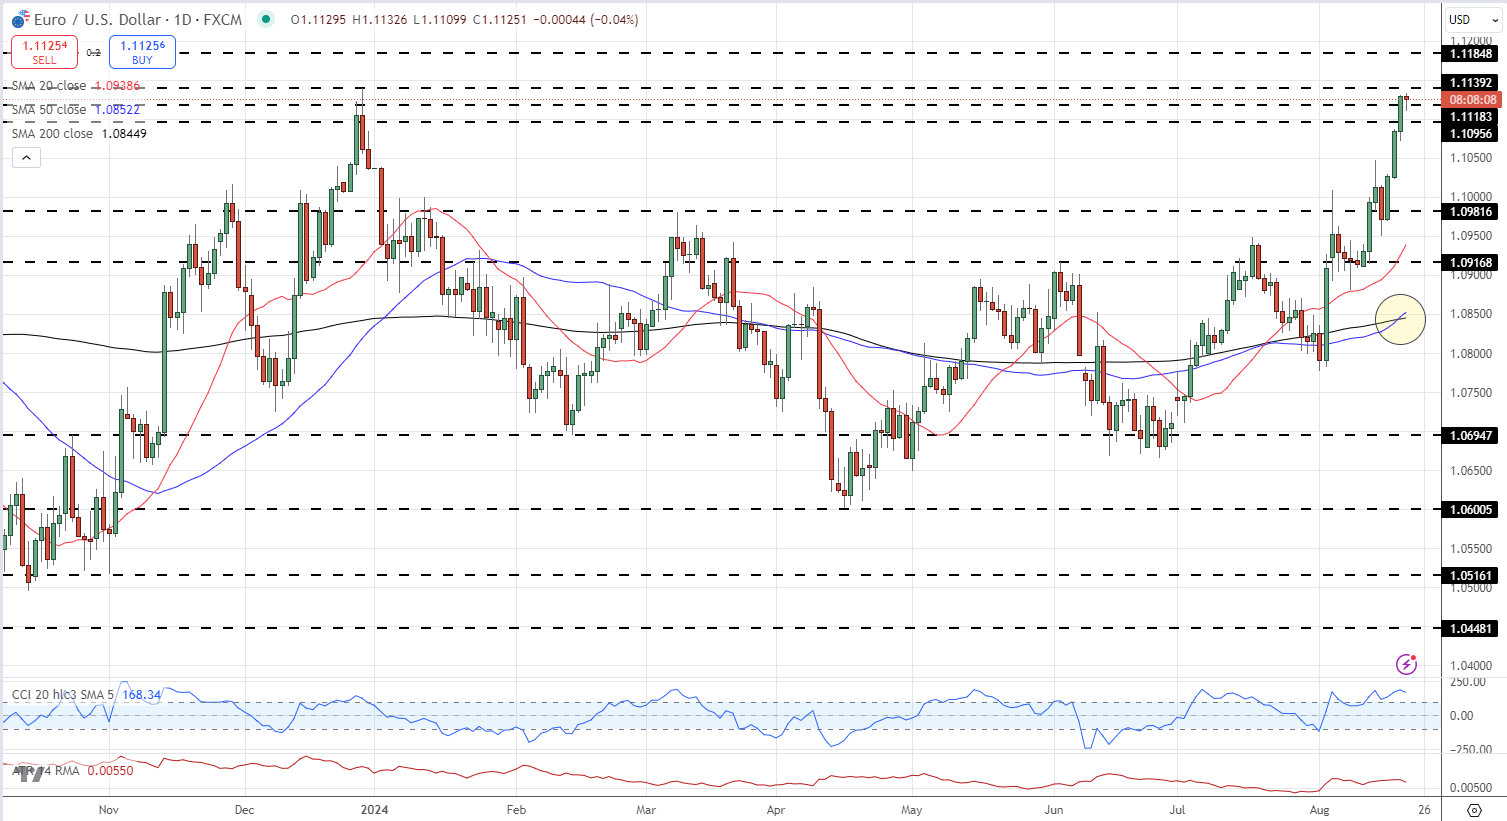
The Euro and Sterling have benefited from this weak dollar backdrop with EUR/USD and GBP/USD making fresh multi-month highs yesterday.

EUR/USD has made a strong recovery after posting a five-month low of 1.0600 in mid-April and Monday’s bullish 50-day/200-day simple moving average crossover suggests that the pair are likely to move higher in the coming weeks.

EUR/USD Daily Chart

A graph of stock market  Description automatically generated

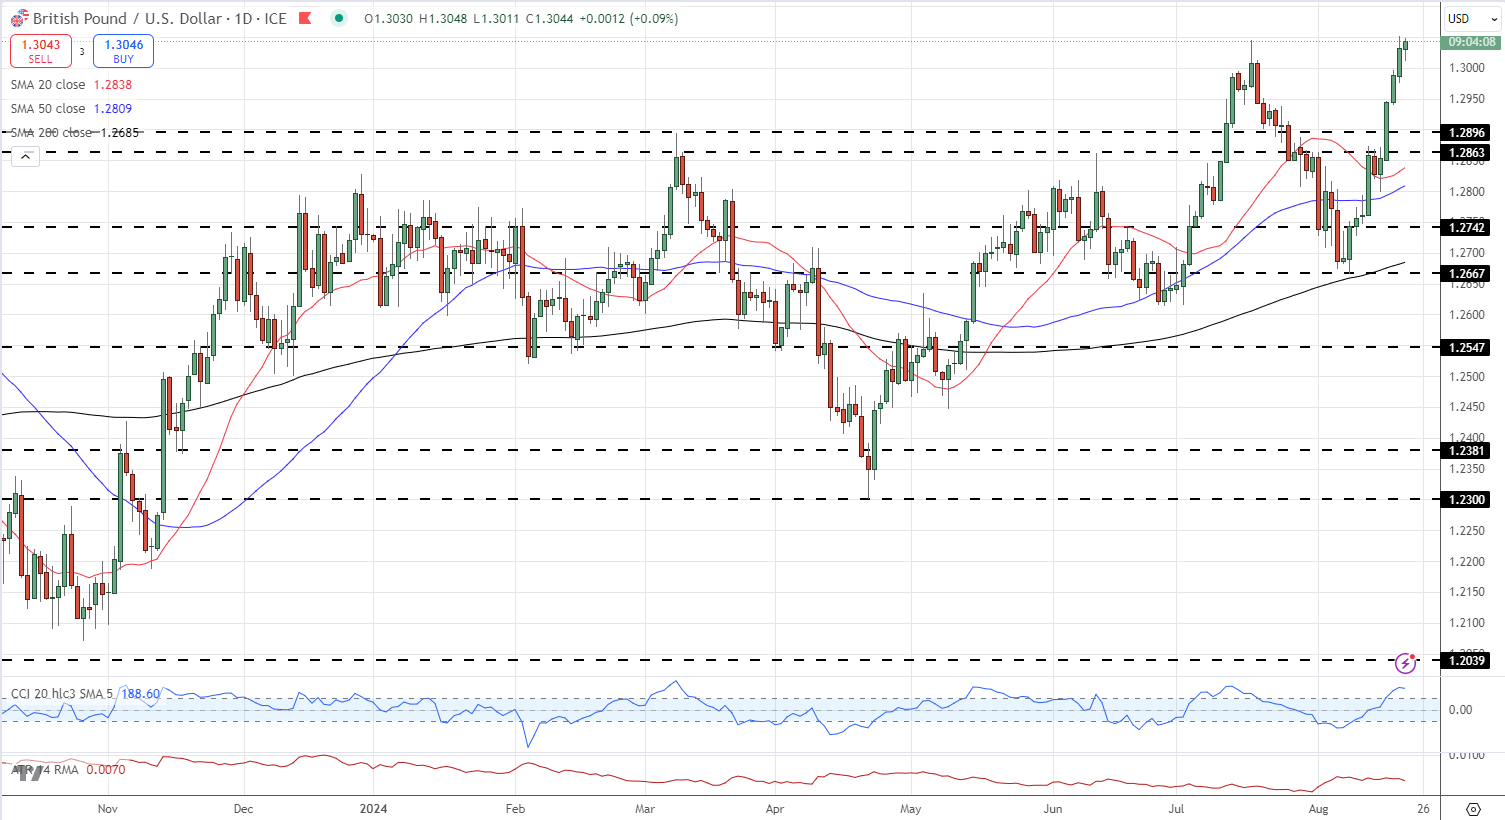
The GBP/USD daily chart also looks positive with an unbroken series of higher lows and higher highs made since late-April. While Sterling has strengthened in its own right recently, further gains in the pair will be dictated by the US dollar outlook.

GBP/USD Daily Chart

A graph of stock market  Description automatically generated


How to Set Up Effective Trading Goals

How to Set Up Effective Trading Goals

Setting trading goals can be a useful endeavor to help you navigate the markets, but some goals are more useful to set than others. In this piece, we’ll look at the right and wrong type of forex trading goals to aim for, why the right goals make sense in context with your trading plan, and how to track the progress of your goals.

Watch the video above for our analyst Paul Robinson’s account on best practices for goal setting. He discusses why making money may not be the be-all-end-all, the danger of meaningless goals in a cyclical market, and how to use goals to refine discipline and consistency.

Why Set Trading Goals?

It is important to set trading goals for two main reasons – to help you stick to your trading plan and to allow you to trade more consistently. For those new to trading, this will mean setting a process-orientated goal rather than one focused on outcomes. For example, goals based on following strict risk management and sound technical analysis, and even a daily routine involving exercise and a balanced diet, will encourage more consistent trading.

What Your Trading Goals Shouldn’t Be

By contrast, setting a monetary goal is not a useful trading goal. This is because markets are dynamic and don’t provide opportunities in linear fashion; some periods of trading are good and will suit your trading style while other periods won’t. Protecting the trading capital you have is more valuable than setting arbitrary financial targets, since traders have no control over the timing of favorable market conditions.

Other common goals which are hollow are those that are not specific enough or cannot be easily measured. Examples include ‘be more disciplined’, ‘be more consistent’, ‘trade this or that strategy better’, and so on. How exactly do you achieve or measure those? Overarching goals such as these are better broken down into smaller, more process oriented goals that are more achievable.

The Effectiveness of Process-Oriented Goals

As opposed to outcome-oriented goals, process-oriented goals can be useful to help you follow your trading plan. Creating goals that support your plan can help keep you focus on the details that lead to good trades.

One way to do this is to think of following the process as ‘If, then…’ statements – ‘If this [event] happens, then I will do this.’ For example – ‘If EUR/USD pulls back to a certain price level and posts a key-reversal bar, then I will enter long’. It could be any number of criteria depending on your trading style, but the point is to bring attention to doing the right thing according to your plan.

If you follow your rules, then regardless of the outcome – win or lose – it was a successful trade. If you have an edge with proper risk management rules (another set of rules/goals), then you give yourself a chance at profitability over time.

One shouldn’t think about profitable trade as ‘good’ trades, and unprofitable as ‘bad’ trades. You can take a ‘good’ trade and it still be a loser (as many will be), and a ‘bad’ trade and make money. Keep in mind, poor behavior which leads to a profitable outcome is negative reinforcement, and conversely the same can be said about good behavior being positive reinforcement. You want to make sure you are focused on the latter.

Goal Tracking and Measuring Your Progress

Goal tracking and measuring your progress are key to ensure your strategy is working and to keep you accountable. One powerful way to make sure you are trading in accordance with your plan, is to use a trading checklist and a trading journal. This not only keeps you focused on making proper trades, but also highlights your weakness, areas you need to work on. Those areas you need to be worked on can become new goals on which to focus.

For example, maybe you are having difficulty with sticking to your stop-loss or target objectives. This often stems from too aggressive of a position size. The simple fix here is to reduce the risk-per-trade so that you aren’t making emotional decisions because your P&L swings are too big.

One idea is to create a scorecard for each trade, where you allot a certain number of points per facet of the trade and run a tally to see how effectively you are sticking to the plan. This will highlight areas of weakness and provide clarity on what you need to work on.

All-in-all, by emphasizing goals geared towards ‘doing the right thing’ you will best set yourself up towards achieving long-term profitability. There are certainly no guarantees, but if you are just ‘slinging it around’ without structure and proper goals, any short-term success achieved isn’t going to be sustainable.

Trading Goals: A Summary

In summary, process-oriented goals will be more effective than outcome-oriented goals. Setting such goals can help put you in the right mindset to trade to the best of your ability, rather than setting a monetary goal for example, which would only serve to pressure you into trading too often, or trading recklessly. Highlighting process over outcome gives you the best chance for financial success in the long-term.

You should always have a trading plan that covers how you will enter and exit trades, how your money will be managed, the markets traded, and your risk parameters.

And keep it simple. For example, selecting a few effective trading indicators rather than trying to apply all of them will result in better focus. Simplifying your technical analysis approach can cut out a lot of noise and contribute to becoming a better trader.

Having trading goals that compliment a solid strategy will help you build confidence in your trading. Download our free guide for more information about how to build confidence in your trading, and be sure to check out our range of additional guides to help you in your trading journey, whatever your skill level.

Nikkei 225 Boosted by Strong Dow and Nasdaq 100​​​

Nikkei 225 Boosted by Strong Dow and Nasdaq 100​​​

​​​Nikkei 225 regains Monday’s sell-off

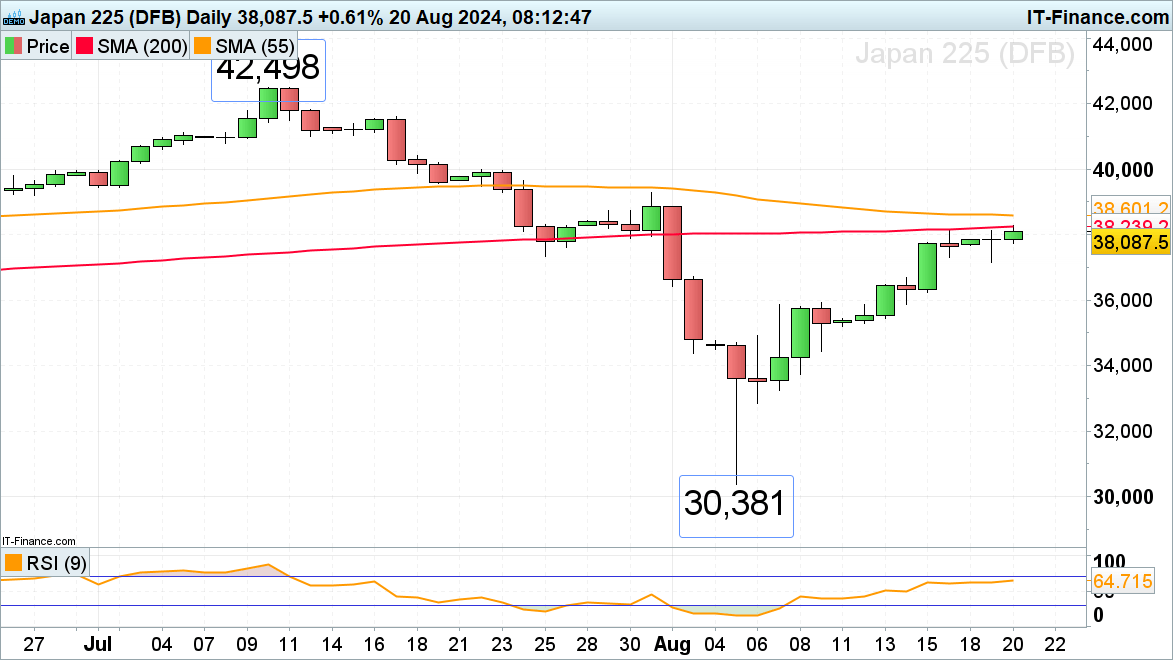
​Following profit-taking on Monday, the Nikkei 225 regained its losses on Tuesday morning, helped by another strong showing of US indices. ​Last week’s high and the 200-day simple moving average (SMA) at 38,152-to-38,239 are currently being tested, slightly above which the 55-day simple moving average (SMA) can be spotted at 38,601. If overcome, the late July high at 39,280 would be next in line.

​The short-term bullish bias is likely to remain in play while Monday’s low at 37,163 underpins.

Nikkei 225 Daily Chart

​Dow Jones Industrial Average surges ahead

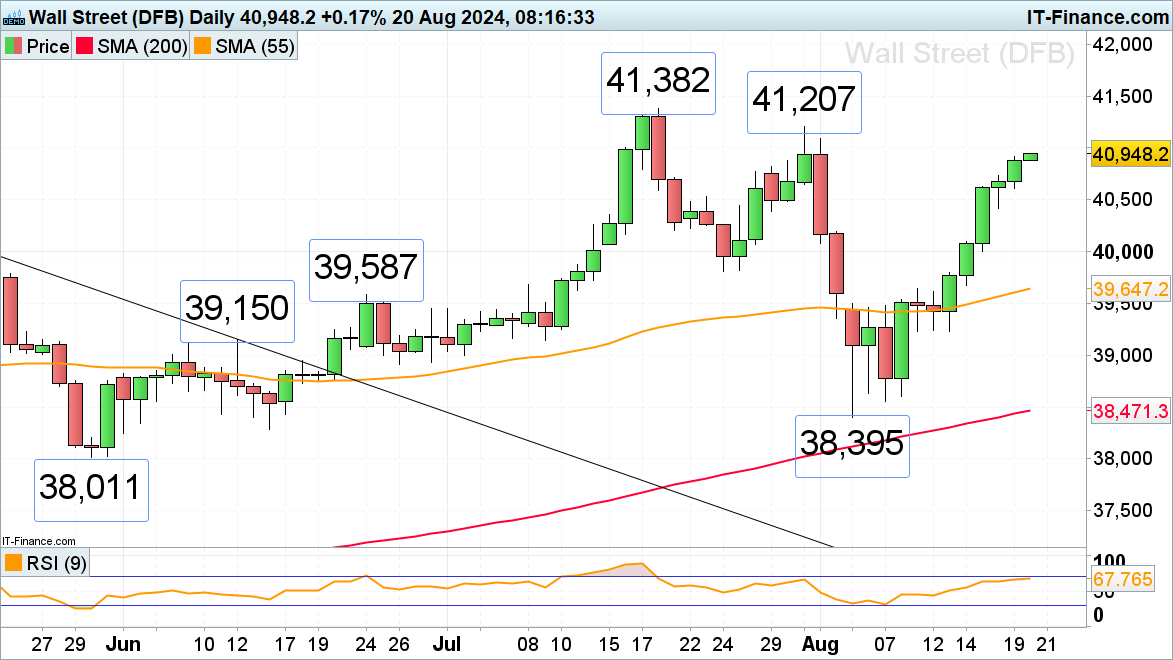
​There seems to be no stopping the Dow from it being on track for its sixth consecutive day of gains whilst approaching its late July high at 41,207. Slightly further up sits the Dow’s all-time high at 41,382.

​Immediate upside pressure should be maintained while Monday’s low at 40,606 holds.

Dow Jones Daily Chart

​Nasdaq 100 continues its advance

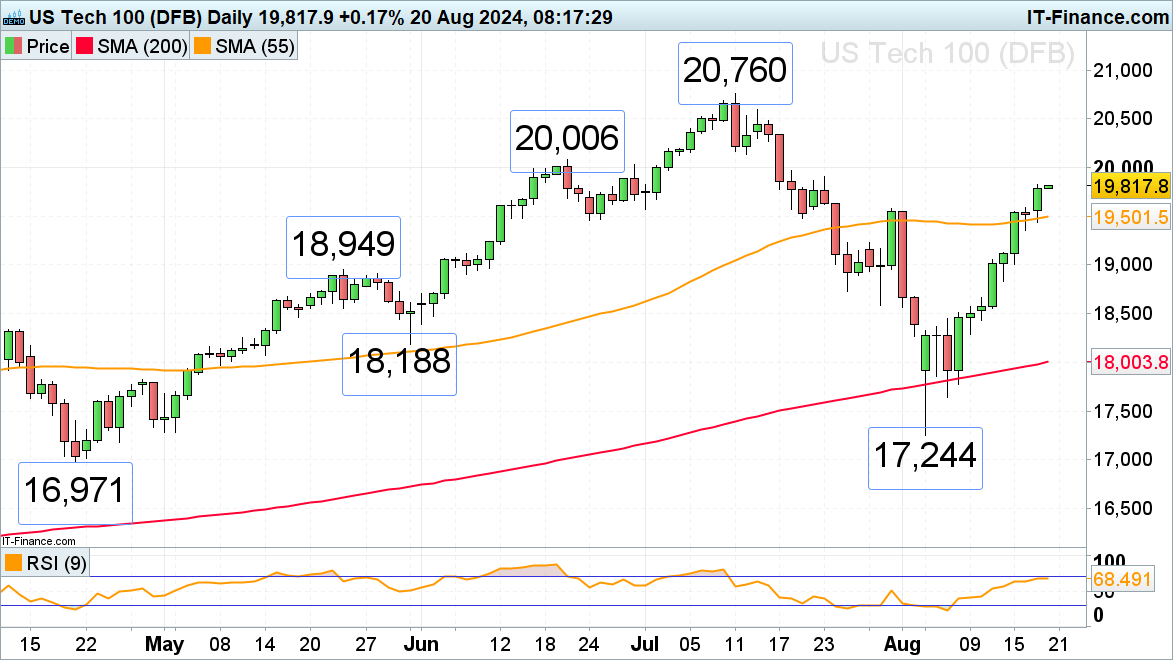
​The Nasdaq 100 has not only risen above its 55-day simple moving average (SMA) at 19,501 but, more importantly, also above its late July peak at 19,577 with the late June high at 20,006 representing its next upside target.

Previous resistance, because of inverse polarity, should now act as support, that is to say the 19,577-to-19,501 area.

Nasdaq 100 Daily Chart

EUR/USD holds near YTD high of 1.1050 amid better mood, weak US Dollar

EUR/USD holds near YTD high of 1.1050 amid better mood, weak US Dollar

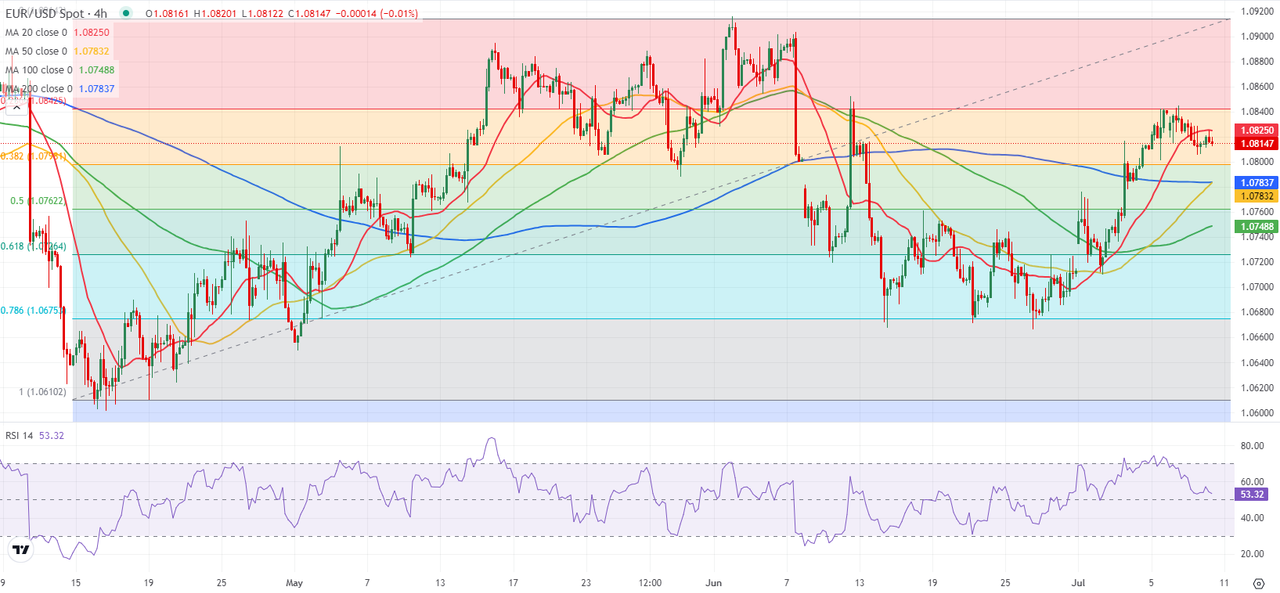
EUR/USD is sitting at year-to-date (YTH) highs of 1.1050 in the European session on Monday. The softer US Dollar, amid heightening Fed rate cut expectations, upbeat risk tone and USD/JPY sell-off, underpins the pair. The focus stays on Fedspeak, in the face of a data-sparse calendar.

The Relative Strength Index (RSI) indicator on the 4-hour chart started to rise toward 60 after falling to 50 on Thursday, reflecting sellers’ hesitancy. On the upside, 1.1000 (psychological level, static level) aligns as immediate resistance ahead of 1.1050-1.1060 (static level) and 1.1100 (psychological level, static level).

Supports could be seen at 1.0960 (static level), 1.0940 (static level) and 1.0900 (psychological level, static level).

EUR/USD regains its traction and rises toward 1.1000 in the European session on Friday after snapping a three-day winning streak on Thursday.

The upbeat macroeconomic data releases from the US provided a boost to the US Dollar (USD) and caused EUR/USD to turn south. The US Department of Labor reported that the weekly Initial Jobless Claims declined by 7,000 to 227,000 in the week ending August 9. Other data from the US showed that Retail Sales rose 1% on a monthly basis in July, beating the market expectation for an increase of 0.3%.

Early Friday, the improving risk mood makes it difficult for the USD to build on Thursday’s gains and helps EUR/USD stretch higher.

The US economic docket will feature Housing Starts and Building Permits data for July. Additionally, the University of Michigan will release the preliminary Consumer Sentiment Index data for August. The market reaction to these data is likely to remain short-lived.

Meanwhile, US stock index futures are up between 0.2% and 0.3% in the European session. In case Wall Street’s main indexes open in positive territory and continue to push higher ahead of the weekend, the USD could stay on the back foot and open the door for another leg higher in the pair.

IG Retail Sentiment Report: AUD/USD, EUR/USD, GBP/USD as USD Weakness Returns

IG Retail Sentiment Report: AUD/USD, EUR/USD, GBP/USD as USD Weakness Returns

Downward Dollar Gains Momentum, Testing the Monthly Low

The US dollar has been on a downward trajectory since early July, declining as nervousness in the job market surfaced via a rising unemployment rate. This, coupled with marginally lower inflation data has contributed to an overwhelming view that the Fed will look to September to get its rate cutting cycle underway, possibly using Jackson Hole as the platform to communicate such a preference.

Markets anticipate just under 100 basis points (bps) worth of rate cuts are likely to materialize before the end of the year which may be complicated by the US election in November. In an attempt to demonstrate the central bank’s independence, there is a risk that the Federal Open Market Committee (FOMC) may opt to keep rates unchanged in November, leaving just September and December as live meetings. Risk appetite continues to recover after the 5th of August volatility spike, warranting a closer look at major currency pairs and the Aussie dollar in particular.

AUD/USD:

Retail trader data indicates that 53.75% of traders hold net-long positions, with a long-to-short ratio of 1.16 to 1.

Daily Sentiment Change:

  • Net-long traders: 2.65% increase
  • Net-short traders: 4.65% increase

Weekly Sentiment Changes:

  • Net-long traders: 31.03% decrease
  • Net-short traders: 65.32% increase

Our analysis typically adopts a contrarian stance to crowd sentiment. The current net-long trader position suggests potential continued decline in AUD/USD prices. However, the reduction in net-long positions compared to yesterday and last week indicates a possible reversal of the current downward trend, despite the overall net-long trader stance.

image1.png

EUR/USD:

Retail trader data shows 29.24% of traders in net-long positions, with a short-to-long ratio of 2.42 to 1.

Daily Sentiment Change:

  • Net-long traders: 2.91% increase
  • Net-short traders: 0.09% increase

Weekly Sentiment Changes:

How I Use RSI

How I Use RSI

The Relative Strength Index (RSI) is a simple oscillator that is used to measure speed or inertia of a given price move. The objective is to identify times when market may be in an overbought / oversold condition. While the concept is quite simple, the indicator is often times the most miss-used and under-utilized oscillator.

Before we begin, it’s worth nothing that all oscillators are backwards looking- that is they are giving you a description of historical price action – not forward looking. It is with this humble regard that we approach momentum studies and while there is much we can derive from this indicator, never base a trade solely on one technical factor. Rather this should be used as a tool within a broader technical approach to price action. Now, lets dive in.

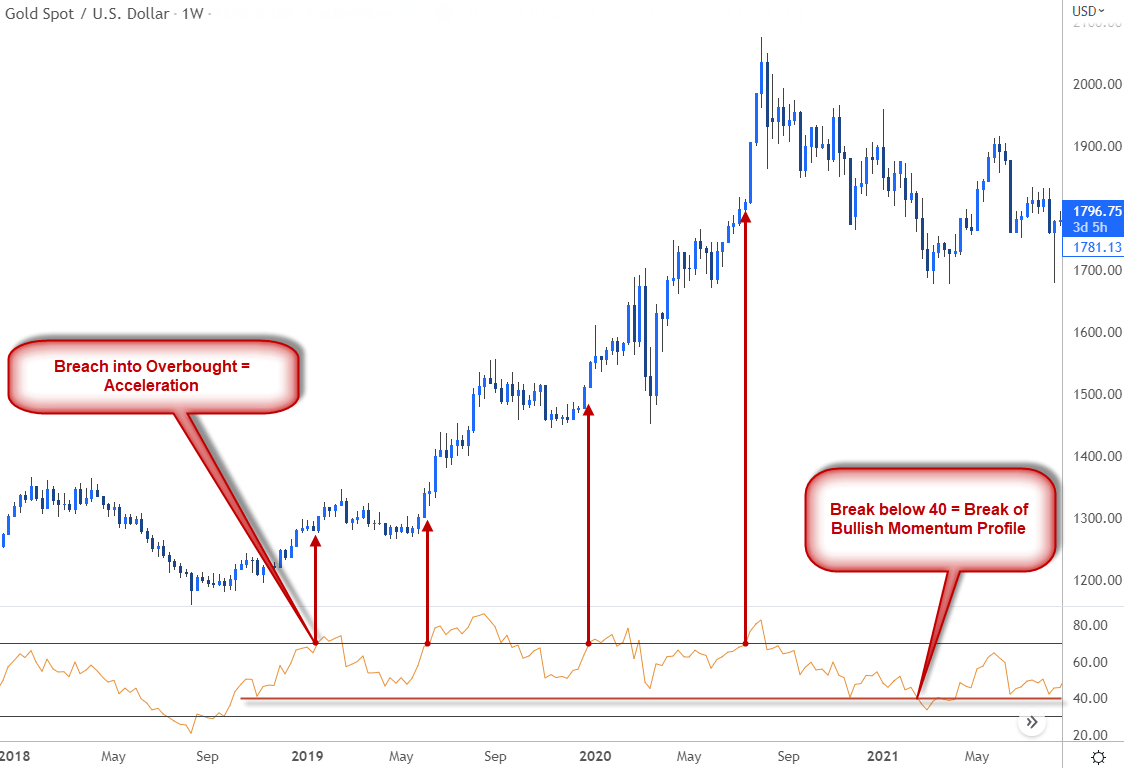
Everyone has heard of a market that is overbought or oversold – typically an RSI reading above 70 is considered to be overbought and below 30, oversold. But what does this mean for us from a trading standpoint? The misconception is that an overbought / oversold reading IS in itself the signal is one of the first major pit-falls of this indicator. A simple historical study of price action shows that often times the market has the most thrust when markets are trading above 70 in RSI and within a broader uptrend. Likewise, the largest declines can often be seen after momentum has broken below 30 within the confines of downtrends.

Gold Price Chart – XAU/USD Weekly

image1.png

The key is to remember that RSI has no time value – markets can remain in an overbought / oversold condition for an indefinite time period. In fact, the sharpest part of the rally or decline is often times after momentum has broken into the extreme. The signal, that exhaustion may be ahead is the return from the extreme- IE back the move back above 30 / back below 70. Recognizing this simple fact can help you avoid trying to call the high or fade something just because of a stretch in to momentum.

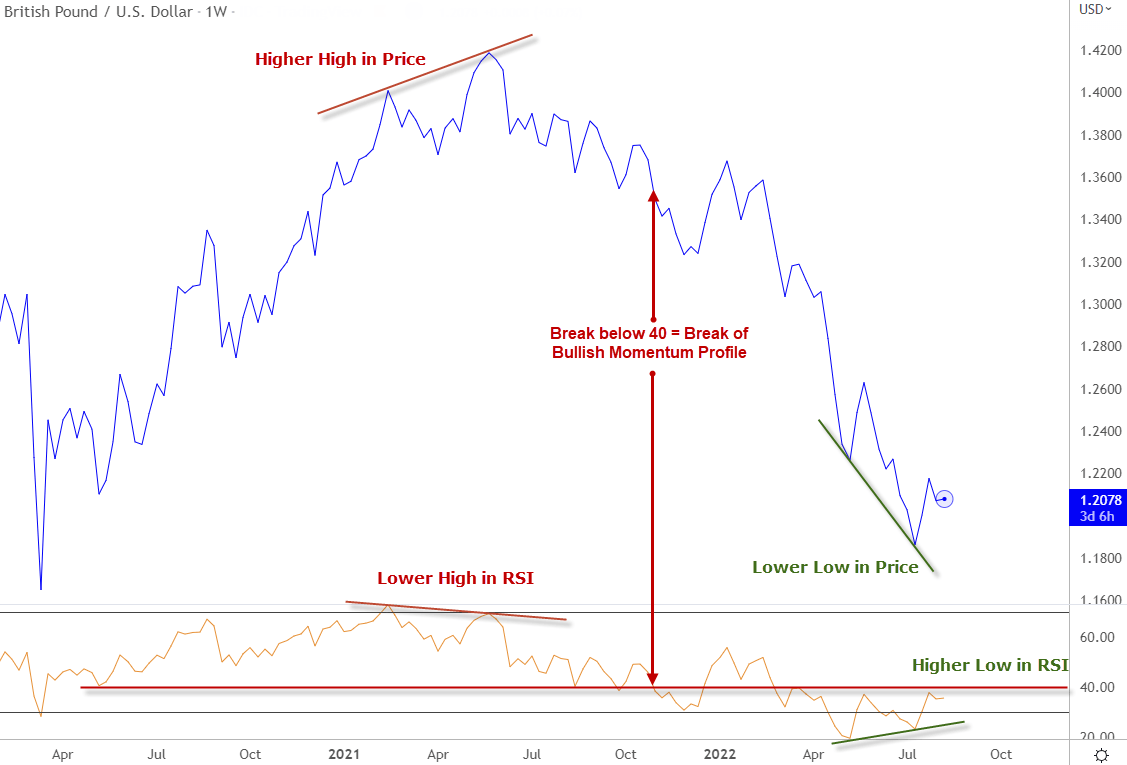
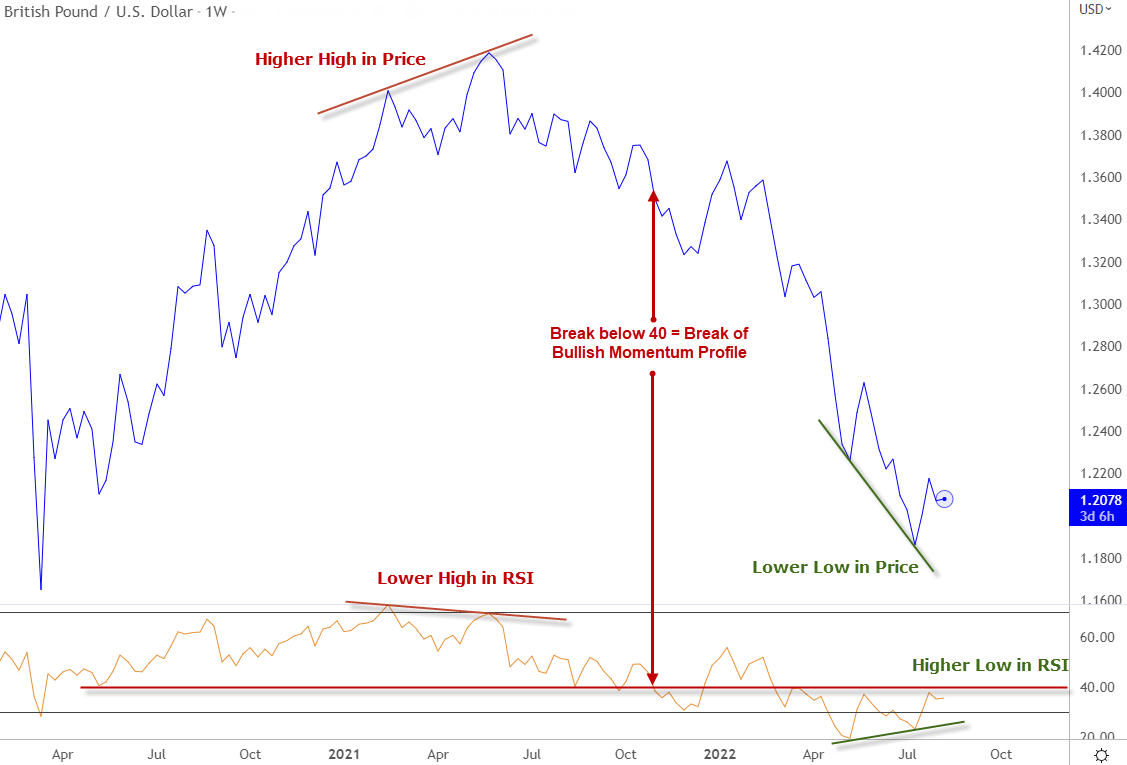
Another aspect of RSI that is often overlooked is what I call the momentum profile. A basic rule of thumb is that in strong bull-markets, RSI should typically hold above 40 – likewise in a bearish trends the oscillator will tend to find resistance at ahead of 60. These subtle tendencies can be very useful in assessing the broader directional bias from a moment standpoint and whether a move is corrective within a broader trend or a larger reversal.

Sterling Price Chart – GBP/USD Weekly

image2.png

A note on divergence – Divergence is a phenomena where a new extremes in price are not reflected in the oscillator. This tendency can often times help identity market turns / reversals. However its important to note that it is the candle close that matters – not the wicks (high / low). An easy way to help filter out the noise is to simply consider divergences on a line chart, taking account only the period close. The Sterling chart above illustrates both bullish / bearish divergence signals and shifts in the broader momentum profile. It’s worth noting that the closer the divergence reference points are to 50- the stronger the signal. So in this example, the bearish divergence seen in 2021 would be interpreted as a stronger signal than that of this year’s rebound in GBP/USD.

Bottom line : All oscillators should be used in as a compliment to a broader trade strategy and there should never be an over-reliance on any one indicator other than price. That said, momentum can be an extremely useful tool when used properly and offers much more insight than simple overbought / oversold readings within the confines of a given trend. Forget the cookie-cutter explanations – knowing how a given indicator behaves to real-life price action is the key to effectively utilizing them as part of you trading strategy.

​​​Nvidia’s Q2 Earnings Preview: The Fight to Stay on Top​​​

​​​Nvidia’s Q2 Earnings Preview: The Fight to Stay on Top​​​

​Heading into Nvidia’s Q2 earnings results, expectations are high for the graphics chip maker thanks to its leadership position in several key secular growth markets.

​Over the past year, Nvidia has seen tremendous demand growth across its various end markets, led by data centres and gaming. In data centres, adoption of AI and machine learning has fuelled robust sales of Nvidia’s specialized GPUs and networking products. The company has also benefited as more enterprises move workloads to the cloud. Meanwhile, Nvidia’s gaming segment continues to see strong tailwinds thanks to the rise of eSports, game streaming services, and steady launches of blockbuster titles optimized for Nvidia hardware.

​Nvidia’s data centre segment, which includes sales of GPUs, networking gear, and AI software, is projected to increase further as major hyperscale customers like Amazon AWS, Microsoft Azure, and Alphabet GCP are rapidly adopting Nvidia chips to power AI workloads.

​Ongoing strong demand for the latest Nvidia GPUs for gaming and creative applications is expected to remain a key catalyst in revenue growth.

​Nvidia’s automotive computing platforms are being adopted by more electric and autonomous vehicle makers, creating further demand for the company’s chips. Additionally, the company’s Omniverse 3D simulation platform over the past year saw triple-digit customer growth, signalling future enterprise software upside.

Potential challenges

​Nvidia faces some potential headwinds that could impact the upcoming earnings report such as supply chain constraints which may limit the upside. Though improving, foundry and component shortages could restrict Nvidia from fully meeting elevated demand. Any indication that supply issues are not abating could disappoint investors.

​Demand slowdown in the PC market due to tough macroeconomic conditions may weaken graphics segment performance. This would dampen overall earnings growth.

​Potential macroeconomic uncertainty may curb business spending should economic conditions deteriorate. This would have an outsized impact on Nvidia’s data centre and enterprise segments.

​Increasing competition from the likes of AMD and Intel, who have also heavily been investing in AI-focused chips, and big tech and automotive companies developing their own AI chips could potentially reduce demand for Nvidia’s offerings.

​Despite these risks, Wall Street remains overwhelmingly bullish on Nvidia stock heading into the Q2 earnings result. Investors are focused on Nvidia’s long-term potential in AI, high-performance computing, autonomous vehicles, and the metaverse. Execution against these opportunities is likely to drive share price momentum

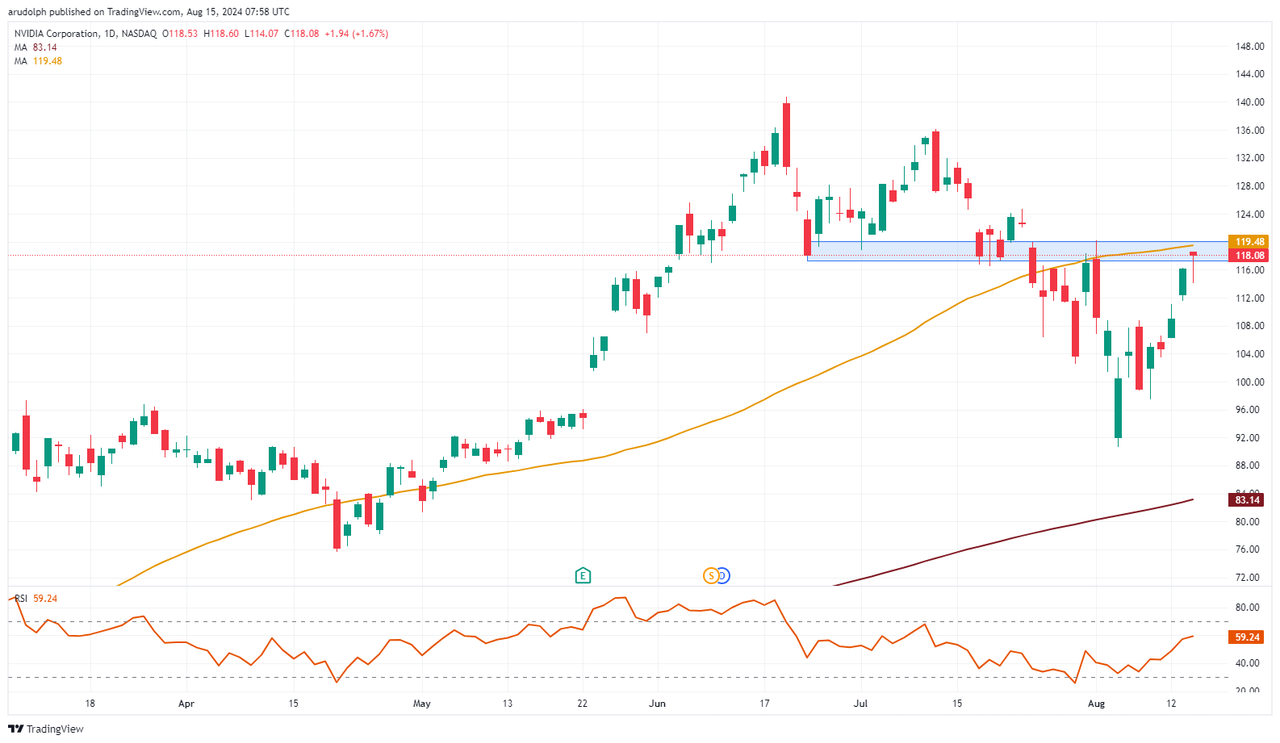
​The Nvidia share price, up over 145% year-to-date despite its June-to-August 35% drop, is flirting with its $118.04-to-$120.16 resistance zone, made up of the late June low and early August high.

​Were it to be exceeded on a weekly chart closing basis on Friday, the way would be open for its June record high at $140.76 to be back in sight.

​Nvidia Weekly Chart

​This bullish view will remain intact while the early August low at $90.69 holds ona weekly chart closing basis.

​For a medium-term top to be formed, the Nvidia share price would have to fall through its $90.69 early August low, in which case a further decline to the 200-day simple moving average (SMA) at $83.14 and the April trough at $75.61 may be on the cards.

​Nvidia Daily Chart