EUR/USD trades modestly flat above 1.0900 ahead of German ZEW data

EUR/USD trades modestly flat above 1.0900 ahead of German ZEW data

EUR/USD trades flat above 1.0900 in the European session on Tuesday. The pair treads water amid a broad US Dollar consolidation. Traders take a breather ahead of the German ZEW data, US Producer Price Index release and Fedspeak.

Further north, EUR/USD is expected to challenge the August high of 1.1008 (August 5) before reaching the December 2023 top of 1.1139 (December 28).

On the downside, the pair’s next target is the 200-day SMA at 1.0834, ahead of the weekly low of 1.0777 (August 1) and the June low of 1.0666 (June 26), all of which are before the May low of 1.0649 (May 1).

Looking at the larger picture, the pair’s upward bias should continue if it trades above the critical 200-day SMA.

So far, the four-hour chart indicates the continuation of the range-bound theme for the time being. The initial resistance level is 1.1008, ahead of 1.1132. On the other side, immediate contention is at 1.0881, prior to the 200-SMA of 1.0847, and followed by 1.0777. The relative strength index (RSI) rose above 57.

After many days of losses, EUR/USD finally managed to regain some balance and advance to the 1.0940 region at the beginning of the week, ending the session with decent gains amidst the generalized flat-lined mood in the broader FX galaxy.

Across the road, the Greenback traded in a vacillating fashion in the low-103.00s when tracked by the US Dollar Index (DXY), always following the investors’ wide cautious view ahead of the publication of key US fundamentals later in the week.

That said, upcoming US inflation figures tracked by the CPI on Wednesday and Retail Sales due on Thursday should give markets an idea of the Fed’s intentions to start trimming its interest rates in September, and maybe by how much. In addition, those readings could also shed further light on how the US economy is faring and, most importantly, if recent recession concerns are well justified.

On a more local perspective, the Economic Sentiment in both Germany and the broader Euroland is expected to recede further in the current month, mirroring the loss of momentum mainly in German economic activity as well as in key sectors in the euro bloc.

While there is still radio silence from the ECB, Fed rate setters are also expected to voice their views as the September gathering gets closer. Over the weekend, FOMC Governor Michelle Bowman moderated her normally hawkish tone, noting “welcome” improvements in inflation in recent months. However, she noted that inflation remains “uncomfortably above” the central bank’s 2% objective and is still vulnerable to upward pressure.

Back to a potential rate cut by the Fed in September and the USD, market expectations for a 50 bps reduction lost further traction and hovered around 48%, according to CME Group’s FedWatch Tool. It is worth recalling that the probability of such a scenario was around 70% last week.

If the Fed proceeds with more significant rate cuts, size-wise, the policy gap between the Fed and the ECB could narrow in the medium-to-long term, potentially underpinning some sort of rebound in EUR/USD.

However, in the longer run, the US economy is expected to outperform its European counterpart, suggesting that any weakness in the USD should be seen as merely temporary.

Alibaba Stock Price Faces Headwinds Ahead of Earnings

Alibaba Stock Price Faces Headwinds Ahead of Earnings

China slowdown weighs on Alibaba

​Alibaba reports earnings on 15 August. It is expected to see earnings per share rise to $2.12 from $1.41 in the previous quarter, while revenue is forecast to rise to $34.71 billion, from $30.92 billion in the final quarter of FY 2024.

​China’s economic growth has been sluggish, with GDP rising just 4.7% in the quarter ending in June, down from 5.3% in the previous quarter. This slowdown is due to a downturn in the real estate market and a slow recovery from COVID-19 lockdowns that ended over a year ago. Moreover, consumer spending and domestic consumption remain weak, with retail sales falling to an 18-month low due to deflation.

​Competitors nibbling at Alibaba’s heels

​Alibaba’s core Taobao and Tmall online marketplaces saw revenue growth of just 4% year-on-year in Q4 FY’24, as the company faces mounting competition from new e-commerce players like PDD, the owner of Pinduoduo and Temu. Chinese consumers are becoming more value-conscious due to the weak economy, benefiting these discount e-commerce platforms.

​Slowdown in cloud computing hits revenue growth

​Alibaba’s cloud computing business has also seen growth cool off considerably, with revenue rising by only 3% in the most recent quarter. The slowdown is attributed to easing demand for computing power related to remote work, remote education, and video streaming following the COVID-19 lockdowns.

​Lowly valuation pricing in a gloomy future?

​Despite the headwinds, Alibaba’s valuation appears compelling at under 10x forward earnings, compared to Amazon’s 42x. The company has also been doubling down on share repurchases and plans to increase merchant fees. However, the uncertain macroeconomic environment and mounting competition pose risks to Alibaba’s future performance.

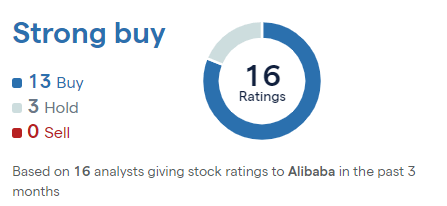
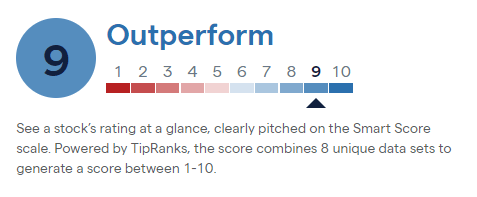
​Despite the low valuation, Alibaba has an ‘outperform’ rating on the IG platform, utilising data from TipRanks:

​BABA TR

​Source: TipRanks/IG

​Meanwhile, of the 16 analysts covering the stock, 13 have ‘buy’ ratings, with three ‘holds’:

​BABA BR

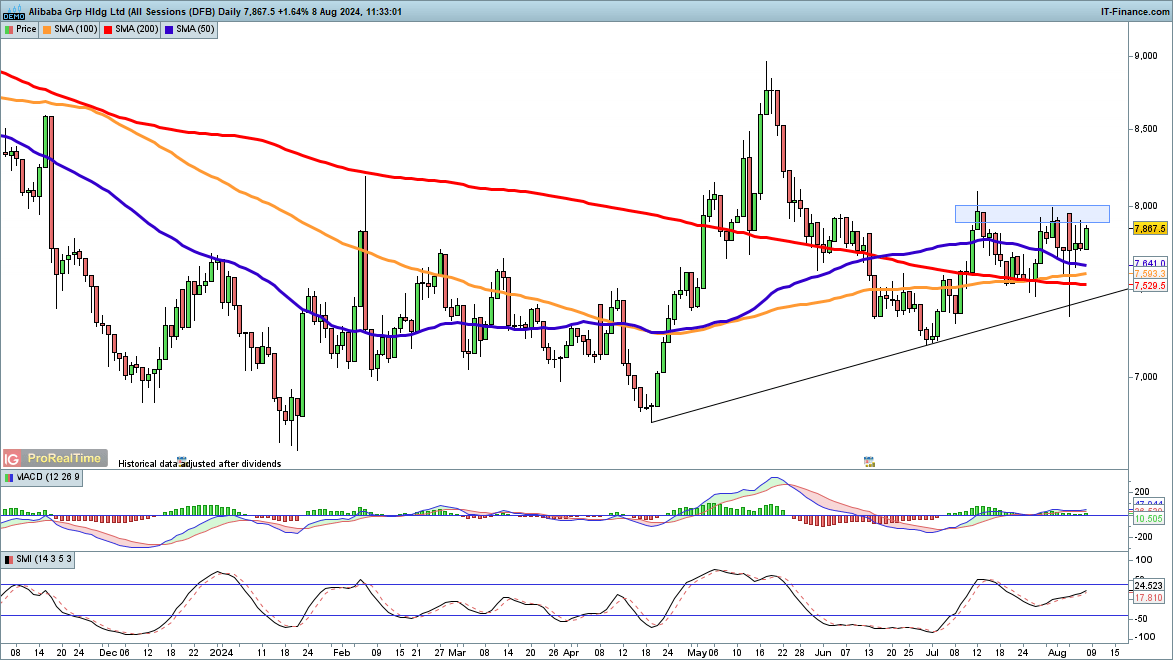
​Alibaba stock price under pressure

​Alibaba’s stock has suffered a sharp decline of 65% from levels of $235 in early January 2021 to around $80 now, while the S&P 500 has increased by about 45% over the same period. The company has underperformed the broader market in each of the last three years.

​Despite this, there are signs of bullishness in the short term. The price has risen from its April lows, forming higher lows in late June and at the end of July. Notably, it rapidly shrugged off weakness at the beginning of August.

​The price remains above trendline support from the April lows and has also managed to hold above the 200-day simple moving average (SMA). Recent gains have stalled at the $80 level, so a close above this would trigger a bullish breakout.

​BABA Price Chart


Retail Client Sentiment: Gold, Oil, AUD in Focus as Risk Appetite Stabilises

Retail Client Sentiment: Gold, Oil, AUD in Focus as Risk Appetite Stabilises

Risk Appetite Attempts a Recovery

On Monday we witness a very different start to the trading week than we did last week. It would appear that the short-lived panic has subsided to more reasonable levels, with the volatility Index (VIX) declining from 65 to just over 20, ahead of the New York open. The Aussie dollar is often viewed as a risk asset in the FX space due to its positive correlation with the S&P 500 and has recovered to some degree in recent trading sessions.

Oil, often viewed as a barometer for the global economy, continues its counter-trend move after a sustained sell-off. Lastly, gold attempted to get back to its all-time high. The precious metal has a reputation for rising in times of geopolitical uncertainty but also tends to benefit as central banks look to unwind years of tight monetary policy. This is because gold is a non-yielding asset and becomes relatively more attractive when interest rates are on the way down.

Gold

Retail trader data for Gold indicates a slight long bias, with 54.26% of traders net-long and a long-to-short ratio of 1.19 to 1. Net-long traders have increased by 1.07% since yesterday and 12.29% from last week. Net-short traders show a 3.25% increase from yesterday and a 6.33% rise from last week.

Adopting a contrarian view on crowd sentiment suggests potential further downside for Gold prices.

However, the mixed signals ‘less net-long than yesterday but more net-long than last week’ combined with recent changes in positioning, result in a complex trading bias for Gold. The combination of current sentiment and recent changes gives us a further mixed Gold trading outlook.

Oil (US Crude)

US Crude: An overwhelming 82.73% of retail traders are net-long on Oil – US Crude, with a long-to-short ratio of 4.79 to 1. Net-long traders have increased by 1.78% from yesterday but decreased by 5.84% from last week. Net-short traders show an increase of 2.86% since yesterday and a significant 36.39% rise from last week.

Our contrarian stance on crowd sentiment indicates potential further declines in Oil – US Crude prices.

Nevertheless, the decrease in net-long positions over the week, coupled with the substantial increase in net-short positions, suggests a possible upward price reversal. This is notable despite the prevailing net-long bias among traders.

Oil (Daily) Price Chart with Sentiment Overlayed

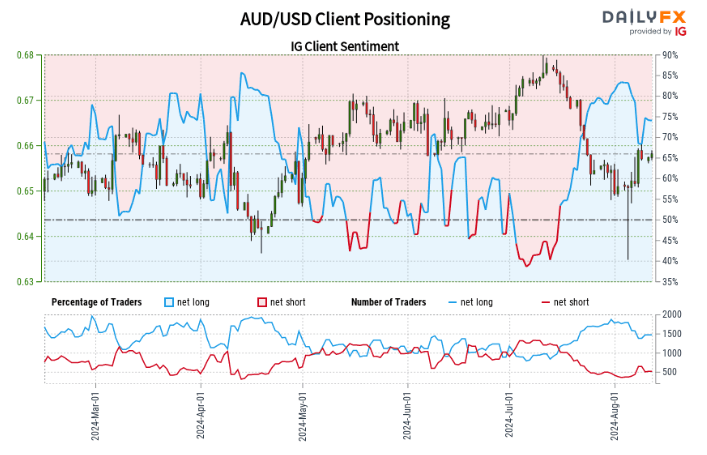
AUD/USD

Retail trader data reveals a significant long bias in the AUD/USD market, with 73.38% of traders holding net-long positions. The ratio of long to short traders stands at 2.76 to 1. Compared to yesterday, there’s a 3.49% increase in net-long traders, but a 7.34% decrease from last week. Net-short traders have seen an 8.12% increase since yesterday and a substantial 65.38% rise from last week.

We typically take a contrarian view to crowd sentiment, suggesting AUD/USD prices may continue to fall.

However, the reduction in net-long positions compared to both yesterday and last week, combined with the increase in net-short positions, hints at a possible upcoming reversal to the upside. This is despite the overall net-long bias that remains in place.

AUD/USD (Daily) Price Chart with Sentiment Overlayed

A graph of a stock market Description automatically generated with medium confidence

Nasdaq 100, Dow and Dax Continue to Rebound​​​​​​​

Nasdaq 100, Dow and Dax Continue to Rebound​​​​​​​

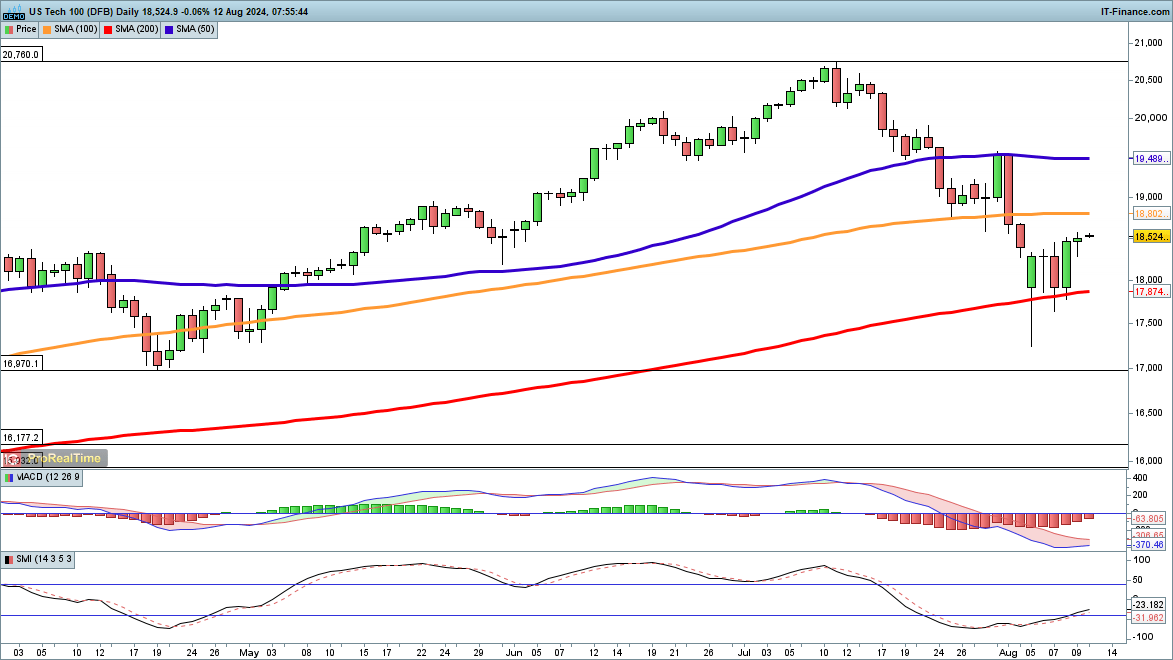
Nasdaq 100 looks for more gains

​The index finished up on the week, having rallied back above 18,000 as well as holding above the 200-day SMA.​For the moment the buyers remain in control, having lifted the index from its lows. Further gains target 19,000 and then the late July high at 19,500. A close back below 18,000 might signal that a new leg lower has begun.

​Dow claws back losses

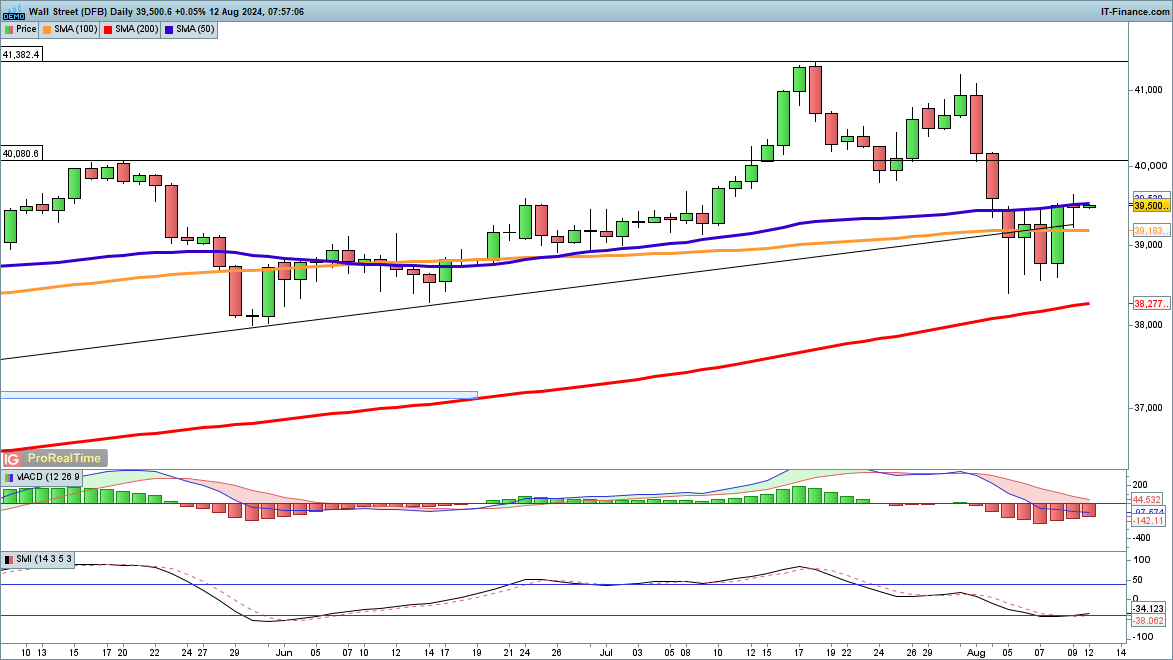
​A bullish view prevails here too, after the index rebounded from the lows of the week around 38,500.

​A close back above the 50-day SMA would help to bolster the bullish view, and open the way to 40,000 and higher. Sellers will need a close back below 39,000 to suggest a retest of the recent lows.

Dow Jones Daily Chart

​Dax pushes higher

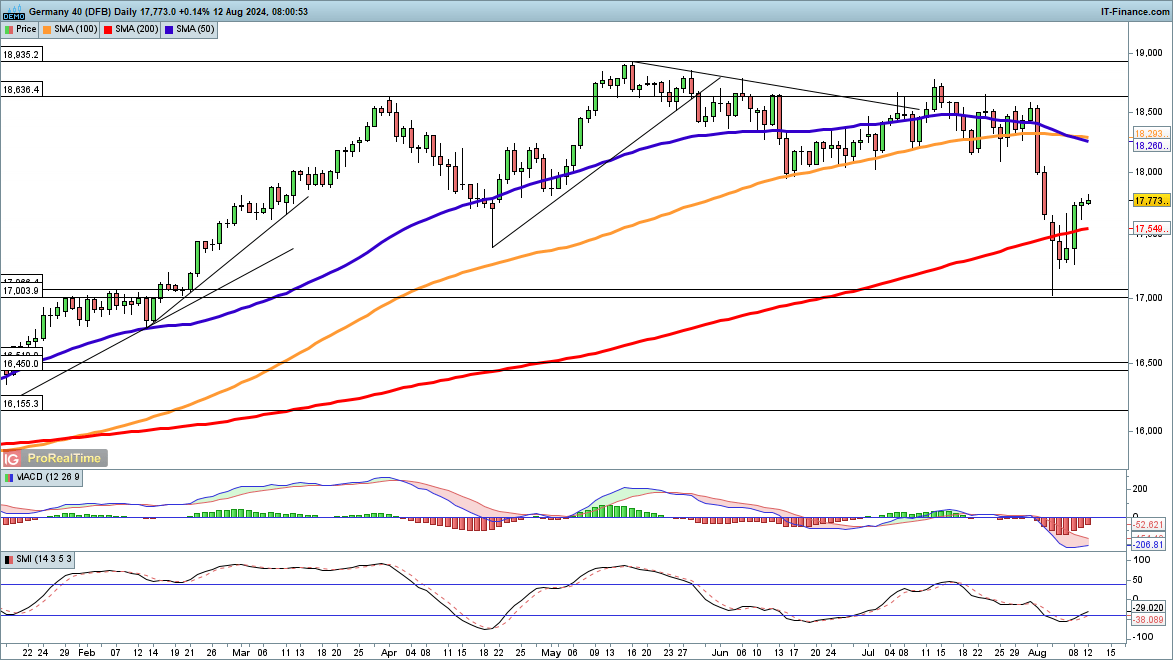
​Having nearly hit 17,000 last week the index has recovered well, moving back above the 200-day SMA.

​It has recovered the April low, and now looks poised to test 18,000. A close above this helps to support a view that the index will retest the July highs. Sellers will want to see a close back below 17,500 to put it back below the 200-day SMA.

DAX Daily Chart

Trend Trading with Moving Averages

Trend Trading with Moving Averages

Identifying a Fresh Trend

There often is a period of uncertainty in the moments that follow soon after a bottoming or topping pattern, where price starts to trade in the opposite direction. This can cause much confusion in the mind of traders because it’s not yet clear if this is the start of a new trend or price taking a breather before continuing in the direction of the previous trend. This is where moving averages can provide some assistance.

For a in-depth exploration of moving averages in general and how to calculate them, read our article, ‘Moving Average (MA) Explained for Traders’

The content and concepts described below are applicable for both long and short trades.

Consider the EUR/USD chart below. It is unclear if this is the early stages of a new trend or inconsistent price action that may result in a continued move lower.

EURUSD Trend

To get a better idea of trend, traders can incorporate the 200 day simple moving average, also known as the 200 DMA. The 200 DMA is widely regarded as a strong trend filter as it takes a considerable amount of data (price points) into its calculation.

The 200 DMA is a simple moving average (SMA) but traders looking to assign greater importance to recent price action may gravitate towards the exponential moving average (EMA).

Find out the difference between the SMA and EMA to discover which suits your trading style better.

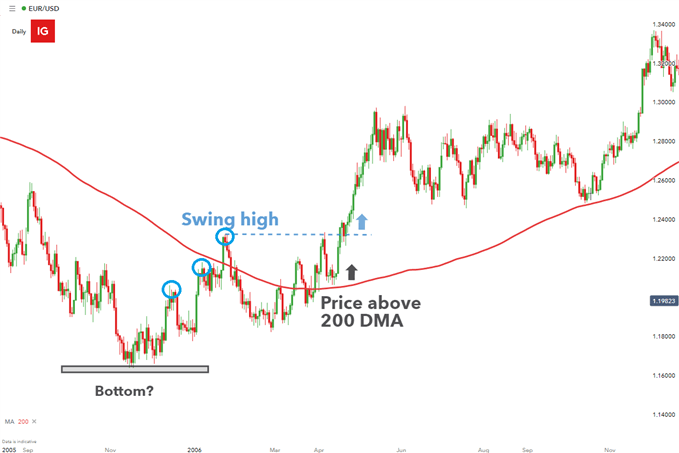
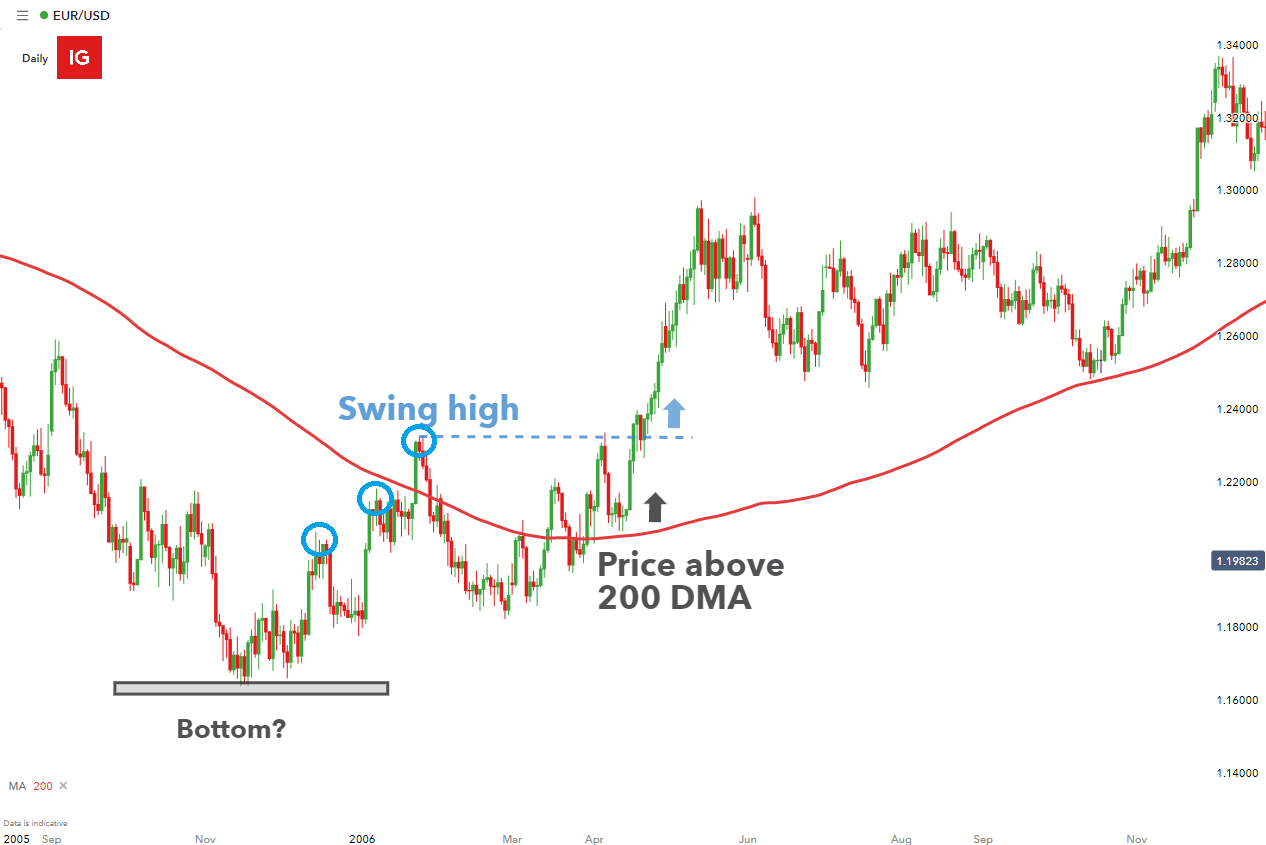
The 200 DMA should be regarded as a trend filter and not an entry signal. Therefore, only when price moves above the 200 DMA should potential entries be considered. The example below highlights this concept as price moved above the 200 DMA on a number of occasions before dipping lower.

The entry criteria is likely to vary among traders as this comes down to trader preference. In this example, the bullish bias was established through price trading above the 200 DMA (trend filter) with a rebound off support (200 DMA), followed by a move above the recent swing high.

EURUSD Trend with Moving Average applied

Therefore, look for price above the 200 DMA to get a feel for the trend and then make use of technical analysis to spot potential entry levels. Lastly, traders should adopt sound risk management techniques and implement a positive reward-risk ratio.

How to Stay in the Trade Using the 200 DMA

Once the trend has been confirmed, it is important to manage the trade as time goes on. Ideally, traders seek to remain in the trade as long as the trend continues. Therefore, further clarity is need to gauge whether the trend is still intact, or if a potential reversal is unfolding.

The 200 DMA can be used as ‘dynamic support’ during uptrends. The trend remains in force as long as price continues to trade above the 200 DMA.

EURUSD Trend with 200 Day Moving Average

A move below the 200 DMA could signal that the trend is slowing down or in fact, reversing. At this stage traders can consider potential exits if the limit has not yet been triggered.

Pros and Cons of Using MAs when Trend Trading

Like all indicators, there are conditions when moving averages thrive and others where they aren’t as useful. The table below summarizes the pros and cons of using moving averages when trend trading:

Pros Cons
Flexible (more responsive MA can be created by reducing the number of days/periods observed) Lagging indicator (generally there is a lag period between the strong initial move and the period where price trades above the 200 DMA)
Large data set (considers 200 price points) Volatile or ranging markets (signals will be inappropriate for non-trending markets
Easily Interpreted
NZD/USD holds comfortably above 0.6000 mark; bulls flirts with multi-week peak

NZD/USD holds comfortably above 0.6000 mark; bulls flirts with multi-week peak

The NZD/USD pair attracts fresh buyers following an intraday dip to levels below the 0.6000 psychological mark and sticks to its intraday gains through the early part of the European session on Monday. Spot prices currently trade around the 0.6025 area, just a few pips below a three-week top touched on Friday, as traders look to this week’s central bank event risk and the crucial US inflation figures for a fresh impetus.

The Reserve Bank of New Zealand (RBNZ) is scheduled to announce its policy decision on Wednesday. From the US, investors will confront the release of the Producer Price Index (PPI) on Tuesday and the Consumer Price Index (CPI) on Wednesday, which might influence expectations about the Federal Reserve’s (Fed) policy path. This, in turn, will drive the US Dollar (USD) demand in the near term and provide some meaningful impetus to the NZD/USD pair.

In the meantime, the New Zealand Dollar (NZD) might continue to draw support from last week’s better-than-expected jobs report, which lowered the likelihood of a rate cut by the RBNZ. The USD, on the other hand, is undermined by bets for a bigger rate cut of 50 basis points (bps) by the Fed in September. Apart from this, a positive tone around the equity markets turns out to be another factor weighing on the safe-haven buck and benefiting the risk-sensitive Kiwi.

It, however, remains to be seen if bulls can capitalize on the move amid persistent worries about the slowing Chinese economy, which tends to dent demand for antipodean currencies, including the Kiwi. Nevertheless, the recent price action, along with the bearish sentiment surrounding the USD, suggests that the path of least resistance for the NZD/USD pair is to the upside. Hence, any meaningful pullback might be seen as a buying opportunity and remain limited.

EUR/USD keeps range above 1.0900 amid cautious markets

EUR/USD keeps range above 1.0900 amid cautious markets

EUR/USD is trading sideways above 1.0900 in early Europe on Monday. The pair treads water, as the US Dollar holds the upper hand amid escalating tensions between Israel and Iran. Looming geopolitical risks could limit any upside attempts in EUR/USD.

The Relative Strength Index (RSI) indicator on the 4-hour chart continues to move sideways near 50, reflecting EUR/USD’s indecisiveness.

First support could be seen at 1.0900 (psychological level, static level) ahead of 1.0880-1.0870, where the 100-period and the 20-day Simple Moving Averages (SMA) are located, and 1.0845 (200-period SMA).

In case the pair breaks above 1.0940 (static level), it could encounter next resistance levels at 1.0960 (static level) and 1.1000 (psychological level, static level).

EUR/USD continues to move up and down in a narrow range above 1.0900 after closing the previous week virtually unchanged. The pair’s technical outlook does not offer any directional clues as investors remain on the sidelines while keeping a close eye on geopolitical headlines.

Markets turn cautious at the beginning of the week on growing fears over the Iran-Israel conflict turning into a deepening crisis in the Middle East. Although Euro Stoxx 50 Index is modestly higher in the first trading session of the week, US stock index futures struggle to gain traction.

The economic calendar will not offer any high-impact macroeconomic data releases on Monday. On Wednesday, the US Bureau of Labor Statistics will publish the Consumer Price Index (CPI) data for July.

In case geopolitical tensions escalate further in the second half of the day, major equity indexes in the US could turn south. In this scenario, the US Dollar (USD) could hold its ground against its major rivals and make it difficult for EUR/USD to gain traction. On the other hand, the pair could stretch higher if risk flows return to markets following Wall Street’s opening bell.

British Pound (GBP) Latest – BoE Policymaker Warns on Inflation, GBP/USD Analysis

British Pound (GBP) Latest – BoE Policymaker Warns on Inflation, GBP/USD Analysis

Bank of England MPC policy member Catherine Mann, one of four rate-setters who voted to leave interest rates unchanged at the last central bank meeting, warned this weekend that inflation may rise again in the coming months. Speaking to the Financial Times, Ms Mann said recent surveys suggest that, ‘There is an upwards ratchet to both the wage setting process and the price process and . . . it may well be structural, having been created during this period of very high inflation over the last couple of years” she added. “That ratchet up will take a long time to erode away.”

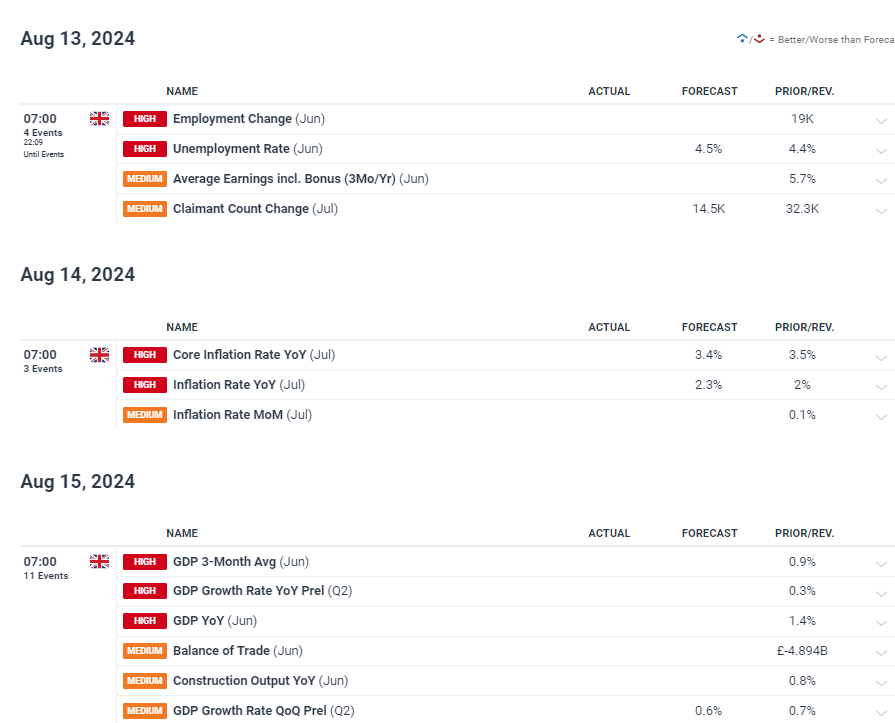
Ms Mann’s warning comes ahead of a busy economic release schedule with the latest UK employment, wages, inflation, and GDP data all set to be released over the coming days.

A screenshot of a computer  Description automatically generated

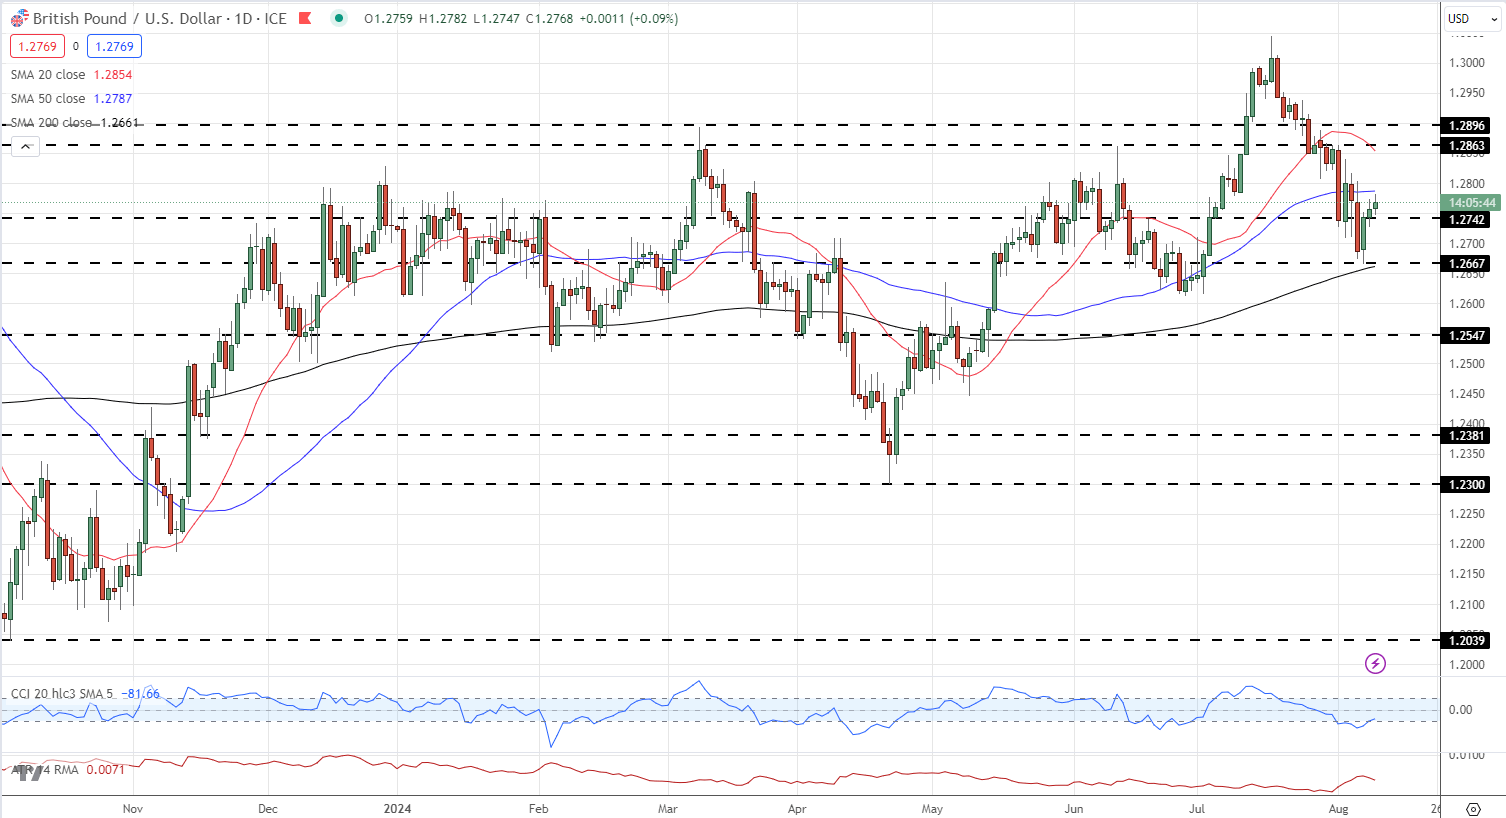
GBP/USD touched a multi-week low of 1.2665 last week based on Sterling weakness and US dollar strength. The pair has pushed higher since, helped by a supportive 200-day simple moving average, and currently trades around 1.2770. Cable is trying to break out of a sharp one-month downtrend after printing a 13-month high of 1.3045 on July 17, and this week’s economic data will decide the pair’s future. Support remains around 1.2665, bolstered by the 200-dsma at 1.2661, while near-term resistance is around 1.2863.

GBP/USD Daily Price Chart


A graph with lines and numbers  Description automatically generated with medium confidence

Retail trader data shows 51.94% of traders are net-long with the ratio of traders long to short at 1.08 to 1.The number of traders net-long is 0.92% higher than yesterday and 13.53% higher from last week, while the number of traders net-short is 0.44% higher than yesterday and 4.78% lower from last week.

We typically take a contrarian view to crowd sentiment, and the fact traders are net-long suggests GBP/USD prices may continue to fall. Traders are further net-long than yesterday and last week, and the combination of current sentiment and recent changes gives us a stronger GBP/USD-bearish contrarian trading bias.

Bitcoin (BTC) Testing Technical Resistance, Gold (XAU) Nudging Higher

Bitcoin (BTC) Testing Technical Resistance, Gold (XAU) Nudging Higher

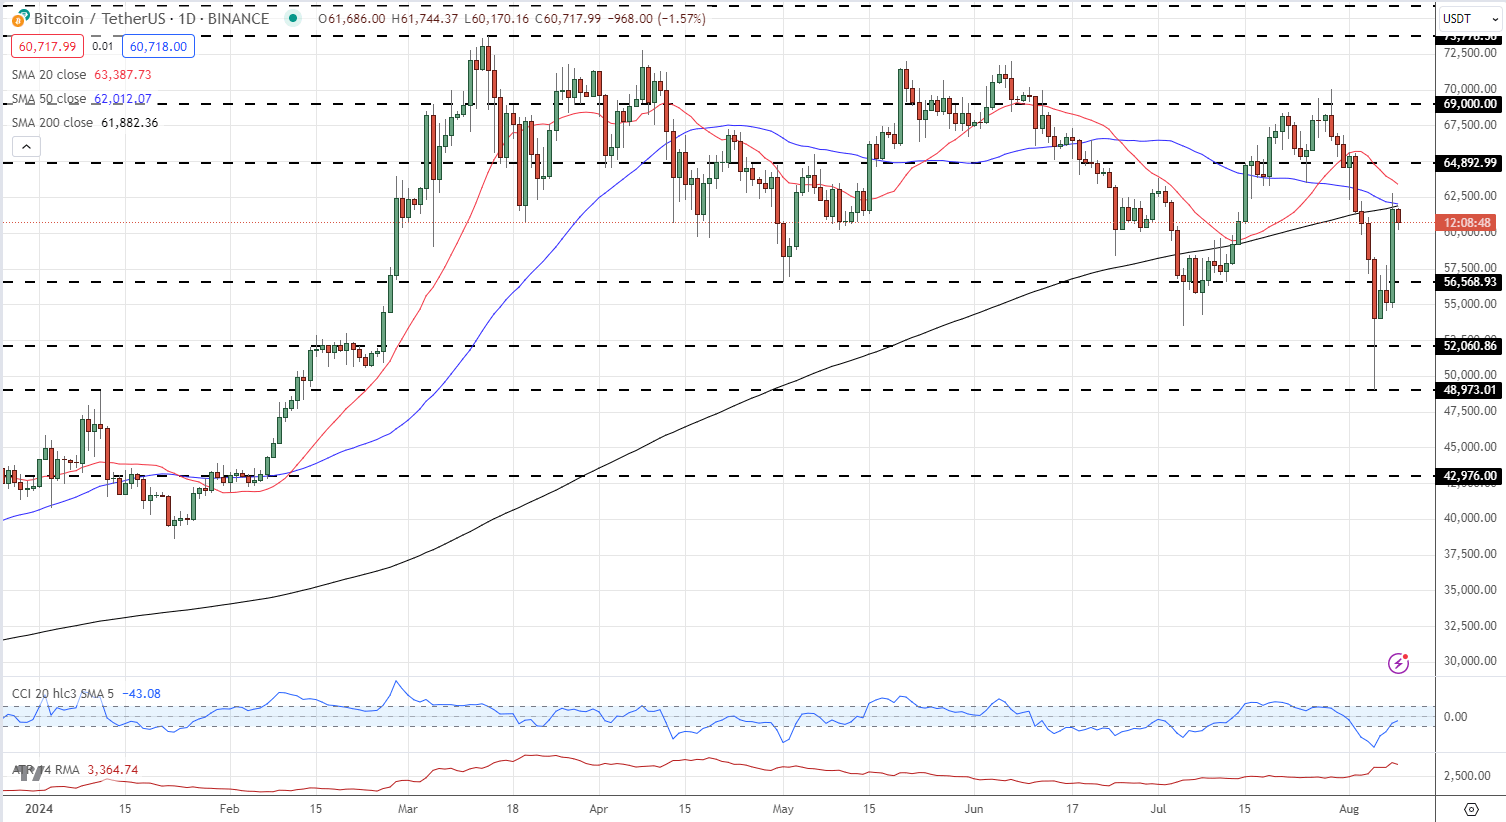
Bitcoin has recovered all this week’s losses and is back at levels seen just before last Friday’s NFP release sent risk markets tumbling on US recession fears. Over this week these worries have been dialed back and risk markets, including Bitcoin, have made a strong recovery. Printing a fresh lower low leaves the chart with a negative bias, while the 50- and 200-day simple moving averages are being tested but have held firm so far. These two moving averages must be broken convincingly before BTC can make the next move higher. If BTC/USD can break above$70k, a cluster of prior highs will prove difficult to overcome in the short term with $72k a notable double top. To the downside, $56.5k should hold if tested.

Bitcoin Price Daily Chart

A graph with lines and numbers Description automatically generated with medium confidence

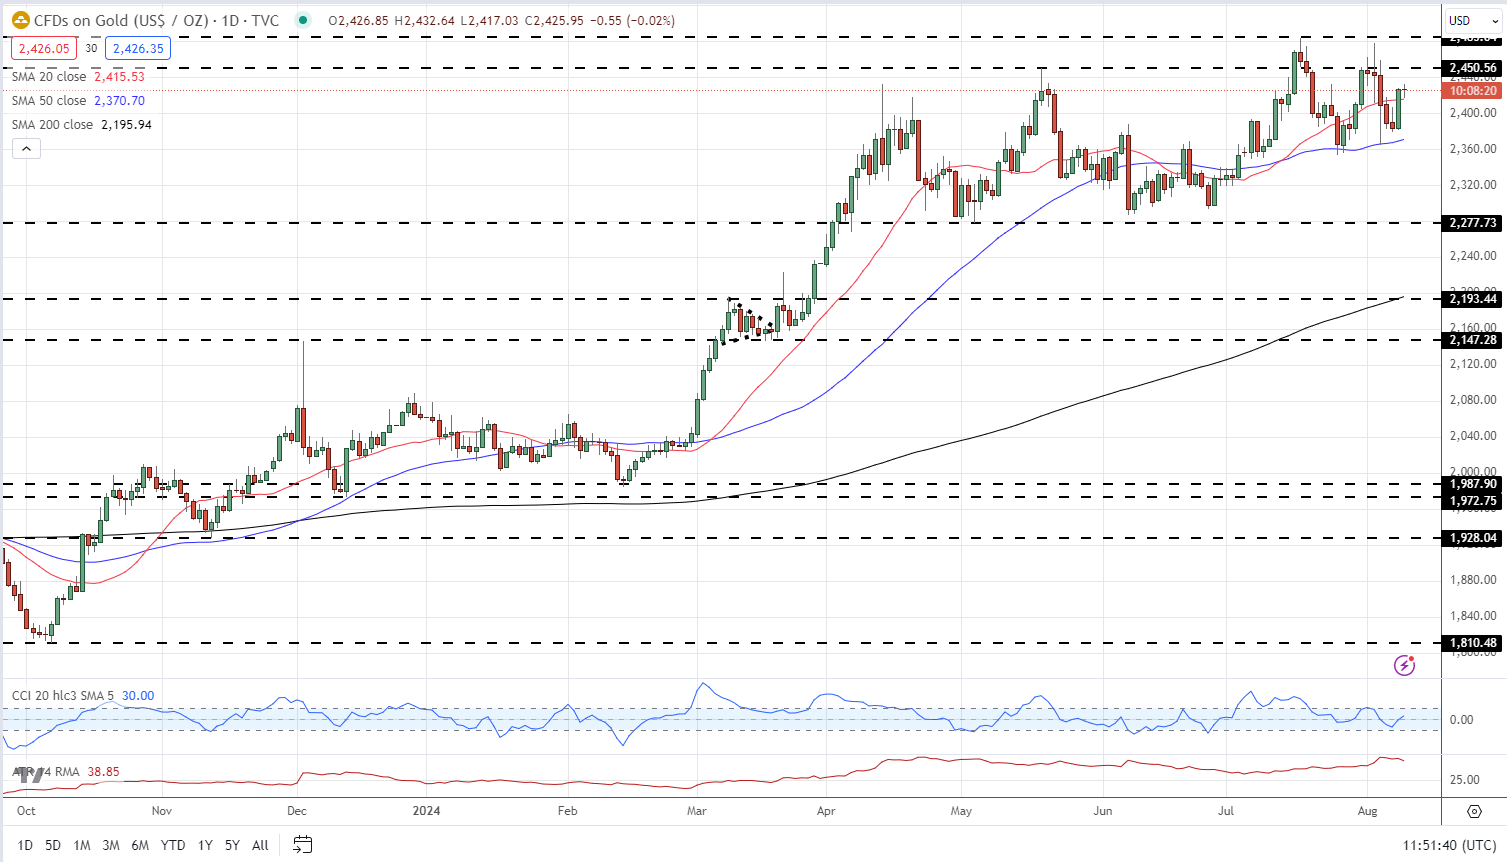
The longer-term gold chart remains positive with a series of slightly higher lows and higher highs in place. The precious metal has been drifting sideways to marginally higher since early April with two breaks of resistance ($2,450/oz.) quickly reversed. Gold seems to be setting up for another attempt at this level and if successful the all-time high at $2,485/oz. will be quickly tested.

Gold Price Daily Chart

A graph of stock market Description automatically generated

200-Day Moving Average: What it is and How it Works

200-Day Moving Average: What it is and How it Works

What is a 200-Day Moving Average

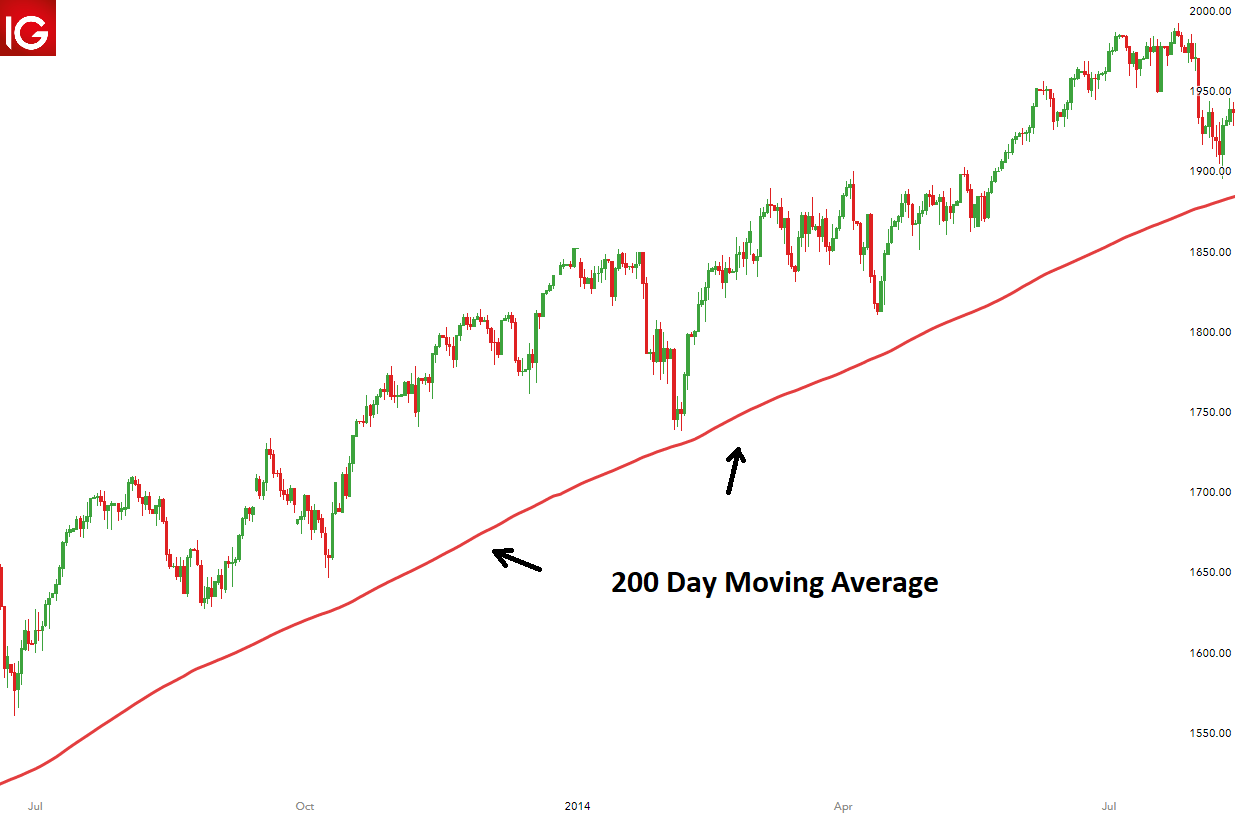
The 200-day moving average is a technical indicator used to analyze and identify long-term trends. Essentially, it is a line that represents the average closing price for the last 200 days and can be applied to any security.

200 day moving average chart for the S&P 500

The 200-day moving average is widely used by forex traders because it is seen as a good indicator of the long-term trend in the forex market. If the price is consistently trading above the 200-day moving average, this can be viewed as an upward-trending market. Markets consistently trading below the 200-day moving average are seen to be in a downtrend.

How Do You Calculate the 200 Day Moving Average?

The 200-day moving average can be calculated by adding up the closing prices for each of the last 200 days and then dividing by 200.

200 Day Moving Average Formula = [(Day 1 + Day 2 …. + Day 200)/200]

Each new day creates a new data point. Connecting all the data points for each day will result in a continuous line which can be observed on the charts.

How Do You Use the 200 Moving Average in Your Trading Strategy?

The 200-day moving average has gained in popularity as it can be used in many different ways to assist traders.

Using the 200-Day MA as Support and Resistance

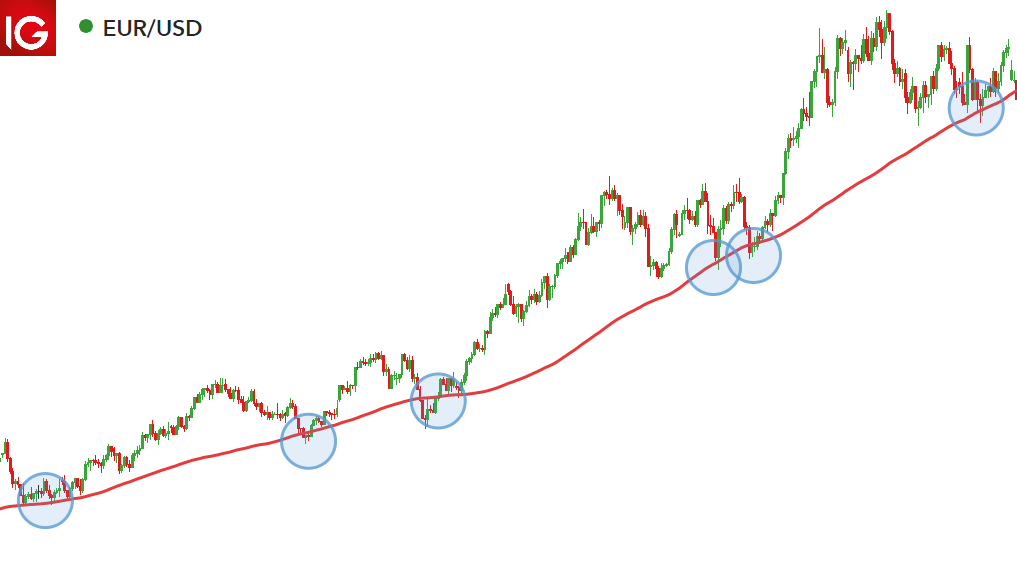
The 200-day moving average can be used to identify key levels in the FX market that have been respected before. Often in the forex market, price will approach and bounce off the 200-day moving average and continue in the direction of the existing trend. Therefore, the 200-day moving average can be viewed as dynamic support or resistance.

Below is an example of how the price approached and bounced off the 200-day moving average on the EUR/USD chart:

200 day moving average chart EUR/USD

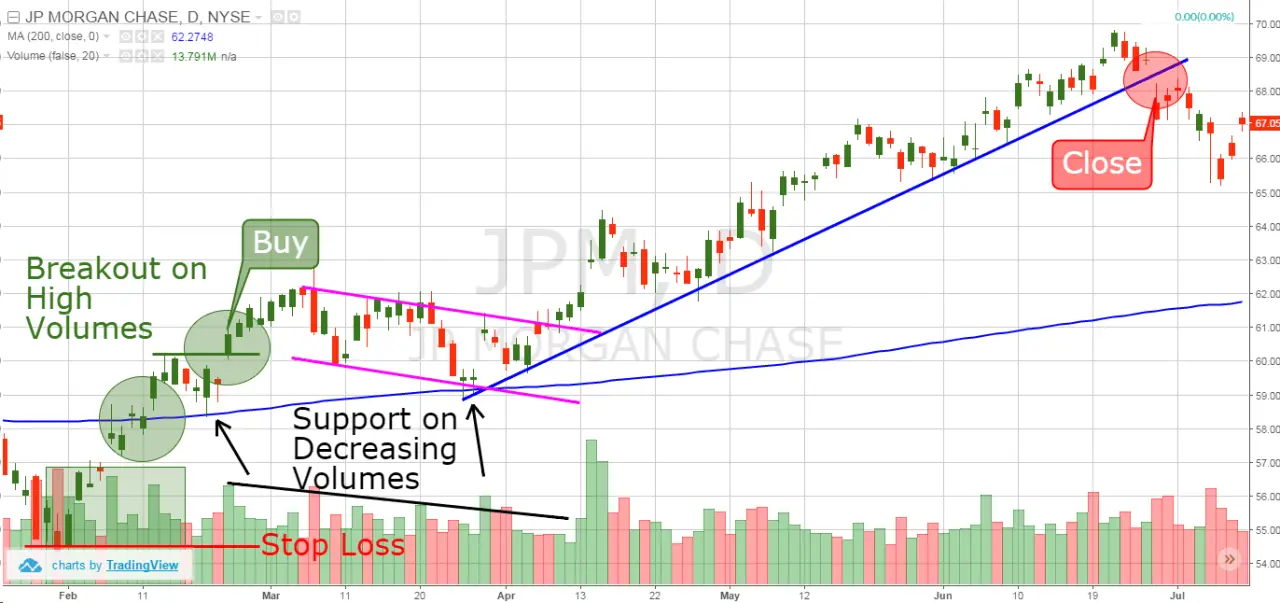
Traders will look to go long as price bounces off the 200-day moving average when the market is in an upward trend. Likewise, traders will look for short entries after the price bounces from the 200-day moving average in a down-trending market. Stops can be placed below (above) the 200 moving average in an uptrend (downtrend).

MA Crossovers

Once the long-term trend is identified, traders often assess the strength of the trend. This is important because a weakening trend could signal a trend reversal and present the ideal time to exit an existing trade.

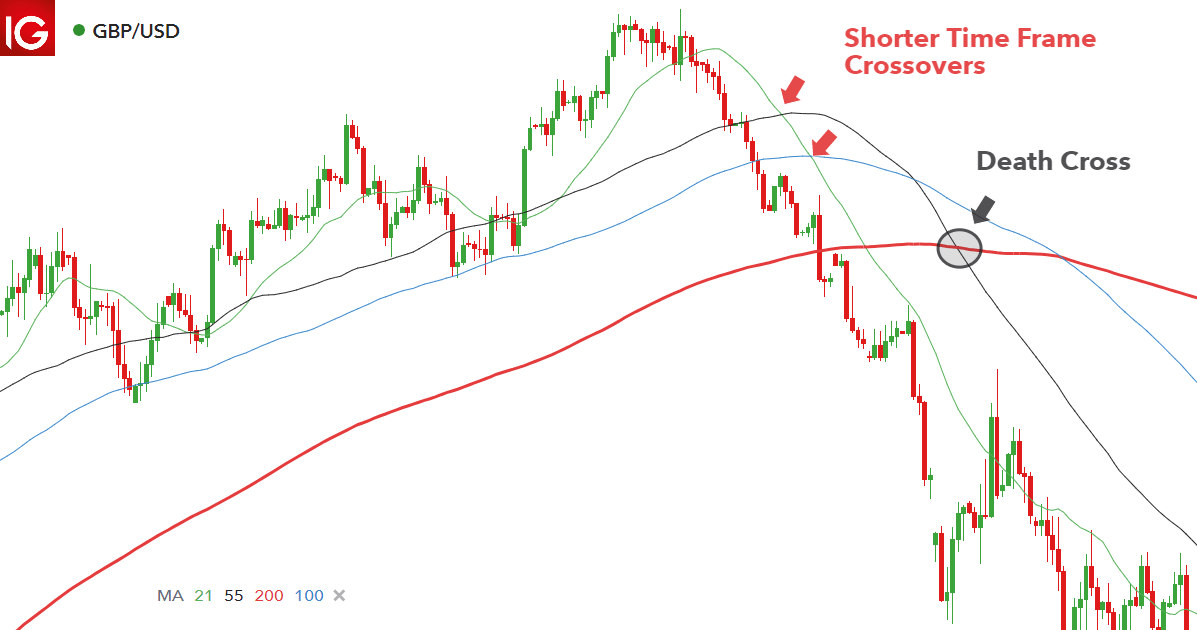
Incorporating shorter-term moving averages like the 21-, 55- and 100-day moving averages, allows traders to determine whether the existing trend is running out of steam because they track more recent price movements over a shorter time period.

The GBP/USD chart below, shows how the smaller, faster-moving averages signal that the uptrend may be about to reverse. The 21-day (green) moving average crosses through the 55-day (black) moving average and continues to cross the 100 (blue) and 200 (red) day moving averages to the downside. These are all bearish signals that appear before the 200-day moving average presents a bearish signal.

shorter time frame moving average crossovers

Using the 200-Day Moving Average as a Trend filter

One of the easiest strategies to incorporate with the 200-day moving average is to view the market in relation to the 200-day moving average line. Traders commonly do this to analyze the general market trend and then look to only place trades in the direction of the long-term trend.

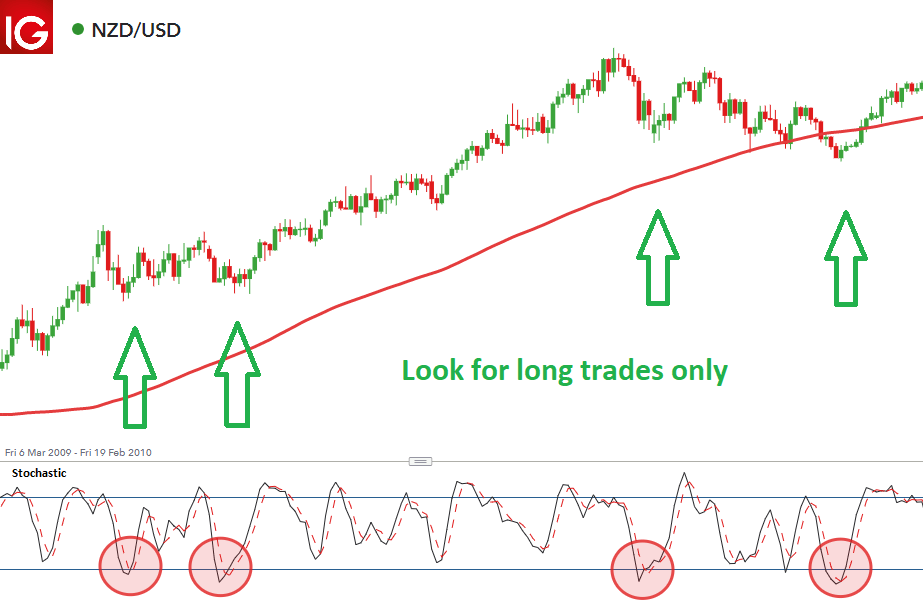
In the NZD/USD chart below, the market is trading above the 200-day moving average for a prolonged period of time. This means that the market is trending upwards and therefore, traders should only be looking for long entries into the market. The example below makes use of the stochastic oscillator however, traders should make use of an indicator or any other entry criteria they feel comfortable with.

filternng trades in the direction of the trend using the 200 day moving average chart