MACD vs Stochastic: Timing Entries with One or Both Indicators

MACD vs Stochastic: Timing Entries with One or Both Indicators

MACD vs Stochastic: Is one indicator better than the other?

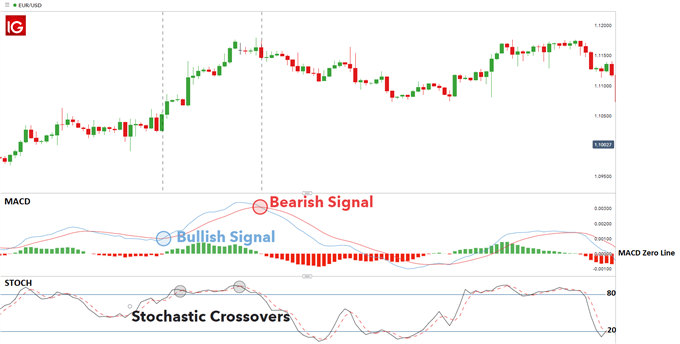
In the EUR/USD chart below, there is a strong prevailing upward trend which can be seen on the price chart. When using the MACD, the first MACD crossover can be found when the MACD line (the blue line) crosses over and above the signal line (the red line), providing traders with a bullish signal, suggesting that both prices and momentum of the trend are increasing.

At the second MACD crossover, the MACD line crosses below the signal line, providing a bearish signal. Because the crossover is still above the zero line, this suggests that the momentum of the upward trend is slowing down, although the larger trend is still in favor of bulls. In both instances, the MACD crossovers correspond with what took place on the price chart during that specific period, whereas the stochastic indicator provides false signals for the same measured look.

EUR/USD chart with MACD signals

The above example showed a trending market but what happens in ranging markets?

Looking at another example below in which GBP/NZD is range bound (trading sideways). In this instance, the MACD provides less reliable signals than the signals provided by the stochastic.

With stochastics, a bullish signal can be found when the %K line (the black line) crosses over and above the %D line (the red dotted line). Likewise, a bearish signal occurs when the %K line crosses under and below the %D line. The strongest signals will occur when there is a bullish cross coupled with a move above 20 from below and a bearish signal coupled with a move below 80.

As indicated below, the first stochastic crossover occurs below 20 and meets the criteria for a bullish signal, which indicates that the GBP/NZD is oversold, and prices may be soon increase. Similarly, the second and third crossover occurs from above 80 where the %K line crosses below the %D line, suggesting that the market is now overbought, and prices may decrease. In this example we see that while the MACD crossovers aren’t necessarily incorrect, the stochastic provides clearer entry and exit signals.

GBP/NZD with stochastic signals

As we have seen above, the MACD is a generally more effective indicator in trending markets while the stochastic often works better in ranging markets.

Next, we will explore how traders can combine the MACD and the stochastic indicators to get more optimal signals.

A double cross strategy with Stochastic and MACD

When applying the stochastic and MACD double-cross strategy, it is important that the criteria for both indicators be taken into consideration when looking for potential signals.

In the US 500 chart below, the stochastic crossover occurs when the %K line crosses over and above the %D line and is below 20. Shortly after, the MACD crossover occurs when the MACD line (the blue line) crosses over and above the signal line (the red line) and is below the zero line. This is a bullish signal in both cases, confirming that an upward trend is forming.

To use this strategy correctly, the stochastic crossover should occur shortly before the MACD crossover as the alternative may create a false indication of the trend.

US 500 with MACD and stochastic crossover

As far as MACD vs Stochastics goes, much will depend on the trader in question and other factors in their approach. Based on the length of time used, comfort level achieved, and prior instances of success (perhaps the strongest reason of all), some will prefer one over the other while other traders will put both to use.
 

How to Trade a Bearish Flag Pattern

How to Trade a Bearish Flag Pattern

What is a bear flag?

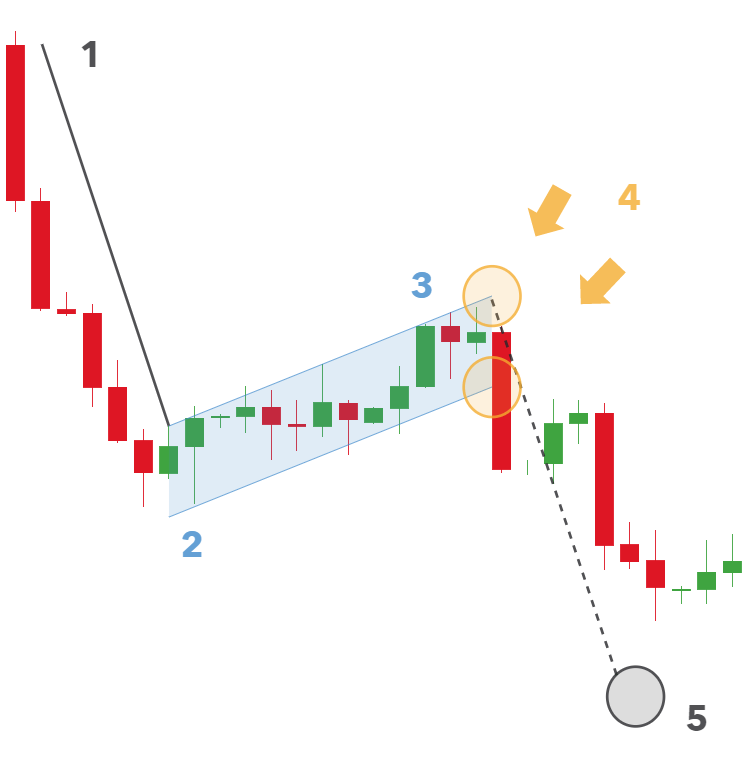
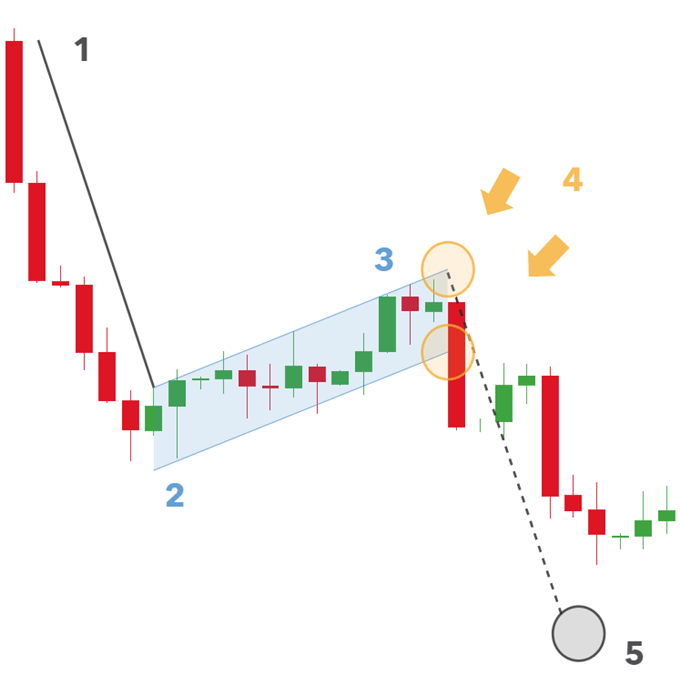
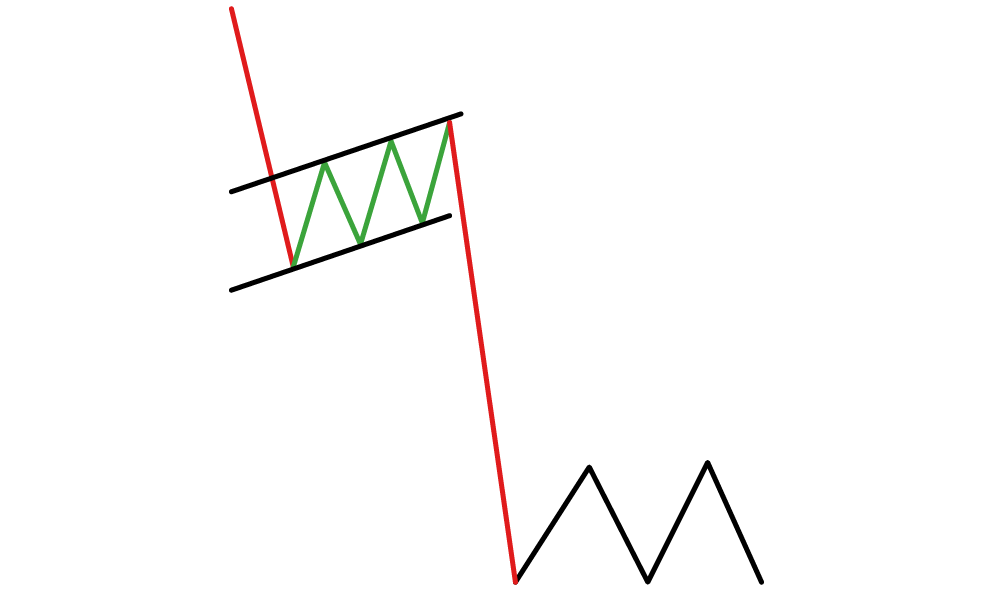
A bear flag is a technical pattern that provides an extension/continuation to an existing downward trend. The bear flag formation is underlined from an initial strong directional move down, followed by a consolidation channel in an upwards direction (see image below). The strong move down is known as the ‘flagpole’ whilst the consolidation is referred to as the ‘flag’ itself.

Bear flag pattern

bear flag pattern

How to identify a Bearish Flag on Forex Charts

Identifying a bear flag can be easy once traders understand the components, and this is applicable to all financial markets, not just forex. The pattern itself is divided into three parts:

1. Traders will need to find the flag pole which will be identified as an initial decline. This decline can be steep or slowly sloping and will establish the basis for the trend.

2. The bear flag is identified as a period of consolidation after the completion of prices initial decline. During this period, prices may slowly channel upward and retrace a portion of the initial move. At this point traders will wait for price to break to lower lows in the direction of the trend.

3. After price begins to move lower again, traders can then find the final component needed for trading a bearish flag pattern. The profit target is a potential value to take profit after a currency pair’s next decline in price. This pricing level can be identified by first measuring the distance in pips of our initial decline. This value can then be subtracted from the peak resistance line formed from our consolidating flag.

Bear flag formation summary:

  1. Preceding downtrend (flag pole)
  2. Identify upward sloping consolidation (bear flag)
  3. If the retracement becomes higher than 50%, it may not be a flag pattern. Ideally, we’ll see the retracement be less than 38%
  4. Enter at top of flag or on breakout below the low of the lower channel
  5. Look for prices to break lower with a length equal to the size of the flag pole

bear flag formation

Bear Flag Trading Strategy

The following is an example of how to trade the bear flag pattern using forex charts.

USD/CAD bear flag pattern

USD/CAD bear flag pattern

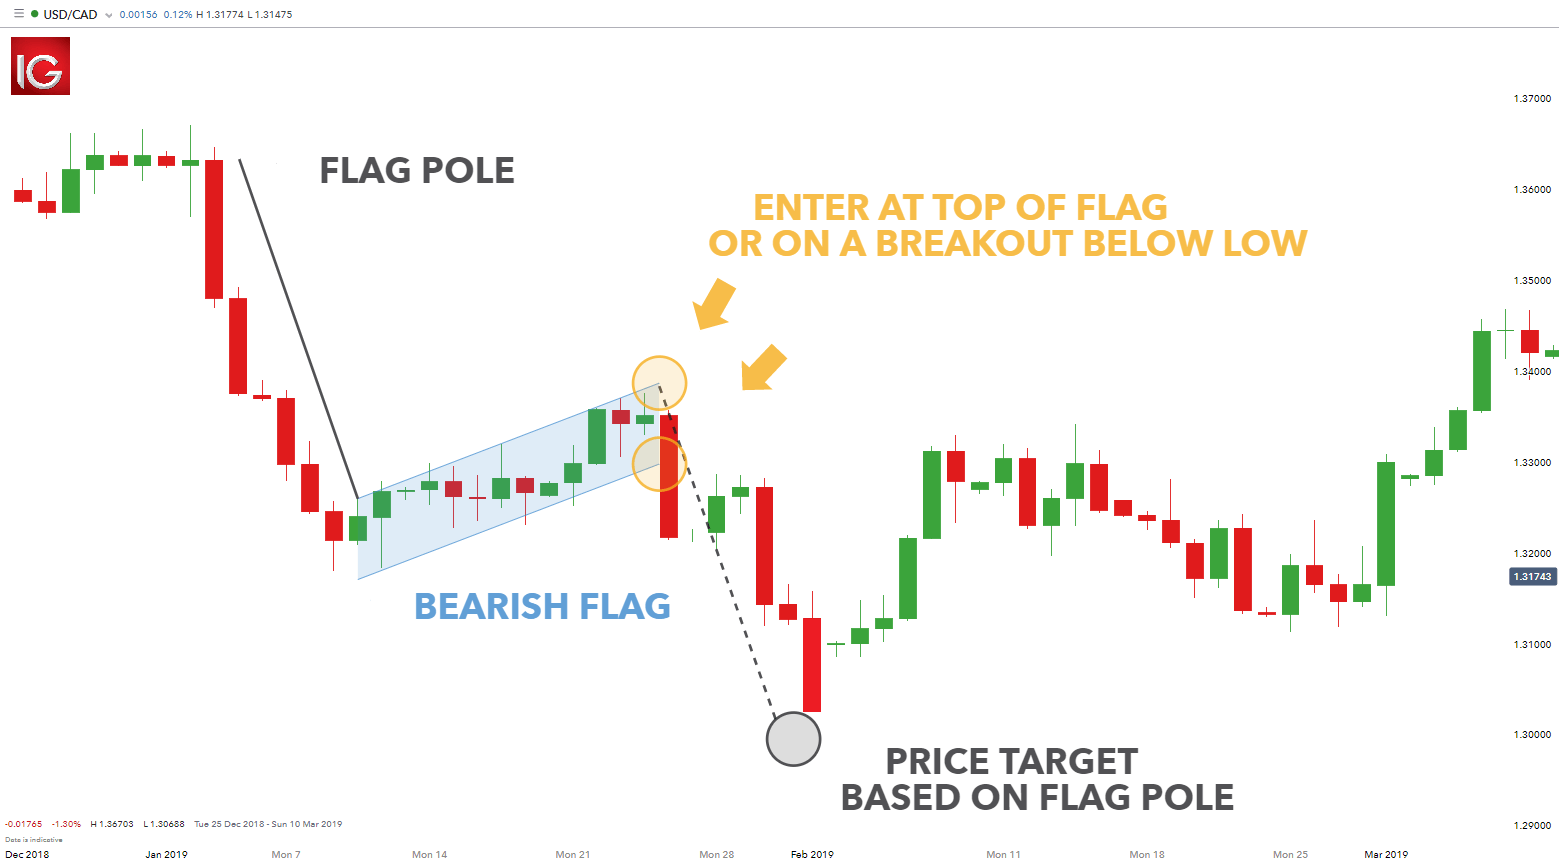
The chart above displays a bearish flag pattern being created on the USD/CADdaily chart. The flag pole has been established by connecting the January 3rd high at 1.36500 with the January 9th low at 1.31800. Totalling the difference between these points culminates in an initial decline of 470 pips. The consolidation phase of the move is highlighted by the blue channel.

As price gradually rises, the flag pattern slowly takes shape. It’s important to note that there is no established bearish flag pattern until price breaks out to lower lows of the channel. At that point, traders use the 470 pip (flag pole) initial decline to establish potential price targets near 1.30000.

In this example, price does not quite reach this level but this is purely a guideline. Trader’s need to be aware of price movements and other fundamental and technical moves that may occur throughout the trade journey.

How reliable is the Bear Flag?

The bear flag is regarded as an extremely reliable price pattern when all its unique formation features are adhered to. The table below identifies the advantages and limitations of the bear flag chart pattern:

Bear flag vs Bull flag

The bear flag and bull flag represent the same chart pattern, however they are reflected in the opposite direction. Both bull and bear flag patterns entail a flagpole, consolidating price channel and a take profit projection measured from the length of the initial flagpole. Strategies for trading forex with bear and bull flags entail similar steps, but it is important to understand the bull flag pattern in its own layout as these patterns can be easily confused when taken out of context.

Pertinent questions associated with trading the bear flag pattern

How do I know where to enter the trade with the bearish flag pattern?

The flag will trade upwards in a channel but the move to the downside is often revealed with successive lower highs and lower lows. Traders take note of Fibonacci levels, which are mathematically significant ratios that occur in nature and are often observed in financial markets. These levels are depicted using the Fibonacci retracement indicator and can assist traders in identifying entry levels where the “flag” could turn and continue in the current trend.

Bearish flag pattern or start of a bullish breakout?

Some traders fall into the trap of mistaking a bearish flag pattern for a bullish breakout. Bearish flag patterns tend to be gradual rises in price in a downward trend whereas breakouts often exhibit sharper moves to the upside. There are indicators to assist traders in spotting potential breakouts with one of these being the Donchian channel.

Stock Market Liquidity and the Benefits for Traders

Stock Market Liquidity and the Benefits for Traders

What is Liquidity in the Stock Market?

Stock market liquidity refers to the stocks that have sufficient trading volume to allow traders to enter and exit positions straightforwardly. Stocks that are not liquid and don’t have sufficient volume cannot be bought or sold as easily. This is simply because it’s harder to find buyers and sellers for such stocks.

Liquidity can be measured by share turnover, which is calculated by dividing the total number of shares traded over a given period by the average number of shares outstanding for the period. If a company has a high share turnover it will have liquid company shares.

For example, if a company on a major index such as NASDAQ, DAX or FTSE 100 has 100 million shares outstanding on the first day of its fiscal year and 150 million on the last day, the average outstanding shares will be 125 million for the year. With a trading volume of 90 million shares for the year, the calculation is 90 million/125 million = 0.72, which expressed as a percentage is a share turnover of 72%.

What are the Most Liquid Stocks?

Examples of high liquidity stocks in the tech sphere include Microsoft, Google and Facebook, in e-commerce Amazon, Alibaba and Shopify, and in the energy sector Exxon, General Electric and Chesapeake Energy. The share volume of stocks refers to the number of shares that changed hands during a given day. The highest volumes will often be in the tens of millions, with stocks considered liquid around 200,000 and upward.

Naturally, the liquidity levels of stocks will vary, but for the most part the larger market capitalizations will have more liquid stocks. For a picture of the liquidity of stocks by sector, the following table shows some of the most liquid stocks as of April 2019.

Energy Financial Healthcare Industrials Technology Telecoms
Chesapeake Energy Bank of America Celgene CSX Corp Amazon AT&T
ExxonMobil Berkshire Hathaway Johnson & Johnson Deere & Co Apple Comcast
General Electric Blackstone Group Merck & Co. United Technologies Cisco T-Mobile US
Halliburton KKR & Co Pfizer US Ecology Google Verizon
Transocean Lloyds Banking Group Teva Waste Management Intel Vodafone

Benefits of Trading Highly-Liquid Stocks

Highly-liquid stocks can be particularly beneficial for day traders – their sizeable trading volume means that positions can be entered and exited quickly without price being hit, suiting the rapid pace of the day trading experience.

Since liquid stocks enable the opening and closing of positions efficiently, traders can stay comfortably within their risk management strategy. Compare this to trading less liquid stocks, where it may take considerably longer to execute an order because their share volume is so low.

To find stocks with good liquidity, as with finding stocks that are volatile, you can use a stock screener tool. This helps find stocks according to specified criteria, in this case trading volume.

Relationship Between Liquidity and Fundamental and Technical Analysis

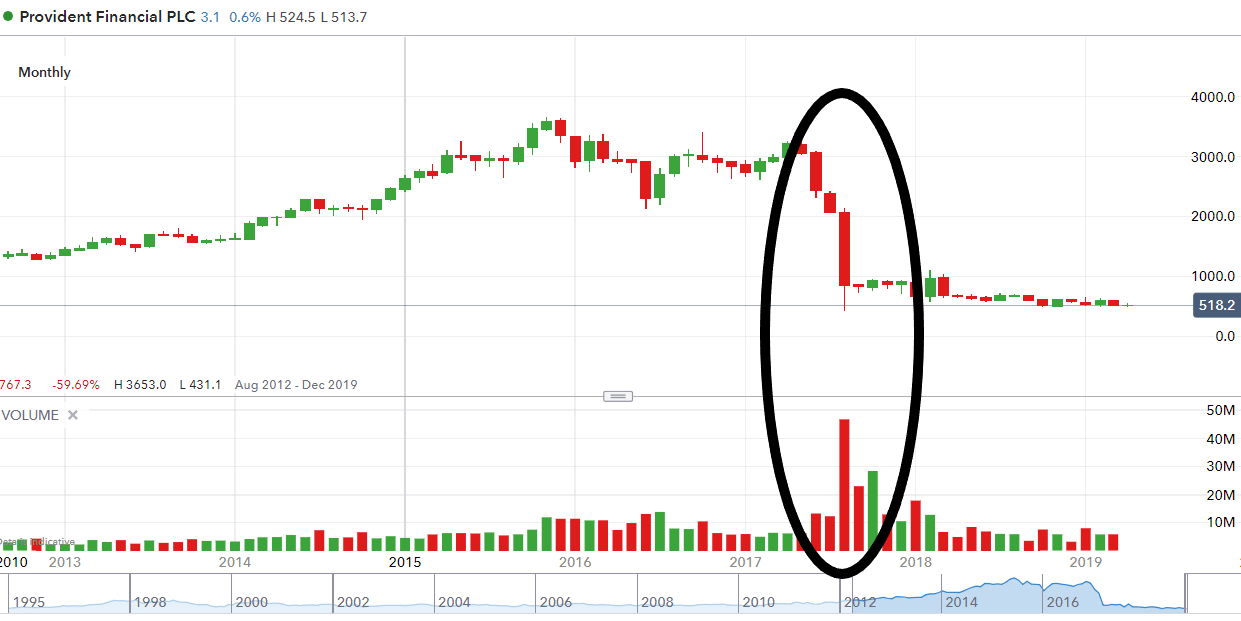
Trading volume can be affected strongly by fundamental and technical factors. An example on the fundamental side can be seen in the chart below, where subprime lender Provident Financial saw aggressive selling in August 2017 following a profit warning, the company scrapping its dividend and its CEO leaving.

Chart to show how liquidity in stocks can influence price movement

In terms of technical analysis, a significant price increase coupled with a notable increase in volume could indicate a continued bullish trend or bullish reversal. On the flipside, a price decrease along with a volume increase could be a sign of a continued bullish trend or bullish reversal.

Traders focusing on technical analysis may find volume indicators useful. The Positive Volume Index and Negative Volume Index are based on the previous day’s trading volume and market price and can be a useful way of showing how volume is affecting price.

Differences Between Stock Market Liquidity and FX Liquidity

When assessing the difference between stock market liquidity and forex or FX liquidity, there are a few important factors to consider. While all major currencies such as EUR/USD and EUR/JPY are highly liquid due to there always being a high volume of currency available to trade, exotic currencies such as USD/HUF and USD/TRY are traded much less.

The forex market operates 24 hours a day with trading averaging $6.6 trillion per day, according to the Bank for International Settlements, which is many times that of the volume for stocks. This also means positions can be opened and closed round the clock, which is also helpful for liquidity.

However, many stocks will of course have high liquidity too, such as the blue-chip examples above. That said, smaller stocks with lower trading volumes can be significantly less liquid.


ETF vs Stocks: How to Choose the Best Investment

ETF vs Stocks: How to Choose the Best Investment

How to choose between ETFs or stocks

Choosing between ETFs and stocks is not always straight forward as each brings its own traits to the investment decision. There are certain aspects that need to be considered. Below are a list of important factors to give attention to:

1. Goals

The first step in selecting an ETF or stock is to factor in investing objectives. What this means is that each trader will have certain exposure requirements regarding the trade. This relates to either a specific type of stock or a broader sector such as financial services or construction that may be represented by an ETF.

2. Risk appetite

Risk is an essential factor to consider before investing in any financial instrument. Investors will need to decide on how much risk to take on which should correlate to their current financial status and goals. Over-exposing oneself to excessive risk is not recommended and investors should stay within their financial means. It is often accepted that younger individuals are generally more risk-seeking whilst older investors tend to be more risk-averse, and considering timelines until retirement at which point nest eggs may need to be drawn from, that investment approach may make sense for many portfolios of investors getting more conservative with age.

3. Investment timescale

The length of the investment will vary depending on the investor’s requirements/goals and this can affect the investment decision between ETFs or stocks.

4. Investment budget

Each individual investor will have different investment budgets at their disposal. Ensuring that this budget is adhered to and not stretched is crucial to responsible investing.

Investing in ETFs or Stocks: A practical example

“I am an investor looking for long-term growth exposed to the technology sector with a high-risk tolerance and $1000 to invest.”

In this case, the investor may be more inclined to invest in an Exchange Traded Fund as opposed to various individual technology stocks as it would be cheaper to trade one product that gives the similar/same exposure to the desired market.

Because no individual technology company is guaranteed success, it can be beneficial to invest in a broad spectrum of technology stocks to compensate for any companies that fail long-term. The budget constraint in this case further supports ETF investment as multiple purchases of several stocks will deplete the investment budget more so than a single ETF purchase.

Selecting an ETF or stock can be tricky but, once an investor is aware of the differences between ETFs and stocks, they will be able to make informed investment decisions.

Top 8 differences between ETFs and Stocks

ETFs Stocks
1. Diversification Yes No
2. Liquidity Lower Higher
3. Price risk Lower Higher
4. Potential Reward Lower Higher
5. Sector Access Higher Lower
6. Tax Location dependant Location dependant
7. Control of investment Lower Higher
8. Cost Higher Lower

1. Diversification

ETFs provide greater diversification as opposed to individual stock investing. This is one of the most attractive features of ETFs as it includes a variety of stocks under one instrument. Some traders prefer to isolate their exposure to one stock which then moves away from ETF trading and toward single stock trading.

2. Liquidity

Liquidity refers to the ease at which assets can be converted to cash. Generally stock liquidity is seen as higher than that of ETFs as the volume of one company is easier to determine than that of multiple stocks within an ETF. However, there are some stocks that are less liquid than certain ETFs. Liquidity rarely presents issues for the average investor but may arise for large buyers or sellers.

3. Risk

Because of diversification, ETFs have the risk spread out throughout the different stock constituents. This is not true for all ETFs as certain commodity tracking ETFs can have similar risks as a single stock.

4. Potential Reward

Generally, stocks are seen to carry greater potential reward as returns are not diluted by diversification. This being said, potential loss would also carry the same weight. It is important to keep in mind that less risk usually carries less reward and vice versa. This then ties in with trader goals and risk appetite as mentioned above.

5. Sector Access

Sector access ties in with diversification whereby investors can gain access to a broad sector of stocks under one investment vehicle. ETFs have grown exponentially since inception which saw the introduction of sub-sector ETFs for even more specificity.

6. Tax

Tax can be tricky to differentiate for ETFs and stocks as these are dependent on the applicable jurisdiction. Investors will need to clarify tax implications before investing to avoid potentially exorbitant tax costs.

7. Control of investment

Investing in stocks gives the investor 100% control of what is being invested in and precisely how much is allocated to each stock. ETFs may outline initial weightings of the fund but this can change based on share price fluctuations or economic outlook.

8. Cost

ETFs often come with increased cost due to management fees associated with the fund. Stocks and ETFs usually have a commission charge attached to each purchase and sale. This makes stock investing cheaper in a general sense given the inclusion of ‘expense ratios’ with ETFs. With numerous brokers to choose from the cost aspect of ETFs vs stocks will vary due to the increased competition amongst brokers.

Should you invest in ETFs or Stocks?

The choice between investing in ETFs and stocks should be made with the investor’s goals and risk appetite in mind. What may work for one investor may not be the same for another. Knowing the difference between ETFs and stocks will guide traders to the most appropriate conclusion. Through research is important however, selecting a suitable broker is equally critical.

U.S. Q4 GDP Growth Slightly Misses Mark at 3.2%

U.S. Q4 GDP Growth Slightly Misses Mark at 3.2%

GDP Growth Nears Estimates

The U.S. economy’s growth in the fourth quarter of 2023 slightly underperformed against pre-report expectations, with real Gross Domestic Product (GDP) rising at an annual rate of 3.2%. This figure, as per the Bureau of Economic Analysis’ second estimate, is marginally below the anticipated 3.3% increase. The growth represents a deceleration from the 4.9% expansion seen in the third quarter.

Drivers of Economic Expansion

Key contributors to this quarter’s GDP growth included robust consumer spending, increased exports, and heightened spending by state and local governments. Additionally, both residential and nonresidential fixed investments showed positive trends. However, a notable downturn in private inventory investment partially offset these advances.

Sectoral Shifts and Revisions

The GDP’s composition this quarter showed interesting shifts. The downturn in private inventory investment and a slowdown in federal government spending, residential fixed investment, and consumer spending compared to the third quarter were significant factors in the overall GDP deceleration. The second estimate also presented upward revisions in consumer and government spending.

Economic Indicators and Personal Income

In current dollar terms, GDP increased by 4.9% or $334.5 billion in the fourth quarter, reaching a level of $27.94 trillion. Personal income trends also displayed interesting dynamics, with a notable increase in disposable personal income, although slightly revised downwards from previous estimates.

Short-Term Market Outlook

Considering the solid GDP growth rate close to expectations, along with the upward momentum in consumer spending and government expenditure, the short-term outlook for the U.S. market appears moderately bullish. The economy’s resilience, despite a slowdown in private inventory investment, suggests underlying strength. However, traders should closely monitor upcoming economic data for more definitive signals of sustained growth momentum

Bitcoin (BTC) News Today: MicroStrategy Boosts Confidence Amid BTC Rally

Bitcoin (BTC) News Today: MicroStrategy Boosts Confidence Amid BTC Rally

BTC-Spot ETF Market Flows Extend BTC Winning Streak to Four Sessions

On Tuesday, BTC gained 4.74%. Following a 5.35% rally on Tuesday, BTC ended the session at $57,044. Significantly, BTC held onto the $57,000 handle for the first time since December 1, 2021.

BTC-spot ETF market flow data for February 26 (Monday) sent BTC toward the $60,000 handle. Total inflows jumped from $232.3 million on February 23 (Friday) to $519.8 million (Monday).

Fidelity Wise Origin Bitcoin Fund (FBTC) led the way, with net inflows of $243.3 million. ARK 21Shares Bitcoin ETF (ARKB) saw net inflows of $130.6 million, leaving iShares Bitcoin Trust (IBIT) in third place. IBIT ranked third by net inflows for the first time since the launch of the Nine on January 11.

BTC-spot ETF market net inflows surged on Monday, February 26.

Bloomberg Intelligence Senior ETF Analyst Eric Balchunas shared trading volumes for the February 27 session, saying,“Another intense volume day for the Nine with well over $2b traded. $IBIT broke its personal record again w/ $1.3b (for context that’s more than most large cap US stocks trade). I don’t know if this is a new normal or some kind of short-term algo/arb-related burst a la HODL.”Balchunas also shared trade data for IBIT, noting that IBIT had over 100,000 trades, up from the 30-60k range since launch.

Looking for BTC trends for the Wednesday session, early BTC-spot ETF flow data for February 27 showed a marked increase in net outflows for the Grayscale Bitcoin Fund (GBTC). GBTC saw net outflows of $126 million, up from $22.4 million on February 26.

According to figures from Farside Investors, net inflows were down to $54.1 million on February 27, excluding IBIT and BTCO numbers. IBIT net inflows must impress to keep the momentum.

While BTC-spot ETF market flow data remains the focal point, MicroStrategy (MSTR) news contributed to the Tuesday gains.

MicroStrategy Acquires More BTC in a Sign of Confidence

On Monday, MicroStrategy founder and Chairman Michael Saylor announced the acquisition of 3,000 BTC for approximately $155 million at an average price of $51,813 per bitcoin. The purchase took the total BTC holding to 193,000 BTC, acquired for about $6.09 billion at an average purchase price of $31,544.

MicroStrategy has been on a tear this week, rallying by 9.46% on Tuesday after surging 15.86% on Monday. MSTR is enjoying a positive start to 2024. After rising by 346.15% in 2023, MSTR was up 38.03% year-to-date on Tuesday, February 27. By comparison, NVIDIA (NVDA) is up 58.92% in 2024 after gaining 238.87% in 2024.

MSTR enjoyed a breakout start to the week.

Technical Analysis

Bitcoin Analysis

BTC remained well above the 50-day and 200-day EMAs, sending bullish price signals.

A BTC breakout from the $57,000 resistance level and the Tuesday high of $57,612 would give the bulls a run at $60,000.

BTC-spot ETF market flow data need consideration.

However, a fall through the $55,000 handle would give the bears a run at the $53,000 support level.

The 14-Daily RSI reading, 80.61, shows BTC in overbought territory. Selling pressure may intensify at the Tuesday high of $57,612.

BTC Daily Chart sends bullish price signals.

BTCUSD 280224 Daily Chart

Ethereum Analysis

ETH sat well above the 50-day and 200-day EMAs, sending bullish price signals.

An ETH break above the Tuesday high of $3,287 would give the bulls a run at the $3,350 handle.

ETH-spot ETF-related chatter warrants investor attention.

However, an ETH fall through the $3,200 support level would bring the $3,000 handle into view.

The 14-period Daily RSI at 81.55 shows ETH in overbought territory. Selling pressure may intensify at the Tuesday high of $3,287.

ETH Daily Chart sends bullish price signals.
ETHUSD 280224 Daily Chart
EUR/USD, GBP/USD, DXY Price Forecast: Market Braces for US GDP Insights

EUR/USD, GBP/USD, DXY Price Forecast: Market Braces for US GDP Insights

USD Dynamics: Awaiting GDP Data Amid Durable Goods Orders Decline

The US Dollar sees slightly positive movements despite the release of data indicating a sharper than expected decline in Durable Goods Orders for January, potentially signaling a cooling in economic activity.

This sets a cautious tone as markets anticipate the upcoming Prelim GDP q/q figures, expected to hold steady at 3.3%, alongside the Prelim GDP Price Index q/q, forecasted at 1.5%.

These figures are crucial for gauging the US economy’s resilience and could influence Federal Reserve policy directions moving forward.

Events Ahead:

  • Anticipation builds for the Prelim GDP and GDP Price Index data, providing insights into economic growth and inflation trends.
  • The Goods Trade Balance and Prelim Wholesale Inventories data are also on the horizon, offering further clarity on the US economic landscape.
  • Additionally, the financial world turns its eyes towards the G20 Meetings and MPC Member Mann’s speech, potentially impacting market sentiment and currency valuations.

US Dollar Index (DXY)

Dollar Index
Dollar IndexThe Dollar Index’s has witnessed a modest uptick, climbing by 0.26% to stand at 103.667, signaling bullish momentum as it surpasses the pivot point of 103.536. The immediate resistance levels are positioned at 104.008, 104.304, and 104.595, potentially capping further gains.

On the downside, support is found at 103.269, 102.941, and 102.711, which are crucial for maintaining the dollar’s upward trajectory.

The 50-day and 200-day Exponential Moving Averages, at 103.60 and 103.40 respectively, provide a tight range, indicating a possible breakout from the downward trendline.

EUR/USD Technical Forecast

EUR/USD Price Chart - Source: Tradingview
EUR/USD Price Chart

The 50-day and 200-day Exponential Moving Averages, closely aligned at 1.0817 and 1.0824 respectively, offer additional insights into the pair’s direction, emphasizing the bearish sentiment below the critical 1.0840 mark.

GBP/USD Technical Forecast

GBP/USD Price Chart - Source: Tradingview
GBP/USD Price Chart
The GBP/USD pair has seen a decrease, moving down by 0.31% to trade at 1.2645, indicating a bearish momentum as it falls below the day’s pivot point of 1.26612. Resistance levels are identified at 1.26992, 1.27279, and 1.27586, which could limit upward movements.

Conversely, support at 1.26255, 1.25898, and 1.25536 will be crucial for the pair to prevent further declines. The 50-day and 200-day Exponential Moving Averages, at 1.26501 and 1.26437 respectively, are closely aligned, suggesting a potential shift in market dynamics.

The breakout from the upward trendline underscores a bearish outlook, indicating that GBP/USD may face downward pressure below the 1.26612 mark.

Natural Gas and Oil Analysis: OPEC+ Deliberations Tighten Supply, WTI at $78.50

Natural Gas and Oil Analysis: OPEC+ Deliberations Tighten Supply, WTI at $78.50

Oil and Gas Dynamics: Rate Cuts, Inventories, and OPEC+ Strategy Impact Markets

Oil prices experienced a slight movement  in Asia on Wednesday due to concerns over a possible delay in the U.S. interest rate cut and an increase in U.S. crude inventories. This slowdown in uptrend came despite the potential for extended output cuts by OPEC+.

Federal Reserve officials have indicated a cautious stance towards cutting rates, emphasizing the need to control inflation, which could impact economic expectations for lower rates.

Moreover, a significant increase in U.S. crude stocks was reported, alongside developments towards a ceasefire in Gaza. If OPEC+ extends its output cuts, it could further tighten the oil market.

Additionally, Russia announced a six-month ban on gasoline exports to meet domestic demand and facilitate refinery maintenance, potentially influencing global oil and natural gas market dynamics.

Natural Gas Price Forecast

Natural Gas Price Chart
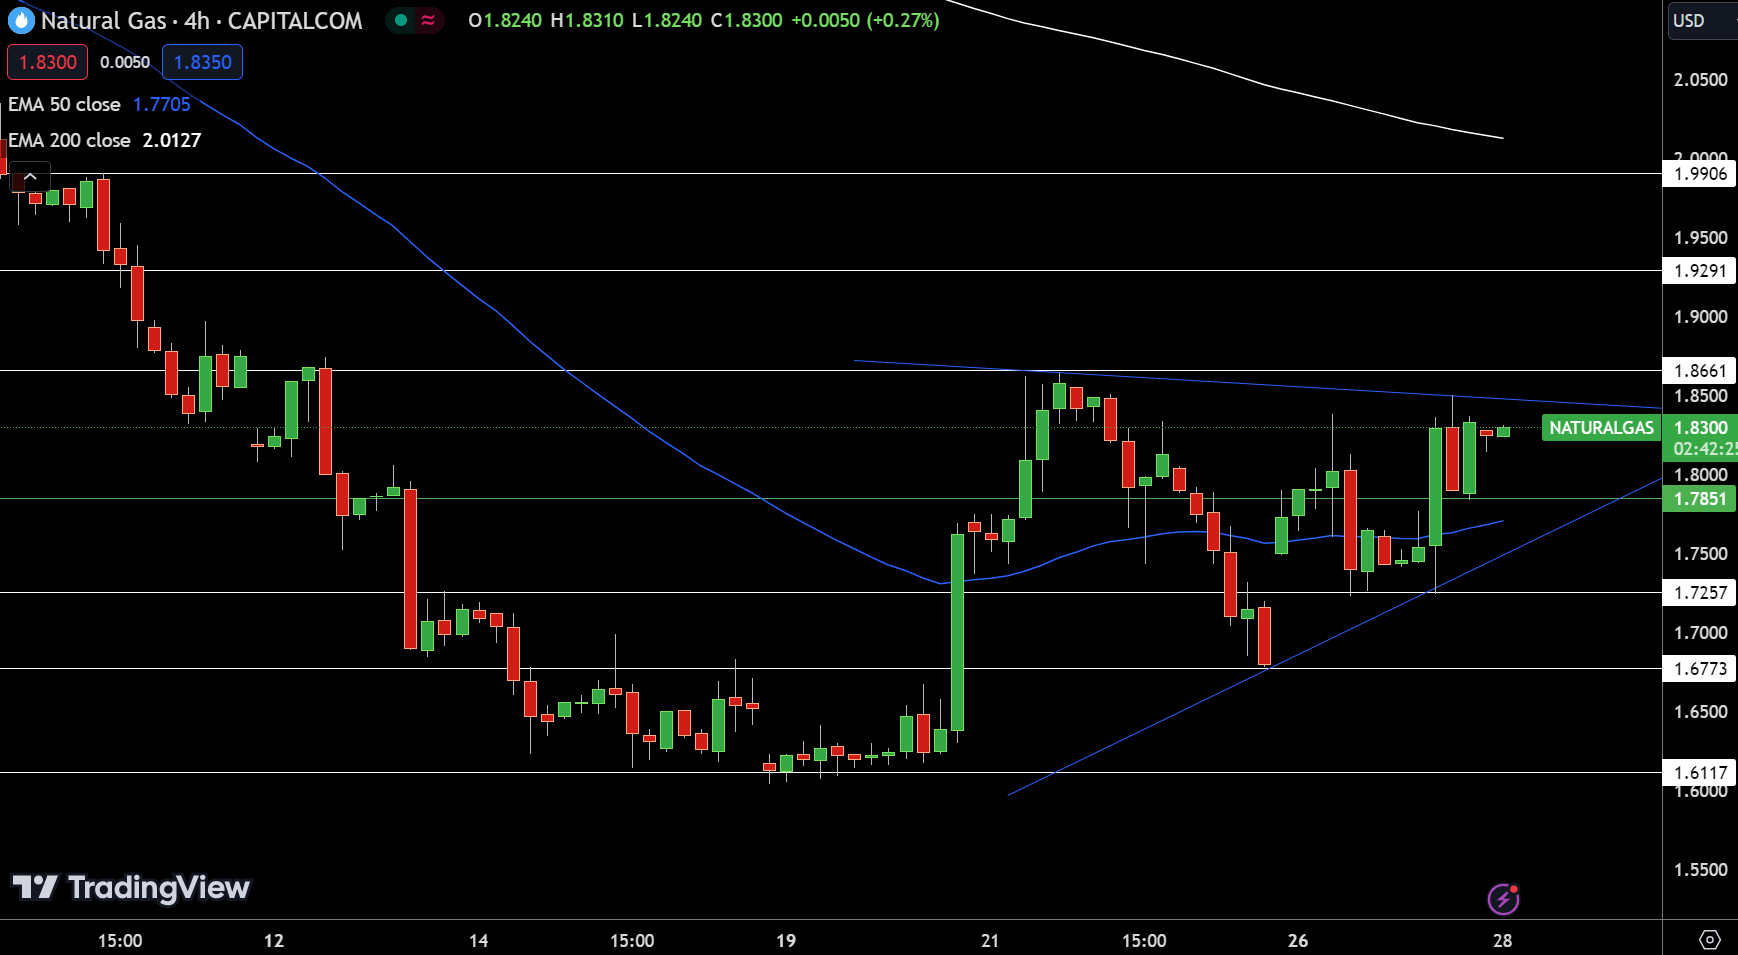
Natural Gas Price ChartNatural Gas (NG) prices slightly receded, marking a -0.16% change, landing at $1.8300 in today’s session. The 4-hour chart delineates a pivot point at $1.7851, suggesting a bullish sentiment above this level. Key resistance points are established at $1.8661, $1.9291, and $1.9906, potentially capping upward movements.

On the flip side, immediate support is identified at $1.7257, with further floors at $1.6773 and $1.6117, which could act as buffers in case of a pullback.

The 50-day and 200-day Exponential Moving Averages, positioned at $1.7705 and $2.0127 respectively, indicate a bullish outlook if prices remain above the pivot, hinting at an upward trajectory for Natural Gas.

WTI Oil Price Forecast

WTI Price Chart
WTI Price Chart

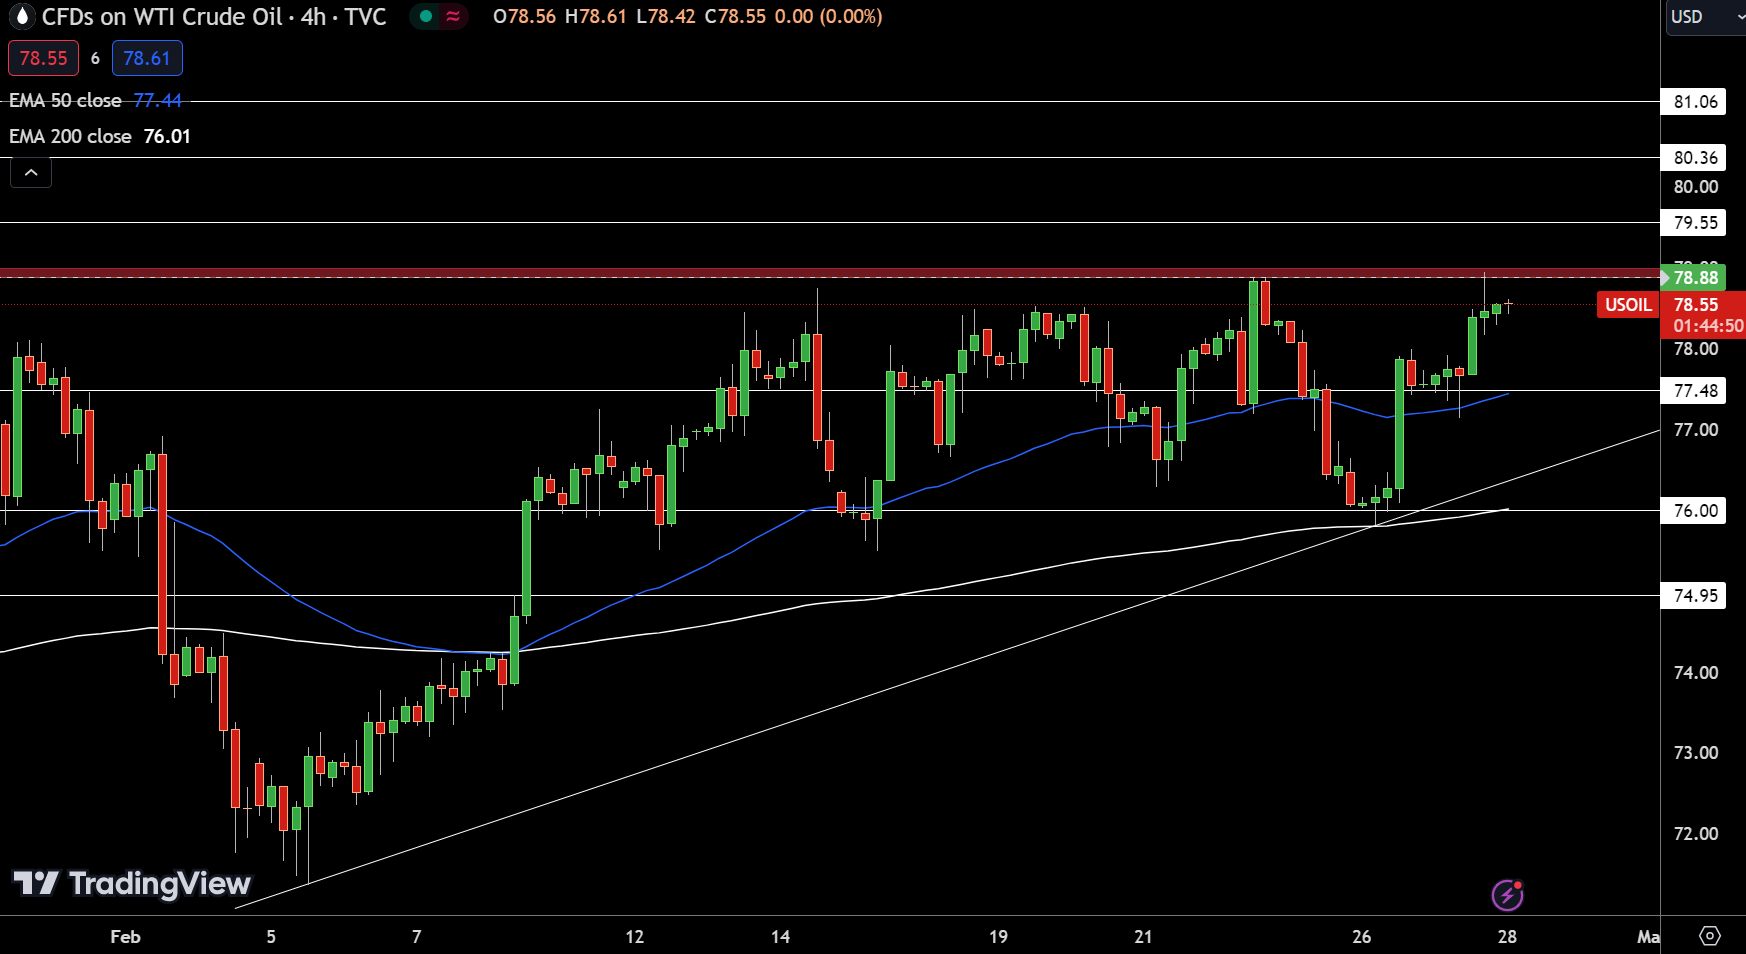
Conversely, support levels are clearly defined at $77.48, $76.00, and $74.95, which may offer buying opportunities should prices dip. The 50-day and 200-day Exponential Moving Averages, standing at $77.44 and $76.01 respectively, underscore the current market stability.

However, the bearish sentiment below the $78.88 triple top pattern warrants close monitoring, suggesting a strategic approach for potential shifts in trend.

Brent Oil Price Forecast

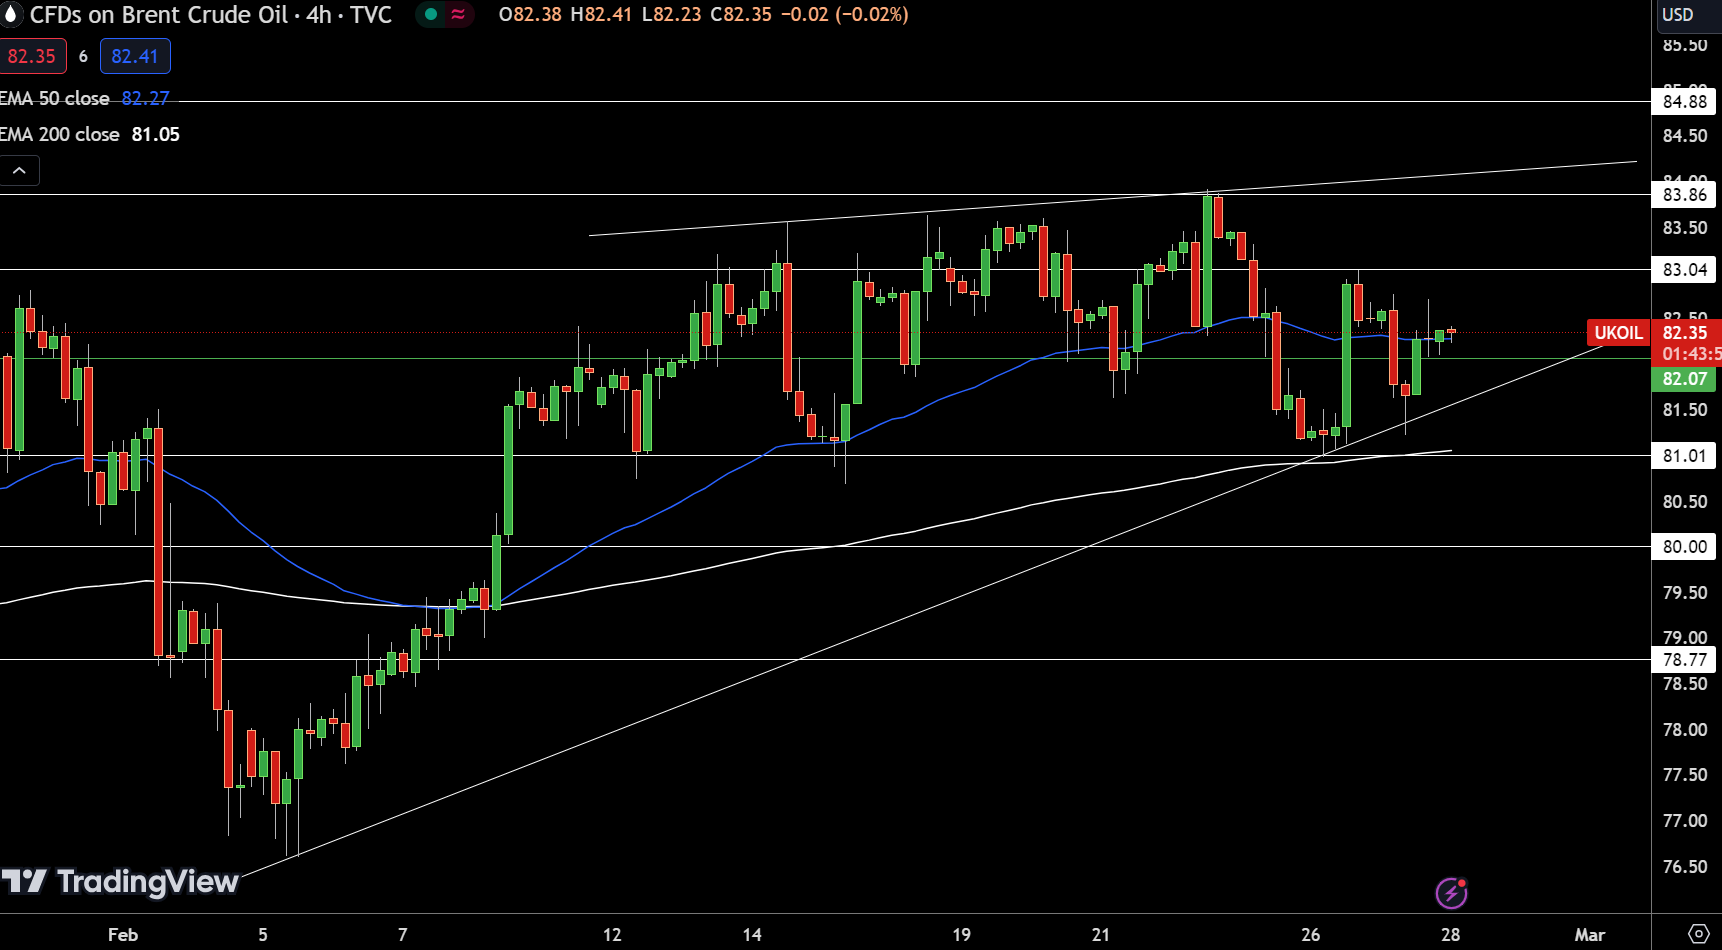
UKOIL Price Chart
UKOIL Price Chart

The Market News Today: Apple Drops EV Project for AI Focus

The Market News Today: Apple Drops EV Project for AI Focus

1. Apple Cancels Self-Driving Electric Car Project Amid Shift to AI Focus

Apple reportedly abandons its plans for electric vehicles (EVs) after a decade ofspeculation. The project, never publicly acknowledged, involved thousands of employees. Many will transition to the tech giant’s artificial intelligence (AI) division. The move underscores a strategic pivot towards AI amid sluggish EV demand. While Apple explores new frontiers like its Vision Pro virtual reality headset, industry analysts emphasize the burgeoning market for AI in consumer electronics. The decision aligns with a broader trend of tech firms reallocating resources to high-growth areas. (BBC Business)

2. BlackRock’s iShares Bitcoin ETF Surges to $1B in Daily Volume, Shattering Records

BlackRock’s iShares Bitcoin Trust recently achieved a remarkable milestone by surpassing $1 billion in daily trading volume. This surge in activity propelled the fund to 11th place among all ETFs in daily trading volume and into the top 25 stocks overall. The fund, one of 10 approved U.S. spot Bitcoin ETFs, has dominated with $7.1 billion in inflows since its approval. On Monday, it represented 41% of the total volume across similar ETFs. This heightened activity in Bitcoin ETFs, including BlackRock’s, aligns with growing investor interest ahead of Bitcoin’s halving event in April, expected to reduce new Bitcoin supply, thereby increasing its appeal. Total spot Bitcoin ETF volume recently exceeded $3.24 billion, setting a new industry record. (DLNews)

3. Starbucks and Workers’ Union Agree to Negotiations in Historic Development

Starbucks and the union representing its US workers have agreed to engage in talks aimed at securing labor agreements, marking a significant breakthrough. The joint statement signals a shift from previous tensions since Workers United organized baristas in late 2021. With over 370 stores unionized, but no labor deals reached, the process has been contentious, leading to legal disputes. However, recent discussions have revealed a potential constructive path forward, including resolving ongoing litigation between the two entities. (The Guardian)

4. Goldman Sachs CEO Casts Doubt on US Economic Outlook

Goldman Sachs CEO David Solomon expressed skepticism about the US economy avoiding a recession despite apparent strength. Amidst robust GDP growth, a thriving job market, and soaring stock markets, concerns linger. Solomon cited softer consumer spending, geopolitical tensions, and potential delays in Fed rate cuts as factors contributing to uncertainty. With expectations for the Fed easing cycle pushed back and market conditions evolving rapidly, uncertainty prevails in the economic realm. (Business Insider)

5. China Expands State Secrets Law, Adding ‘Work Secrets’ Category

China strengthens national security by broadening the scope of its state secrets law to encompass a new category known as “work secrets.” President Xi Jinping signed off on revisions aimed at safeguarding confidential information, including unclassified data. Critics raise concerns over potential abuse and diminished transparency. The move comes amidst heightened global scrutiny of China’s security practices, impacting foreign business operations and adding complexities to the country’s economic environment. (CNBC)

Gold, Silver, Copper Daily Forecast: Market Eyes on Fed’s Next Moves and US Prelim GDP

Gold, Silver, Copper Daily Forecast: Market Eyes on Fed’s Next Moves and US Prelim GDP

Gold Stalls, Silver Dips, and Copper Eyes China PMI Data

Gold prices experienced a subdued movement, lingering within the $2,000 to $2,050 band amid concerns over the Federal Reserve’s stance on maintaining elevated interest rates. The robust dollar added pressure, yet gold sustained support above $2,000, reflecting ongoing safe-haven demand due to global economic uncertainties and geopolitical tensions.

Meanwhile, silver and platinum witnessed declines, with investors eyeing upcoming PCE inflation and GDP data for direction. Copper also retreated slightly, with its recent rally facing scrutiny ahead of China’s PMI releases, set to shed light on the country’s economic activity.

This confluence of factors underscores a cautious outlook for precious and industrial metals.

Gold Prices Forecast

Gold - Chart
Gold – ChartGold experienced a minor retreat in its price, trading at $2030.73 with a decrease of 0.14%. The current trajectory situates gold slightly below the pivot point of $2029.80, implying a potential for a bullish trend should it surpass this marker.

Resistance levels are delineated at $2039.47, $2048.31, and $2059.16, indicating the thresholds for further gains. Conversely, support is established at $2016.22, $2005.35, and $1989.35, marking areas where buyers could potentially step in.

With the 50-day and 200-day Exponential Moving Averages at $2026.49 and $2025.37 respectively, gold’s outlook remains cautiously optimistic, poised for an uptrend above $2029.80.

Silver Prices Forecast

Silver - Chart
Silver – Chart

Silver’s market performance showed a slight decline, trading at $22.42, down by 0.40% over the last four hours. This movement positions silver below its pivot point of $22.57, signaling a bearish trend under this level. Resistance levels are identified at $22.75, $23.00, and $23.19, which could cap gains.

Conversely, support levels are marked at $22.32, $22.16, and $21.93, potentially cushioning further drops. The 50-day and 200-day Exponential Moving Averages, at $22.73 and $22.85 respectively, hover above the current price, reinforcing the bearish sentiment.

In essence, silver’s trajectory remains bearish unless it surpasses the pivotal $22.57 mark.

Copper Prices Forecast

Copper - Chart
Copper – ChartCopper‘s trading session witnessed a modest decline, trading at $3.84, marking a 0.26% decrease. This subtle movement aligns with the metal’s pivotal threshold set at $3.85, indicating a bearish sentiment below this benchmark.

Resistance levels at $3.88, $3.91, and $3.94 delineate potential barriers to upward momentum, whereas support at $3.81, $3.78, and $3.75 offers floors for price stabilization.

The convergence of the 50-day and 200-day Exponential Moving Averages at $3.85 and $3.82, respectively, suggests a tight trading range. In summary, Copper’s market posture leans towards a cautious outlook, with a bearish trend anticipated below the $3.85 pivot.

For a look at all of today’s economic events, check out our economic calendar.