Asia Market News: RBNZ Governor Orr Sinks the Kiwi

Asia Market News: RBNZ Governor Orr Sinks the Kiwi

Aussie Monthly CPI Indicator Curbs Bets on an RBA Rate Hike

On Wednesday, the Australian Monthly CPI Report drew investor interest before US inflation numbers on Thursday. The Australian annual inflation rate remained at 3.4% in January. Economists forecast an inflation rate of 3.6%. An upward trend in consumer price inflation may have prompted the RBA to consider a hike in interest rates come March.

The softer-than-expected numbers likely reduced bets on an RBA rate hike. However, persistent inflationary pressures may keep the RBA in a holding pattern through the first half of 2024.

According to the ABS,

  • Housing (+4.6%), food & non-alcoholic beverages (+4.4%), alcohol & tobacco (+6.7%), and insurance and financial services (+8.2%) were the main contributors.
  • Prices for food and non-alcoholic beverages rose, with the annual inflation rate up from 4.0% in December.
  • The annual inflation rate for insurance and financial services was unchanged at 8.2%.
  • However, inflation rates for housing (Dec: 5.2%) and alcohol & tobacco softened (Dec: 6.8%), albeit modestly.

The Monthly CPI Indicator excluded holiday travel, fruit & vegetables, and automotive fuel. Notably, prices for automotive fuel increased by 3.1% in the 12 months to January, down from 5.3% in the 12 months to December.

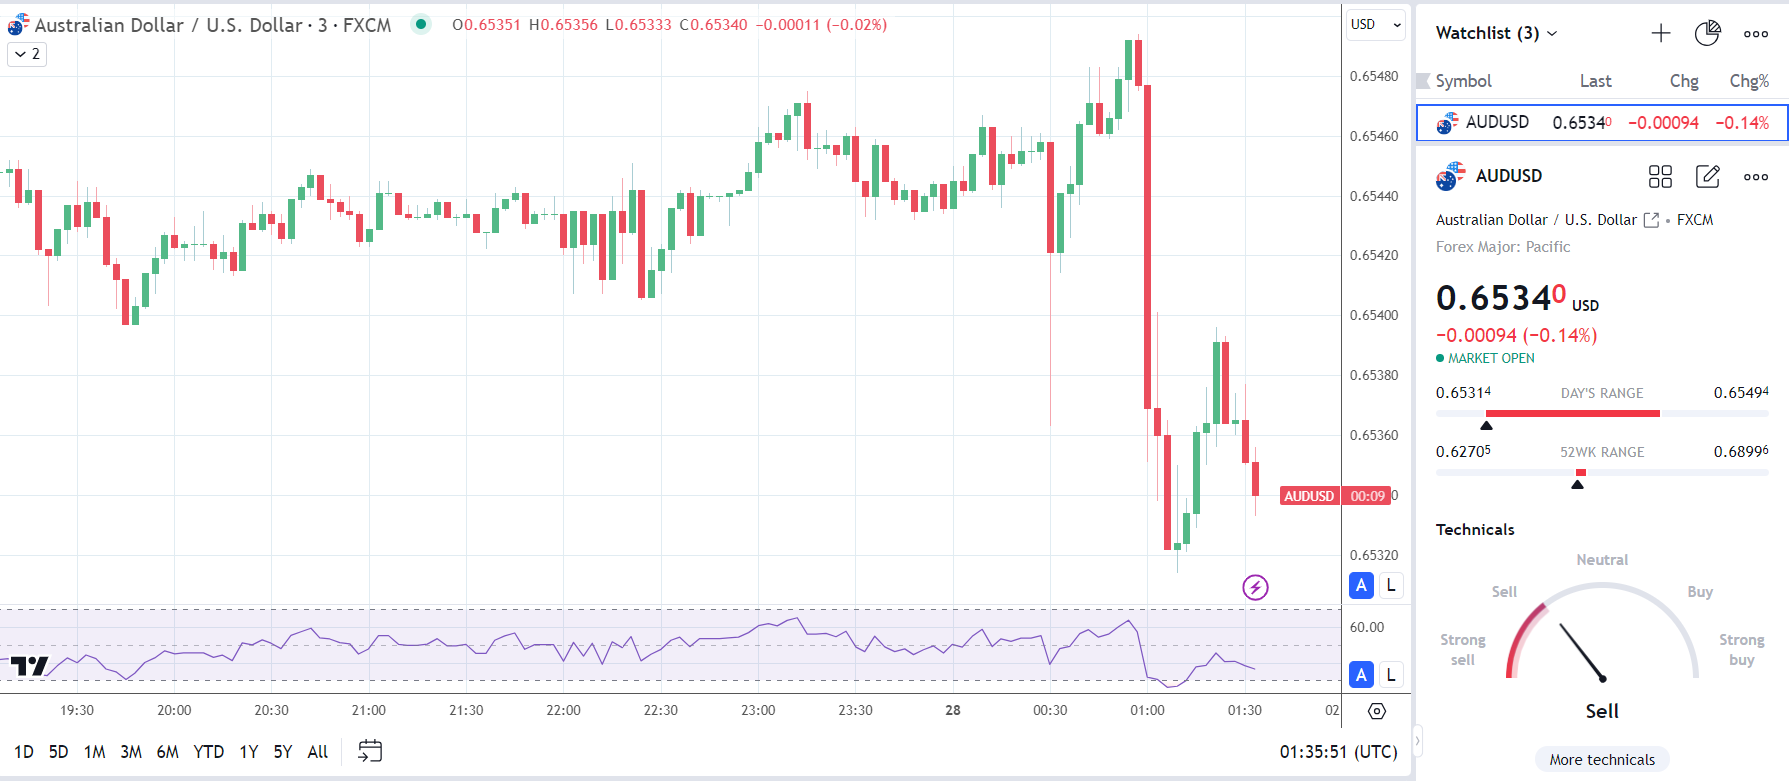
On Wednesday, the AUD/USD was down 0.14% to $0.65340. The Aussie dollar responded to the Monthly CPI Indicator, sliding to a session low of $0.65314.

AUD/USD reacts to the Aussie CPI Monthly Indicator.
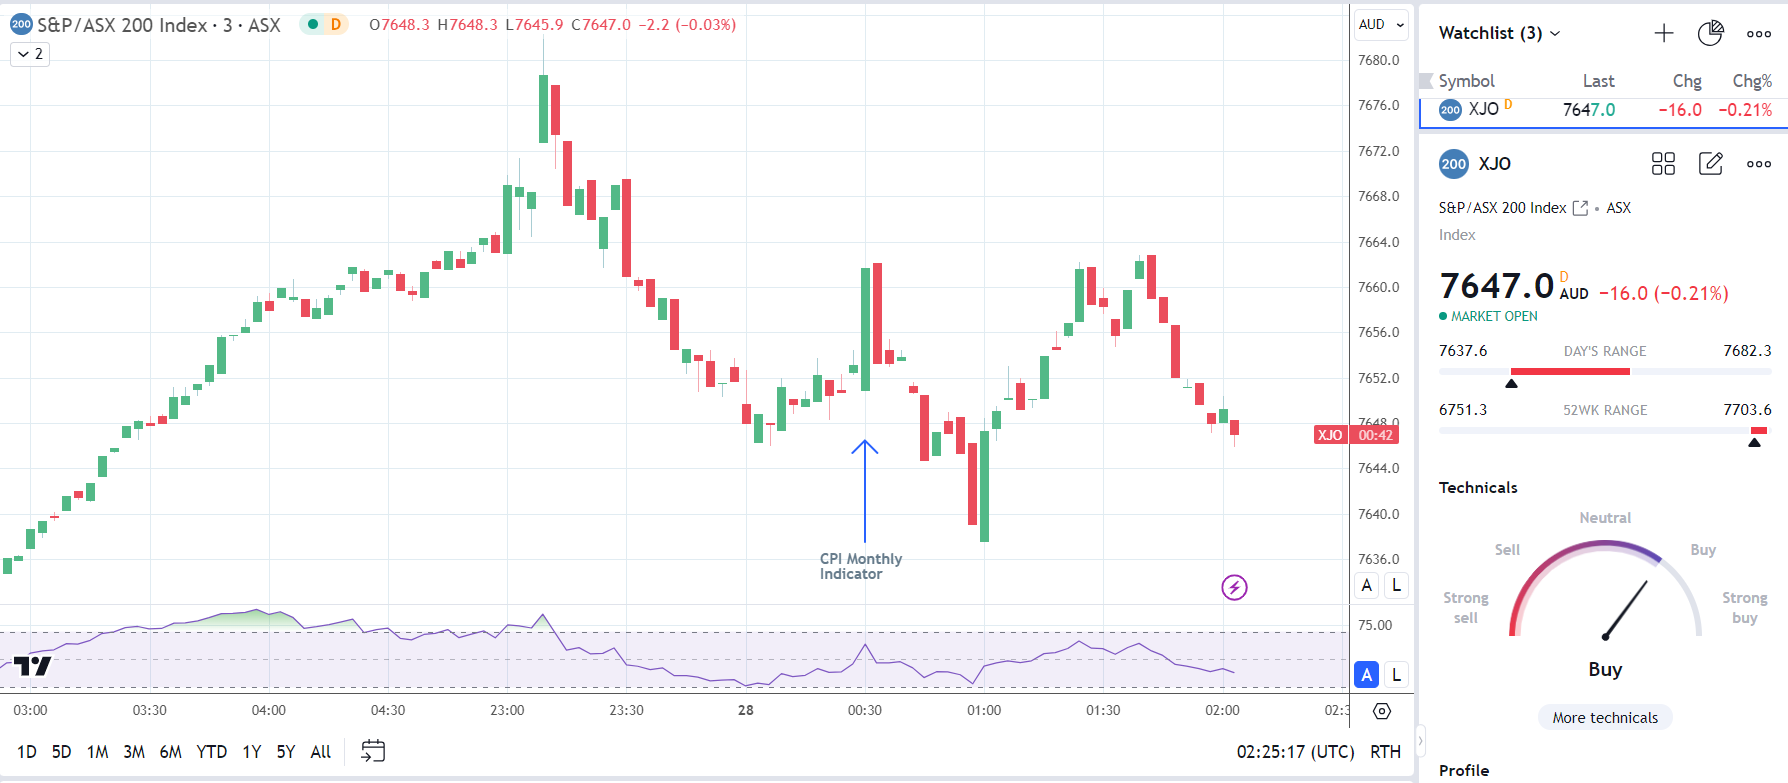
AUDUSD 3 Minute Chart 280224The ASX 200 responded positively to the softer inflation numbers before falling into negative territory. On Wednesday, the ASX 200 was down 0.21% to 7,647.0. Losses across the big four banks overshadowed gains across the mining sector, leaving the ASX 200 in negative territory.

BHP Group Ltd (BHP) and Rio Tinto Ltd. (RIO) were up 0.02% and 0.48%, respectively. Fortescue Metals Group Ltd. (FMG) rose by 0.72%.

Softer than expected inflation fails to comfort ASX-listed stocks.
ASX200 3 Minute Chart 280224

RBNZ Keeps the Cash Rate at 5.50% But Sinks the Kiwi Dollar

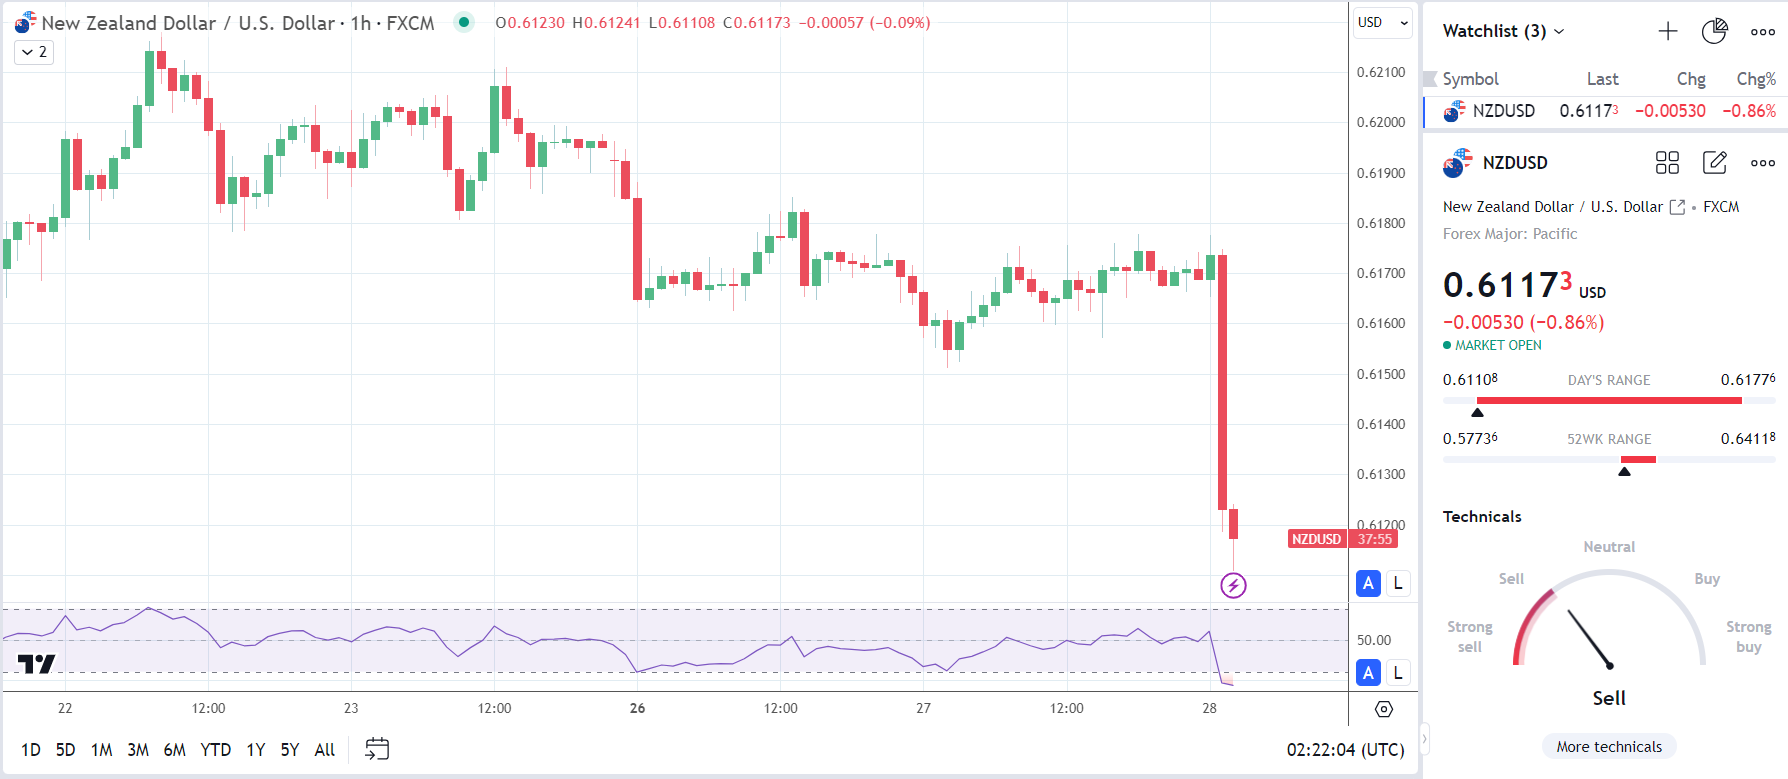
However, the NZD/USD suffered heavier losses, sliding 0.86% to $0.61173. The RBNZ held the cash rate at 5.50% on Wednesday but delivered a less hawkish stance. RBNZ Governor Adrian Orr said that risks to the inflation outlook had become more balanced, crashing the Kiwi dollar to a session low of $0.61108.

RBNZ sinks the NZD/USD
NZDUSD Hourly Chart 280224

The Asian Equity Markets

In the equity markets, the Hang Seng Index and the Nikkei were down 0.38% and 0.17%, respectively. Caution prevailed as investors await US inflation numbers on Thursday and lawmakers gathering in Beijing next week to discuss the Chinese economy and policy.

Currency Volatility: What is it & How to Trade It?

Currency Volatility: What is it & How to Trade It?

What is Volatility in Currency Trading?

Volatility in forex trading is a measure of the frequency and extent of changes in a currency’s value. A currency might be described as having high volatility or low volatility depending on how far its value deviates from the average – volatility is a measure of standard deviation. More volatility means more trading risk, but also more opportunity for traders as the price moves are larger.

Below is a chart comparing Bitcoin/US Dollar and New Zealand Dollar/US Dollar, with the orange line for each showing the Average True Range (ATR), a common measure of volatility. As the ATR values for each asset demonstrate, NZD/USD is a stable currency pair, and BTC/USD is much more volatile.

Chart to show volatility of Bitcoin vs NZD/USD

How to Identify Currency Volatility

Currency volatility is difficult to identify and track because volatility is, by its very nature, unpredictable. But there are some methods of measuring volatility that can help traders predict what might happen.

There are also two types of volatility that need to be addressed for an accurate measure – historical volatility and implied volatility. Historical volatility has already happened, and implied volatility is a measure of traders’ expectations for the future (based on the price of futures options).

You can view historical volatility in charts, where you can clearly see spikes and troughs in prices. For implied volatility, traders can use the four CBOE indices that measure the market’s expectations in relation to currency volatility.

Trading High Volatility Currencies vs Stable Currencies

With some of the most volatile currency pairs, traders should expect frequent fluctuations. Major currency pairs tend to be more stable than emerging market currency pairs; the more liquid currency pairs tend to have less volatility. Some of the most volatile currency pairs are:

  • USD/ZAR (United States Dollar/South African Rand)
  • USD/MXN (United States Dollar/Mexican Peso)
  • USD/TRY (United States Dollar/Turkish Lira).

AUD/JPY Volatility

AUD/JPY is another pair that has historically been considered volatile. The below chart shows the asset’s price movement, again alongside ATR. The circled portion is just one example of where ATR hit new heights as the AUD/JPY rate fell rapidly.

Chart to show AUDJPY volatility and Average True Range

Examples of currencies traditionally seen as having low volatility are:

You might use different indicators when trading high and low volatility currencies. For lower volatility currencies, you can look to use support and resistance levels. These show where the forex market has moved up and pulled back again, so they can be used to trade by helping you predict the market’s movements. You can set your stop loss at a level you are comfortable with to ensure your losses don’t mount up.

This may be more difficult to do with volatile currencies as their price changes can be erratic. These are some of the indicators you can use to trade them:

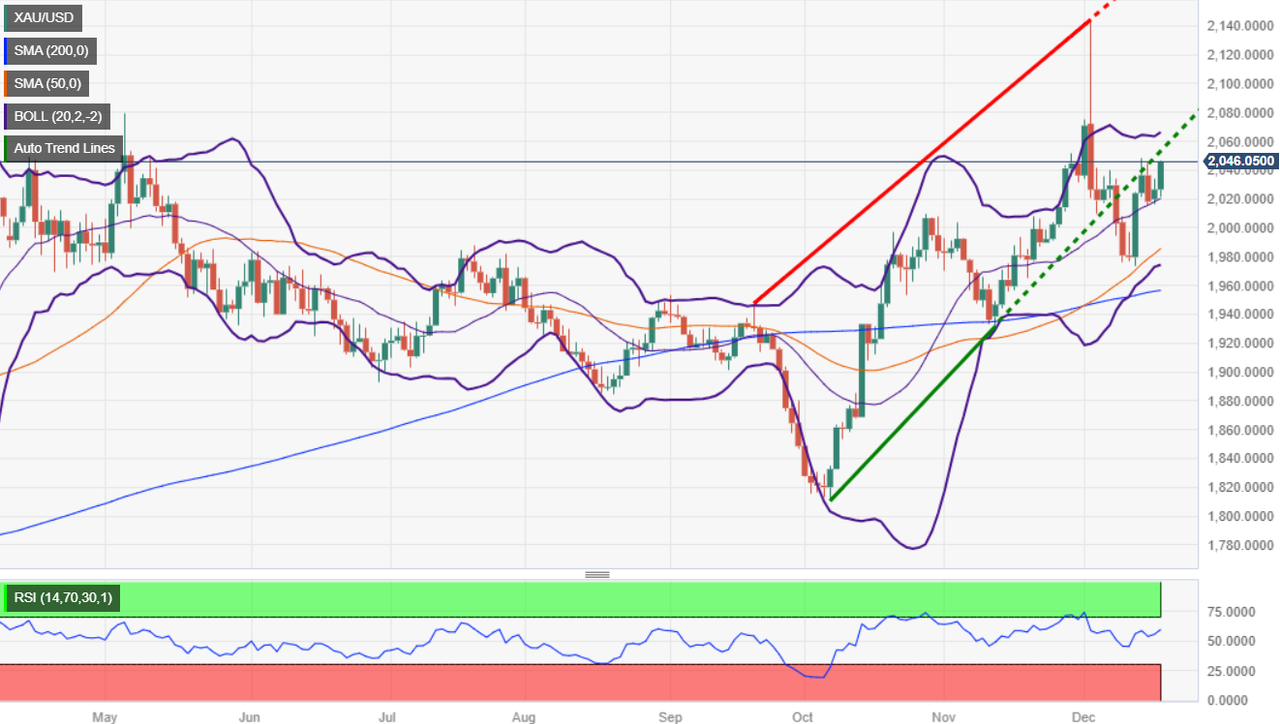
  • Bollinger Bands: These can be used to indicate if a market is overbought or oversold, increasing the chance of prices beginning to move in the opposite direction
  • Average True Range: This is used as a measure of volatility, and it can be applied to trade exit methods with a trailing stop to limit losses
  • Relative Strength Index: You can use this to measure the magnitude of price changes, again indicating whether a currency has been overbought or oversold so you can decide on your position.

Knowing the Difference Between Volatility and Risk

There are some distinct differences between volatility and risk. Volatility is out of your control, whereas risk is not; with the latter, you can decide exactly how much you are willing and able to manage. However, the relationship between the two is strong. Trading volatile currencies always carries risk because prices could move sharply in any direction, at any time. This large swing can magnify losses as well as gains.

One common pattern that emerges in forex trading involves a degree of herd mentality – traders decide to take a chance on a volatile market, largely influenced by the fact that other traders are taking the same action. In the event of a market crash, traders may sell at a lower price, potentially incurring big losses. You always need to be fully aware of risks and weigh up the pros and cons of any trade, especially when a market is volatile. Never take a risk based on popular opinion and use your own judgment, employing your personal risk management strategy to make sure you trade with a level of risk you can afford.

Forex Volatility Trading Tips

There are some specific forex volatility trading strategies and tips you can use. These will help you to make the most of your trades but, importantly, they will also help you minimize risk so you can protect yourself against heavy losses. Volatile markets are always risky, so one of the most important things you can do is have a strategy in place and stick to it.

Forex volatility trading tips:

  1. Trade using charts and indicators
  2. Trade around news and events
  3. Use stop losses
  4. Keep position size low
  5. Adhere to your forex trading strategy
  6. Keep a trading journal
 Trade Using Charts and Indicators

As covered above, there are various technical indicators you can use to anticipate market sentiment and make predictions about future price direction. While not definitive, using charts and indicators will help you formulate your strategy and choose when to trade.

Trade Around News and Events

Following news and current affairs can alert you to events that might have an economic impact and affect the value of currency. Currency volatility will often coincide with political or economic turbulence, so a general awareness of news releases can be followed from the DailyFX economic calendar. Trading around news events is one way to sidestep volatile conditions.

Use Stop Losses

It is always good practice to use stop losses to minimize risk when trading and this becomes even more important when you are trading volatile currencies. Your stop losses will ensure that any losing trades can be accounted for beforehand and you can select a level of loss that is affordable for you in the worst-case scenario. This is especially important if you are trading with leverage, as your losses could be significant, and you could lose much more than you deposit.

Keep Position Size Low

There is the potential for big wins in volatile forex markets, but there is also the potential for big losses. Keeping your position size low is a prudent decision for any volatility trader. It’s advisable to ensure you risk no more than 5% of your account on open trades. This will give your position more room to move without rapidly depleting your funds.

Adhere to Your Forex Trading Strategy

Make sure you have a trading plan, and stick to it. Following your trading plan closely will help you to manage the swings of volatile markets.

Using the tips outlined in this piece and following your trading plan closely will help you navigate volatile markets and trade more consistently.

Keep A Trading Journal

Using a trading journal to keep a log of your trades is a very good habit to adopt. It’s especially valuable when you’re trading volatile forex markets, enabling you to look back on your trades so you can consider what worked and what you could have done differently. A well-maintained trading journal will help you to become a better trader through the continual process of self-evaluation, reflection and improvement.

What is Crude Oil? A Trader’s Primer to Oil Trading

What is Crude Oil? A Trader’s Primer to Oil Trading

WHAT IS CRUDE OIL AND WHAT IS IT USED FOR?

Crude oil, or petroleum, is a naturally-occurring fossil fuel and currently the world’s primary energy source. It is made from ancient organic matter and can be distilled into component fuels such as gasoline, diesel, and lubricants, each of which have a multitude of industrial applications.

The commodity is usually extracted from underground reservoirs through drilling, and the countries that produce the greatest volume of crude oil, as of 2019, are the USA, Russia, and Saudi Arabia.

To understand how crude oil relates to other energy resources and assets, as well as how to trade them, visit our Major Commodities page.

BRENT AND WTI CRUDE OIL EXPLAINED

The composition of crude oil varies by source, but two types are used to benchmark global prices. They are the United States’ West Texas Intermediate (WTI) and United Kingdom’s Brent crude. The differences between them are based on factors such as composition, extraction location and prices, but for more details, as well as how to trade each asset, see our WTI vs Brent comparison.

POWER PLAYERS IN THE CRUDE OIL MARKET

The Organization for Petroleum Exporting Countries (OPEC) was established in 1960. This body sets production quotas for its members, with the aim of reducing competition and keeping prices at profitable levels. OPEC is dominated by Kuwait, Qatar, Saudi Arabia (which controls the Strait of Hormuz), and the United Arab Emirates. While OPEC generally controls a large percentage of the oil supply, the US, as of 2019, is the world’s largest producer of oil.

Institutions that supply oil to the global market are made up of international oil companies, or IOCs, such as ExxonMobil, BP and Royal Dutch Shell. These are investor-owned and look to increase shareholder value through private interests. However, national oil companies, or NOCs, such as Saudi Aramco and Gazprom, are fully or majority-owned by a national government.

For more about the power players and their role in global oil production, see our 8 Surprising Crude Oil facts.

 HISTORY OF CRUDE OIL

The history of crude oil has seen many changes since the beginning of the century, when global supply was largely controlled by OPEC, but demand was driven by the US. With OPEC calling the shots and Asian demand rising rapidly, prices went from a cost per barrel of $25 for Brent and $27 for WTI in March 2001, to $140 for both types by June 2008, representing a price bubble.

However, the last decade has seen technological advancements and deregulation facilitate increased US shale oil production, leading to shift in power from OPEC to the US. Prices fell from $112 for Brent and $105 for WTI in June 2014, to under $36 for both by January 2016. OPEC responded by colluding with several countries – including Russia – to implement ‘production quotas’ designed to stabilize prices. These brought the cost per barrel back above $70 for Brent, and $65 for WTI, by April 2018.

The below chart shows some key landmarks in the price of US Crude this century and the reasons for the swings.

WTI CRUDE OIL (2000-2019)

WHAT AFFECTS CRUDE OIL PRICES?

Crude oil prices are affected mostly by supply and demand, which in turn are influenced by factors such as outages, OPEC production cuts, seasonality, and changing consumption patterns. For more on these and why they are essential fundamental factors to understand when trading the asset, see our guide to trading crude oil.

USD AND THE PRICE OF OIL

The US Dollar and oil have historically had an inverse relationship. When USD is weak, the price of oil has traditionally been higher in dollar terms. Since the US was for long periods a net importer of oil, rising oil price has meant the US trade balance deficit has risen since more dollars are required to be sent abroad. However, some believe this relationship follows less reliable patterns in modern times.

There is a more predictable link between the Canadian Dollar and oil prices. For example, as of 2019, Canada exports some three million barrels of oil and petroleum products per day to the US, meaning a huge demand for Canadian dollars is created. If US demand rises, more oil is needed, which often means oil prices rise, and could accordingly mean a fall in USD/CAD. Conversely, if US demand falls, oil prices may fall too, meaning demand for CAD drops in turn.

Reasons to Trade Crude Oil

Oil is a dynamic, volatile and liquid market – and stands as the most traded commodity in the world. Here’s more on the benefits of engaging with this asset.

  1. The volatile nature of trading this asset makes it a favorite of swing and day traders, who react to the latest oil pricing news. While the trading can be risky, some see the oil market as an opportunity in its purest form.
  2. Crude oil is a liquid market, traded in huge volume. This means trades can be opened and closed at the price points you want and at lower trading cost.
  3. Oil can be traded as part of a hedging strategy to mitigate against the effects of the asset’s volatility.
  4. Trading oil can be part of a diversified portfolio of commodities, stocks and bonds.
What is Gold? Understanding Gold as a Trader’s Commodity

What is Gold? Understanding Gold as a Trader’s Commodity

WHAT IS GOLD AND WHAT IS IT USED FOR?

Gold is a precious metal coveted throughout history for its vibrant color, malleability, and relative scarcity. It has industrial applications in electronics and computing, and is enduringly popular as a jewelry-manufacturing component. Gold has always been used as a monetary instrument, as well as a safe haven asset due to its tendency to retain or increase its value during periods of market turbulence.

HISTORY OF GOLD AS AN ASSET CLASS

For thousands of years, humans have placed a high premium on gold. It has represented the currency of some of the world’s most famed civilizations, such as the empires of Ancient Egypt and Rome. More recently, from the late 19th century up until the outbreak of World War One, the value of currencies have been anchored to a specific amount of gold.

Starting at the end of the World War Two, most of the planet’s largest economies operated within a financial system based on a set gold price, which was tied to the US Dollar. This only ended in 1971, when the US opted to stop aligning its dollar with the commodity.

While the precious metal no longer functions as an official currency, the gold price remains a highly influential element in financial markets and world economies.

WHAT AFFECTS GOLD PRICES?

The factors that affect gold prices include stability, supply and demand, central bank exposure, and volumes traded through ETFs.

Stability

As the bedrock financial instrument underlying global currencies, gold is considered a fairly secure asset. Its price tends to rise in times of turmoil, as governments and investors turn to it as a hedge against uncertainty. Inversely, gold prices usually drop in stable times, as riskier yet potentially more profitable avenues of investment become more viable.

Supply and demand

As with most assets on the open market, an excess of demand for gold (normally for jewelry-making, or manufacturing certain medical, industrial and technological products) drives up the gold price (assuming supply is constant). On the other hand, a weakening of demand often has the opposite effect on its value, sending the price lower (assuming supply is constant).

Central banks

Many of the world’s gold reserves are controlled by central banks within developed nations, in locations such as Europe and North America. As a result, these banks wield immense pricing power in global gold markets. If the banks suddenly increased or reduced their gold exposure at once, even slightly, this would have a magnified effect on the gold price. Central banks therefore rely on a joint (though unofficial) commitment to refrain from unilaterally engaging in large-scale gold sales that could destabilize global markets.

ETFs

While exchange traded funds are generally intended to mirror the gold price rather than influence it, many large ETFs hold a significant amount of physical gold. Therefore, the inflows and outflows from such ETFs can affect the metal’s price, by altering the physical supply and demand in the market.

HOW GOLD AFFECTS CURRENCIES

When it comes to gold’s relationship with currencies, its correlation with USD is a principal talking point as the US Dollar remains the benchmark pricing mechanism for gold. When the value of USD increases, gold becomes more expensive for other nations to purchase.

This ultimately causes demand to fall, which is why there’s generally an inverse relationship between the US Dollar and the gold price. Additionally, when the Dollar starts to lose its value, investors look to gold as a safe-haven alternative and this helps to push its price up.

The below chart shows this inverse relationship between the US Dollar Index and gold.

GOLD PRICES OVERLAID AGAINST THE US DOLLAR

Relationship between Gold and the US Dollar

Also, the value of gold is linked to the value of a nation’s imports and exports. Countries that export gold or have access to gold reserves will see their currencies strengthen when gold prices rise, due to the value of the country’s total exports increasing.

HOW CAN GOLD BE TRADED?

There are a number of ways to trade gold, as explained in our in-depth guide to gold trading. It can be purchased as a physical asset, traded using futures and options in the commodities market, or traded through an exchange traded fund or ETF. For more information on each of these, click on the link above. For more information on each of these, click on the link above.

Reasons to trade gold

Traders might consider trading gold because:

  • As a safe haven in times of economic turbulence, when it tends to hold its value or appreciate
  • To capitalize on a weak US Dollar, and hedge against inflation
  • To maintain a diverse portfolio of commodities, stocks, bonds etc.
The MACD Histogram and How It Works as a Buy/Sell Signal

The MACD Histogram and How It Works as a Buy/Sell Signal

The MACD as a Lagging Indicator

The MACD is an indicator that uses exponential moving averages (EMA) to determine trend strength along with entry points based on crossovers.

Traders who use the MACD indicator often are critical of the fact that it may signal an entry after the initial move has begun and therefore leave pips behind. As such, many traders wanting to enter a trade sooner dismiss it as a “lagging” indicator.

A lagging indicator is a technical indicator that uses past price data to formulate the actions of the indicator itself. Therefore, all indicators are lagging since they are computed on trading data that has already taken place and then factored in with what is occurring.

In the case of the MACD indicator, the most widely suggested entry signal is when the MACD line crosses over the signal Line in the direction of the trend. Since these two lines are simply two moving averages, by their very nature the crossover will not occur until the move itself is under way. Some traders prefer this method of suggested entry as it offers more confirmation that the move is more likely to continue in that direction however, the MACD histogram can offer an earlier signal to enter.

MACD Histogram: What does the Histogram Represent?

The histogram or “bar chart” included in the background of the MACD (see images below) displays the difference between the MACD and signal line. When the MACD is above the signal line, the bar is positive. When the MACD is below the signal line, the bar is negative. The actual height of the bar is the difference between the MACD and signal line itself.

MACD histogram:

MACD histogram formula

For more aggressive traders who are not interested in the additional confirmation and are simply looking for a possible early entry, they may prefer this less widely used suggestive entry signal based on the MACD histogram bars. This is because the histogram bars have a faster setting (9) than either the MACD line or the signal line, resulting in a timelier trigger – see MACD crossover vs MACD histogram below.

MACD crossover vs MACD histogram:

MACD histogram buy sell signal

Using MACD histograms to identify bullish/bearish biases

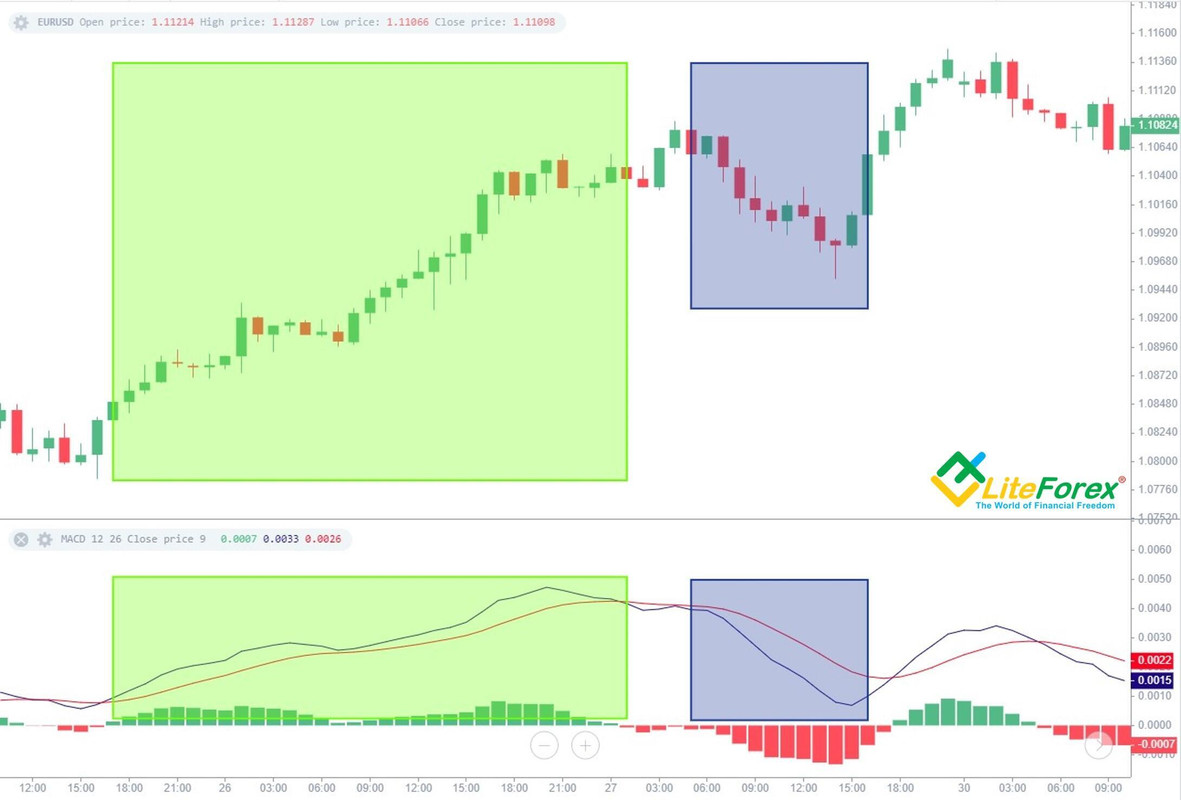
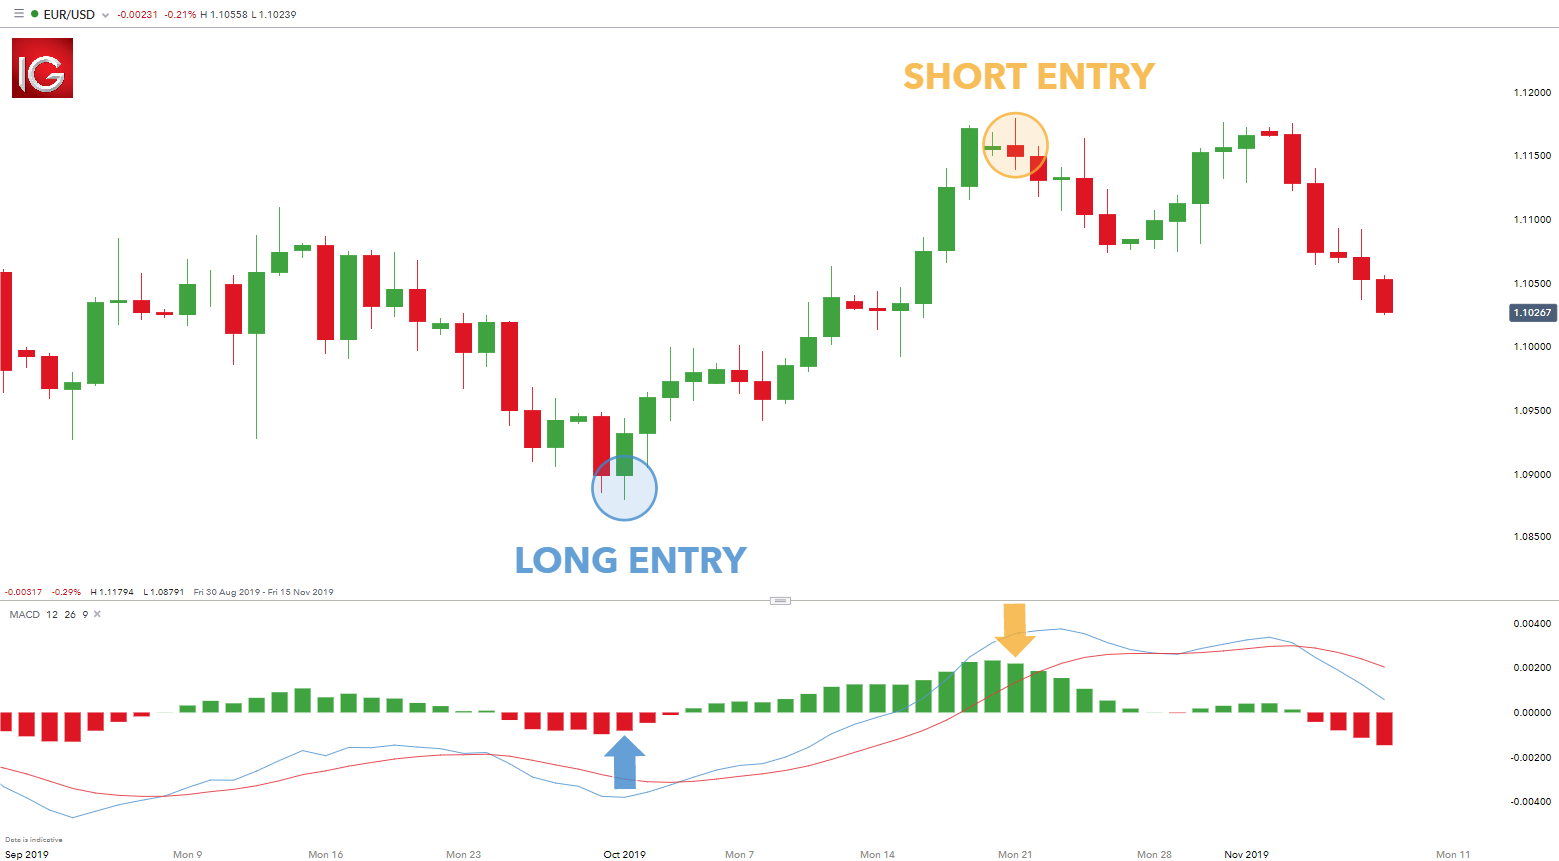
The first point of analysis would be to pursue the MACD histogram as it moves away from the zero line (both positive or negative) – track it as its bars grow larger. The actual signal comes when the histogram no longer increases in height and produces a smaller bar. Once the histogram prints a smaller bar, traders look to enter in the direction of the histogram’s decline.

The suggestive buy signal on the left (blue) was created by five swelling red bars in a row followed by a fifth bar that closed smaller. Two bars later, the MACD line crosses above the signal line which is a traditional MACD signal. This later signal would have missed most of the move to the upside that the histogram signal would have caught.

The suggestive sell signal on the right (yellow) is a similar story. We saw fourteen bars growing consecutively until a contracted 15th bar was formed. This buy trade came several bars before the MACD/signal line cross.

EUR/USD MACD histogram buy sell signal:

MACD histogram buy sell signal

Asia Market News: RBNZ Governor Orr Sinks the Kiwi

The Market News Today: Social Media Giants on Edge as Supreme Court Weighs Internet Laws

1. Supreme Court Debates Florida and Texas Laws Affecting Facebook, YouTube, and TikTok

The US Supreme Court evaluates state laws from Florida and Texas potentially reshaping online speech regulation, impacting major platforms like Facebook, YouTube, and TikTok. Monday’s arguments question whether social media should moderate content akin to newspapers or remain neutral carriers like telecommunication providers. The ruling, anticipated by June, holds implications beyond social media moderation, influencing broader internet regulation debates. Laws face scrutiny over constitutionality and potential to erode platforms’ editorial control, with implications for online speech and the future of platform governance. (Wired)

2. Disney’s Live-Action Studio Sees Leadership Change Amid Box Office Pressures

Disney’s live-action film studio undergoes leadership shake-up as Bob Iger aims to revitalize company. Motion picture production president Sean Bailey steps down after disappointing box office performances, including “Haunted Mansion” and “Jungle Cruise.” David Greenbaum appointed as his replacement. Bailey to remain as producer on “Tron: Ares.” Despite successes like “The Lion King,” Bailey faces scrutiny over recent flops like “The Little Mermaid.” Activist investor Nelson Peltz pressures Disney for profit growth, streaming focus. Iger initiates strategies including exclusive content and investments to bolster company. (BBC)

3. FTC and States Sue to Halt Kroger-Albertsons Grocery Merger, Citing Price Concerns

The Federal Trade Commission (FTC) and nine state attorneys general move to block Kroger’s $24.6 billion acquisition of Albertsons, citing antitrust concerns. The merger, proposed in October 2022, aims to bolster competition against retail giants like Walmart and Amazon. However, regulators fear it would diminish competition and hike prices for consumers. The FTC files a lawsuit and administrative complaint, while both companies vow to contest the action in court. (AP)

4. Zoom Surges 13% After Beating Q4 Expectations; Growth Remains Single-Digit

Zoom’s shares spike 13% in after-hours trading as the company exceeds analyst forecasts for its fiscal fourth-quarter results. Despite posting adjusted earnings per share of $1.22 (compared to an expected $1.15) and revenue of $1.15 billion (above the expected $1.13 billion), Zoom faces challenges as growth slows to single digits. Hindered by a sales reorganization, the company aims for modest growth in the fiscal first quarter and projects a 1.6% revenue increase for the 2025 fiscal year. (CNBC)

5. Google to Revamp Gemini AI Picture Generator Amid Accuracy Criticisms

Google plans to relaunch its AI image generator, part of the Gemini suite, following critiques over historical inaccuracies. The tool, initially introduced this month, faced backlash for producing questionable results, prompting Google to temporarily remove it. CEO Demis Hassabis assures fixes in the coming weeks, acknowledging the product’s failure to meet expectations. The move comes amid market reaction, with Alphabet shares dropping 4.4%. The incident reignites debates on AI ethics and Google’s AI strategy, prompting reflection on future developments in AI assistants. (CNBC)

Asia Market News: Markets React as BoJ Considers Exit, China’s Economy Weighs

Asia Market News: Markets React as BoJ Considers Exit, China’s Economy Weighs

A Bank of Japan Greenlight to Exit Negative Rates?

On Tuesday, inflation figures from Japan likely gave the Bank of Japan the green light to exit negative interest rates. The annual inflation rate softened from 2.6% to 2.2% in January. Economists forecast an inflation rate of 2.1%. The core inflation rate eased from 2.3% to 2.0%. Economists expected the core inflation rate to fall to 1.8%.

The inflation figures were significant. A drop below the Bank of Japan’s 2% target may have eased pressure on the Bank of Japan to exit negative rates. However, the core inflation rate of 2% could incentivize the BoJ to pivot from negative rates in April.

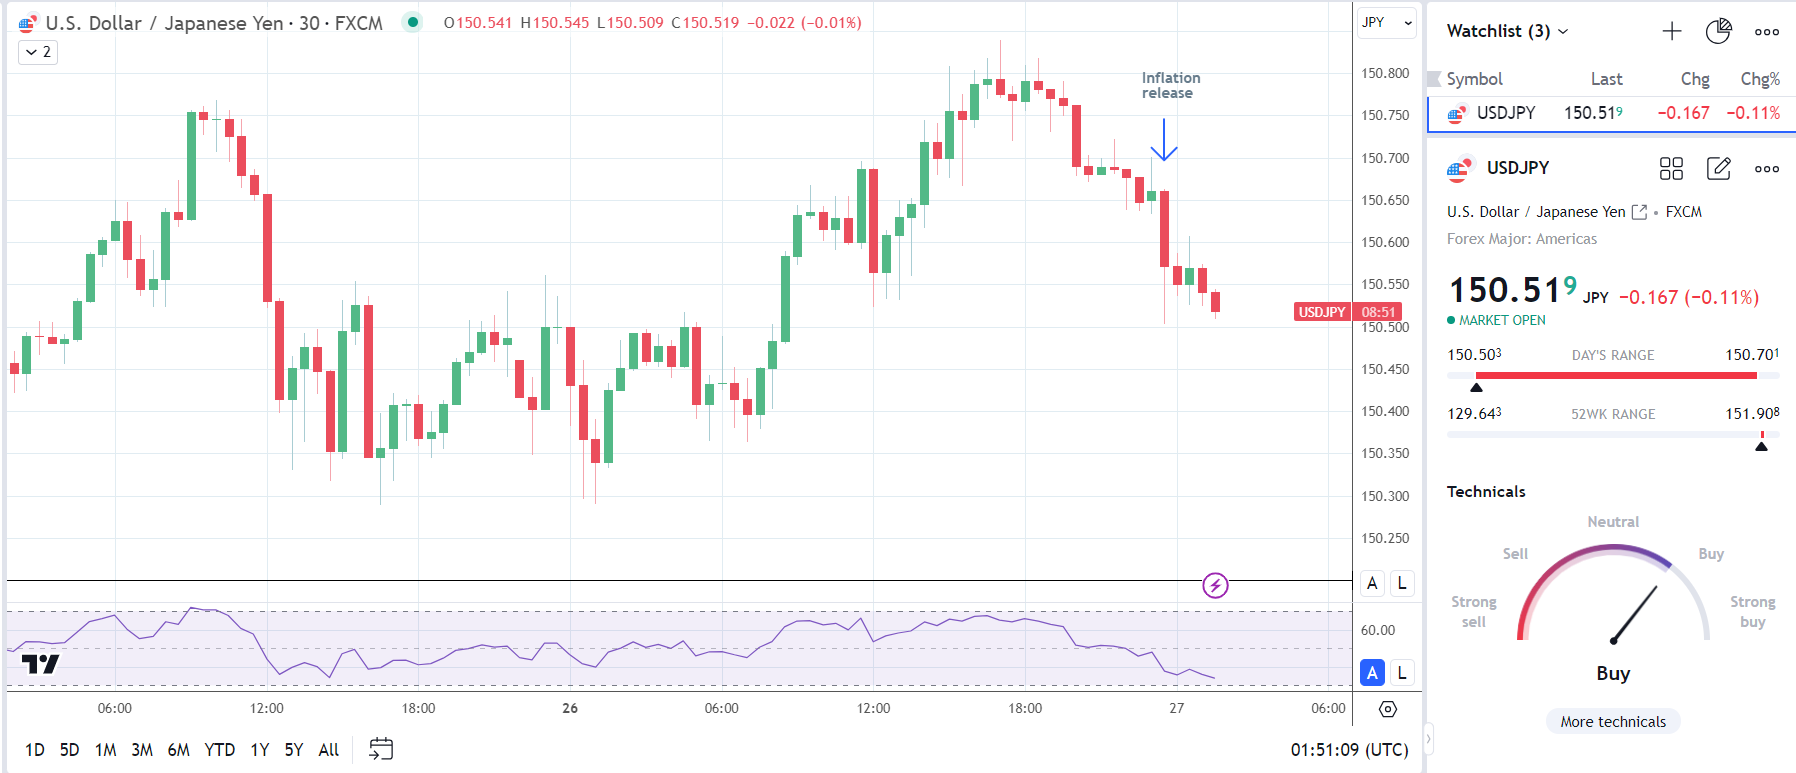
The USD/JPY reflected the likely influence of the inflation report on Bank of Japan plans to exit negative rates. Responding to the inflation numbers, the USD/JPY fell to a session low of 150.503. On Tuesday, the USD/JPY was down 0.11% to 150.519.

USD/JPY sees red on inflation numbers from Japan.
USDJPY 30 Minute Chart 270224

Asian Equity Markets Have a Mixed Morning Session

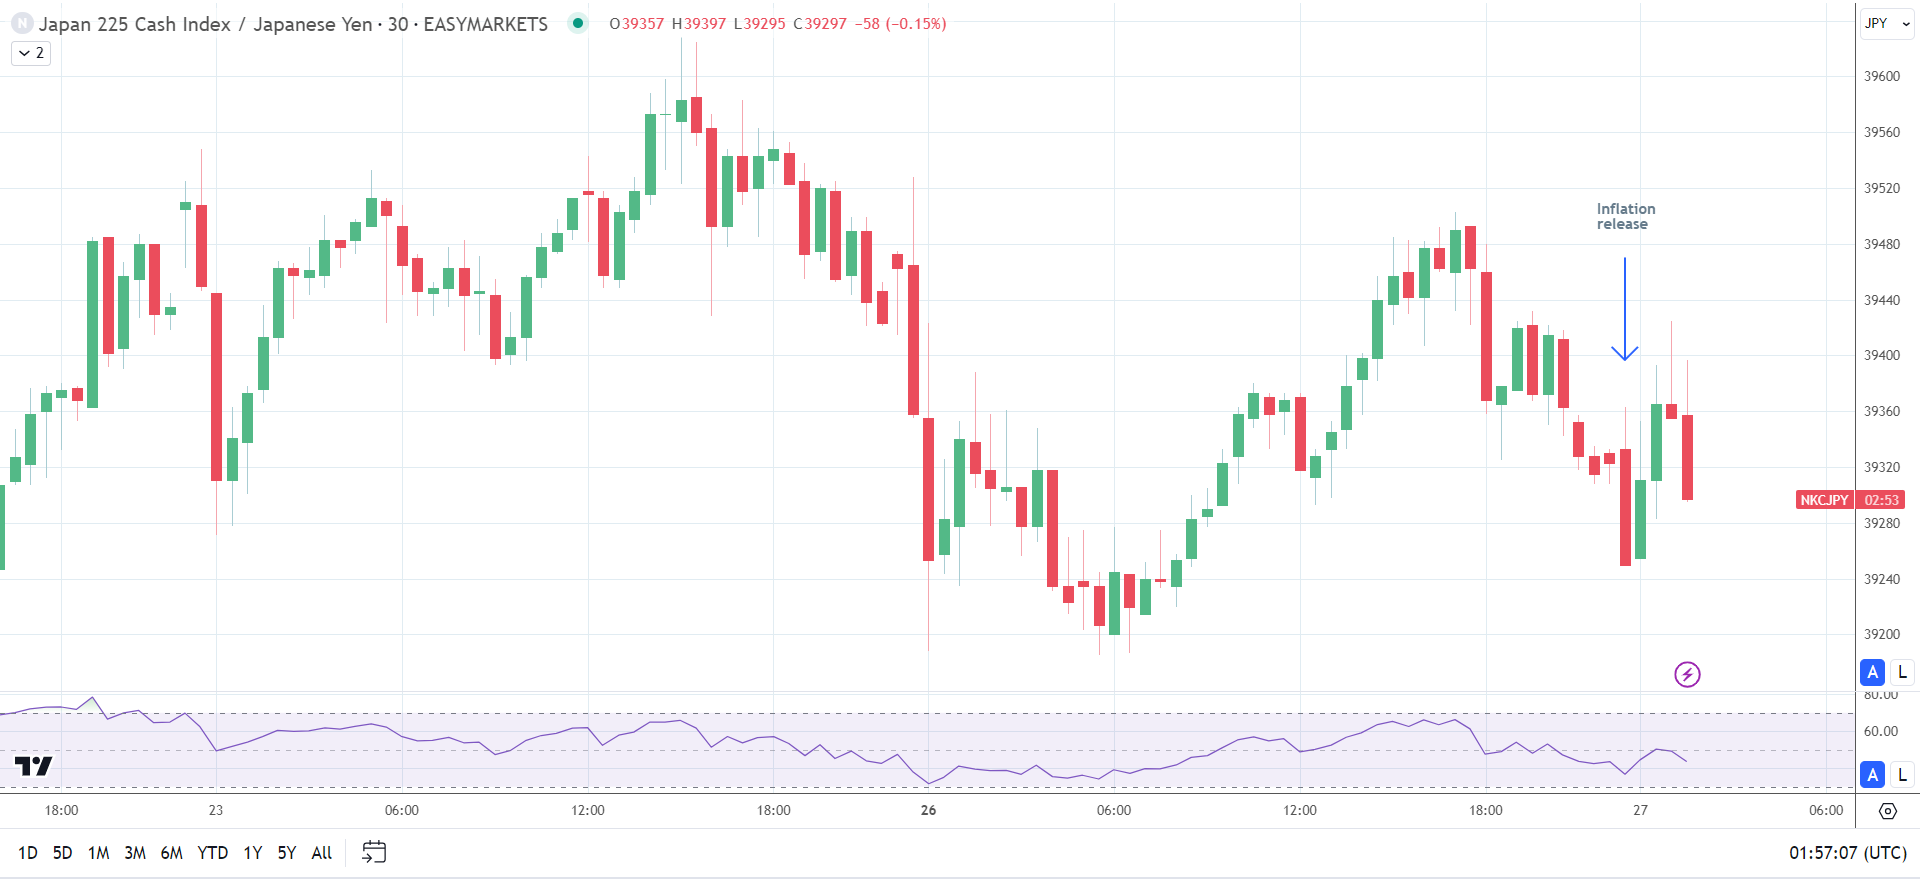
The inflation figures briefly sent the Nikkei into negative territory. Nevertheless, the Nikkei rebounded despite rising bets on a BoJ pivot from negative rates. Bank of Japan warnings that policy would remain accommodative after an exit from negative rates support the Nikkei at current levels. On Tuesday, the Nikkei was up 0.35% to 39,372.

Softbank (9984) was among the front-runners, rallying 2.08%. Demand for chip stocks continued, with Arm Holdings (ARM) moves in the AI space fueling a 9.64% rally on Monday, February 26.

Nikkei brushes aside inflation numbers from Japan.
Nikkei 30 Minute Chart 270224However, it was a negative session for the broader Asian equity markets. The Hang Seng Index and the ASX 200 were down 0.44% and 0.04%, respectively.

Mining stocks were a drag on the ASX 200, on the downward trend in iron ore prices. BHP Group Ltd (BHP) and Rio Tinto Ltd. (RIO) were down 0.36% and 0.98%, respectively. Fortescue Metals Group Ltd. (FMG) fell by 0.92%.

Hopes of an extended Year of the Dragon rally remained on ice. Concerns about the Chinese economy impacted the Hang Seng Index. Calls for a meaningful fiscal stimulus package are rising ahead of lawmakers meeting in Beijing next week. The lack of a fiscal stimulus package may leave the Chinese economy floundering as central banks consider delaying interest rate cuts.

Related Articles

Bitcoin (BTC/USD) Hits $57k, Ethereum (ETH/USD) Touches $3,275 as Buyers Dominate the Market

Bitcoin (BTC/USD) Hits $57k, Ethereum (ETH/USD) Touches $3,275 as Buyers Dominate the Market

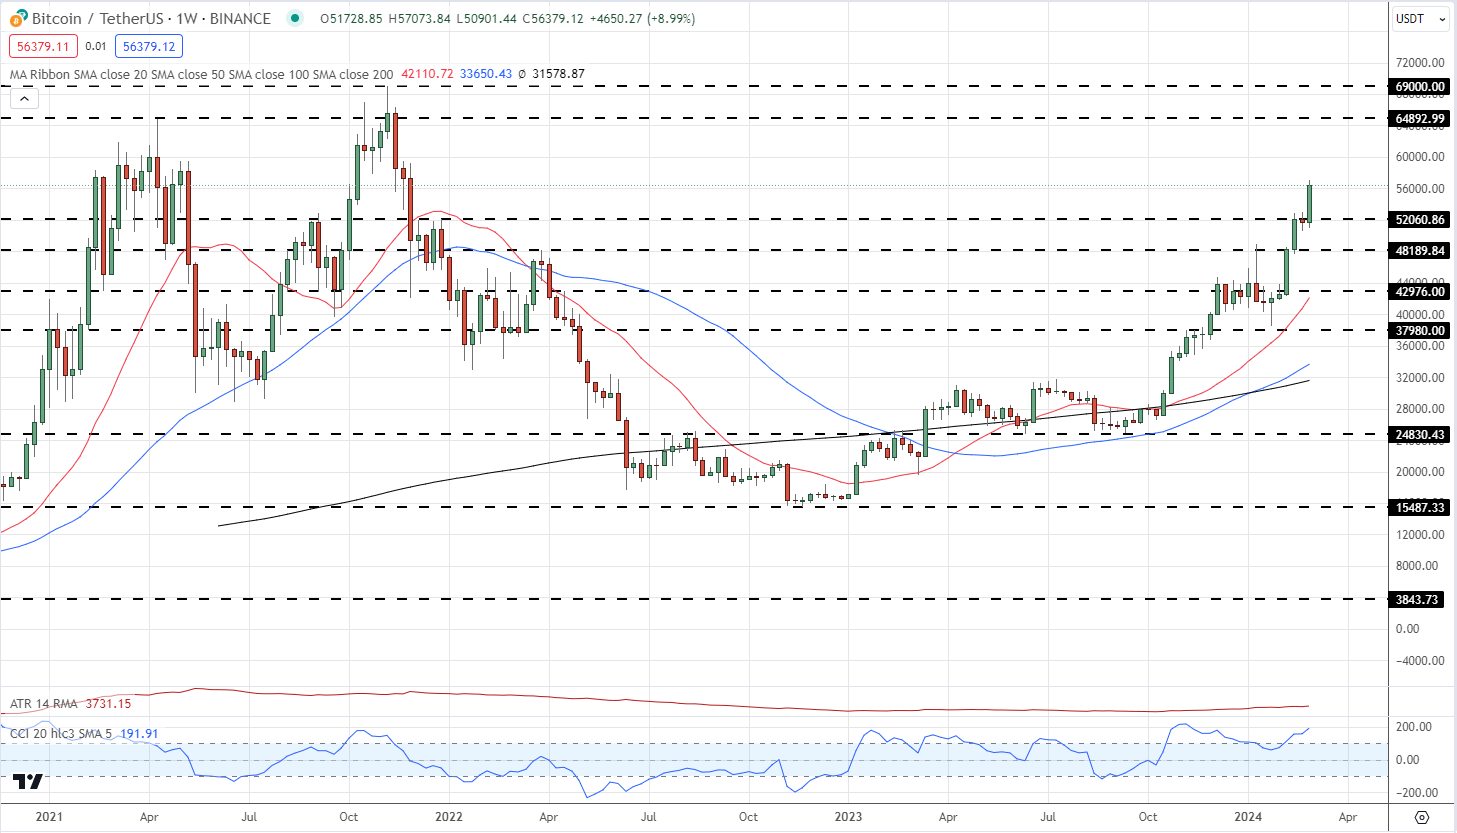
Bitcoin continues its strong run higher as ongoing ETF buying and the upcoming halving event in mid-April fuel heavy buying. On January 10th, eleven spot Bitcoin ETFs were approved by the SEC, opening the door to a wide range of customers. Since mid-January one Bitcoin ETF, run by BlackRock, has already seen over $6.6 billion of inflows, helping to send the price of Bitcoin spiraling higher. On January 10th, Bitcoin opened at $46k compared to a current spot price of around $56.5k. With demand high, traders are looking at the upcoming Bitcoin halving, expected in mid-April, as the next driver of price action as block rewards are cut from 6.25 to 3.125, reducing supply.

The Next Bitcoin Halving Event – What Does it Mean?

The weekly chart shows BTC breaking above a recent period of consolidation around $52k and pushing higher. There is minor resistance from a couple of October 2021 prior highs around the $59.5k level before the $65k area comes into focus. As always with any cryptocurrency, care should be taken as sharp swings and volatile market conditions are to be expected.

Bitcoin Weekly Price Chart

image1.png

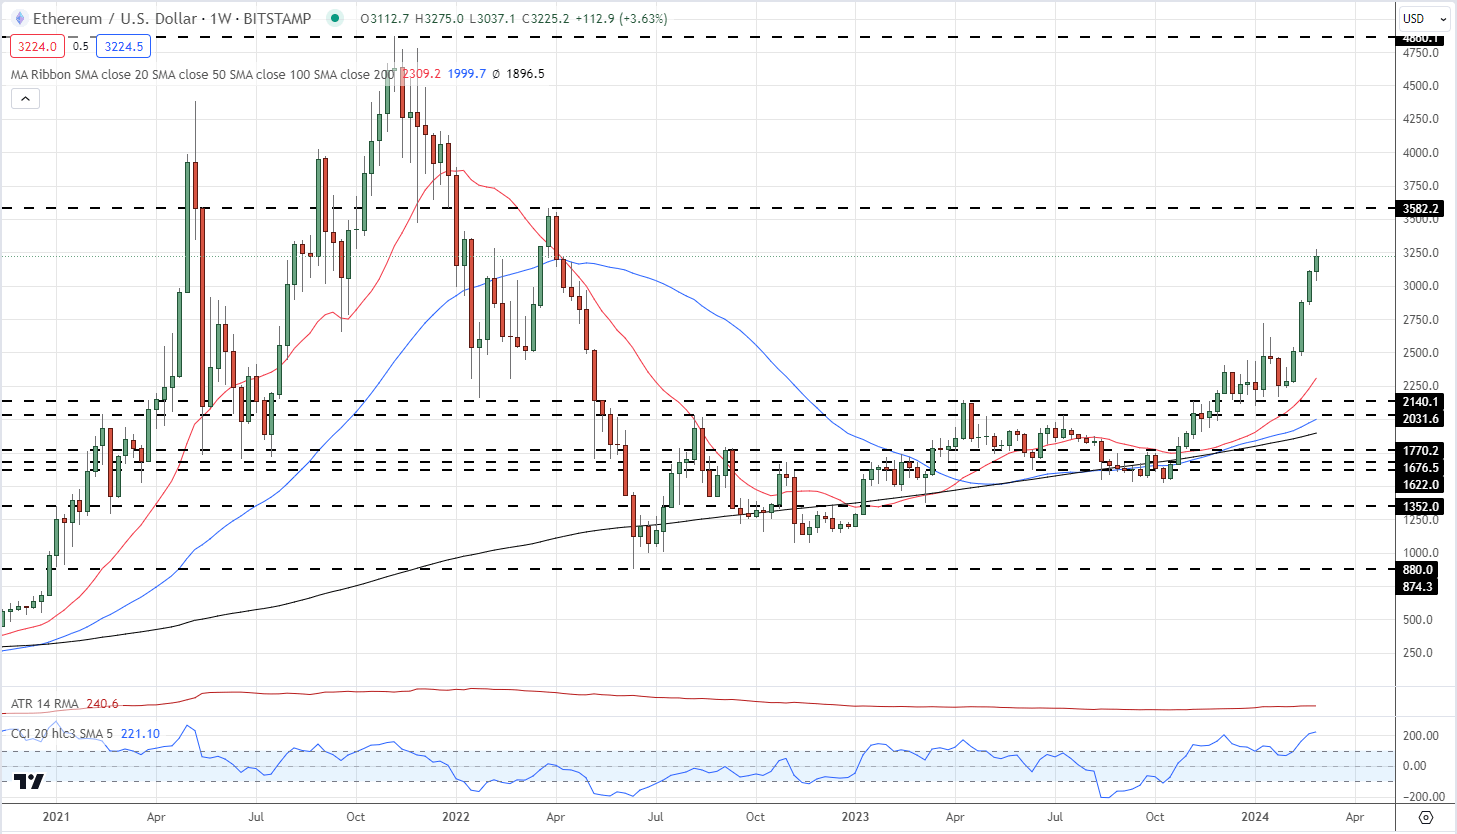
Ethereum is moving higher aided by the strong Bitcoin tailwind and growing market belief that spot Ethereum ETFs may be approved at the end of May. While the May 23rd approval deadline for the VanEck ETF is seen as the key date to watch, there is still the possibility that the SEC will not approve this application, a decision that could send Ethereum sharply lower.

Ethereum Spot ETF – The Next Cab Off the Rank?

The next level of interest for Ethereum bulls is the late-March 2022 high at $3,582, a level just 10% away from the current spot price.

Ethereum Weekly Price Chart

image2.png

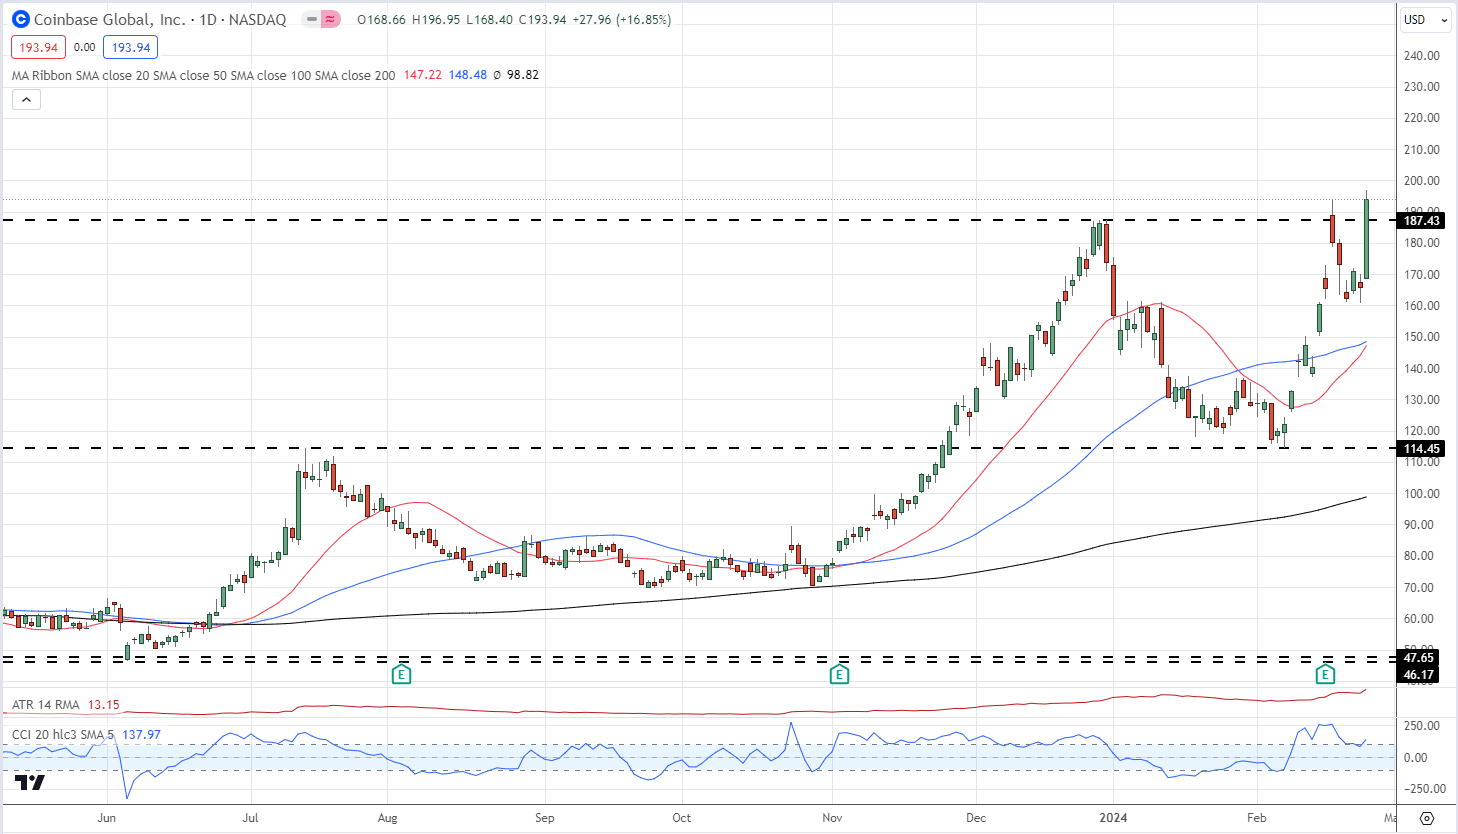
Crypto-related stocks put in a very strong performance yesterday with some seeing double-digit gains.

Crypto-currency exchange, Coinbase (COIN) broke above a multi-month high and ended the session 16.9% higher at a fraction under $194.

Coinbase (COIN) Daily Chart

image3.png

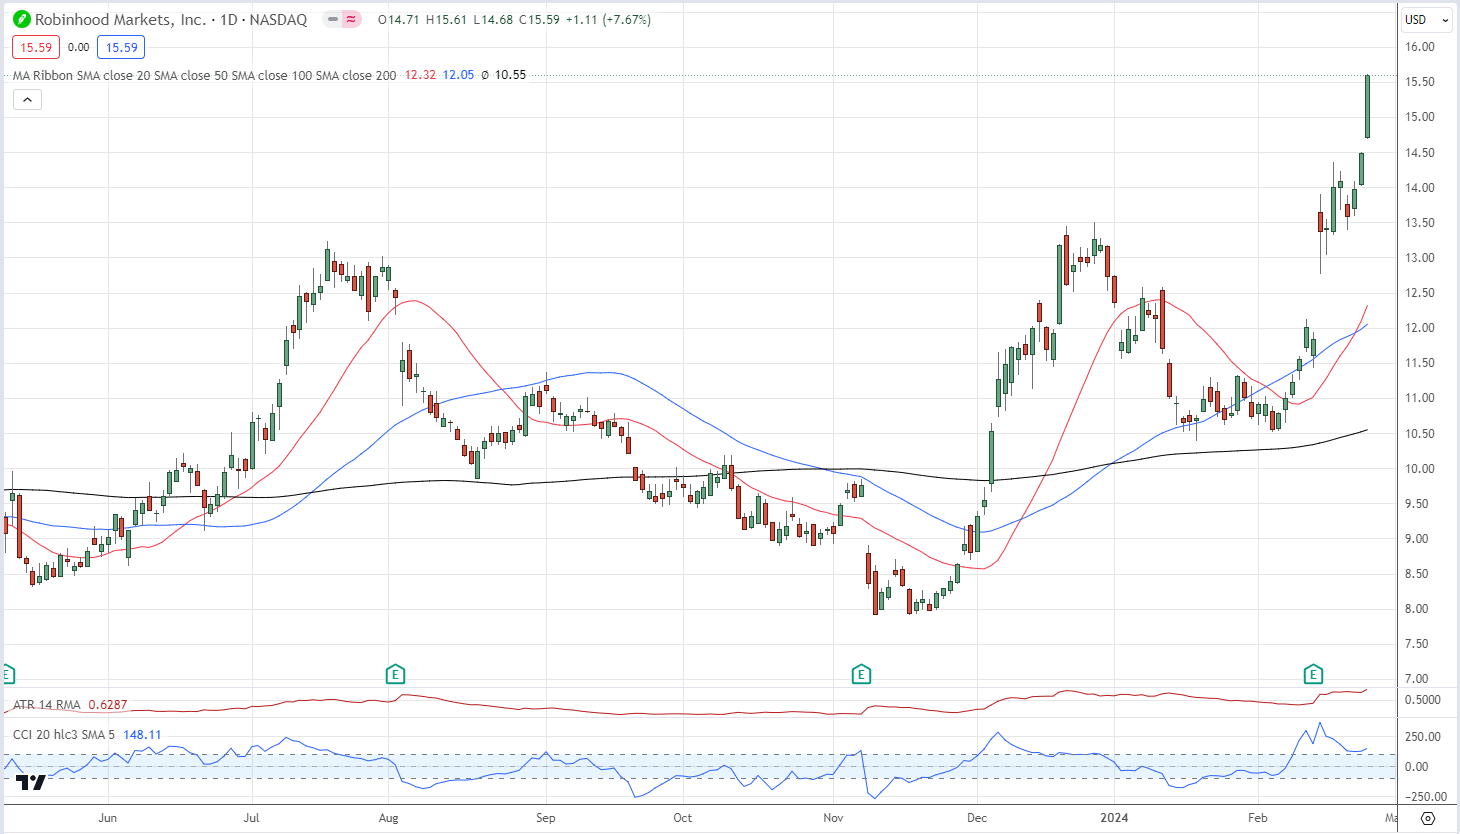
Robinhood (HOOD), a regulated broker-dealer, jumped nearly 8% to a multi-month high of $15.50.

Robinhood (HOOD) Daily Chart

image4.png

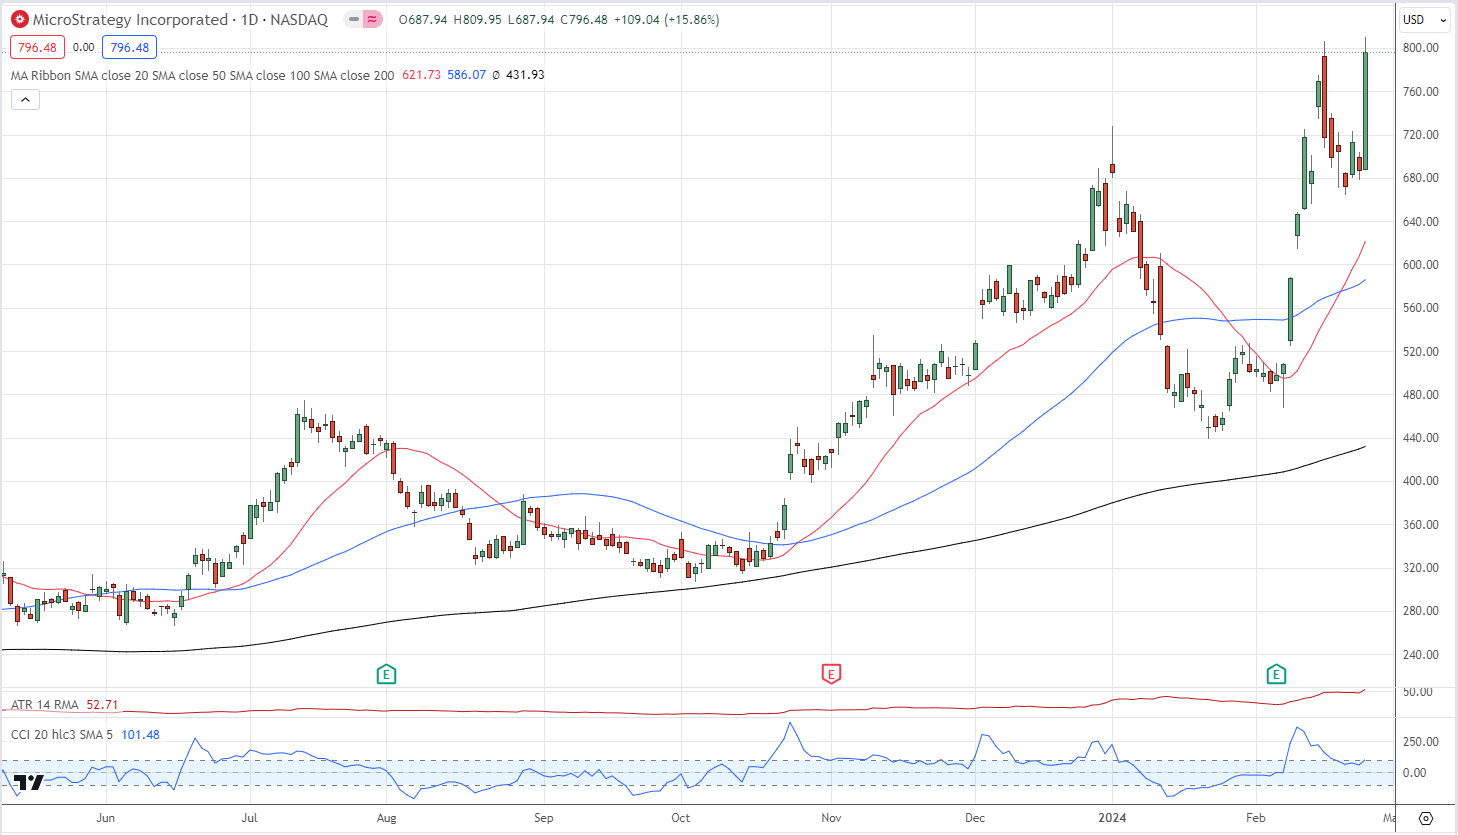
Microstrategy (MSTR) a software and cloud-computing company, now holds 193,000 bitcoin on its books after purchasing an additional 3,000 BTC recently for $155 million. Overall, MSTRs holds 193k BTC at an average price of $31,544, compared a spot BTC price just under $56.5k. Microstrategy rallied by nearly 16% on Monday.

MicroStrategy (MSTR) Daily Chart

image5.png


How to Research Stocks: A Step by Step Guide

How to Research Stocks: A Step by Step Guide

How to get started with your stock research

Prudent investors do not often make investments without prior research or substantiation as to why the stock is attractive for purchase. Stock research in a general sense begins with an understanding of three key details about a company:

  1. Present financial health
  2. Current management
  3. Future vision and roadmap

Crucially, one thing many investors fail to do is align a company’s values with their own, which is important for finding the best investment that meets their specific goals. Therefore, being mindful of your investment strategy, and why you are looking to invest in stocks can help to guide your decision-making processes.

A Step by Step Guide to Researching Stocks

As well as understanding the current and future position of a company, effective stock research needs to consider the following factors to help investors reach a decision in the effort of meeting their goals and desired strategy:

  1. Time horizon for investment
  2. Risk levels
  3. Type of stock industry/sector
  4. Understanding the company product/service
  5. Financial reporting
  6. Competitor and industry analysis
  7. Following industry experts
  8. Using research platforms and terminals
  9. Stock order types
  10. Broker fees

1. Investment time horizon

Time horizon is important as it allows investors to identify which types of stocks may align with their goals. For example, many young investors with long time horizons are willing to take on more risk when it comes to an investment portfolio. These types of individuals will often prefer more aggressive portfolios which may include growth stocks that carry more expensive valuations.

Because of the longer time horizon, these investors can usually tolerate larger swings in the market. The opposite would be true for shorter time horizons (under five years) as these investors have less tolerance for large drawdowns in the portfolio, as larger adverse market movements can create a long-lasting effect for someone nearing retirement that may need to soon begin drawing income from the portfolio.

2. Risk levels

Risk ties in with time horizon as investors use these two components together to help identify which types of stocks to invest in. Higher risk-seeking individuals will often prefer growth stocks such an Amazon or Tesla; whilst risk-averse investors usually head towards value stocks which often carry lower P/E ratios. These value stocks might be considered as undervalued and potentially attractive for long-term investing.

Regardless of investment style, it’s important to practice good risk management so that the investor can aim to benefit from upside movement while attempting to minimize downside risk.

3. Type of stock industry/sector

Many investors are familiar with a certain stock sector which can potentially make researching stocks in that sector easier. Understanding an industry allows for more in-depth research in terms of variable inputs and nuances that cannot often be retrieved from financial statements.

The stock market is often divided into eleven sectors, uncover stock sectors for a more structured method to stock research

4. Understand the company product/service

Familiarising oneself with the company’s product/service will assist in the later step of competitor analysis. Knowing what makes the company’s product/service unique, which includes the cost factor, is crucial for future forecasts.

Many companies have a diverse product/service offering which then makes this step more central to stock research. For example, with multiple products/services, investors need to understand how each offering affects the company with regards to cost, revenue and the future potential of each.

5. Financial reporting

Publicly traded companies publish financial reports which give a quantitative overview of the company. These include Earnings Announcements, which provide vast amounts of information about a company’s financial health and performance. From the company’s publicly filed reports, investors can identify potential red flags/risks within the company, management capability, debt management and income sources.

Explore the foundations of earnings season and how it fits into stock research

Current financials are not the only important documents to review. Past data can offer investors deeper knowledge and appreciation of where a company comes from as well as how it reacted under previous market conditions. This being said, fundamental analysis involves complex techniques and a thorough understanding of financial statements, mathematical formulas and a solid overall grasp of financial markets.

Uncover some basic tools to help you value a stock !

6. Competitor and industry analysis

There are regular instances whereby companies have direct competitors with the same/similar business models. Therefore, it is a good idea for investors to compare and analyse stocks between these competitors to find discrepancies which could further uncover potential investment opportunities.

The same applies to the industry as a whole. Often there are times where a company within an industry outperforms the industry and its competitors, or vice versa. Delving into why these seemingly perplexing patterns may occur can broaden understanding of how a stock or industry behaves under certain conditions.

Competitor and industry analysis are seen as obvious comparisons to make when researching stocks but, it may be prudent to analyse other markets as well. For example, Royal Dutch Shell Plc may do direct competitor analysis against a company such as BP Plc, but another comparison may be to overlay these companies with that of the underlying oil price. This major commodity (oil) is heavily correlated to the business model, therefore looking outside the scope of the equity markets may uncover some valuable insight.

7. Follow industry experts

A great way to further stock research is by following industry experts, such as highly regarded equity analysts. These experts often publish in-depth stock research which can be a good way to draw comparisons between individual and expert analysis. This is also a good way for investors to broaden equity analysis techniques by studying the analyst’s approach and what they look for in making investment decisions.

8. Research platforms and terminals

The use of research platforms and terminals such as Bloomberg can give investors/analysts a plethora of additional analytical tools and techniques. These can help investors with efficiency and access to many other financial markets and stocks for comparative purposes.

Quantitative tools are also available on such platforms for more complex types of analysis. These platforms can be costly, so before investing in one, the investor should make sure to consider the expense factor relative to their expected benefit.

9. Stock order types

After the research has been completed, investors will need to place the order to buy the stock. Knowing how order types work in the stock market can help investors to better focus the execution of their strategies.

Liquidity is another concept that can result in varying spreads and pricing. Stock market liquidity refers to the ease at which the company shares can be bought and solid without experiencing large price fluctuations. Large companies with high liquidity such as Apple Inc will often have tighter spreads with a larger volume of shares available to buy/sell at a given price.

10. Broker fees

An important but often overlooked portion of the stock investment process is that of broker fees or commissions. Brokers have differing fees so investors should become familiar with fees in order to avoid any unwanted surprises. These should be available on the broker website and should be transparent.

Stock Market Basics: A Beginner’s Guide to Trading Stocks

Stock Market Basics: A Beginner’s Guide to Trading Stocks

The stock market can be a confusing place for the uninitiated. Financial news is often saturated with bemusing buzzwords; tales from the trading floor of treasury stock, stated value, and retained earnings often mean nothing to the average investor. But for those looking to trade stocks, understanding and applying such concepts is key to navigating this asset class.

While investing in stocks presents a risk to capital, it can also be an effective way of accumulating wealth, and a well-chosen, balanced stock portfolio has the potential to be a ticket to a stable passive income. Read on for our beginner’s guide to trading stocks, and we’ll help you turn the jargon into actionable knowledge.

Getting Started in Stock Trading: Main Talking Points:

  • What is the stock market and how does stock trading work?
  • How can an investor potentially make money trading stocks?
  • What does it take to start trading stocks?
  • How do you pick the right stocks to trade?
  • Things to consider before trading stocks

What is the stock market and how does stock trading work?

Being a confident stock trader or investor involves getting to grips with the basics of the market and how stock trading works.

What is the Stock Market?

The stock market is where shares are bought and sold by individual and institutional investors. In the modern era, the process is conducted electronically through major stock indices such as the Nasdaq 100, FTSE 100 and DAX, each of which represent the performance of a basket of constituent stocks.

These stocks are tracked by the market index to come up with a value for the index based on weighted market capitalization methodology. This means that a large movement in the price of a single large stock can influence the index on which it is listed.

What are Stocks?

Stocks are effectively the ownership certificates of a given company. They are issued by a business to raise capital for growth, and they fluctuate in price depending on the company’s performance. They can be listed on the stock market (public) or may only be available to private investors (OTC or over-the-counter stocks). Commonly traded stocks include Boeing, Xerox and Apple, the latter of which is traded on the Nasdaq 100, Dow Jones and the S&P 500.

Events such as product launches, a new CEO appointment, and earnings announcements are all instances that can move a stock’s price and influence a choice of stock. More of these factors are discussed in the ‘How do you pick the right stock’ section below.

Shares on the other hand refer to the proportional ownership of a stock in one particular company. For example, owning 50,000 shares of a company with 1 million outstanding shares would give an investor a 5% ownership stake.

How are stocks traded?

When it comes to approaching stocks, there is an important distinction to be made between trading and investing.

Trading

A trader can potentially make (or lose) money by speculating on securities over a shorter timeframe. Often, traders will focus on technical patterns using methods such as scalping and day trading, often using short-term timeframes such as ten-minute charts.

With online trading platforms traders can monitor the stock’s performance along with their entry and exit prices.

Investing

An investor can potentially make money trading stocks essentially through purchasing the asset, often via a brokerage account, and holding it over a longer timeframe. During this period, (s)he may look to receive dividends and interest, as well as benefit from long-term increases in value, culminating in the sale of the stock(s).

This ‘buy and hold’ strategy may involve holding a stock for at least five years. Focusing on a ‘total return’ means that interest, dividends, distributions and capital gains are all taken into account when calculating the total return from a given stock.

How to begin trading stocks

The easiest way to start trading or investing in stocks is through a trading platform/online brokerage account, which can be set up simply with proof of ID and a choice of funding method. Finding a low-commission broker is important for more active traders as they will naturally pay more commission than those trading at a lower volume.

Investors should also decide whether to go for individual stocks or mutual funds. Individual stocks, as mentioned above, represent a share of the corporation, while mutual funds pool a range of stocks, with managed funds looking to outperform the market and exchange-traded funds or ETFs tracking an index.

Get started in stock trading: A Checklist

  1. Establish trading goals
  2. Choose the right broker
  3. Research key companies
  4. Keep a diversified portfolio
  5. Practise risk management

How to pick the right stocks to trade?

When it comes to picking the ‘right’ stocks, it may be worth it for market practitioners to go for companies they are already familiar with. Considering factors which help to determine the chances of its price rising may also be helpful. These factors include:

  1. Financial health of the company: What does the company’s balance sheet look like? Have revenues and profits been increasing in recent years? How much debt does it have? Is it driving efficiencies?
  2. Innovation levels: What new products or expansion plans are in the pipeline? How does it stack up against rivals in terms of satisfying its customer base? Is it well placed to pivot and address new market demands?
  3. Dividends: If a company is paying a dividend, are they increasing it? How often is a dividend paid?
  4. Price and valuation: Is it undervalued? To get a better picture of this, a price-to-earnings ratio, or P/E, can be worked out by dividing a company’s current stock price by its earnings per share. A P/E of 15 is often considered ‘cheap’. However, it may be cheap because of slower growth. It may be worth identifying the ‘cheap’ stocks that figure to be positive in as many of the above areas as possible. Assessing the ‘fair’ value of a company may also be achieved by calculating total assets on its balance sheet, minus depreciation and liabilities.
  5. Liquidity: Liquidity refers to the stocks that have sufficient trading volume to allow traders to enter and exit positions straightforwardly. Examples of liquid stocks include ExxonMobil, General Electric and Alibaba. Read more on stock market liquidity for a detailed picture.
  6. Volatility: Volatility refers to the stocks with the highest potential for significant price movement. Choosing a volatile stock can be risky but can also provide real opportunities. Read more on stock market volatility to discover how.

Another consideration is how the stocks fit within a portfolio. For example, a strategy may be to go purely for strong capital gains with growth stocks or add in greater security with dividend stocks or defensive stocks. For more on these types of stocks, see our FAQ section below.

4 things to consider before trading stocks

Before getting started in stocks, traders and investors should have an idea of their goals, how much money they want to risk, an understanding of their trading style and how to diversify their portfolio.

1. What are the Goals?

How long is the cash expected to be tied up? What are the plans for the money? Is there a chance the funds will be needed before the investment has a chance to appreciate? For example, if someone is saving for retirement, investing in stocks may be a good choice as that’s a long game. But if that person wants to work up a deposit for next year’s house purchase, they might want to trade the stocks over the short term instead, or consider a different asset.

2. How Much Money will be Risked?

Market practitioners should consider how much money is available to trade or invest. A prudent amount might be 5% of annual earnings, but everyone is different. When it comes to risk, the more knowledge acquired of industries and companies within them, the better preparation for the inevitable market swings.

3. Keeping Emotions at Bay

Managing emotions when trading is of paramount importance. When trading stocks, there will be a slew of market information over the course of an investment – much of it unhelpful. A trader or investor should be able to filter out the rumors, speculation and noise, and avoid letting FOMO impact their stock trading decisions. It is important to manage emotions and stay true to initial reasons for choosing the stock. Also, naturally there will be stocks that don’t perform to expectations. Being able to deal with losses is key.

4. Is the Portfolio Diversified?

A diversified portfolio might mean owning/trading stocks in a variety of companies, across numerous sectors, to protect against adverse events. Other assets that may be considered include bonds, forex and commodities.

Stock market FAQs

Why is the Stock Market Important?

The stock market is important for businesses, individuals and economies. It allows businesses to raise money for growth and to spread their risk. It allows investors to potentially make returns on their capital and increase their wealth, and it allows the economy to benefit from domestic and international cash injections.

The stock market is also a measure of economic performance; its trends can help people understand cycles, how businesses are doing, and make predictions for future policy. Stock market performance is also linked with that of pension funds and other assets.

Read more on the stock market and the economy.

What is the Difference Between a Stock Trader and an Investor?

A stock trader will look to speculate on an asset over the short term, which may be as short as minutes, whereas an investor will be aiming for more of a ‘buy and hold’ strategy designed to see an appreciation of the stock’s value over several years, as well as take dividends.

Why Choose Stocks over Bonds?

While stocks represent an ownership stake of a company, bonds are a type of loan issued by a company or government that pays investors interest on top of the debt. Bonds are considered less risky than stocks. However, naturally, they also generally return lower yields.

What are the Main Types of Stock?

Three main types of stocks are growth stocks, dividend or yield stocks, and defensive stocks, each with different characteristics to understand.

  • Growth stocks are shares bought purely for the goal of capital growth. Companies will reinvest profits rather than pay dividends, meaning investors’ only route to profit is through capital gains. This makes growth stocks inherently risky. However, while capital losses may be incurred, the payoff from stocks that are expected to grow fast can make this risk worthwhile.
  • Dividend stocks, or yield stocks, have paid regular (usually quarterly) dividends to company shareholders. That means if a company pays an annualized dividend of 10 cents per share, it will pay a quarterly dividend of 2.5 cents a share.
  • Defensive stocks are companies with reliably high demand for their products and services no matter what the state of the economy; industries such as healthcare, consumer staples and utilities. This makes them ideal to analyze during recessions but may not be the best choice for general bull markets.