Trading Breakouts and Pullbacks

Trading Breakouts and Pullbacks

THE PULLBACK TRADE

The pullback trade is predicated on the idea that the short-term countertrend price action (correction) will be short-lived and that the broader trend will resume once the correction is over.

The post-breakout pullback is what it sounds like – the first pullback following a breakout. This can be one of the highest quality pullbacks you will get for establishing a position, as it appears early in what may become the beginning of an extended trend. Thus, these pullbacks can be some of the most rewarding.

When to enter

Entries on pullback trades can be taken based on a number of factors, but there are two which I deem to be the most important. The first factor is the availability of support or resistance. By having support or resistance available, you provide yourself with a point at which the market is showing demand (support) and supply (resistance).

If the market is in an uptrend, it is ideal that support is tested during the retracement before resuming higher. In a downtrend, resistance becomes the level you want to see price pull back to before seeing the trend resume lower.

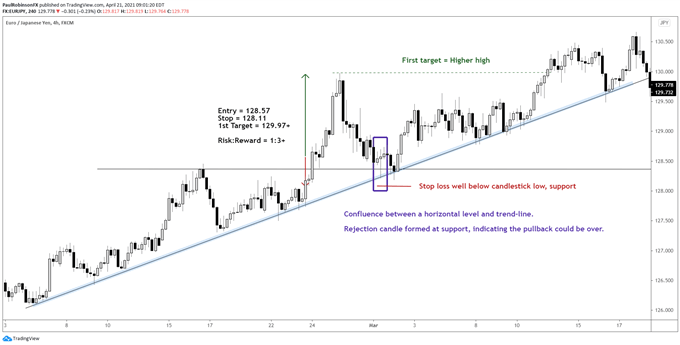
It is ideal to have confluence of support and resistance. Confluence is key to finding the strongest forms of support and resistance. These could be intersections of various types of levels; horizontal levels, trend-lines, slopes, Fibonacci, moving averages are a few to mention.

The second part of entry equation entails the price action. Once either support or resistance is met it is ideal to see a strong reaction. That is, confirming price action that demonstrates market participants are in demand for prices to go higher or in supply that will help drive prices lower. Candlesticks are a great way of seeing this demand/supply dynamic at work.

For example, reversal candles that have small bodies with long tails (i.e. bullish hammers, bearish shooting stars) can be excellent markers that a retracement has runs its course. To see these occur at a key chart level strengthens the case. There are of course other candle types, such as a bullish or bearish engulfing candles, but the point is that you use some form of price action analysis in conjunction with the important support and resistance thresholds you’ve identified on the charts.

Risk management

Placing stops should make sense within the context of your analysis. Stops should be set out of harm’s way, beyond the support or resistance levels in question. For longs, stops should be placed beneath support, and for shorts the stop should be placed above resistance.

Targets should be set using your analysis the same way you set your stops. For longs, you are looking to resistance levels that may prevent the market from continuing higher. And for shorts you are looking to support levels that may potentially stop the market from continuing to decline.

The distances from your entry to your stop and entry to the target levels are what determines the initial set of risk parameters. You want to strive for a robust risk/reward ratio, preferably 1:2 or better. For example, a long trade that has an entry of 100, stop at 99, and target at 102 gives you a robust risk/reward ratio of 1 to 2.

Example of Pullback Trade
THE BREAKOUT TRADE

This type of trade emerges after a period when the market is retracing or from rangebound type price action. These can form within the context of an established trend or during a trendless period when the breakout itself may be the beginning of an extended trending period.

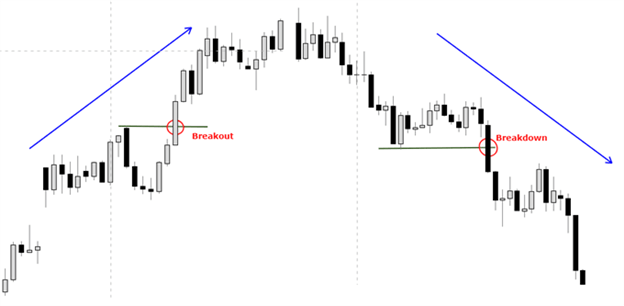
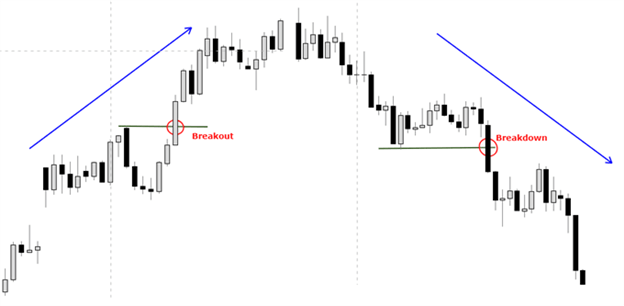
The trend breakout entails a trending market with a pullback followed by a breakout above the most recent swing high (for longs) or swing low (for shorts). The range breakout is simply identifying a period where the market has undergone an extended process of horizontal trading, and price either moves above resistance (for longs) or below support (for shorts). Horizontal price action can also form chart patterns that result in breakouts; most popular are wedges/triangles, rectangles, flags/pennants, and head-and-shoulders.

PRICE BREAKOUTS (BULLISH & BEARISH)
When to enter

There are multiple approaches that can be taken. One can enter the market as soon as the price level in question is crossed, wait until there is a closing candlestick or bar beyond support or resistance, or some combination of the two. The closing candle method offers the most confirmation, but it can also mean missing out on some or all of the move in the event the breakout is extremely powerful. One of the benefits, however, is that by waiting for a closing print above or below support you will sidestep a lot of false breakouts.

This is why combining the two execution strategies can be a nice down-the-middle approach that brings the best of both techniques. For example, you could enter 50% of your max position size as soon as the breakout level is crossed and the other 50% once there is a closing print beyond the breakout level.

If you enter and the market doesn’t confirm, then you will lose on a position that is half the normal size. And if there is a confirmed breakout, you will enter the full position, allowing you to take advantage of the breakout with a full-sized position while increasing the odds that it won’t fail.

Risk management

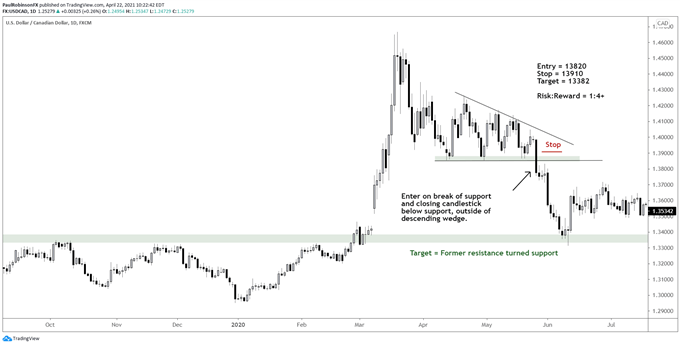
The distance from your entry to stop (entry +/- stop) and distance from entry to the target(s) should have an asymmetrical risk profile providing somewhere around a 1:2 risk/reward ratio or better. For longs, stops should be placed sufficiently below the breakout level (resistance) and for shorts below the breakout level (support).

For pattern breakouts, given they are a little trickier due to the subjective nature of price patterns, waiting for a closing candle outside of the pattern before entering is a prudent approach.

Targets should be determined using your analysis, as is the case with any trade.

Example of a Breakout Trade
Risk Management Techniques for Trading

Risk Management Techniques for Trading

Why is trading risk management important?

Many traders see trading as an opportunity to make money but the potential for loss is often overlooked. By implementing a risk management strategy, a trader will be able to limit the negative effects of a losing trade when the market moves in the opposite direction.

A trader who incorporates risk management into the trading strategy will be able to benefit from upside movement while minimizing downside risk. This is achieved through the use of risk management tools like stops and limits and by trading a diversified portfolio.

Traders that opt to forgo the use of trading stops run the risk of holding onto positions for too long in the hope that the market will turn around. This has been identified as the number one mistake traders make, and can be avoided by adopting the traits of successful traders to all trades.

How to Manage Risk in Trading: Top Tips and Strategies

Below are six risk management techniques that traders of all levels should consider:

  1. Determine the risk/exposure upfront
  2. Optimal stop loss level
  3. Diversify your portfolio: the lower the correlation, the better the diversification
  4. Keep your risk consistent and manage your emotions
  5. Maintaining a positive risk to reward ratio

1) Determine the risk/exposure upfront:

Risk is inherent in every trade which is why it is essential to determine your risk before entering the trade. A general rule would be to risk 1% of the account equity on a single position and no more than 5% across all open positions, at any time. For example, the 1% rule applied to $10,000 account would mean no more than $100 should be risked on a single position. Traders will then need to calculate their trade size based on how far away the stop is placed in order to risk $100 or less.

The benefit of this approach is that it helps to preserve the account equity after a run of unsuccessful trades. An additional benefit of this approach is that traders are more likely to have free margin available to take advantage of new opportunities in the market. This avoids having to forgo such opportunities due to margin being tied up in existing trades.

2) Optimal stop loss level

There are many different approaches that traders can utilize when deciding where to place a stop.

Traders can set stops in accordance with:

  • Moving averages – set stops above (below) the specified MA for long (short) positions. The chart below shows how traders can use the moving average as a dynamic stop loss.

using moving average as a risk management tool

  • Support and resistance – set stops below (above) support (resistance) for long (short) positions. The chart below shows the stop being placed below support in a ranging market , allowing the trade enough room to breathe while protecting against a large downward move.

stops near support and resistance as a risk management strategy

  • Using the Average True Range (ATR) – ATR measures the average pip/point movement in any security over a specified period and provides traders with a minimum distance away to set their stops. The chart below adopts a cautious approach to the ATR by setting the stop distance in accordance with the maximum ATR reading from recent price action.

using average true range in a risk management strategy

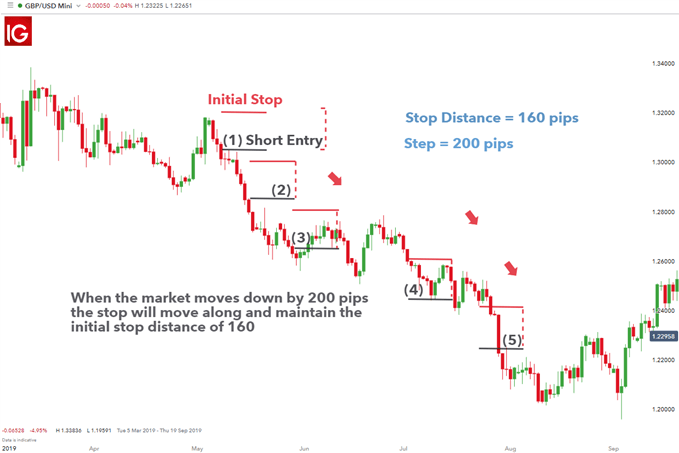
*Advanced Tip : Instead of using a normal stop loss, traders can use a trailing stop to mitigate risk when the market is moving in your favor. The trailing stop, as the name suggests, moves the stop loss up on winning positions while maintaining the stop distance, at all times.

3) Diversify your portfolio: The lower the correlation, the better the diversification

Even if the 1% rule is adhered to, it is crucial to know how positions may be correlated. For example, the EUR/USD and GBP/USD currency pairs have a high correlation, meaning they tend to move closely together and in the same direction. Trading highly correlated markets is great when trades move in your favour but becomes an issue on losing trades as the loss on the one trade now applies to the correlated trade too.

The chart below depicts the high correlation observed between EUR/USD and GBP/USD. Notice how closely the two price lines track each other.

correlation between eur/usd and gbp/usd

Having a good understanding of the markets you are trading and avoiding highly correlated currencies, helps to achieve a more diversified portfolio with reduced risk.

4) Keep your risk consistent and manage your emotions

Once traders make a few winning trades, greed can easily set in and entice traders to increase trading sizes. This is the easiest way to burn through capital and place the trading account in jeopardy. For more established traders however, it is alright to add to existing winning positions but maintaining a consistent framework when it comes to risk should be the general rule.

Fear and greed rear their ugly head many times when trading. Learn how to manage fear and greed in trading .

5) Maintaining a positive risk to reward ratio

Maintaining a positive risk to reward ratio is crucially important to managing risk over time. There may be losses early on but maintaining a positive risk to reward ratio and keeping to the 1% rule on each trade, greatly enhances the consistency of your trading account over time.

The risk to reward ratio calculates how many pips a trader is prepared to risk, compared with the number pips a trader will receive if the target/limit is hit. A 1:2 risk to reward ratio means that the trader is risking one pip to make two pips, if the trade works out.

The magic within the risk to reward ratio lies in its repeated use. We discovered in our Traits of Successful Traders research that the percentage of traders who used a positive risk to reward ratio tended to show profitable results versus those with a negative risk to reward ratio (page 7 of the guide). Traders can still be successful, even if they only win 50% of their trades, as long as a positive risk to reward ratio is maintained.

*Advanced Tip : Traders often get frustrated when the trade moves in the right direction only for the market to turn right around and trigger the stop. One way to avoid this happening is to make use of a two-lot system. This strategy looks to close out half of the position when it is midway to the target and then bring the stop on the remaining position to break-even. This way the traders gets to bank the profit on the one position while essentially being left with a risk-free trade in the remaining position (if using a guaranteed stop).

Trading risk management tools

1) Normal Stop Loss : These stops are the standard stops offered by most forex brokers. They tend to work best in non-volatile markets as they are prone to slippage . Slippage is a phenomenon where the market doesn’t actually trade at the specified price, either because there is no liquidity at that price or due to a gap in the market. As a result, the trader has to take the next best price, which may be significantly worse, as shown in the USD/BRL chart below:

usd/brl market gapping risk management

2) Guaranteed Stop Loss : A guaranteed stop eliminates the issue of slippage entirely. Even in volatile markets where price can gap, the broker will honor the exact stop level. However, this feature comes with a cost as brokers will charge a small percentage of the trade to guarantee the stop level.

3) Trailing Stop Loss : A trailing stop moves the stop closer to the current price on winning positions while maintaining the same stop distance at inception of the trade. For example, the GBP/USD chart below shows a short entry that moves favorably. Every time the market moves 200 pips the stop will automatically move along with it, while maintaining the initial stop distance of 160 pips.

Trailing stop as a form of risk management

Further reading to improve your risk management skills

How Does the Stock Market Affect the Economy? A Trader’s Guide

How Does the Stock Market Affect the Economy? A Trader’s Guide

The stock market and the wider economy have historically shown a correlation. Where a bull run in stocks occurs, you can often expect an economic upturn too. But is this always the case? How does the stock market affect the economy, what do crashes mean for the wider economic environment, and what are the key takeaways for traders?

Why is the stock market important?

The stock market is important for a variety of reasons. It enables traders and investors the opportunity to profit from its moves and generate personal wealth, can provide a benchmark of a country’s commercial and industrial health, and gives businesses an opportunity to scale and prosper, benefiting the wider economy. As a result, a well-functioning equities market is valuable for business, individuals and nations alike.

Three ways the stock market impacts the economy

The stock market and economy relationship can be broadly characterized by investment fueling economic growth, the enabling of company ownership that increases personal wealth, and equities providing a measure of economic health. We’ll explore these three factors below.

1. Stock Market Investment can Spark Economic Growth

The money that investors put into companies allows enterprises to invest in growth. When a business starts out, it may have to bootstrap, or survive on little capital. But when it offers shares to the public via an IPO, it has a chance to transform into a leading organization in its sector through taking on staff, driving innovation, and achieving economies of scale. In turn, companies can build revenues and achieve real competitive advantage in the marketplace, directly impacting GDP and boosting the economy.

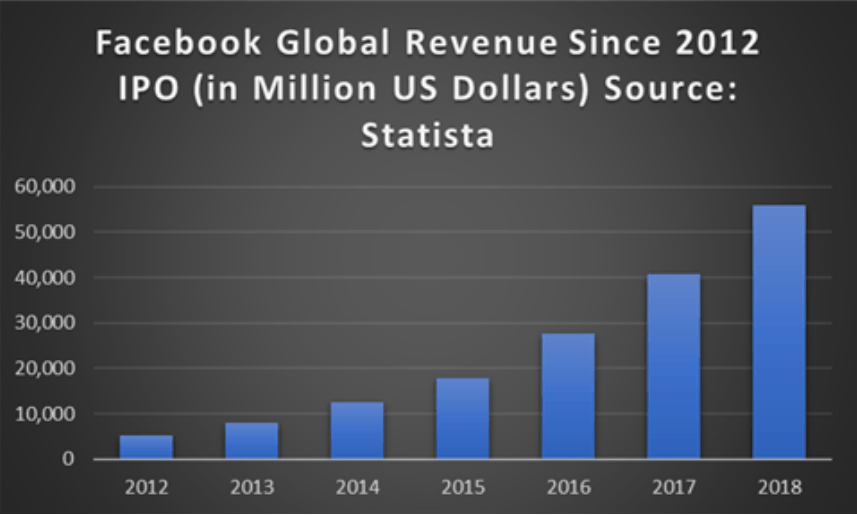
In 2012, Facebook’s global revenue was already some $5 billion, with around 5,000 employees on the payroll. However, the company’s IPO that year raised in excess of $16 billion, which helped build the company to a market cap of $630 billion by January 2020, with 2018 figures showing some $55 billion in global revenue and more than 40,000 employees worldwide – all demonstrating the considerable economic impact of the IPO.

How Facebook stock impacts the economy

2. Company Ownership can Enable Impressive Returns

While representing a risk to capital, investing in stocks and major stock indices is a potential way for individual investors – not just venture capitalists – to take an ownership in successful enterprises and accumulate wealth. This capital can then be reinvested or spent, impacting the economy. Stocks have historically proven the best way to beat inflation in the long term, with some indices showing triple digit returns since the beginning of the century.

INDEX PERFORMANCE JAN 2000-JAN 2020 (SOURCE: IG)

Index Gain
CAC 40 5.2%
FTSE 100 20.7%
Nikkei 225 21.7%
Hang Seng Index 77.7%
DAX 30 94.3%
S&P 500 135.2%
Nasdaq 100 155.7%
Dow Jones 163.8%

3. Stock Markets can Measure Economic Strength

The stock market can often be viewed as a reliable economic barometer. It reveals how major companies are doing and in turn gives insight into the drivers of economic health, such as consumer spending.

Rising stock prices can mean higher business and consumer confidence; falling stocks naturally the opposite. If an index such as the tech-centric Nasdaq is on a bull run, this might suggest a range of things, for example: investor confidence in demand for electronics, and faith in the financial strength of the tech giants such as Microsoft and Apple that have a larger impact on the index due to market cap weighting.

Any of these things and more can move the index, and confidence itself can breed confidence. However, as mentioned below, just because there is an upturn in stocks, doesn’t necessarily mean the wider economy is improving, just as a fall in stocks doesn’t necessarily mean the wider economy is contracting.

How does a stock market crash affect the economy?

A stock market crash can devastate the economy. When a downturn in the business cycle happens, significant amounts of value can be erased from share prices. In turn, this means lower returns and dividends for individual investors, a smaller market capitalization for businesses, less wealth for pension funds, and less funding for companies in the near future.

Such a lack of finance can mean businesses aren’t able to grow, meaning potential cost saving measures are necessary, such as staff cuts and the delaying of expansion projects. Smaller pension pots may also mean delayed retirement for older employees, and an uncertain economy landscape may mean dampened consumer spending, hitting GDP.

However, while a stock market crash can clearly cause the economy to contract, this isn’t always the outcome. Similarly, a bull run in stocks doesn’t necessarily mean a thriving economy. As long as irrational exuberance of investors and overvaluation exists, stock market performance can function independently of wider economic data.

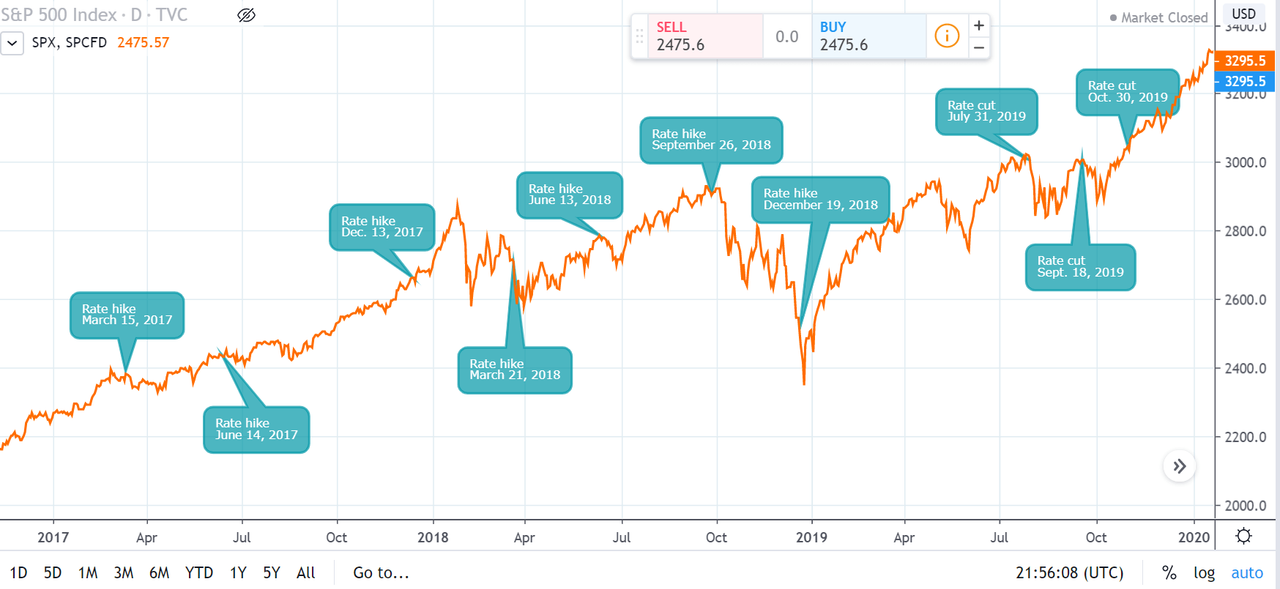
For example, while the chart below shows how the S&P 500 crashes of 2001 and 2008 coincided with recessions, it also shows how the S&P index falls of 2011 and 2015 didn’t.

Stock market and the economy don't always move together

The stock market and the economy: FAQs

When it comes to the relationship between the stock market and economic growth, traders and investors should consider the following FAQs:

1. How does the economy impact the stock market?

The economy can have a significant impact on the stock market, with fundamental drivers such as non-farm payrolls, elections, interest rates, inflation, and natural disasters all capable of influencing price. Market practitioners should make sure they have a handle on these factors and more, in order to obtain the most complete picture of potential market movements.

2. Does a downturn in equities mean recession?

A sharp downturn in equities does not necessarily mean the onset of recession, just as a long bull run does not necessarily represent continued economic strength. The former may be caused by an isolated fundamental factor for example, while the latter may mean stocks are becoming overvalued due to excess speculation.

3. What are growth stocks vs safe haven stocks?

When a bull market hits, many investors will look to incorporate traditional ‘growth’ stocks like Amazon and Facebook into a portfolio, and include fewer so-called safe haven stocks like consumer staple or healthcare businesses. However, during wider economic difficulties the latter may perform well due to the enduring necessity of the products they offer, even in tough times.

Crude Oil Heavy As Global Demand Worries Win Out Over Geopolitics

Crude Oil Heavy As Global Demand Worries Win Out Over Geopolitics

Crude oil prices wilted again on Wednesday as worries about final demand levels trumped concerns about conflict in the Middle East and its effects on supply.

Those worries are certainly well founded. Western economies are likely stuck with ‘higher for longer’ interest rates, with inflation slow to die even as recession haunts many of them. China’s brand of economic malaise also seems deep-rooted even as Beijing battles to stimulate some growth Indeed, the largest cut to benchmark mortgage rates in that country’s history failed to lift oil prices this week, suggesting few in the energy markets believe President Xi Jinping has any quick fixes at his disposal.

The International Energy Agency set the broad tone last week when it revised its 2024 oil-demand growth forecast lower. It’s now looking for a million fewer Barrels Per Day than the Organization of Petroleum Exporting Countries, tipping growth of 1.2 million BPD to OPEC’s 2.25 million.

Still, the market remains underpinned by news flow from Ukraine and Gaza. The knock-on effects of the latter war in the Persian Gulf and the Red Sea, where Yemeni militants continue to disrupt shipping are all too clear.

The Energy Information Agency’s snapshot of US stockpiles is coming up on Thursday. It will attract a lot of focus after the previous week’s big crude inventory build, which isn’t expected to be repeated.

US Crude Oil Prices Technical Analysis

The US West Texas Intermediate crude benchmark remains well within the broad uptrend established in mid-September. That looks safe enough for now as it would take a failure of channel-base support at $74.24 to threaten it and that’s a long way below the current market.

Major support closer to hand comes in at the retracement prop of $76.79 and that is in more jeopardy. Keep an eye on this on a daily and weekly closing basis as a durable slide below it might put further weakness on the cards.

There’s resistance at Tuesday’s top of $78.45 ahead of Jan 29’s one-month peak of $79.25. If the bulls can get above that and stay there, they’ll eye the trading band from October 2023 between $80.40 and $83.67 as the next barrier to progress. Still the current cautious market might well see sellers emerge at the psychological $80 handle, should it come up

Trading Breakouts with IG Client Sentiment

Trading Breakouts with IG Client Sentiment

The Two Primary Market Conditions

Despite the numerous paths that price action may take, there still remains only two main market conditions:

1. Trending

2. Ranging or Mean-Reverting

Breakouts are simply the period of transition between these two conditions.

Learn more about ranging and trending market conditions in our article, ‘Top 8 Forex Trading Strategies’

Ranging Markets – The Condition Before the Breakout

Ranging markets occur during a prolonged period of consolidation where price action oscillates between areas of support and resistance, as shown in the image below:

Range Trading Illustration

Range Trading Illustration

In well-established ranging markets, traders often employ a range trading strategy looking to go short at resistance and long at support. However, such a strategy is vulnerable to a breakout or breakdown where price builds momentum and breaks above or below the range, which ultimately results in a fresh trend.

The Basics of Breakouts

Breakouts require a consolidating or ranging price action that precedes the breakout. The word ‘breakout’ is often used to denote a sharp move that breaks above resistance and ultimately results in a fresh bullish uptrend; while a ‘breakdown’ refers to a sharp move lower that breaks below support, resulting in a new downtrend.

The Appeal Behind Breakouts

Breakouts are probably less common than continuations – because by nature it’s looking for something ‘new’ to happen versus the status quo. However, breakouts can be highly attractive to traders given the potential for large movements in a short period of time. Consider the bullish breakout as pent-up demand pushes through resistance and as prices make new highs, market participants identify the potential to get on the the long side of a developing trend and thus add to the newly found momentum.

Using IG Client Sentiment to Identify Potential Breakouts

In the traditional sense, IG Client Sentiment can be considered a leading indicator that is viewed with a contrarian bias when analyzing trending markets. This means that when retail traders are heavily positioned to one side (short or long), this presents an opportunity to trade in the other direction. This contrarian logic can also be applied to ranging markets.

Generally, a decent imbalance occurs in a market when sentiment is skewed at least 67% in one direction. In other words, there is an imbalance equal to 2 traders positioned in one direction for every 1 trader positioned in the other direction.

Client Sentiment

The reason behind this stems from what seems like an inherent desire to call tops and bottoms in strong trending markets when momentum is stacked in the opposite direction.

As a trading range develops prices can bounce multiple times between support and resistance. The more often price tests these established levels, the greater the probability that a breakout/breakdown will occur because markets cannot trade within a range forever.

Therefore, traders can look out for a sizeable imbalance in client sentiment in the opposite direction to the anticipated breakout/breakdown.

Breakout Example:

Consider the FTSE chart below with the IG client positioning overlay. Price moves between support and resistance but client positioning reveals large spikes in long sentiment. This is the first clue that that a breakdown (break below support) is possible. The second clue can be observed by the prior trend – since the market made lower highs and lower lows ever since the swing high – providing a bearish bias, looking for long-term trend continuation.

After numerous tests of support price eventually broke below support as long client sentiment reached another high, around 85% of all retail trades.

FTSE 100 Client Positioning

Risk Management for Breakout Strategies

Just like breakouts pose a potential threat to ranging strategies, a market that returns back within the existing range poses a threat the breakout strategy. Therefore, the use of stop losses is central to this style of approach.

Per our Traits of Successful Traders research, traders should always implement a positive reward-risk ratio but the breakout strategy is particularly well-suited to this method of risk management. Because the breakout presents the possibility of a large movement in a short period of time, traders can look to risk a small amount in the hopes of capitalizing on the large movement should the breakout occur; and if the breakout fails or reverses – the goal of loss mitigation can then become prioritized.

Oil Prices Forecast: Stable Amid Middle East Tensions, China’s Demand Rebound

Oil Prices Forecast: Stable Amid Middle East Tensions, China’s Demand Rebound

Oil Prices Steady Amid Mixed Influences

Oil prices remained stable but lower on Tuesday, with West Texas Intermediate (WTI) crude fluctuating near three-week highs. Influences include Middle East tensions and China’s recovering demand. Traders were also eyeing the U.S. Dollar due to its potential impact on foreign demand.

Current Oil Prices

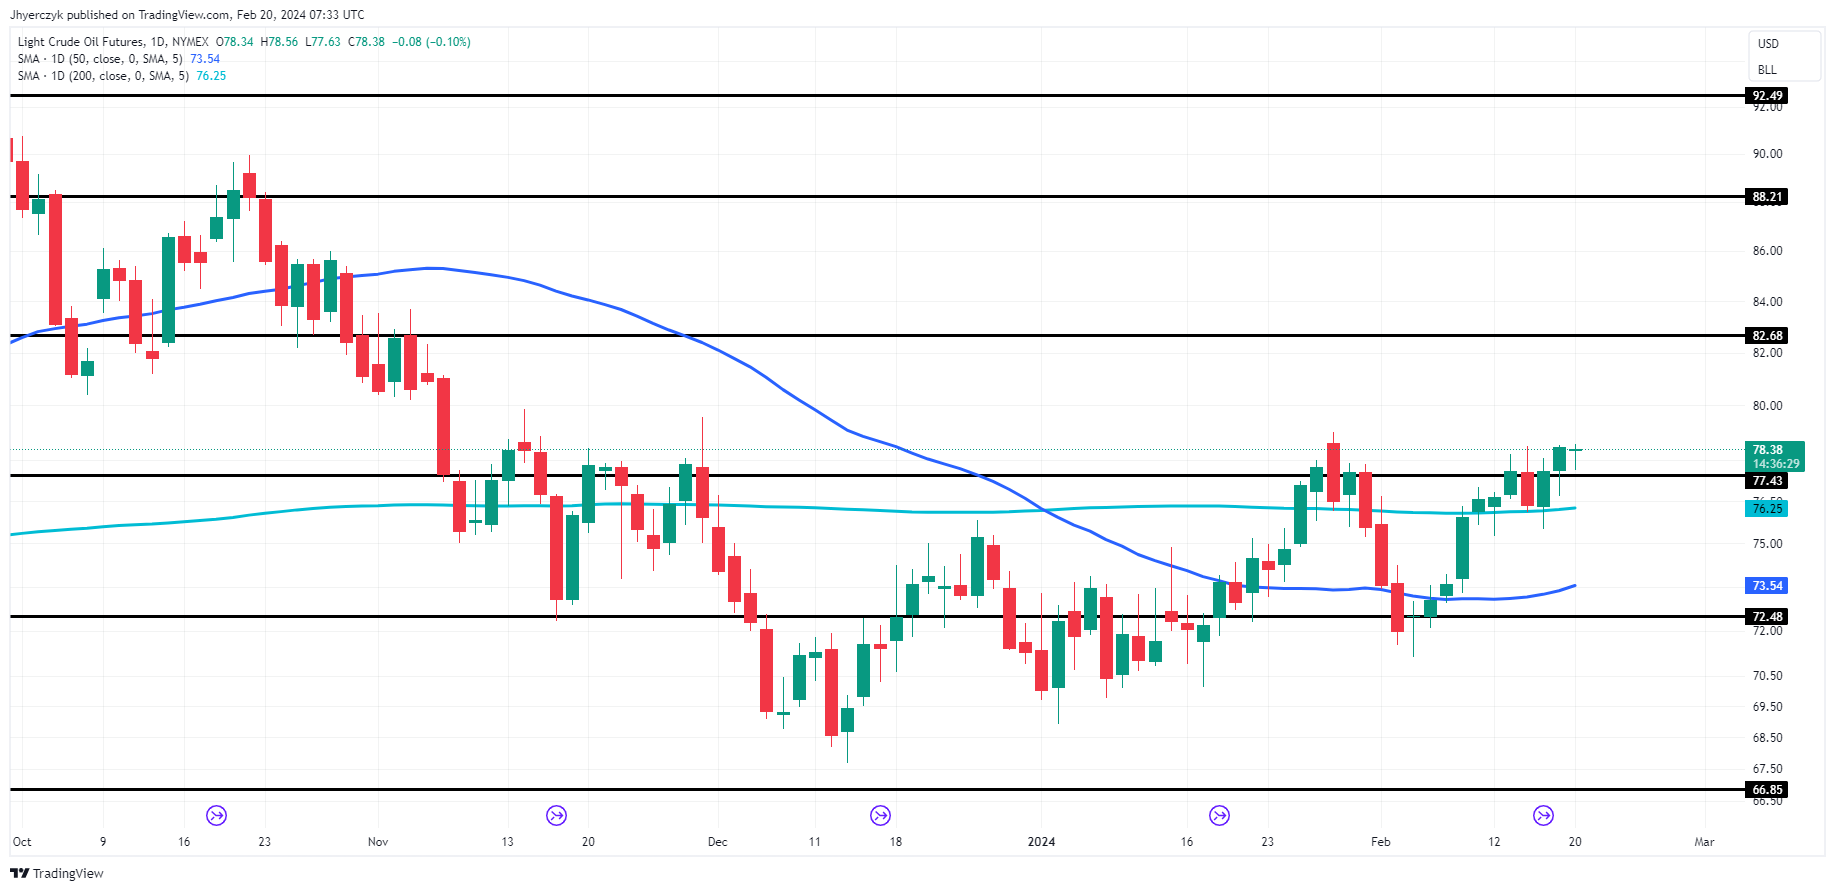
At 07:23 GMT, Light Crude Oil Futures were trading $78.34, down $0.12 or -0.15%.  The U.S. observed Presidents’ Day, pausing WTI settlement.

Middle East Tensions and China’s Demand

Heightened geopolitical tensions in the Middle East, particularly the Houthi attacks on shipping lanes, have impacted oil prices. The Houthis’ recent attacks, including on the Rubymar cargo vessel, intensified concerns. Concurrently, China’s stronger demand, evidenced by a 47.3% surge in tourism revenues and a cut in mortgage rates to support its economy, has positively influenced market sentiment.

Balancing Growth and Challenges

Despite these positive factors, concerns persist. The International Energy Agency’s recent report predicting a decline in oil demand growth due to renewable energy’s rise has affected market outlook. Additionally, the strength of the U.S. Dollar and its impact on oil prices as a dollar-denominated asset is under scrutiny. Last week’s U.S. economic data influenced expectations of Federal Reserve’s interest rate decisions, impacting dollar strength and, consequently, oil demand.

Short-Term Market Forecast: Neutral with a Bullish Tendency

Given the current blend of factors, the short-term forecast for oil markets appears neutral but with a leaning towards bullish. Middle East tensions and China’s demand recovery are positive indicators that may support higher prices. However, the influence of the U.S. Dollar’s strength and potential changes in Federal Reserve interest rate policies could counterbalance these bullish trends. The market seems to be in a state of flux, with these opposing factors creating a cautiously optimistic outlook.

Technical Analysis

Daily Light Crude Oil FuturesLight crude oil futures are lower on Tuesday, but remain on the cusp of a potential breakout to the upside.

Bullish Scenario:  A sustained breakout over the main top at $79.10 could trigger an acceleration to the upside with $82.68 the next major target price.

Bearish Scenario:  The inability to hold the static support at $77.43 will be a sign of weakness. This could trigger a break into the 200-day moving average at $76.25. Since the trend is up, buyers are likely to come in on the first test of this moving average.

However, a failure at the 200-day MA will change the longer-term trend to down with the 50-day MA at $73.54 the next major target.

US Dollar Forecast: EUR/USD, GBP/USD React to $104.365 Surge & Market Shifts

US Dollar Forecast: EUR/USD, GBP/USD React to $104.365 Surge & Market Shifts

USD Strengthens, Impacting EUR/USD and GBP/USD Amid Key Economic Indicators

In the current financial landscape, the US Dollar exhibits a bullish momentum, trading at $104.364 with a 0.22% uptick, influencing major currency pairs such as EUR/USD and GBP/USD.

The GBP has faced a slight discrepancy in housing market expectations, evidenced by the Rightmove HPI month-on-month data, which posted a 0.9% increase against a forecasted 1.3%.

Events Ahead

The focus shifts towards significant economic releases and central bank communications:

  • For the Eurozone: The Current Account data, anticipated at €20.3 billion, down from €24.6 billion, will provide insights into the Eurozone’s trade balance.
  • For the UK: Attention turns to the Monetary Policy Report Hearings. The Bank of England’s Monetary Policy Committee (MPC) members’ deliberations on interest rate decisions and their public engagements are crucial.

Additionally, the Composite Leading Index, which amalgamates 10 economic indicators, will provide a broader view of the US economic outlook. This index, reflecting aspects such as employment, consumer confidence, and housing, could further influence the US Dollar’s strength and, by extension, its relationship with major currency pairs.

US Dollar Index (DXY)

Dollar Index
Dollar IndexThe Dollar Index’s is trading with a bullish bias with it’s pivotal holds around $104.197. Looking forward, resistance levels at $104.594, $104.987, and $105.283 delineate the potential ceilings the index might encounter. Conversely, support is established at $104.031, further down to $103.803 and $103.613, which could serve as floors in case of a downward shift.

The technical landscape, highlighted by the 50-Day and 200-Day EMAs at $104.30 and $103.73 respectively, leans towards a bullish sentiment above the pivot point, suggesting a potential for upward momentum continuation.

EUR/USD Technical Forecast

EUR/USD Price Chart - Source: Tradingview
EUR/USD Price Chart

Support is found slightly lower at 1.07440, followed by 1.07223 and 1.06937, indicating zones where the pair might find a floor in the case of further declines.

The 50 EMA at 1.0766 and the 200 EMA at 1.0822 hint at a bullish trend above the pivot point, suggesting room for upward movement if the pair maintains above these levels.

GBP/USD Technical Forecast

GBP/USD Price Chart - Source: Tradingview
GBP/USD Price Chart
The GBP/USD pair slightly declined by 0.02%, currently positioned at 1.25901. This subtle movement underscores the ongoing volatility and market sensitivity to broader economic indicators and geopolitical events.

The pair’s immediate pivot point at 1.2624 signifies a critical juncture, with resistance levels marked at 1.2655, 1.2683, and 1.2720, suggesting potential ceilings for upward momentum.

Conversely, support is established at 1.2552, with further levels at 1.2512 and 1.2479, delineating areas where the pair might find footing in case of a pullback.

The 50-day and 200-day EMAs, at 1.2601 and 1.2636 respectively, indicate a bullish inclination above the pivot, hinting at possible ascension if these thresholds are surpassed.

Gold Prices Forecast: Steady as Traders Eye FOMC Minutes for Clues

Gold Prices Forecast: Steady as Traders Eye FOMC Minutes for Clues

Gold Market Outlook Amid Fed Minutes Release

Gold prices are steady in the face of a stronger dollar and higher Treasury yields, as investors await key insights from the U.S. Federal Reserve’s latest meeting minutes regarding interest rate cut timing.

Market Context

The U.S. markets recently observed a closure for President’s Day, contributing to lower volatility levels. Despite a 0.1% increase in the dollar index and 10-year Treasury note yields above 4%, gold’s appeal hasn’t waned significantly. This resistance to typical market pressures indicates a robust underlying interest in gold.

Anticipated Fed Minutes Impact

The upcoming Federal Open Market Committee (FOMC) minutes are a critical focus, expected to shed light on the Fed’s interest rate strategies. However, the market anticipates limited surprises due to the Fed’s transparent stance before the last inflation data release. Consequently, gold’s short-term trend is likely to be driven more by technical factors than the FOMC revelations.

Federal Reserve’s Position

Fed Chair Jay Powell has been vocal against rapid rate cuts since the January policy meeting. With the Fed maintaining rates at 5.25-5.5% and signaling only three potential cuts this year, expectations have been tempered. Recent inflation reports support the Fed’s cautious approach, which is likely to be echoed in the forthcoming minutes.

Inflation and Rate Cut Expectations

Unexpectedly high U.S. inflation data has cast doubts on an immediate rate cut, shifting market expectations to a potential cut in June. This alteration in the interest rate landscape influences gold’s attractiveness as a non-yielding asset.

Short-Term Forecast

In the short term, gold is leaning toward a somewhat bullish trend. The anticipation surrounding the Fed minutes, combined with technical market factors, suggests a potential uptick in gold prices. While the Fed’s reaffirmed focus on inflation might usually dampen gold’s appeal, the market’s adjusted rate cut expectations and gold’s recent resilience indicate a cautiously optimistic outlook for the metal. This sentiment, coupled with ongoing global economic uncertainties, positions gold favorably in the eyes of experienced traders.

Technical Analysis

Daily Gold (XAU/USD)Gold (XAU/USD) is edging higher for a fourth session on Tuesday as traders approach the 50-day moving average at $2030.65. Trader reaction to this level will determine the intermediate trend.

If the intermediate trend turns up then look for a possible near-term trade into resistance at $2067.00.

The inability to overcome the 50-day MA will signal a resumption of the downtrend. This could lead to a short-term test of the static support at $2009.00 and the recent main bottom a

XRP News: Ongoing Investigation Threatens SEC Plans to Appeal Court Ruling

XRP News: Ongoing Investigation Threatens SEC Plans to Appeal Court Ruling

Remedies-Related Discovery and Last-Minute Filings

On Monday, there were no SEC v Ripple case-related updates. The US courts were closed for President’s Day. However, remedies-related discovery ends on Tuesday, February 20. Last-minute filings will need consideration.

The SEC is looking to quickly conclude the case to appeal against the Programmatic Sales of XRP ruling. Nonetheless, the SEC is also pushing for a punitive penalty for Ripple not registering XRP as a security in sales to institutional investors.

Last-minute filings in discovery could affect the timeline for the filing of remedy-related briefs. According to the Court briefing schedule, the SEC must file a remedy-related brief by March 13. Ripple must file its remedy-related brief by April 12. The SEC can respond to the Ripple filing with a reply brief by April 19.

The briefs will influence the quantum of the penalty Ripple must pay for breaching Section 5 of the US Securities Act. Considering Ripple’s legal bill, the crypto community and Ripple will likely stomach anything less than the estimated $200 million legal bill.

However, between now and the court ruling, SEC Chair Gary Gensler and the SEC could face more scrutiny from the courts and US lawmakers.

On Monday, Ripple Chief Legal Officer reacted to a Wall Street Journal news article, saying,

“The Wall Street Journal again calls out the fact that “Americans live under constant threat of an arbitrary administrative state” from lawless regulators. The last line of defense are the courts, and the lawyers and clients willing to fight.”

The US courts have proven to be the last line of defense. Recently, the SEC v Debt Box case became high profile after the court ordered,

“The SEC to show cause why it should not be sanctioned for making false and misleading representations to the court.”

The SEC responded to the order by filing a Motion to Dismiss, dropping the charges against Debt Box. Within the Motion to Dismiss, the SEC argued,

“While the Commission recognizes that its attorneys should have been more forthcoming with the Court, sanctions are not appropriate or necessary to address those issues.”

Presiding Judge Robert Shelby may still call on the SEC to give more justifiable reasoning to avoid sanctions. The crypto community may argue that the courts let the SEC off the hook if there are no sanctions.

However, recent cases suggest that the SEC may avoid further sanctions despite Judge Shelby’s court order.

The SEC Faces Troubled Times in the US Courts

In December, Alderoty shared several examples of the courts criticizing SEC behavior. The increased court scrutiny of the SEC could influence the outcome of ongoing cases against crypto firms.

Moreover, continued inappropriate actions may require US lawmakers to follow through on recent threats.

On February 7, five US Senators, including Senator Cynthia Lummis, co-signed a letter to SEC Chair Gary Gensler. The Senators reacted to the SEC dropping the charges against Debt Box. Significantly, the Senators threatened scrutiny of other enforcement cases.

Last week, Chair Gensler attempted to brush off the increased scrutiny, saying,

“I think we’re doing everything according to the law and how the courts interpret the law. And as the courts shift their interpretations, jobs like mine are both more challenging and more interesting.”

The infractions with the courts and Gensler’s comments may draw more scrutiny from US lawmakers. In September, Chair Gensler gave testimony at a Financial Services Committee hearing. Committee Chair Patrick McHenry had this to say to the SEC Chair,

“You said the law is clear, but your actions have created more confusion and lasting damage.”

Committee Chair Patrick McHenry also issued a threat to the SEC Chair, saying,

“As I said, our patience is running thin. The SEC is not above the law nor is it unique. […] Let me be clear, I do not want to be the first chairman of this Committee to issue a subpoena to the Securities and Exchange Commission. And you should not want to be the first SEC Chair to receive a Congressional Subpoena.”

In January, the crypto community called on Chair McHenry to follow through with his threats to subpoena Chair Gensler. US lawmakers may need to step forward and address recent infractions by the SEC. Increased scrutiny could force the SEC to rethink plans to appeal against the Programmatic Sales of XRP ruling.

SEC Plans to Appeal an SEC v Ripple Court Ruling Are Under Threat

An ongoing Office of Inspector General (OIG) investigation into reports of conflicts of interest could incentivize US lawmakers to investigate SEC practices. If the OIG finds evidence of conflicts of interest, the SEC may have to end plans to appeal against the Programmatic Sales ruling. The investigation relates to former SEC Director William Hinman.

Empower Oversight sued the SEC in 2021. The US non-profit government watchdog claimed William Hinman received millions of dollars from his former employer, Simpson Thacher, while guiding crypto regulations at the SEC. Simpson Thacher is part of a group promoting Enterprise Ethereum. Hinman returned to Simpson Thacher after leaving the SEC.

Court-related documents revealed Hinman continued meeting Simpson Thacher despite warnings from the SEC’s ethics division.

An end to SEC plans to appeal against the Programmatic Sales ruling would be a boon for XRP and the broader market.

XRP Price Action

Weekly Chart sends bullish price signals.
XRPUSD 200224 Weekly Chart

Daily Chart

XRP remained above the 50-day and 200 EMAs, affirming bullish price signals.

An XRP breakout from the $0.57 handle would bring the $0.5835 resistance level into play.

SEC v Ripple case-related chatter, OIG investigation updates, and US lawmaker scrutiny need consideration.

However, a drop below the 200-day EMA would bring the 50-day EMA and the $0.5470 support level into play.

The 14-day RSI reading, 58.90, suggests an XRP return to the $0.5835 resistance level before entering overbought territory.

XRP Daily Chart sends bullish price signals.
XRPUSD 200224 Daily Chart

4-Hourly Chart

On the 4-hourly, XRP hovered above the 50-day and 200-day EMAs, confirming the bullish price trends.

An XRP return to the $0.57 handle would give the bulls a run at the $0.5835 resistance level.

However, a break below the 50-day EMA and the $0.5470 support level would support a fall to the 200-day EMA.

The 4-hourly RSI, with a reading of 55.17, indicates an XRP return to the $0.5835 resistance level before entering overbought territory.

4-Hourly Chart sends bullish price signals.

Euro Slips In Holiday Thinned Market, Looks Nervously to German PMI

Euro Slips In Holiday Thinned Market, Looks Nervously to German PMI

The Euro lost a little ground against the United States Dollar on Monday but, as the latter’s home market is going to be largely shut down for the Presidents’ Day break, the real trading action will probably come later in the week when the data releases start to trickle out.

The first big one will be on the Dollar side, with the release of minutes from the Federal Reserve’s last monetary policy meeting due on Wednesday. These might now look even more historic than usual given that robust economic numbers out of the US since the meeting have seen rate-cut expectations pushed out to June, but the nuances of Fed discussion usually manage to move markets, if not always durably.

The Euro may struggle a bit on Thursday if the closely watched February Purchasing Managers Index snapshot out of Germany can’t beat gloomy expectations. The manufacturing sector is expected to have continued to contact, if at a slower pace than in the previous month. A reading of 46.1 is expected, after January’s 45.5. Anything below 50 signifies a contraction for the sector, and this gauge has been below that since early 2022.

As-expected figures will hardly suggest that the German economy needs the current, record-high interest rates it’s stuck with, but the European Central Bank will want to be sure that inflation has been stopped before it offers any relief there and rate cuts aren’t expected to come anytime soon. Indeed, some economists think we could be well into next year before inflation returns to its 2% target.

The Euro has been weakening against its US rival all year and there seems little on this week’s schedule likely to halt that process.

EUR/USD Technical Analysis

EUR/USD

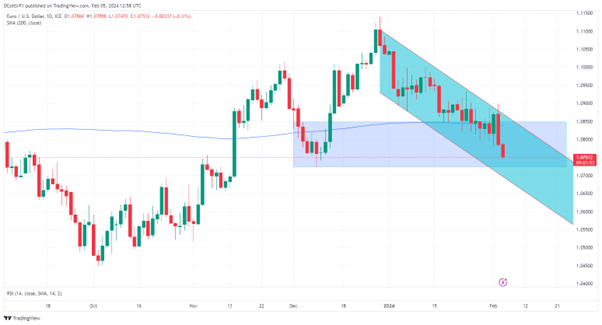
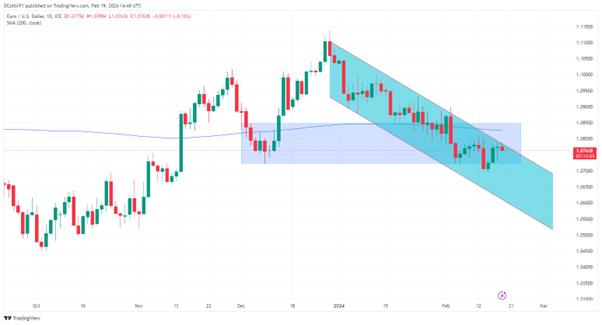
The downtrend channel from December 28’s closing high has been remarkably well respected since, with its current top of 1.07853 now likely to see rejection.

The slide since late January has also seen the back in a broad trading range last seen in early December, between 1.08495 and 1.07247. The single currency did nudge below the range base last week, but it wasn’t there for long and it traded back into the band very quickly, suggesting that Euro bulls are prepared to show some resolve at those levels.

Keep an eye on the 200-day moving average for this pair now. It slipped below the line on February 2 and hasn’t been able to get back to it since. The average is now some way above the market at 1.08625.

IG’s sentiment data finds traders balanced finely between bullishness and bearishness over EUR/USD, perhaps suggesting that this is a market in need of a new catalyst.