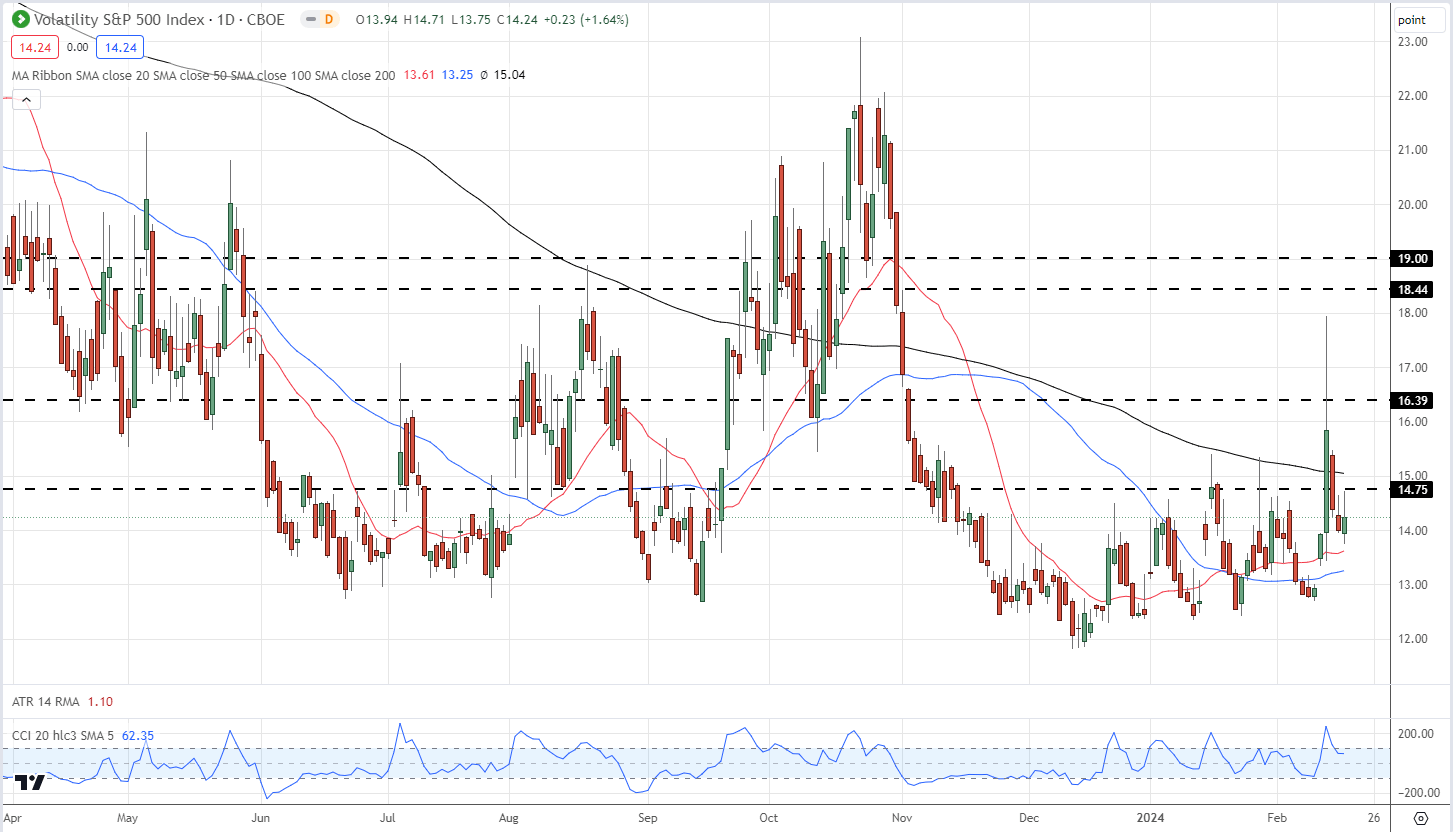
The mid-week volatility can be clearly seen in the daily VIX chart with a sharp post-US CPI rally on Tuesday. Again this move was reversed during the rest of the week.
VIX Daily Chart
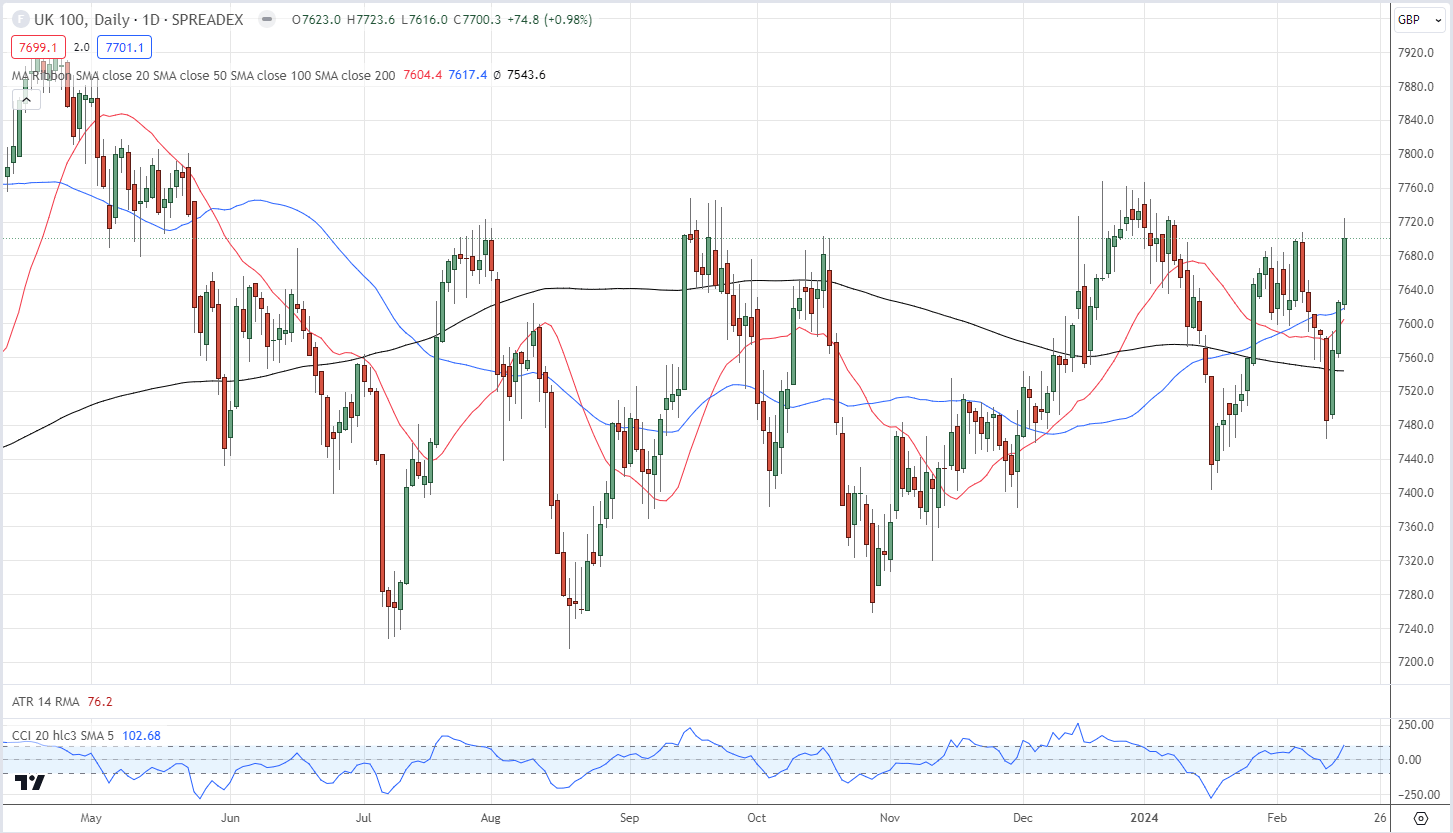
While US indices remain at, or near to, recent multi-year highs, one index that has underperformed global rivals, the FTSE 100, had a very strong week on the back of supportive UK economic data. The UK 100 also benefitted from the slightly stronger US dollar with around 70% of company earnings made overseas.
FTSE 100 Daily Chart
Gold also trimmed losses this week, helped in part by the precious metal being heavily oversold, according to one technical indicator.
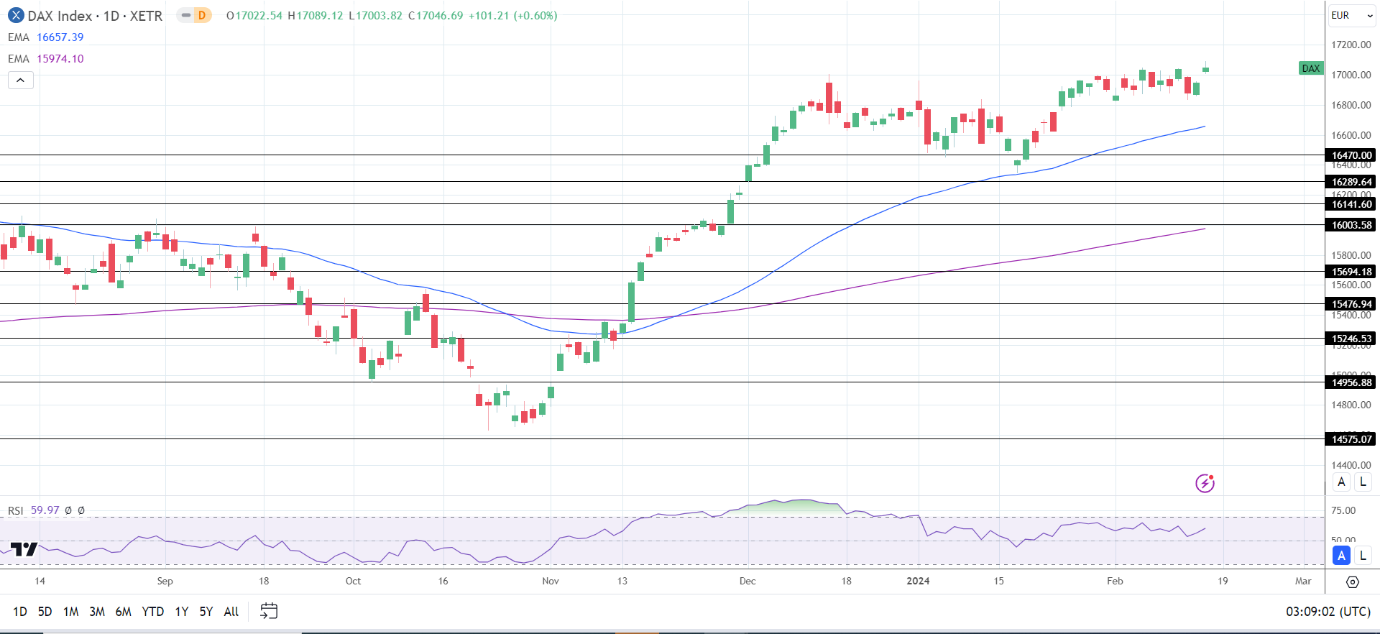
The DAX gained 0.60% on Thursday. Following a 0.38% rise on Wednesday, the DAX ended the session at 17,047. Significantly, the DAX climbed to a new all-time high of 17,089.
Eurozone Trade, ECB President Lagarde, and Corporate Earnings
On Thursday, Eurozone trade data drew investor interest. In December, the Eurozone trade surplus narrowed from €20.3 billion to €16.8 billion. Investors reacted to the weaker-than-expected numbers amidst the rising threat of a Eurozone recession.
Inflation and growth forecasts also influenced buyer demand for DAX-listed stocks. The European Commission released growth and inflation forecasts for 2024. The European Commission expected the eurozone economy to grow by 0.8% in 2024, down from 1.2% in the previous projection.
The Commission forecast Eurozone inflation to soften from 5.4% in 2023 to 2.7% in 2024, down from a previously forecasted 3.2%.
ECB President Lagarde failed to pour cold water on positive investor sentiment. The ECB President said inflation would continue to fall toward target over 2024. However, Lagarde also said the ECB must be confident that inflation will sustainably return to target before cutting rates.
Corporate earnings did drive buyer demand for DAX-listed stocks.
US Retail Sales Raise H1 2024 Fed Rate Cut Bets
On Thursday, US retail sales figures for January refueled bets on an H1 2024 Fed rate cut. Retail sales fell by 0.8% after rising 0.4% in December. A modest fall in jobless claims signaled stable labor market conditions. Initial jobless claims fell from 220k to 212k in the week ending February 10.
10-year US Treasury yields reacted to the retail sales figures, falling 0.54% to 4.236%. The pullback in yields drove demand for riskier assets.
On Thursday, the Nasdaq Composite gained 0.30%. The Dow and S&P 500 ended the day up 0.91% and 0.58%.
The Thursday Market Movers
Commerzbank led the way, rallying 5.53% as investors reacted to a 55% surge in 2023 net profit.
Auto stocks were also among the front-runners. Mercedes-Benz Group gained 2.01%. BMW and Porsche ended the day up 1.44% and 1.72%, respectively. Volkswagen rose by 1.19%. Better-than-expected earnings from Renault drove buyer demand for auto stocks.
However, Airbus Group declined by 1.00% after missing earnings forecasts.
German Wholesale Prices and the ECB in Focus
On Friday, German wholesale prices for January will garner investor interest. ECB President Lagarde talked about the ECB needing confidence about inflation sustainably returning to target. A larger-than-expected fall in wholesale prices could further ease demand-driven inflationary pressures.
Economists forecast German wholesale prices to decline by 2.5% year-over-year. In December, wholesale prices were down 2.6% year-on-year.
Beyond the inflation figures, investors must monitor ECB chatter. ECB Executive Board member Isabel Schnabel is on the calendar to speak. Support for ECB an interest rate cut in April would support the buyer appetite for DAX-listed stocks.
US Economic Data and Fed Speakers in Focus
Later in the European session, US producer prices and consumer sentiment also warrant investor attention. A more marked than forecast increase in producer prices could impact bets on an H1 2024 Fed rate cut. Economists forecast producer prices to increase by 0.1% in January after falling 0.1% in December.
An upward trend in producer prices and consumer confidence could fuel demand-driven inflation. Economists forecast the Michigan Consumer Sentiment Index to increase from 79 to 80 in February.
Beyond the numbers, FOMC member commentary could also move the dial. FOMC member Michael Barr is on the calendar to speak. Views on inflation and interest rates could influence market risk sentiment.
Short-term Forecast
Near-term trends for the DAX remain hinged on inflation-linked economic indicators and central bank commentary. Hotter-than-expected wholesale and producer prices could reduce bets on H1 2024 ECB and Fed rate cuts.
On Wednesday, the DAX futures and Nasdaq mini were up 54 and 28 points, respectively.
DAX Technical Indicators
Daily Chart
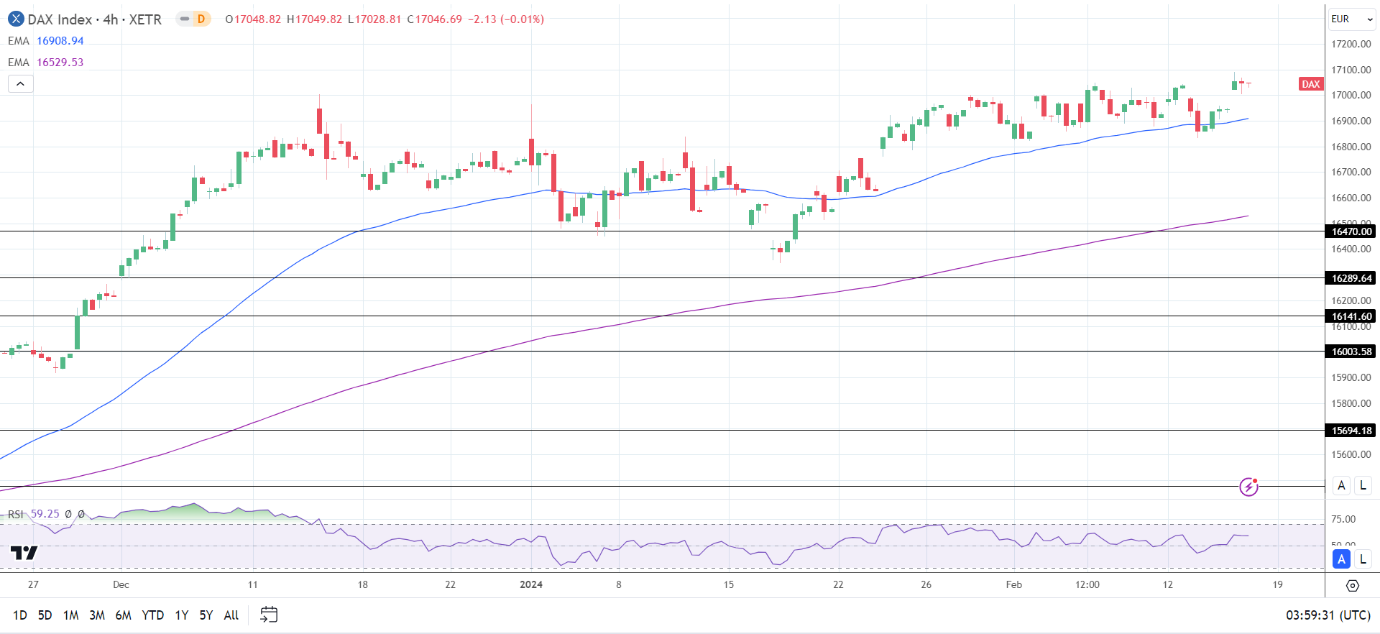
The DAX sat well above the 50-day and 200-day EMAs, sending bullish price signals.
A DAX break above the Thursday all-time high of 17,089 would support a move through the 17,100 handle.
On Friday, inflation-linked economic indicators and central bank commentary need consideration.
However, a drop below the 17,000 handle would bring sub-16,900 levels into play.
The 14-day RSI at 59.97 suggests a DAX break above 17,100 before entering overbought territory.
DAX 160224 Daily Chart
4-Hourly Chart
The DAX remained above the 50-day and 200-day EMAs, affirming the bullish price signals.
A DAX move through the all-time high of 17,089 would bring the 17,100 handle into play.
However, a drop below the 17,000 handle would give the bears a run at the 50-day EMA.
The 14-period 4-hour RSI at 59.25 indicates a move through the 17,100 handle before entering overbought territory.
USD Outlook: Mixed Signals Ahead with Core PPI and Consumer Sentiment on Deck
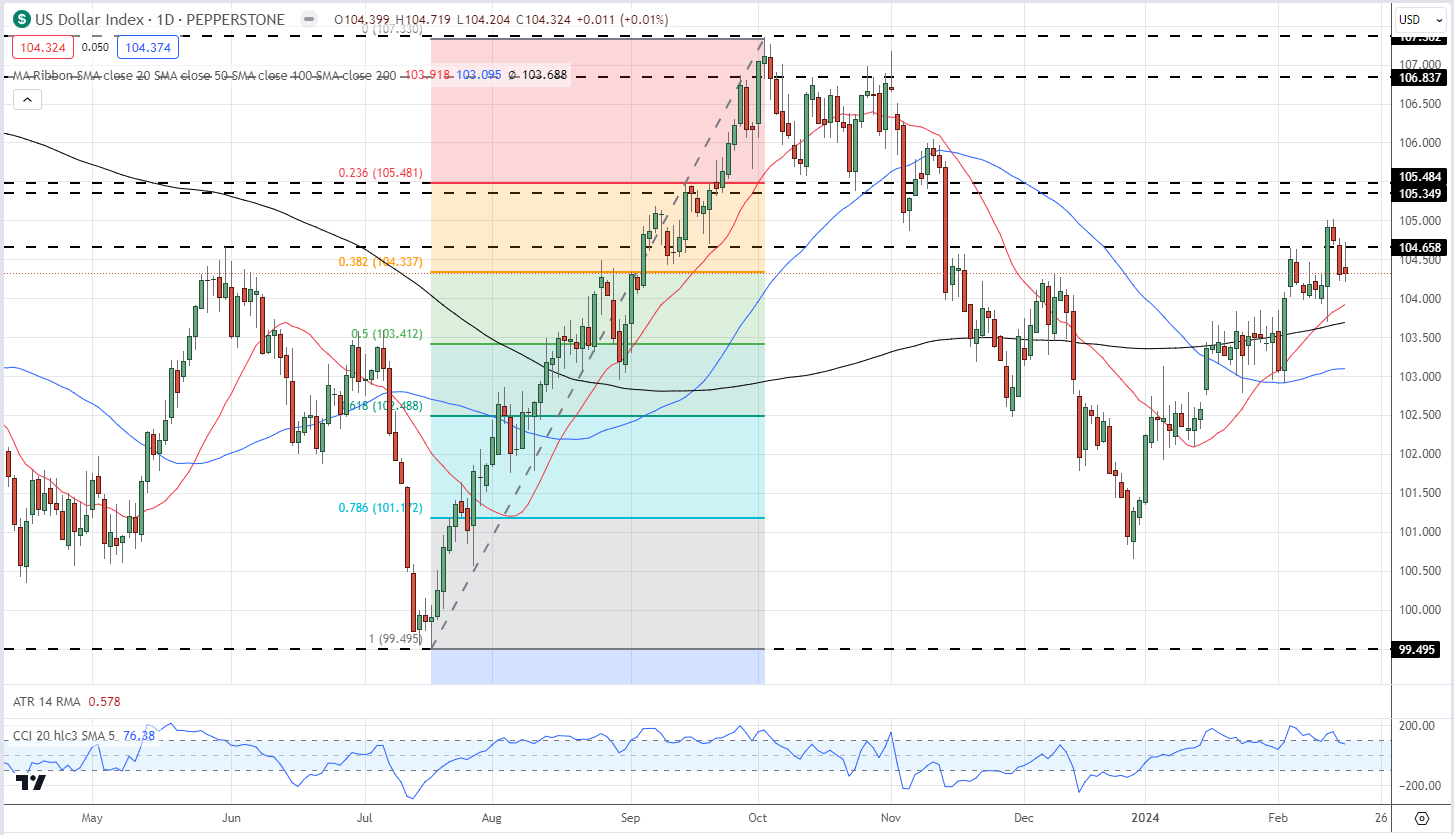
The US Dollar sees a modest recovery to 104.423 following a 0.41% dip in the Dollar Index, amidst a landscape of divergent US economic indicators. Core Retail Sales and Retail Sales contracted by 0.6% and 0.8%, respectively, reflecting a cautious consumer mood.
However, slight improvements in the Empire State Manufacturing Index and a rebound in the Philly Fed Manufacturing Index offer a counterbalance.
Events Ahead
In the upcoming economic docket, the USD is poised for pivotal data releases that could steer market sentiment. Core Producer Price Index (PPI) and PPI, both anticipated at 0.1%, are set to offer a glimpse into the inflationary landscape of the US economy.
Additionally, Building Permits, expected at 1.51 million, alongside the Preliminary University of Michigan Consumer Sentiment Index, pegged at 80.0, are crucial for gauging the health of the housing market and the overall economic optimism among consumers.
In the Eurozone, the focus shifts towards inflation and economic health indicators, with France’s Final Consumer Price Index (CPI) and Germany’s Wholesale Price Index (WPI) under the spotlight. Across the Channel, the UK’s Retail Sales data emerges as a critical factor, with projections hinting at a rebound.
Advertisement
US Dollar Index (DXY)
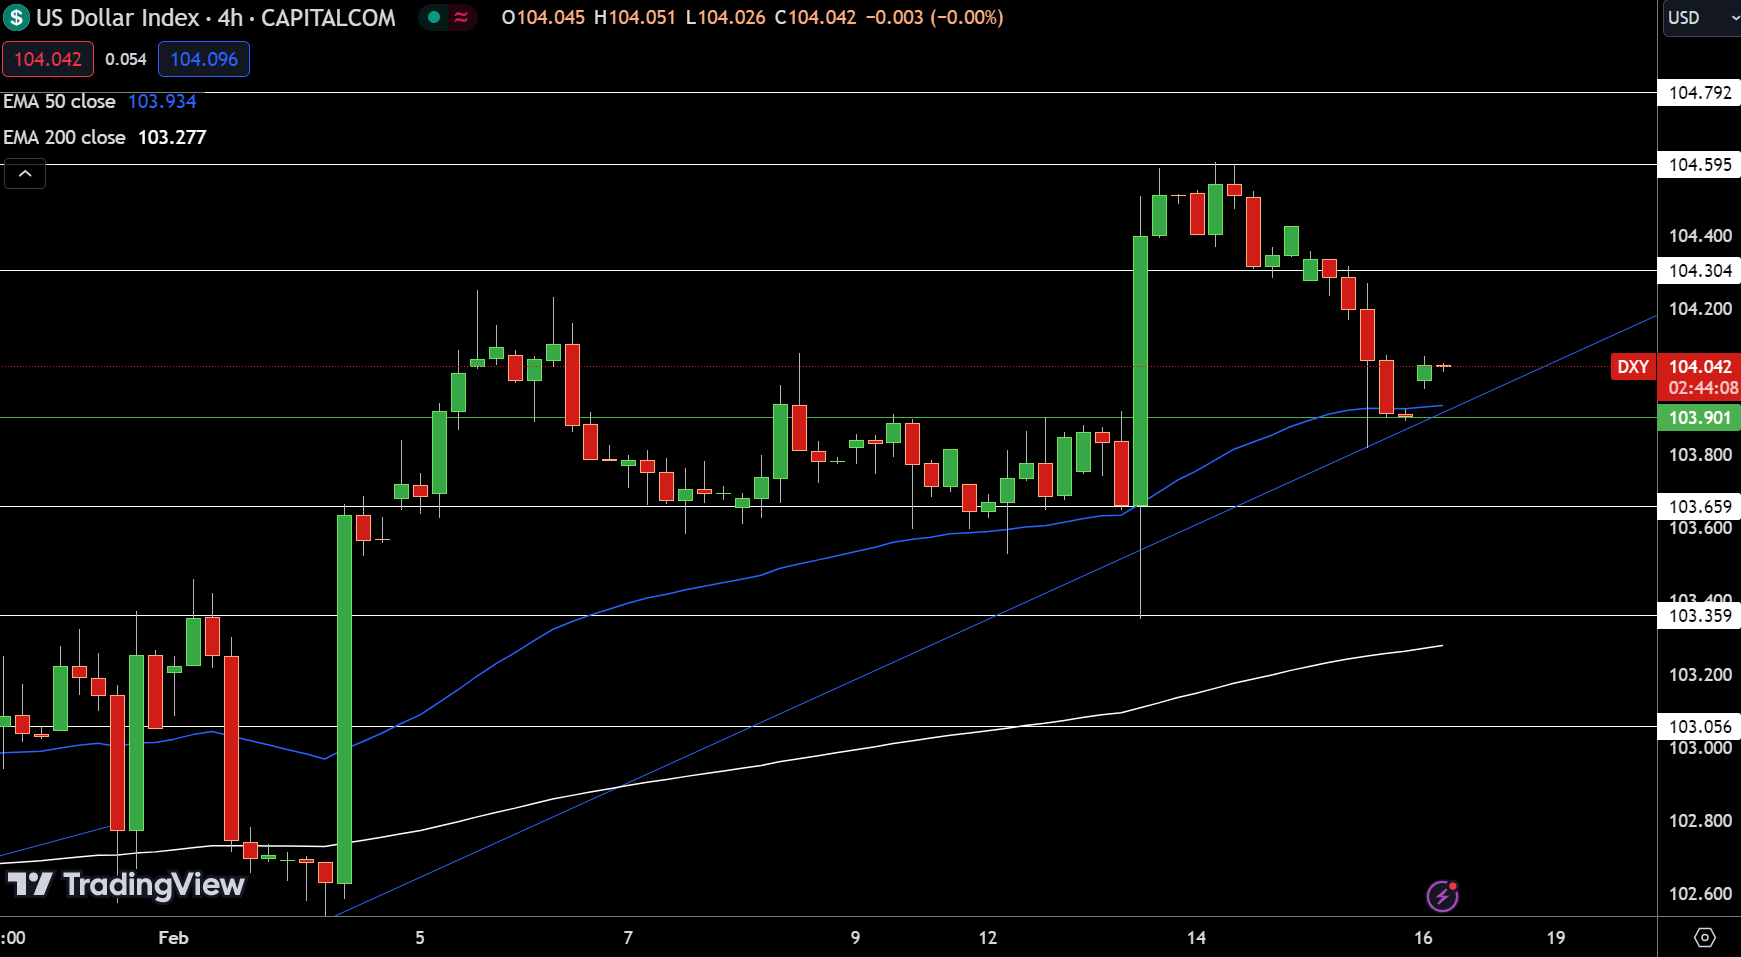
Dollar IndexThe Dollar Index’s pivotal point holds around 103.901, indicating a bullish sentiment as it trades above this mark.
Resistance levels are identified at 104.304, 104.595, and 104.792, potentially capping upward movements. Support levels are delineated at 103.659, 103.359, and 103.056, offering floors to buffer any declines.
The 50-Day and 200-Day Exponential Moving Averages, at 103.934 and 103.277 respectively, reinforce the bullish outlook, particularly as the index sustains above the 103.900 level, suggesting continued upward momentum.
EUR/USD Technical Forecast
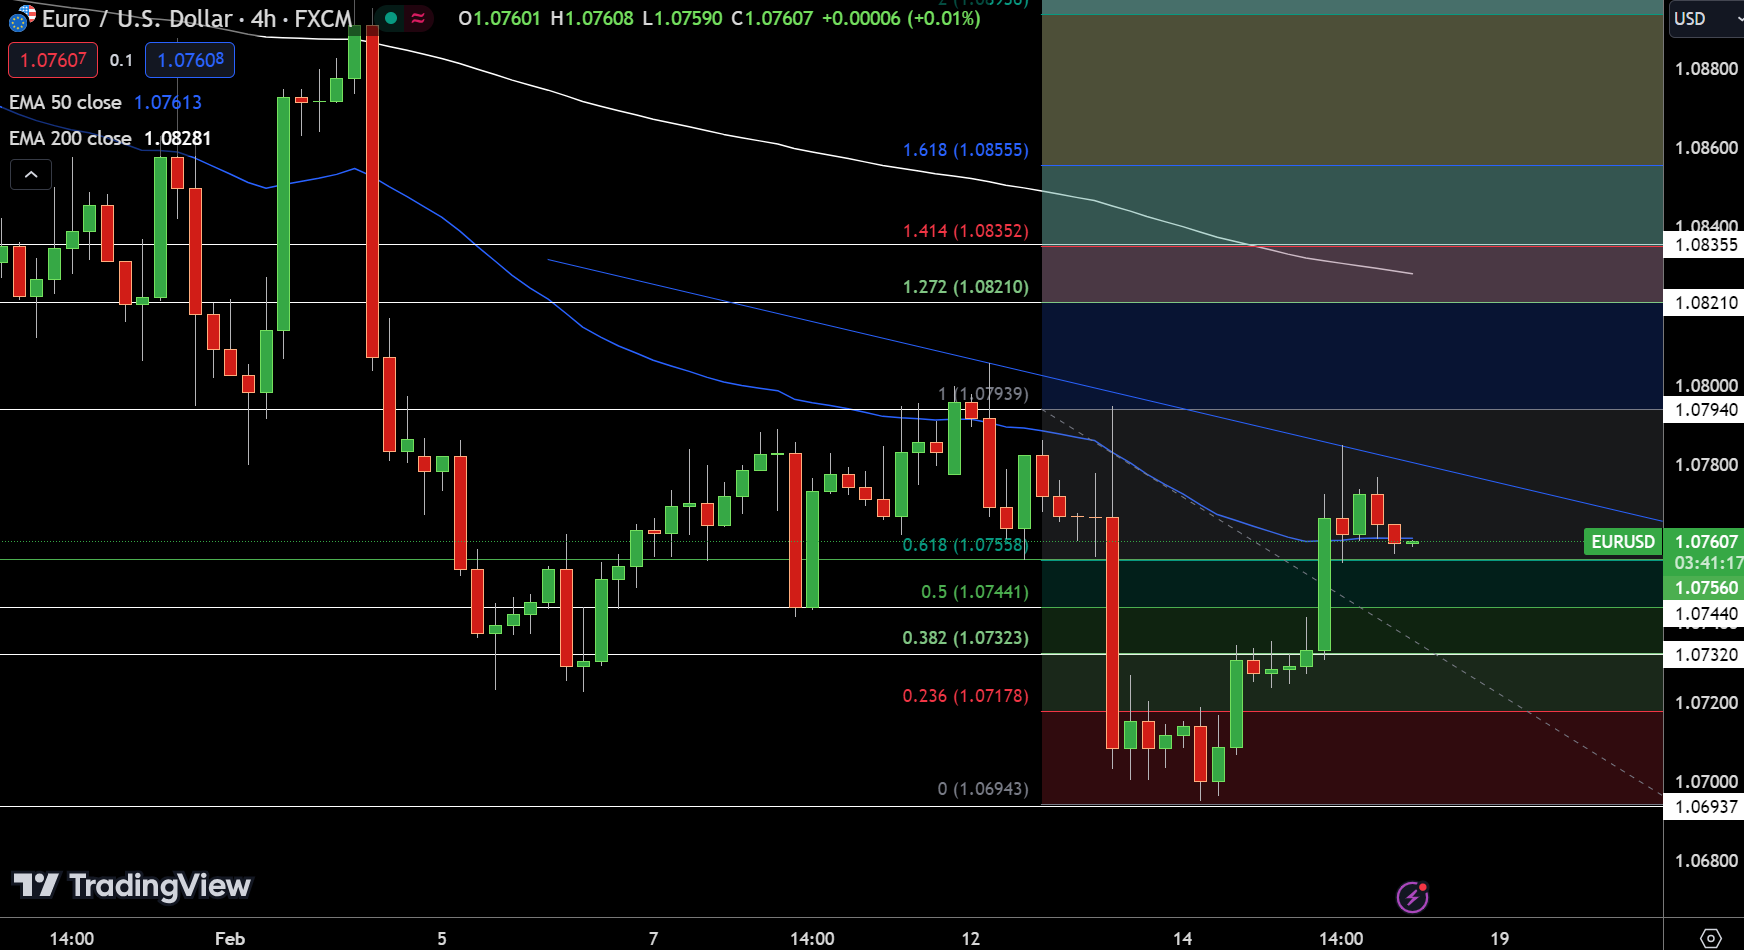
EUR/USD Price Chart – Source: TradingviewIn today’s financial landscape, the EUR/USD pair trades at 1.07600, marking a decrease of 0.12%. Positioned slightly below its pivot point of 1.07607, this currency pair confronts immediate resistance at 1.07940, with subsequent thresholds at 1.08210 and 1.08355.
Conversely, support levels are established at 1.07440, 1.07320, and 1.06937, which could play pivotal roles in upcoming trading sessions. The 50-Day and 200-Day Exponential Moving Averages stand at 1.07613 and 1.08281, respectively, signaling a cautious market sentiment.
This positioning indicates a potential bullish trend if it surpasses 1.0795, suggesting a closely watched market dynamic for traders and investors alike.
GBP/USD Technical Forecast
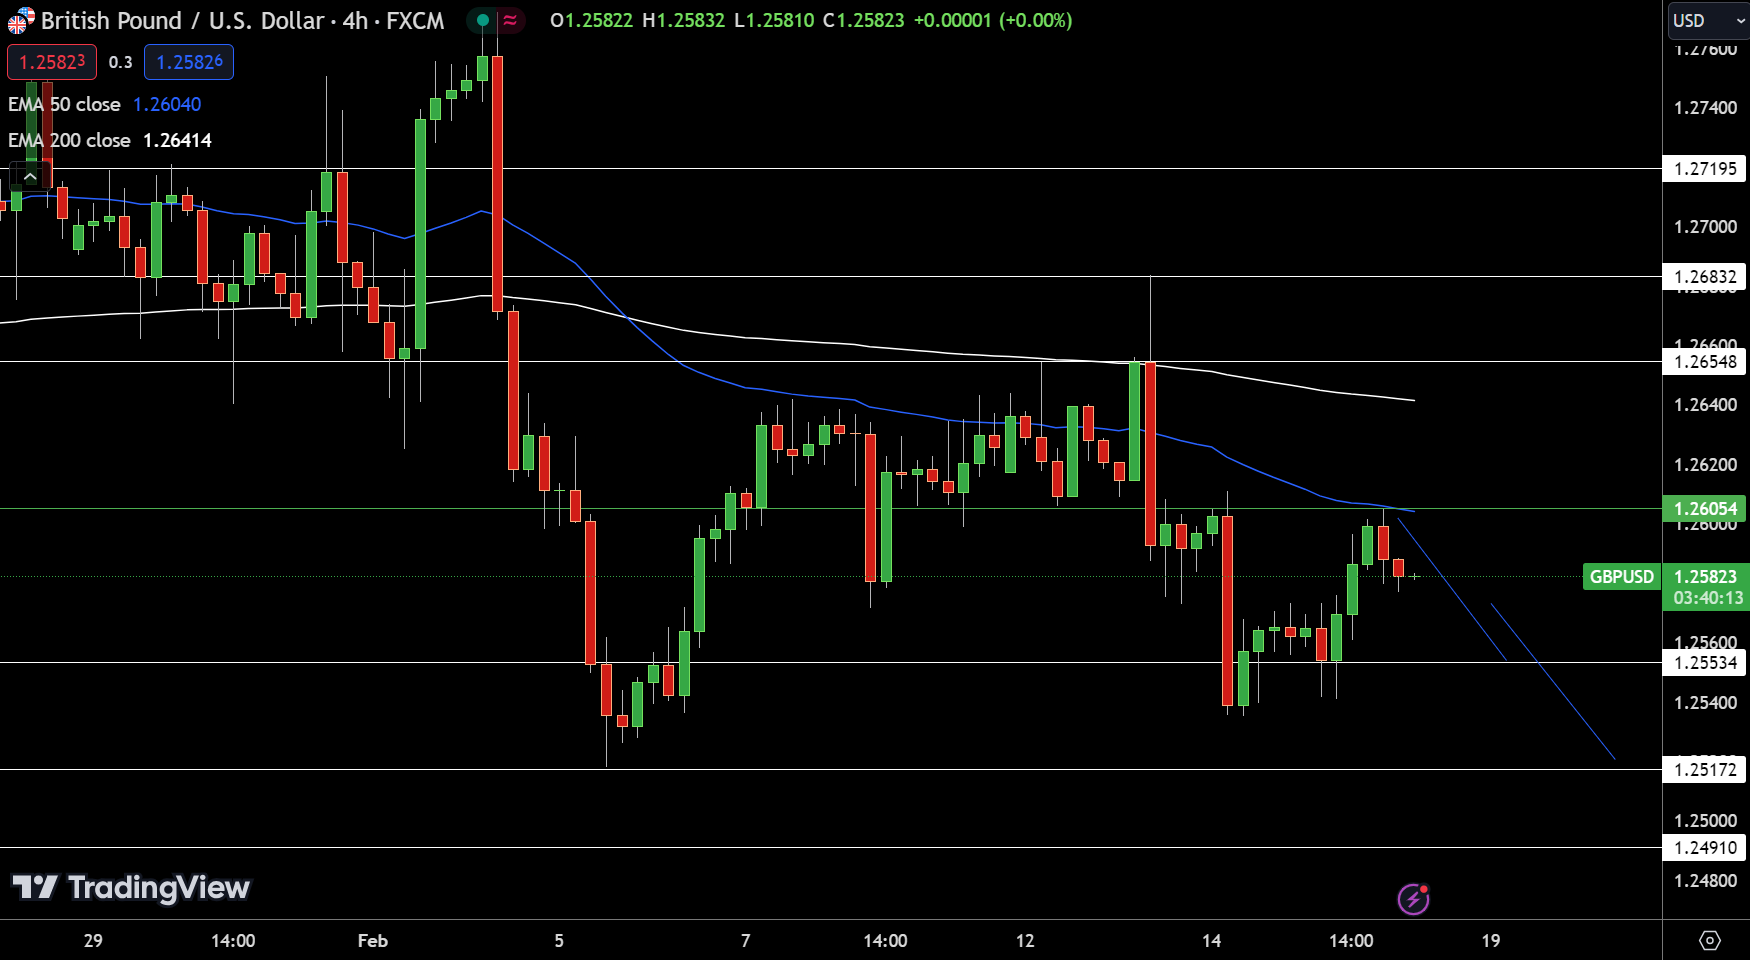
GBP/USD Price Chart – Source: TradingviewThe GBP/USD pair is currently trading at 1.25815, reflecting a slight decrease of 0.14%. Positioned just below its pivot point at 1.26054, the pair faces immediate resistance at 1.26548, with further barriers at 1.26832 and 1.27195.
On the downside, support levels are established at 1.25534, 1.25172, and 1.24910, offering potential cushions against further declines. The 50-Day and 200-Day Exponential Moving Averages, at 1.26040 and 1.26414 respectively, hint at a tight trading range.
The presence of a double top pattern around 1.2605 level suggests a bearish outlook below the pivot, indicating potential downward pressure on the GBP/USD pair.
The UK economy was under the spotlight on Friday. UK retail sales surged by 3.4% in January after sliding by 3.3% in December. Economists forecast retail sales to increase by 1.5% in January.
Food store sales volumes increased by 3.4% in January, reversing a 3.1% decline from December.
Non-food store sales rose by 3.0% after sliding by 3.9% in December.
Department store and other non-food store sales increased by 5.4% and 6.2%, respectively.
Automotive fuel sales were up 5.4% month-on-month.
Despite the December rebound, retail sales were down 0.2% in the three months to January compared with the previous three months. Year-on-year, retail sales were up 0.7% but remained 1.3% below pre-pandemic levels (February 2020).
Bank of England Monetary Policy Implications
The rebound in UK retail sales could influence Bank of England discussions about interest rate cuts. An upward trend in consumer spending could fuel demand-driven inflation.
Tighter UK labor market conditions added to monetary policy uncertainty this week. The UK unemployment rate unexpectedly fell from 3.9% to 3.8% in December. A downward trend in unemployment could support wage growth, a Bank of England bugbear in tackling inflation.
Softer-than-expected UK inflation numbers and the UK economy falling into a technical recession leave the markets grappling with greater monetary policy uncertainty.
GBP/USD Reaction to the UK Retail Sales Report
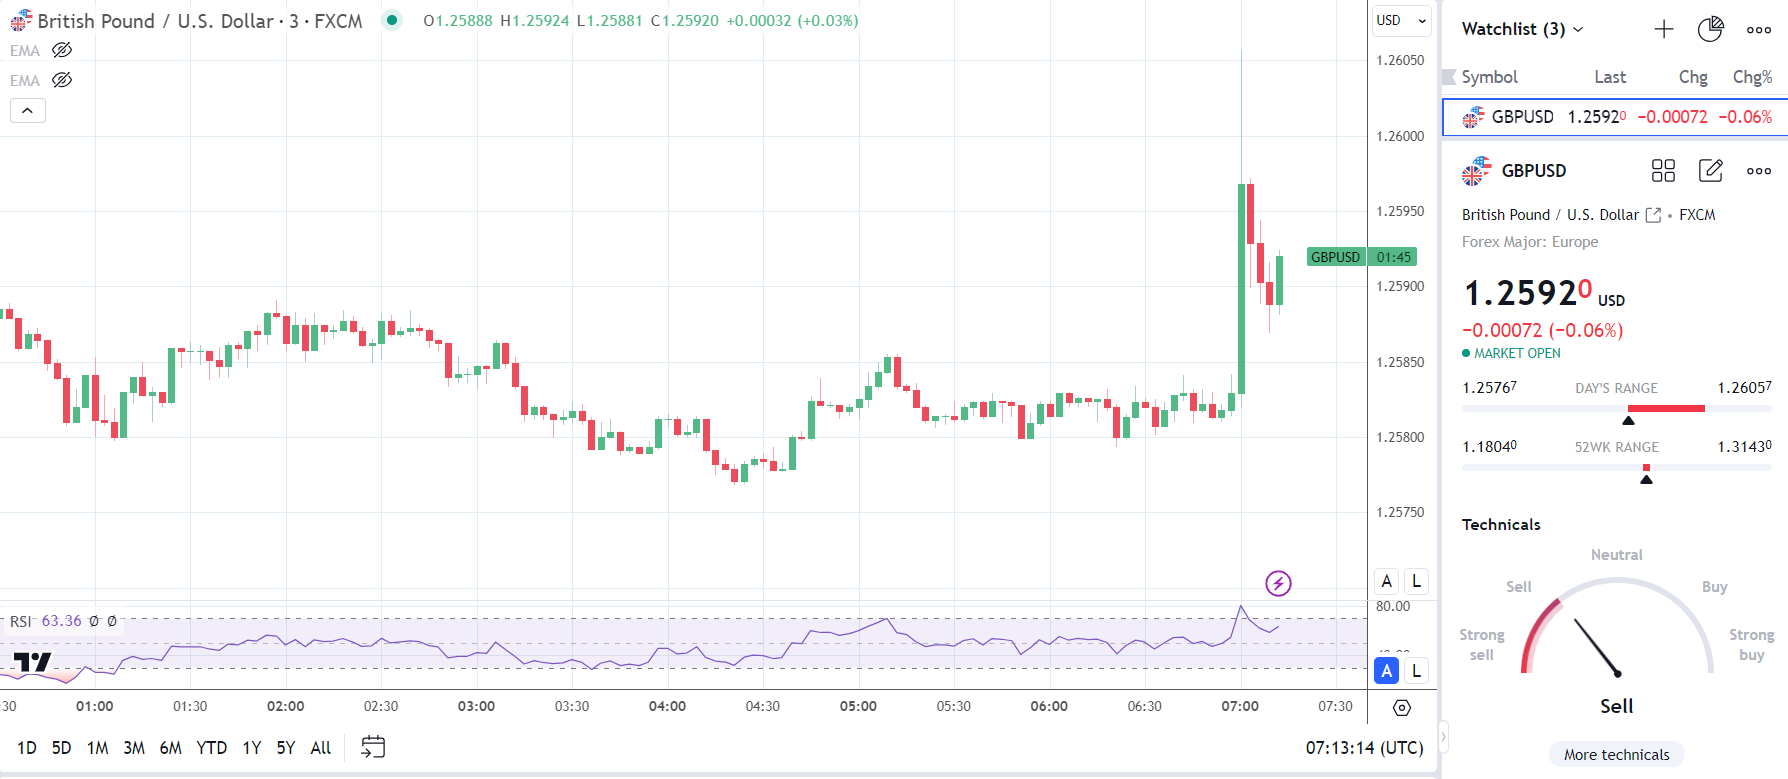
Before the UK retail sales report, the GBP/USD rose to a high of $1.26050 before falling to a low of $1.25767.
However, in response to the retail sales numbers, the GBP/USD fell to a low of $1.25819 before climbing to a high of $1.26057.
On Friday, the GBP/USD was down 0.06% to $1.25920.
160224 GBPUSD 3 Minute Chart
Up Next: US Producer Prices, Consumer Sentiment, and Fed Speakers
On Friday, US producer prices and the Michigan Consumer Sentiment Index will draw investor interest. Upward trends in producer prices could signal a pickup in demand-driven inflation.
Economists forecast producer prices to increase by 0.1% in January after falling by 0.1% in December.
A rise in consumer confidence could signal a positive trend in consumer spending. The net effect could be a higher-for longer Fed rate path to curb consumer spending and dampen demand-driven inflation.
Economists forecast the Michigan Consumer Sentiment Index to increase from 79.0 to 80.0 in February. Beyond the headline figure, investors must consider the sub-components, including inflation.
However, investors must also monitor FOMC member speakers. FOMC members Michael Barr and Mary Daly are on the calendar to speak. Support for patience vis-à-vis interest rate cuts could impact bets on an H1 2024 Fed rate cut.
With the U.S. central bank singularly focused on restoring price stability and prioritizing this part of its mandate for now, traders should closely monitor the upcoming release of the producer price index survey on Friday. Forecasts suggest that January’s headline PPI eased to 0.6% year-on-year from 1.0% previously, and that the core gauge moderated to 1.6% from 1.8% in December.
While subdued PPI figures are likely to be bullish for gold prices, an upside surprise mirroring the results of the CPI report unveiled earlier in the week, which depicted stalling progress on disinflation, should have the opposite effect. In the latter scenario, we could see yields and the U.S. dollar rise in tandem, as markets unwind dovish interest rate bets. This should be bearish for precious metals.
Wondering how retail positioning can shape gold prices in the near term? Our sentiment guide provides the answers you are looking for—don’t miss out, download the complimentary guide now!
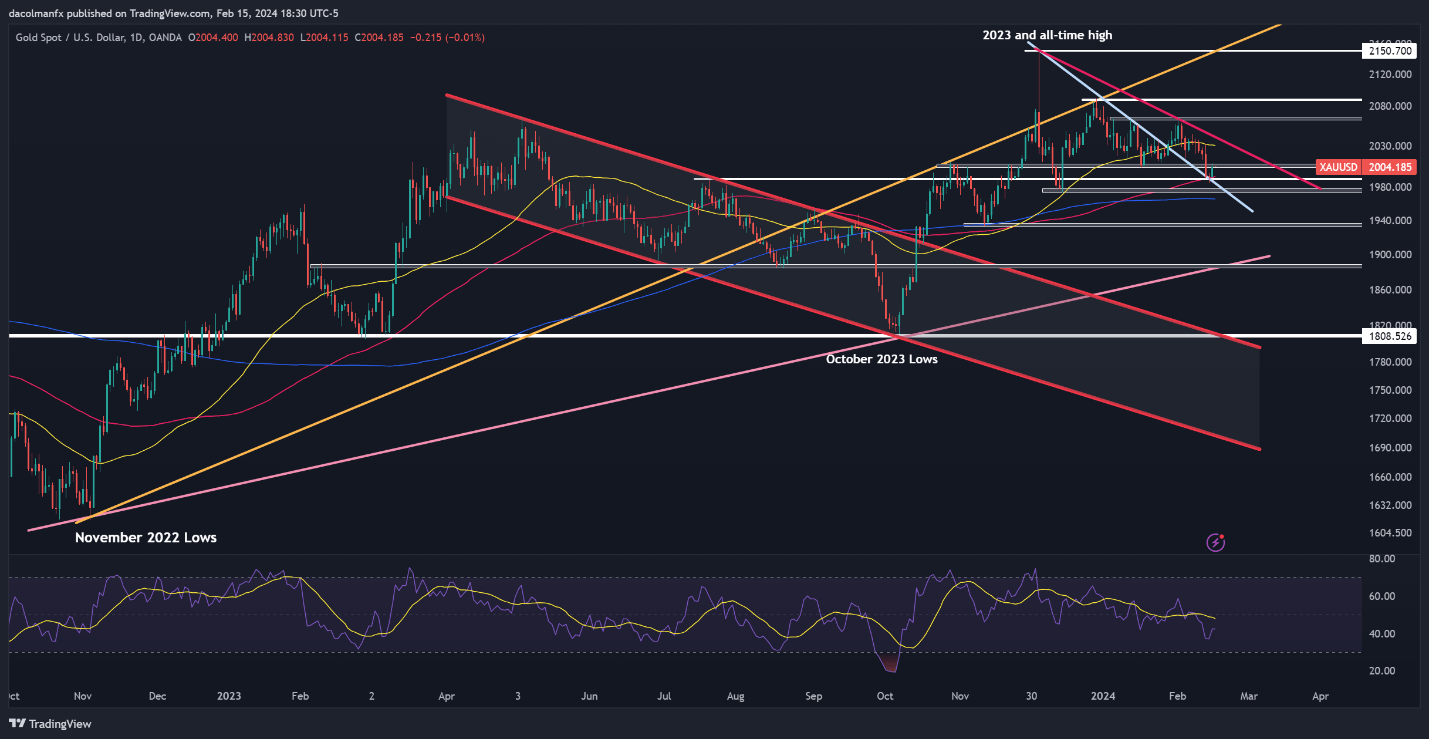
GOLD PRICE TECHNICAL ANALYSIS
Gold advanced on Thursday after bouncing off confluence support at $1,990, with prices pushing towards technical resistance at $2,005. If the bulls manage to clear this barrier in the coming days, we could see a rally towards the 50-day simple moving average at $2,030. On further strength, all eyes will be on $2,065.
On the other hand, if sellers regain the upper hand and trigger a bearish reversal off current levels, the first floor to watch looms at $1,990, followed by $1,975. From here onwards, additional losses could shine a spotlight on the 200-day simple moving average near $1,965.
Feeling discouraged by trading losses? Take control and improve your strategy with our guide, “Traits of Successful Traders.” Access invaluable insights to help you avoid common trading pitfalls and costly errors.
Triangle patterns have three main variations and appear frequently in the forex market. These patterns provide traders with greater insight into future price movement and the possible resumption of the current trend. However, not all triangle formations can be interpreted in the same way, which is why it is essential to understand each triangle pattern individually.
Forex triangle patterns main talking points:
Definition of a triangle pattern
Symmetrical triangles explained
Ascending and descending triangle patterns
Key points to remember when trading triangle patterns
What is a triangle pattern?
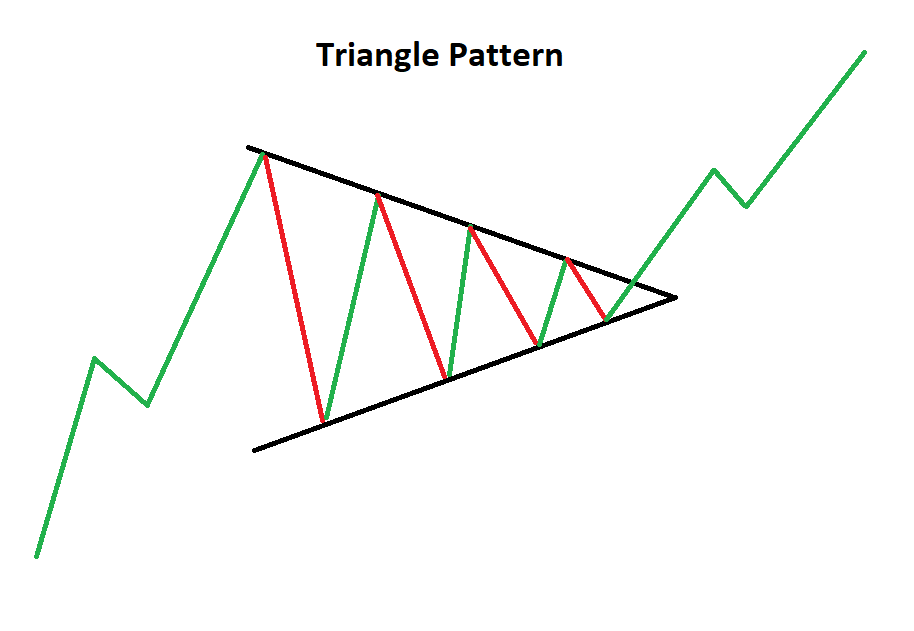
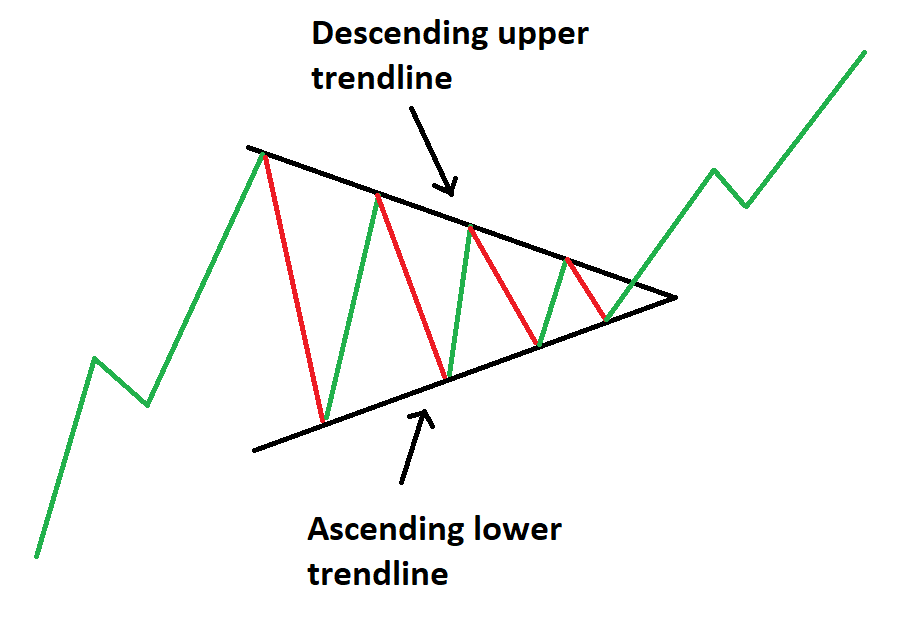
A forex triangle pattern is a consolidation pattern that occurs mid-trend and usually signals a continuation of the existing trend. The triangle chart pattern is formed by drawing two converging trendlines as price temporarily moves in a sideways direction. Traders often look for a subsequent breakout, in the direction of the preceding trend, as a signal to enter a trade.
This article makes use of line chart illustrations to present the three triangle chart patterns. Traders ought to familiarize themselves with the three technical analysis charts and figure out which one suits them best, although, most prefer using forex candlestick charts.
Symmetrical Triangles
The symmetrical triangle can be viewed as the starting point for all variations of the triangle pattern. As the name suggests, a triangle can be seen after drawing two converging trendlines on a chart.
The difference between the symmetrical and the other triangle patterns is that the symmetrical triangle is a neutral pattern and does not lean in any direction. While the triangle itself is neutral, it still favors the direction of the existing trend and traders look for breakouts in the direction of the trend.
Symmetrical triangle trading strategy
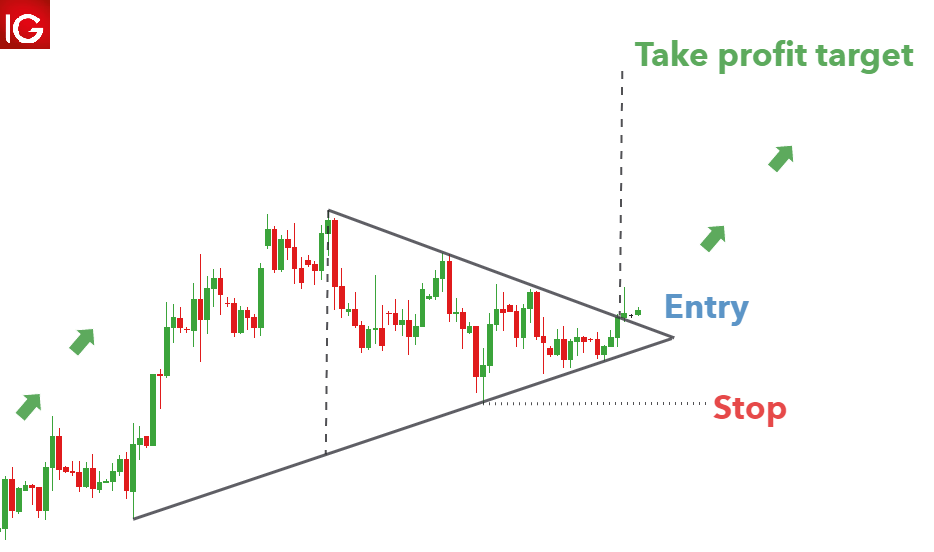
Triangles provide an effective measuring technique for trading the breakout, and this technique can be adapted and applied to the other variations as well.
The AUD/USD chart below shows the symmetrical triangle. The vertical distance between the upper and lower trendline can be measured and used to forecast the appropriate target once price has broken out of the symmetrical triangle.
Its important to note that finding the perfect symmetrical triangle is extremely rare and that traders should not be too hasty to invalidate imperfect patterns. Traders ought to understand that triangle analysis is less about finding the perfect pattern and more about understanding what the market is communicating, through price action.
Ascending Triangle Pattern
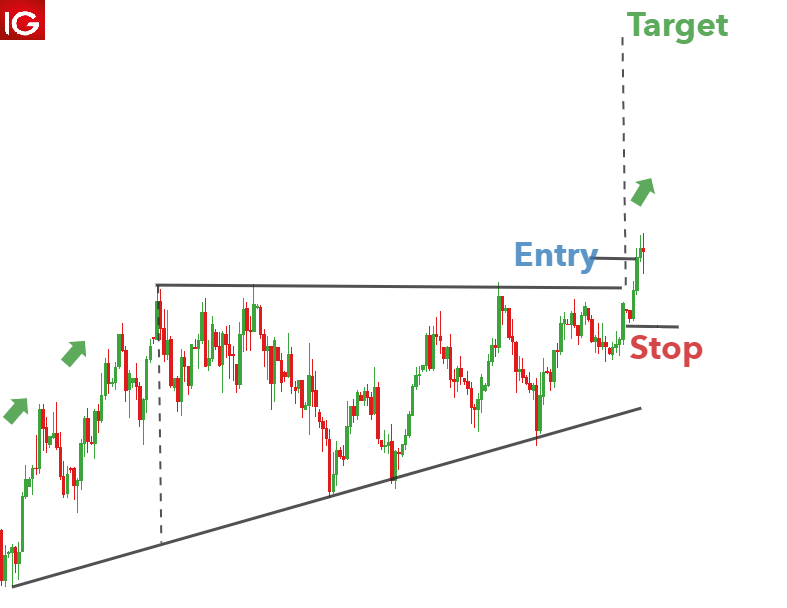
The ascending triangle pattern is similar to the symmetrical triangle except that the upper trendline is flat and the lower trendline is rising. This pattern indicates that buyers are more aggressive than sellers as price continues to make higher lows. Price approaches the flat upper trendline and with more instances of this, the more likely it is to eventually break through to the upside.
Ascending triangle trading strategy
An ascending triangle can be seen in the US Dollar Index below. Leading on from the existing uptrend, there is a period of consolidation that forms the ascending triangle. Traders can once again measure the vertical distance at the beginning of the triangle formation and use it at the breakout to forecast the take profit level. In this example, a rather tight stop can be placed at the recent swing low to mitigate downside risk.
Descending Triangle Pattern
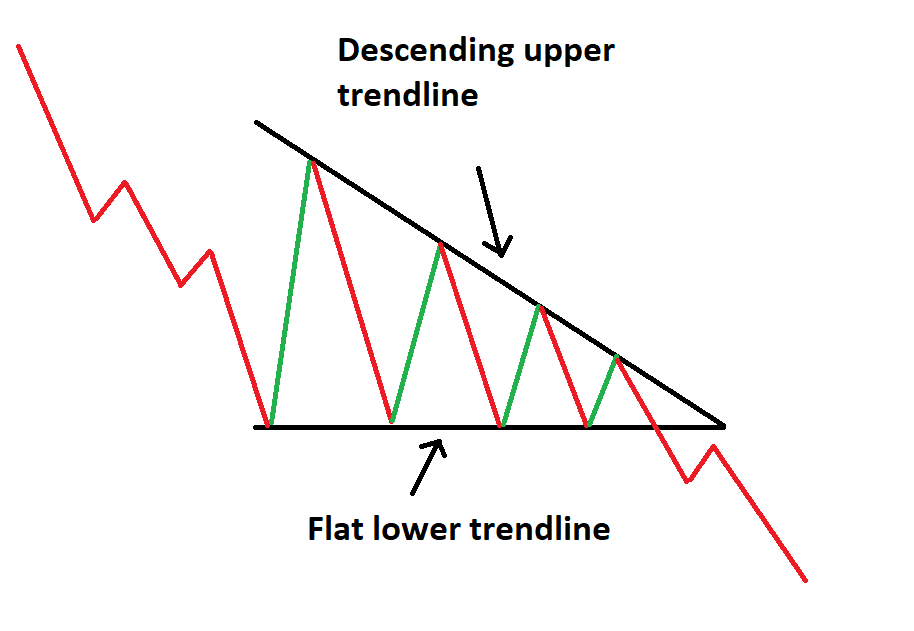
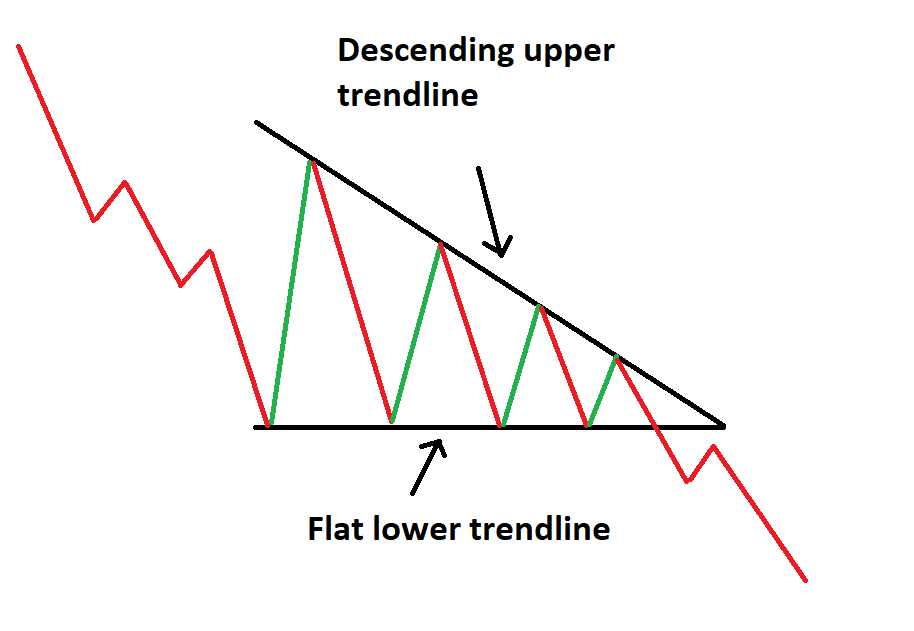
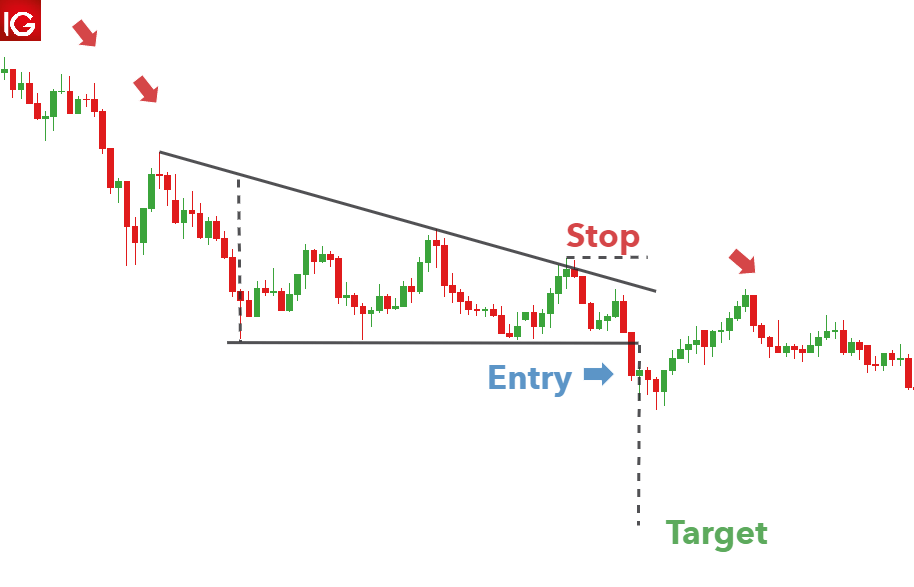
The descending triangle pattern on the other hand, is characterized by a descending upper trendline and a flat lower trendline. This pattern indicates that sellers are more aggressive than buyers as price continues to make lower highs.
Descending triangle trading strategy
Below is a good example of the descending triangle pattern appearing on GBP/USD. A downtrend leads into the consolidation period where sellers outweigh buyers and slowly push price lower. A strong break of the lower trendline presents traders with an opportunity to go short. In this example, it doesn’t take long for the position to move in the opposite direction, highlighting the importance of setting an appropriate stop level.
The take profit level is set using the vertical distance measured at the beginning of the descending triangle formation.
Trading with Triangle Patterns: Key things to remember
Always be cognisant of the direction of the trend prior to the consolidation period.
Make use of upper and lower trendlines to help identify which triangle pattern is being formed.
Use the measuring technique discussed above to forecast appropriate target levels
Stock types are an essential component to a stock trader’s investing basis. Traders and investors need to know the distinction between different stock types. Knowing stock types are so important because it allows traders to deduce and select the correct stock for their personal financial goals and risk appetite.
Thing to keep in mind with stock types
Because stock types and investor objectives are correlated, the following should be taken into consideration before selecting a stock type to trade:
Risk appetite – higher risk appetite will point toward a more volatile stock whilst a lower risk appetite will highlight more consistent stocks
Voting rights– Common stock
6 Different types of stocks every trader should know
Stocks are categorized under different labels which allow traders to sift through stocks with ease making for more efficient trading. Below are the major stock types most frequently utilized by stock traders.
Common stock and preferred stock:
There are two main types of stocks including common stock and preferred stock. Although there are many differences between the two, the primary difference is that preferred stock generally does not give shareholders voting rights whilst common stock does. Both types of stock signify a form of ownership within the company which investors believe will appreciate in value.
Stock type
Pros
Cons
Common stock
Voting rights
Benefits of stock appreciation
Lower dividends if accessible
Last in line to receive disbursements after creditors, bondholders and preferred stock holders
Stock price and dividend may encounter greater unpredictability
Preferred stock
Steady and predictable dividend payments
Benefits of stock appreciation
Higher dividends if accessible
Shareholders have higher probability to recover some of the initial investment in the case of bankruptcy
Cyclical stocks are stocks that react in conjunction with current economic conditions. This means that when economic conditions are favorable, these companies tend to perform well. Automotive companies are examples of cyclical stocks, as people tend to spend more on automobiles in good economic conditions.
Non-cyclical stocks:
Non-cyclical stocks are more contradictory in their reaction to economic conditions. These types of stocks perform well during periods of adverse economic circumstances. Companies that exhibit this type of behavior are those that provide products or services that are necessities regardless of good or bad conditions. Examples of these stocks include healthcare stocks.
Company size:
Market capitalization (market cap) is another common way to sort stocks. Market cap is the total market value of a company’s outstanding shares of stock. These stocks are then categorized into large-cap, mid-cap and small-cap shares.
Large-cap:
Market cap of $10 billion or more (e.g. Amazon)
Mid-cap:
Market cap between $2 -$10 billion (e.g. Yeti Holdings)
Small-cap:
Market cap between $300 million – $2 billion (e.g. Axos Financial)
Domestic and international stock:
Stocks can be divided into both local and international stocks. This is often designated by the company’s head office location. This is a less common way of looking at stocks as head office location may not always correlate to business dealings/sales as many companies have large portions of their dealings internationally. Therefore, it can be hard to decipher the company metrics solely on location.
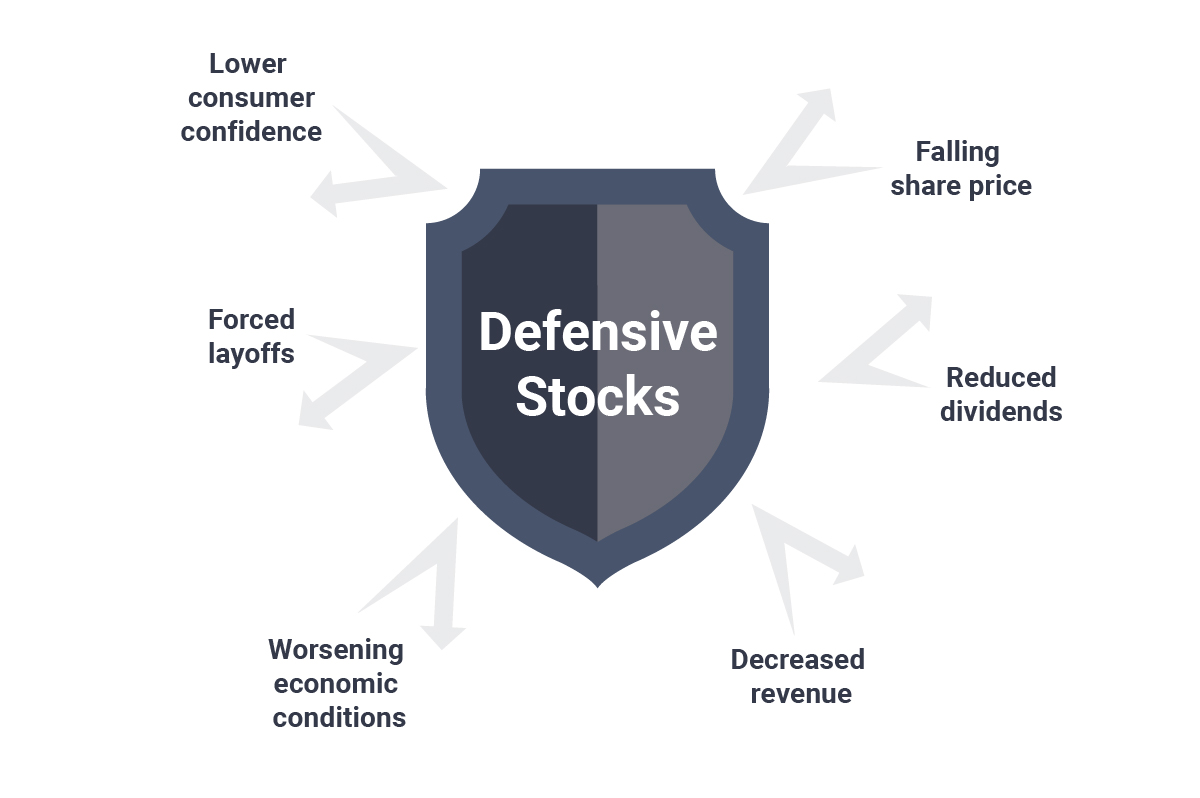
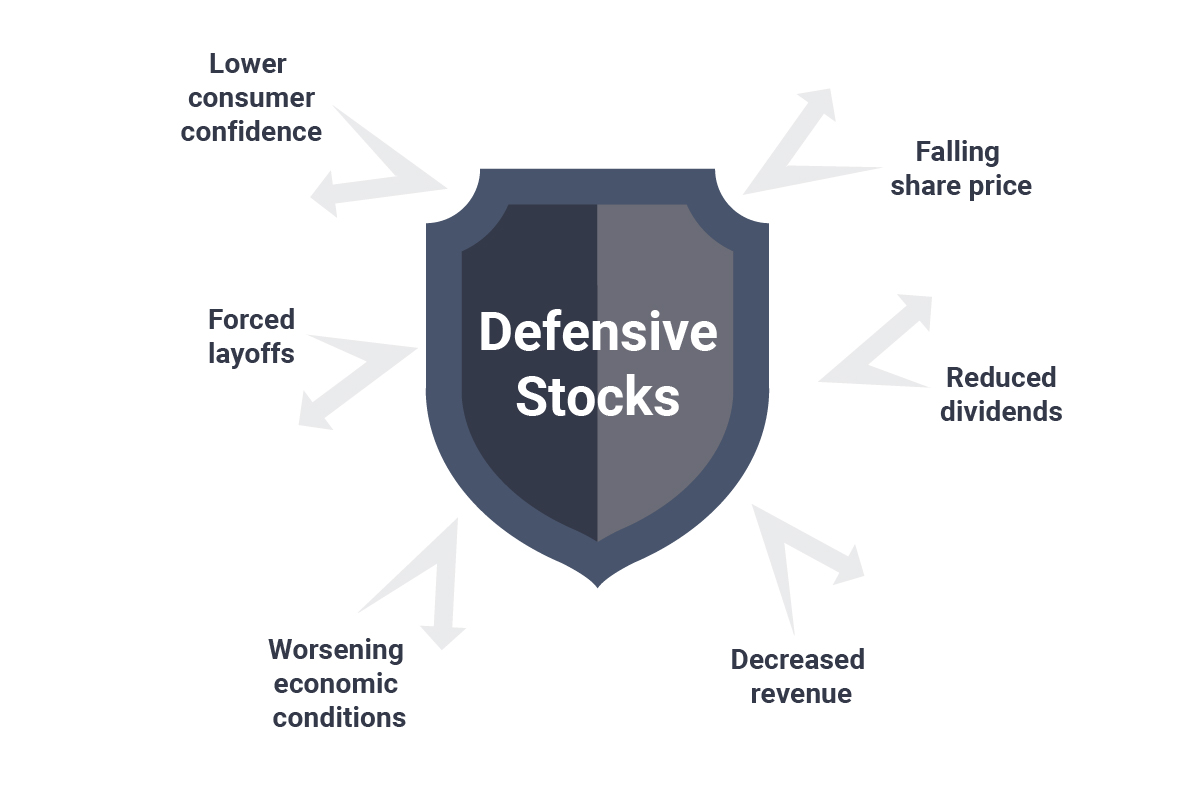
Defensive stocks, also known as ‘non-cyclical stocks’ or ‘safe haven stocks’ comprise of companies that experience little variation in earnings and dividend payouts regardless of the state of the overall economy. Therefore, a defensive stock provides consistent dividends and stable earnings across market conditions. In general, this is because defensive stocks produce goods or services that are considered to be essential, meaning that the demand for these goods/services remain rather consistent.
It is important to note that holding defensive stocks provides no guarantee against negative returns; however, defensive stocks have historically weathered economic recessions better than cyclical stocks, which tend to track momentum of the underlying economy in the near-term.
What are the most defensive stocks
Defensive stock examples can be found within the utility, healthcare and consumer staples stock market sectors and generally exhibit the following characteristics:
Strong balance sheets – Companies that maintain a low debt to equity ratio are better equipped to meet their debt repayments under difficult market conditions.
Low beta – The ‘beta’ of a stock measures the correlation of the stock relative to the broader market. A beta close to 1 means that the stock performs similarly to the broader stock market and a low beta (close to 0) has less association with the broader market. Defensive stocks have beta values that are either close to 0 or have a negative beta.
P/E Ratio – A price-to-earnings ratio or P/E ratio, is a well-known formula used to value a stock. A P/E ratio can also help to identify a defensive stock as they generally have a low price/earnings ratio. Stocks with lower P/E ratios are often indicative of defensive stocks because investors are not forced to pay a premium to own a stock with massive earnings growth potential. Instead, the ratio is low because earnings growth is steady, or close to zero, justifying a lower price relative to earnings.
For a full list of safe haven stocks for each of the three stock market sectors, read our article on safe haven stocks.
Defensive stock example
The stock market affects the economy in many ways and none more so than a severe recession or market crash. Market crashes like the Global Financial Crisis in 2008/2009 result in mass retrenchments, forced liquidations of large companies and government bailouts for sectors that pose a systemic threat should they fail.
During times of economic turbulence, investors attempt to shield themselves from assets that are declining in value and some of the worst performing assets tend to be cyclical stocks – stocks that are strongly correlated to the underlying economy. However, defensive stocks have often outperformed the overall equity market during market crashes with their desirable non-cyclical qualities.
An effective way to illustrate the tendency of defensive stocks to outperform during times of turbulence is to compare the performance of a defensive stock to its broader equity market’s performance over the same timeframe. For defensive stocks traded in the United States, you’ll want to look at the relative performance compared to one of the major indices, the Dow Jones Industrial Average, the S&P 500, or the NASDAQ 100.Below is a chart of the S&P 500 during the 2008/09 financial crisis. It is clear to see that the US equity market, as a whole, experienced a drastic decline. The S&P 500, due to its components, has a large weighing in cyclical stocks that suffered tremendously during this time – driving the index lower.
To the contrary, Gilead Sciences, a biopharmaceutical company, managed to endure the financial crisis and come out at similar levels at whichit entered. Their share price rose sharply, dropped sharply and then consolidated to leave the share price a lot better off than most cyclical stocks. Intuitively, this makes sense: consumers will demand healthcare and drug treatments regardless of the state of the economy. To this end, biopharmaceutical and healthcare stocks tend to be defensive stocks as they are counter-cyclical in nature.
It is crucial to note that defensive stocks do not necessarily rise in value during economic downturns. They may rise, hold value or even decline, nevertheless, they are desirable because they tend to outperform the wider stock market during crashes.
Upcoming Events Impacting EUR/USD and GBP/USD Forecasts
In today’s financial landscape, the US Dollar Index subtly shifts, currently trading at $103.998, reflecting a slight decrease of around 0.08%. On Friday, the Eurozone witnessed a steady German Final CPI month-over-month, matching forecasts and previous figures at 0.2%, while Italian Industrial Production outperformed expectations with a 1.1% increase compared to the anticipated 0.8%, reversing a prior decline of -1.3%.
Events Ahead
Looking ahead, significant speeches from FOMC members, including “Defining a Bank” by FOMC Member Bowman at the American Bankers Association Conference and FOMC Member Barkin’s address at the Atlanta Economics Club, are poised to influence market sentiment.
Additionally, the Federal Budget Balance announcement is on the horizon, potentially impacting the Dollar’s trajectory.
Across the pond, GBP/USD traders are awaiting remarks from BOE Governor Bailey at Loughborough University, which could provide further direction for the Pound in contrast to the Dollar’s performance.
US Dollar Index (DXY)
Dollar IndexOn February 12, the Dollar Index’s pivot point of 103.956, hinting at potential for directional movement. Key resistance levels are identified at 104.191, 104.600, and 104.853, serving as benchmarks for bullish momentum. On the downside, support levels are situated at 103.750, 103.550, and 103.321, which could provide stability in case of further declines.
The proximity of the 50-Day Exponential Moving Average (EMA) at 103.957 to the current price underscores a stable market condition, while the 200-Day EMA at 103.422 offers a broader bullish backdrop.
Considering these technical indicators, the outlook for the Dollar Index leans towards a bullish bias, provided it sustains above the pivotal 103.956 mark.
EUR/USD Technical Forecast
EUR/USD Price Chart – Source: TradingviewThe EUR/USD pair experienced a slight uptick, trading at 1.07968, marking a 0.13% increase within the last 24 hours. This minor yet positive movement places the currency pair just above its pivot point at 1.07929, indicating a potential for further upward momentum.
Immediate resistance levels are identified at 1.08097, 1.08297, and a more substantial barrier at 1.08648, which the pair needs to breach to confirm a bullish trend. Conversely, support levels at 1.07640, 1.07430, and 1.07241 provide a safety net against potential declines.
The 50-Day Exponential Moving Average (EMA) at 1.07914 closely aligns with the current trading price, suggesting stability, while the 200-Day EMA at 1.08515 serves as a longer-term resistance level. Based on these technical indicators and the currency’s position relative to its pivot point, the EUR/USD outlook remains cautiously optimistic, with a bullish potential if it maintains above the 1.07929 threshold.
GBP/USD Technical Forecast
GBP/USD Price Chart – Source: TradingviewThe GBP/USD pair edged higher, trading at 1.26393, marking a modest gain of 0.11%. This slight upward movement positions the pair just below its pivot point of 1.26444, suggesting a nuanced stance in market sentiment.
Resistance levels are set at 1.26743, 1.27180, and 1.27710, challenging the pair to sustain its upward trajectory. Conversely, support is found at 1.26144, followed by 1.25772 and 1.25171, which could cushion any downward shifts.
The proximity of the 50-Day Exponential Moving Average (EMA) at 1.26336 to the current price indicates near-term stability, while the 200-Day EMA at 1.26570 looms as a potential resistance level.
Given these technical indicators, the GBP/USD’s outlook appears to tilt bearish if it fails to breach the 1.26444 pivot, signaling a cautious market approach.
SEC v Ripple: Remedies Related Discovery Enters Its Final Week
On Sunday, there was no SEC v Ripple case-related news to consider. However, the SEC and Ripple are progressing toward the end of remedies-related discovery. After concluding remedies-related discovery, the SEC and Ripple will submit remedy-related briefs regarding breaching Section 5 of the Securities Act for selling XRP to institutional investors.
While a punitive disgorgement could impact XRP, SEC plans to appeal the Programmatic Sales ruling remain an XRP headwind. Judge Analisa Torres could decide on the penalty for breaching section 5 this summer. An SEC appeal against the Programmatic Sales ruling could extend into 2025 and possibly 2026.
Despite the lack of SEC v Ripple case-related activity, the SEC was under fire over the weekend.
SEC Scrutiny Continues
Ripple Chief Legal Officer Stuart Alderoty responded to a post on X (formerly Twitter) about the SEC and an exodus of senior enforcement lawyers, saying,
“Will any of these lawyers be brave enough to blow the whistle and share details about Gensler’s “controversial leadership” with the SEC’s Office of Inspector General or with the House Committee on Oversight and Accountability?”
Charles Gasparino of Fox News posted the scoop about SEC enforcement lawyers saying,
“SCOOP: SEC bracing for major exodus among senior enforcement lawyers in its crypto assets and cyber unit, according to officials at major law firms who have seen several of the resumes. Fox Business is withholding names to protect privacy; the moves suggest that the bleed of senior staff under Gary Gensler’s controversial leadership of the agency isn’t letting up.”
An exodus of senior enforcement lawyers could debilitate the ability to regulate by enforcement. The SEC v Debt Box case and scrutiny from US lawmakers may convince others to find alternative employment.
In January, the SEC filed a Motion to Dismiss the charges against Debt Box. The SEC dropped the charges against Debt Box after a highly publicized court order. In December, the court ordered,
“The SEC to show cause why it should not be sanctioned for making false and misleading representations to the court.”
Last week, US Senators sent SEC Chair Gary Gensler a letter, raising concerns about the Debt Box case. The recent scrutiny could influence SEC cases against other crypto firms, including Ripple. The US Senators wrote,
“Regardless of whether Commission staff deliberately misrepresented evidence or unknowingly presented false information, this case suggests other enforcement cases brought by the Commission may be deserving of scrutiny.”
XRP Price Action
Daily ChartXRP remained below the 50-day and 200-day EMAs, affirming bearish price signals.
A move through the $0.5470 resistance level and the 50-day EMA would give the bulls a run at the 200-day EMA. Selling pressure could intensify at the $0.5470. The 50-day EMA is confluent with the $0.5470 resistance level.
SEC v crypto case-related updates and SEC activity need consideration.
However, a break below the $0.52 handle would support a fall to the $0.5042 support level.
The 14-day RSI reading, 48.82, suggests an XRP fall through the $0.50 handle before entering oversold territory.
XRPUSD
4-Hourly Chart
On the 4-hourly, XRP hovered above the 50-day while remaining below the 200-day EMA, sending bullish near-term but bearish longer-term price signals.
An XRP breakout from the 200-day EMA would bring the $0.5470 resistance level resistance level into play.
However, a fall through the 50-day EMA would give the bears a run at the $0.5042 support level.
The 4-hourly RSI, with a reading of 59.19, suggests an XRP break above the 200-day EMA before entering the overbought territory.
















 Chat now!