Trading the Gold-Silver Ratio: Strategies and Tips

Trading the Gold-Silver Ratio: Strategies and Tips

WHAT IS THE GOLD-SILVER RATIO?

The gold-silver ratio is simple. It is the number of silver ounces you would need to trade to receive one ounce of gold at current market prices. For example, when gold price is trading at $1000 per ounce and silver price is trading at $16.67 per ounce the gold-silver ratio will be equivalent to 60.

  • The gold to silver ratio has averaged around 60 from 2001 to 2017. With highs breaching 80 (ounces of silver to one ounce of gold) and lows sinking to around 40.
  • The ratio tends to increase during times of economic distress. The cause of this relationship is due to gold generally outperforming silver during recessions, leading to increases in the ratio.
  • The ratio peaked at 100 in 1991 when silver prices dropped to extreme lows.

HOW THE GOLD-SILVER RATIO WORKS

  • When the gold price increases faster than the silver price the ratio will increase .
  • When the silver price increases faster than the gold price the ratio will decrease .
  • When the gold price decreases faster than the silver price the ratio will decrease.
  • When the silver price decreases faster than the gold price the ratio will increase.

The graph above shows the gold to silver ratio for the past several decades. In 1991 silver was trading at extremely low prices- causing a peak in the gold-silver ratio, denoted by the blue circle in the graph above.

It is also worth noting the spike in the ratio during the 2008 subprime-mortgage crisis, caused by surging gold prices and silver not performing as well. This is denoted by the red circle in the graph above.

HOW TO TRADE THE GOLD-SILVER RATIO

There are many ways to use the ratio to your advantage. Keep reading for the top two strategies on trading the gold-silver ratio.

1) USING THE GOLD-SILVER RATIO TO DETERMINE THE METAL WITH THE STRONGEST TREND AND TRADE IT:

Traders can use the gold-silver ratio to determine which metal may outperform the other and then place a trade accordingly.

A trader could use these five steps to enter a trade on either gold or silver using the ratio:

1) Determine the trend on a gold-silver ratio chart by adding trend lines to the chart. You can use DailyFX’s chart to view the gold-silver ratio by entering “XAUUSD/XAGUSD” in the search bar.

2) Using the time-frame of your choice, determine the trend on gold and silver individually.

3) Use this table to help you determine a bias:

GOLD-SILVER RATIO TREND GOLD AND SILVER TREND SIGNAL
Gold-Silver RatioUptrend Gold and silver inUptrend Buy Gold
Gold-Silver RatioUptrend Gold and Silver inDowntrend Sell Silver
Gold-Silver RatioDowntrend Gold and Silver inUptrend Buy Silver
Gold-Silver RatioDowntrend Gold and Silver inDowntrend Sell Gold

4) Identify trading opportunities using price action or technical indicators time entries in the direction of the trend.

5) Identify a trade size appropriate for the account size and set stop-losses and take-profits and execute the trade.

Here’s an example using the five steps:

1) Let’s say we open our gold to silver ratio chart on 8 February 2016.We draw our trend lines and the trend lines indicate that the ratio is in a current uptrend as shown in the chart below showing a four-hourly timeframe.

2) Our next step is to determine the individual trend for gold and silver. So, we open the charts and draw our trend lines and notice that both gold and silver are trending upwards as shown in the charts below.

3) The table above indicates that when the gold-silver ratio is trending upwards and gold and silver are both in an uptrend we should buy gold because it has been outperforming silver.

GOLD-SILVER RATIO UPTREND GOLD AND SILVER IN UPTREND BUY GOLD

4) Since the beginning of February, gold has increased drastically in price. We should wait for a modest pull-back before attempting to enter the market. Once we do enter the market, we can place our stop-loss below the trend line and our take-profit above the previous high to ensure a positive risk-reward ratio on the trade.

5) We determine an appropriate trade size for our account, execute the trade and set our stop-loss and take profit.

2) TRADING THE HIGHS AND LOWS OF THE GOLD-SILVER RATIO:

There may be times when the ratio reaches historic extremes. When it is near these points, a reversal of the ratio is at risk. For example, when the gold-silver ratio reaches for historical highs (from 80 to 100) the idea is that the price of gold is expensive relative to the price of silver. When the gold-silver ratio reaches for historical lows (from 60 to 40) gold is seen as cheaper relative to silver.

Because the metals are correlated though driven by different factors, they tend to be limited in their willingness to run beyond a gold-silver ratio north of 80-100 or below 60-40, and those tend to be at turning points because the ratio has picked up on a likely abrupt turning points in markets.

The chart below shows times when the ratio was at all-time highs- red circles and all-time lows-blue circles.

Traders can use the table below as a guide to trade the metals when the gold-silver ratio at risk for a reversal:

GOLD-SILVER RATIO EXTREME GOLD AND SILVER TREND TRADE SIGNAL
Gold-Silver RatioHistorical High Gold and Silver inUptrend Long Silver
Gold-Silver RatioHistorical High Gold and Silver inDowntrend Short Gold
Gold-Silver RatioHistorical Low Gold and Silver inDowntrend Short Silver
Gold-Silver RatioHistorical Low Gold and Silver inUptrend Long Gold

It is very seldom that the gold-silver ratio reaches for these historic highs and lows, but when it does, it could offer good opportunities. Still, it is important to manage your risk because the ratio has been known to breach these historical levels.

US Dollar Forecast: DXY Dips to $104, Awaits Fed Speeches & Trade Balance Data

US Dollar Forecast: DXY Dips to $104, Awaits Fed Speeches & Trade Balance Data

Economic Indicators Weigh on Currencies

The Dollar Index has seen a modest decline, trading at $104.037, down by approximately 0.10%.  In Europe, German Industrial Production unexpectedly contracted by 1.6%, a sharper decline than the forecasted 0.4% decrease. This follows a surprising surge in German Factory Orders by 8.9% and a dip in Retail Sales by 1.1%.

For the GBP, the Halifax HPI showed a stronger than expected growth of 1.3%, suggesting resilience in the UK housing market. However, the Construction PMI indicated contraction at 48.8, signaling pressures in the construction sector.

Events Ahead

US Dollar Index (DXY)

Dollar Index
Dollar Index

EUR/USD Price Chart - Source: Tradingview
EUR/USD Price Chart – Source: TradingviewEUR/USD edges higher, gaining 0.15% to trade at 1.07687, amid fluctuating market dynamics. The pair navigates through key Fibonacci retracement levels, finding immediate resistance at 1.07891 (38.2%), with subsequent barriers at 1.08097 (50%) and 1.08297 (61.8%).

Support lies at 1.07364, extending to 1.07115 and 1.06934, marking crucial thresholds for potential pullbacks. The 50-day and 200-day Exponential Moving Averages, at 1.08047 and 1.08661 respectively, provide a broader perspective on market sentiment.

Positioned above the pivot point of 1.07645, EUR/USD exhibits a bullish stance, contingent on sustaining this level, signaling potential upward momentum in the near term.

GBP/USD Price Chart - Source: Tradingview
GBP/USD Price Chart – Source: TradingviewGBP/USD sees a modest uptick, rising 0.18% to 1.26181, as it approaches key technical milestones. The currency pair faces immediate resistance at Fibonacci levels: 1.2644 (38.2%), 1.26743 (50%), and 1.27215 (61.8%).

Support is found at 1.25772, with further cushions at 1.25171 and 1.24780, which could play pivotal roles during pullbacks. The 50-day and 200-day Exponential Moving Averages, at 1.26446 and 1.26621 respectively, hover near resistance levels, suggesting a taut balance between bullish and bearish forces.

Positioned above the pivot point of 1.26144, GBP/USD’s trajectory appears cautiously optimistic, indicating potential for further gains if it maintains above this threshold.

Hang Seng Index, ASX 200, Nikkei 225: Focus Remains on China Measures

Hang Seng Index, ASX 200, Nikkei 225: Focus Remains on China Measures

Overview of the Tuesday Session

On Tuesday, the Hang Seng Index bucked the broader market trend, closing the session in positive territory. The ASX 200 and the Nikkei ended the session in negative territory.

Hawkish Fed Chair Powell comments from Sunday, and the US ISM Services PMI numbers sank bets on a March Fed rate cut. The ISM Services PMI increased from 50.6 to 53.4 in January. Significantly, ISM Services Prices jumped from 57.4 to 64.0, with ISM Services Employment up from 43.3 to 50.5.

10-year US Treasury yields surged 3.38%, ending the day at 4.160%. The US equity markets reacted to the numbers. On Monday, the Nasdaq Composite Index and S&P 500 declined by 0.20% and 0.32%, respectively. The Dow ended the day down 0.71%.

However, Asian economic indicators also garnered investor interest. Household spending and wage growth numbers from Japan sent mixed signals.

Average cash earnings increased by 1.0% year-over-year in December after rising by 0.2% year-over-year in November. The upswing in wages could allow the Bank of Japan to begin discussions about rate cuts. However, household spending continued to disappoint. Household spending declined by 2.5% year-over-year in December after falling by 2.9% year-over-year in November.

For the ASX 200, a more hawkish-than-expected RBA stance affected buyer demand for ASX-listed stocks. Downward revisions to growth forecasts also impacted investor sentiment.

However, the Hang Seng Index avoided another loss. Investors responded to updates from China’s securities regulators and state-linked investment companies taking steps to shore up the Chinese equity markets.

Central Hujin Investment reportedly expanded its investment into exchange-traded funds. News of China President Xi Jinping plans to meet with financial regulators also buoyed the markets.

The Fed, Earnings, and China

On Wednesday, the Dow and S&P 500 ended the session up 0.37% and 0.23%, respectively. The Nasdaq Composite Index rose by 0.07%. 10-year US Treasury yields declined by 1.39%, providing market relief.

Economic data from the US had a limited impact on the US market session. The RCM/TIPP Economic Optimism Index declined from 44.7 to 44.0 for February. Consumer sentiment toward the economy declined despite tighter labor market conditions and a robust US economy.

Fed speakers continued to beat the hawkish drum on Tuesday. FOMC member Neel Kashkari needed more confidence inflation was moving toward target before cutting rates. FOMC Loretta Mester could not provide a timeline for rate cuts, saying the strong labor market and consumption would allow the Fed to consider more inflation data.

However, corporate earnings moved the dial. Eli Lilly (LLY) was the focal point on Tuesday, beating fourth-quarter forecasts.

On the Asian economic calendar, Ai Group private sector data for Australia garnered investor interest. The Ai Group Industry Index declined from -22.4 to -27.3 in January. Economists forecast a reading of -26.0. Later in the session, the RBA Chart Pack and Japanese Leading Economic Index numbers will draw interest.

Investors must also monitor stimulus chatter from Beijing, Chinese equity market interventions, and central bank commentary.

On Wednesday, the ASX 200 futures were up 55 points, while the Nikkei futures were down 110 points.

ASX 200

ASX 200 ended the Tuesday session in negative territory.
ASX200 070224 Daily ChartThe ASX 200 declined by 0.58% on Tuesday. Losses were broad-based for the second consecutive session. Gold (XAU/USD) and mining stocks contributed to the losses, with tech stocks also a drag. The S&P ASX All Technology Index (XTX) fell 0.91%.

Northern Star Resources Ltd. (NST) and Evolution Mining Ltd. declined by 0.75% and 0.65%, respectively.

BHP Group Ltd (BHP) and Rio Tinto Ltd. (RIO) fell by 1.05% and 0.55%, respectively. Fortescue Metals Group Ltd. (FMG) ended the session down 2.94%.

Banking stocks had a mixed session. National Australia Bank Ltd. (NAB) and Commonwealth Bank of Australia (CBA) ended the day down 0.43% and 0.96%, respectively. Westpac Banking Corp. (WBC) fell by 0.12%. ANZ Group Holdings Ltd (ANZ) ended the session up 0.81%.

However, Woodside Energy Group Ltd (WDS) and Santos Ltd (STO) saw gains of 0.78% and 0.38%, respectively.

Hang Seng Index

Hang Seng Index rallied on Tuesday.
HSI 070224 Daily ChartThe Hang Seng Index rallied 4.04% on Tuesday. Real estate and tech stocks contributed to the gains. The Hang Seng Mainland Properties Index (HSMPI) and Hang Seng Tech Index (HSTECH) saw gains of 4.82% and 6.75%, respectively.

Alibaba (9988) and Tencent (0700) rallied 7.57% and 4.01%, respectively.

Bank stocks also ended the day in positive territory. HSBC (0005) gained 1.06%. China Construction Bank (0939) and Industrial Commercial Bank (1398) ended the day up 3.25% and 3.16%, respectively.

The Nikkei 225

Nikkei ended the Tuesday session in the red.
Bank stocks ended the day in negative territory. Sumitomo Mitsui Financial Group Inc. (8316) and Mitsubishi UFJ Financial Group Inc. (8306) declined by 1.42% and 2.61%, respectively.However, the main components of the Nikkei had another mixed session.

However, KDDI Corp. (9433) slid by 2.62%, with Sony Group Corp. (6758) falling by 1.52%. Softbank Group Corp. (9948) and Fast Retailing Co. Ltd. ended the day down 0.02% and 0.69%, respectively.

Tokyo Electron Ltd. (8035) bucked the trend, gaining 1.51%.

German Industrial Production Slides by 1.6% in December

German Industrial Production Slides by 1.6% in December

German Industrial Production

German industrial production slid by 1.6% in December after declining by 0.2% in November. Economists forecast industrial production to fall by 0.4%. However, industrial production was down 3.13% year-over-year in December compared to 4.37% year-over-year in November.

German Economy and the ECB

Economic indicators from Germany continue to signal a Q1 2024 economic recession. German factory orders unexpectedly surged 8.9% in December after stalling in November. However, German trade data signaled a sharp deterioration in the demand environment. January PMI numbers also indicated a contraction across the private sector.

There is a growing concern the German economy can drag the Eurozone economy into a recession. Weaker-than-expected numbers raised investor bets on an April ECB rate cut.

The industrial production numbers further supported expectations of a Q1 economic recession. Nonetheless the jump in factory orders could offer relief ahead of the January production figures.

EUR/USD Reaction to German Industrial Production

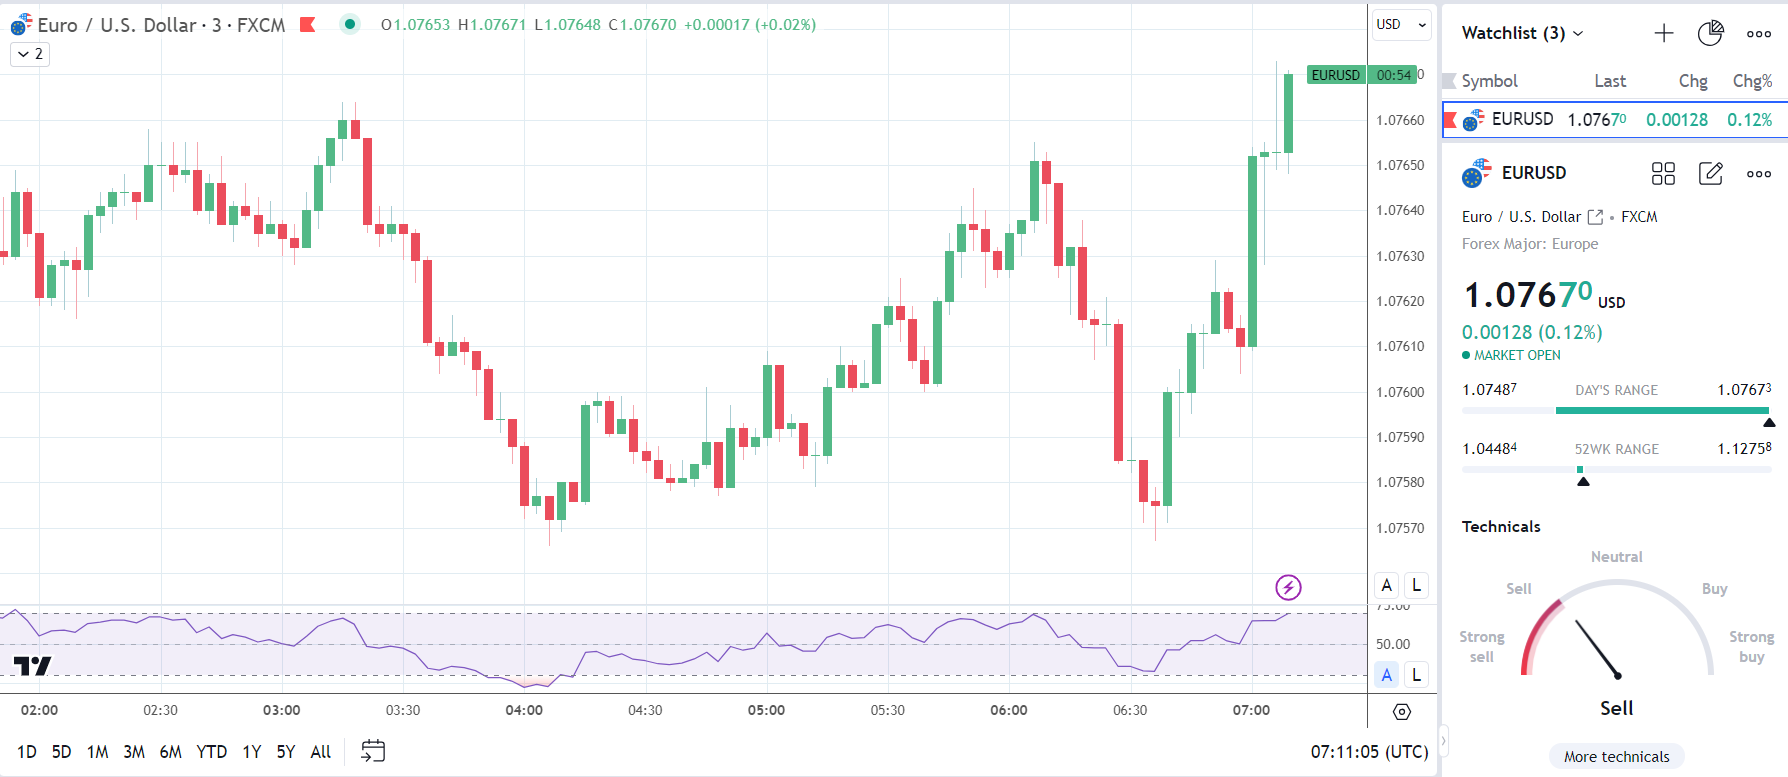
Before the German industrial production numbers, the EUR/USD fell to a low of $1.07487 before rising to a high of $1.07664.

However, in response to the numbers, the EUR/USD fell to a low of $1.07609 before rising to a high of $1.07673.

On Wednesday, the EUR/USD was up 0.12% to $1.07670.

EUR/USD reaction to German industrial production numbers.
070224 EURUSD 3 Minute Chart

Next Up

On Wednesday, French trade and employment figures will draw interest before retail sales data from Italy.

Later in the session, US trade data will also garner investor interest. However, central bank commentary will likely be the focal point. FOMC members Adriana Kugler, Thomas Barkin, and Susan Collins could skew bets on a May Fed rate cut.

How to Trade Reversals with the Hanging Man Pattern

How to Trade Reversals with the Hanging Man Pattern

What is the Hanging Man?

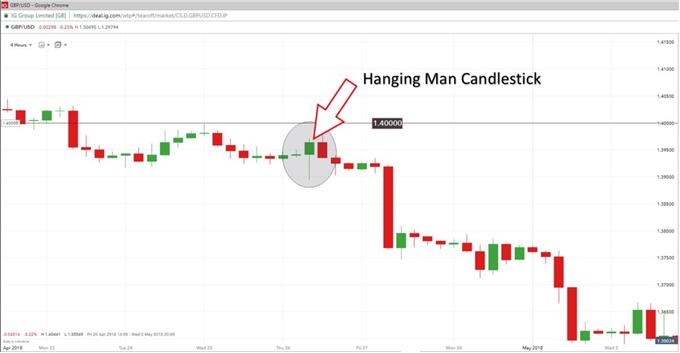
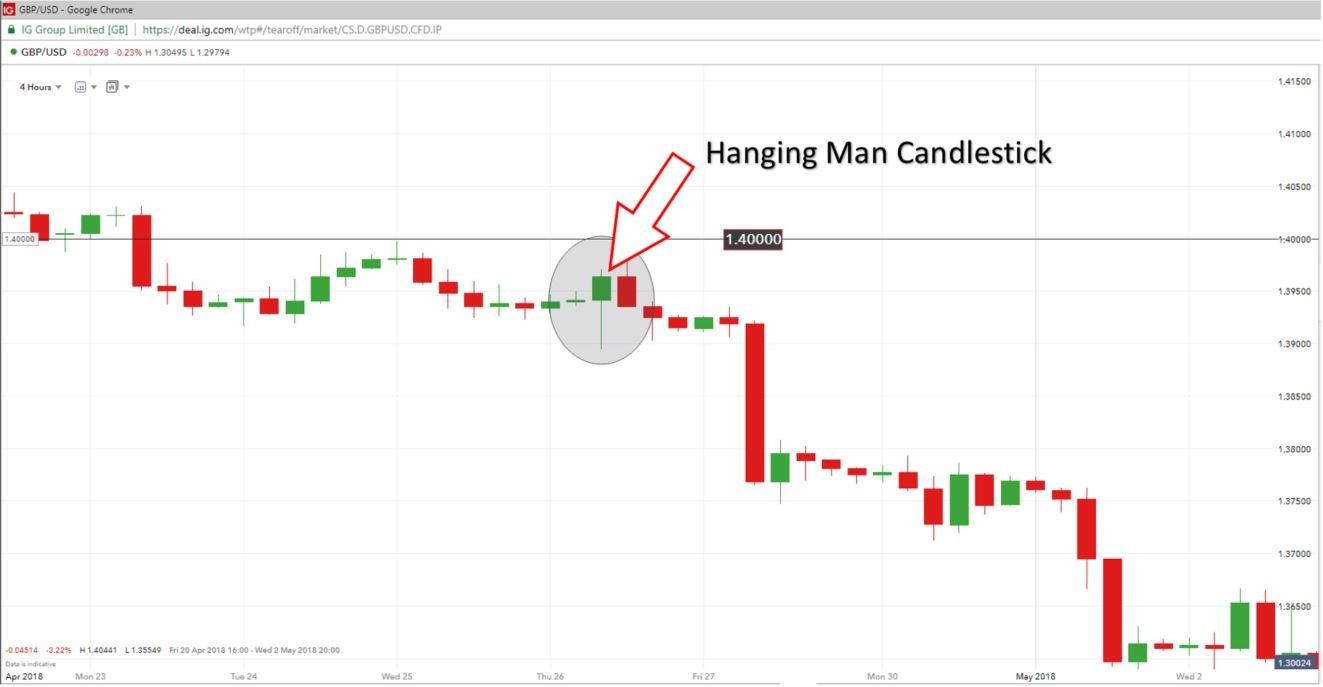
A hanging man candle (aptly named) is a candlestick formation that reveals a sharp increase in selling pressure at the height of an existing uptrend. This is generally brought about by many market participants believing the market has reached its highest level resulting in the ‘bears’ outweighing the ‘bulls’. This can be observed in the GBPUSD chart below where it is clear to see the red candle appearing at the top of the upward trend as a result of mass selling pressure.

GBP/USD HANGING MAN CANDLESTICK

Hanging man candlestick pattern, at times, can signal reversals in the market

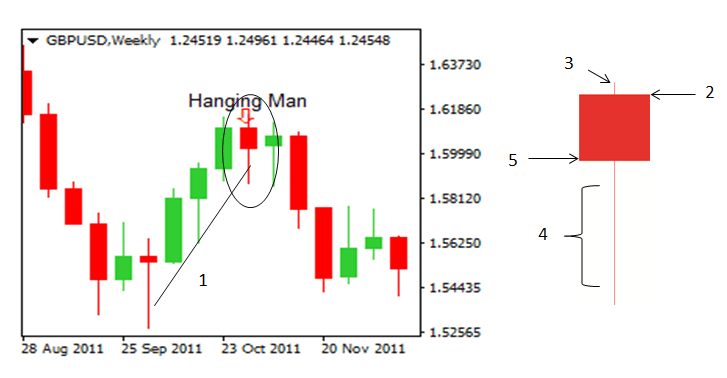
Characteristics of the Hanging Man candle

The hanging man candle is characterized by having a small real body, little or no upper shadow (wick) and a lower shadow at least twice the length of the body.

  1. Upward trend: The hanging man can only be identified as such once it has formed at the top of an uptrend.
  2. Opening level: The hanging man candle can either be a green candle (bullish), or a red candle (bearish) although, the bearish candle provides a better indication of a weakening market.
  3. Upper shadow: A small upper shadow indicates that there was an attempt to maintain the current uptrend before the significant drop in the price of the Pound Sterling.
  4. Long lower shadow: This is probably one of the most insightful observations on the candle, depicting a significant sell off before the bulls tried to regains some ground forcing the closing price to end up somewhat closer to opening levels but still down for the period.
  5. Closing level: In this case the closing level was below the opening level and therefore, confirms that this is a bearish hanging man candle.

Identifying hanging man candlestick trading signals

The hanging man candlestick can be used to identify a short trade (bearish view of the market) as the long shadow indicates massive selling. The true test of the legitimacy of the hanging man candlestick is often revealed in subsequent activity on the chart. If the following candle moves further down and breaks below the short term upward trend line, this can be seen as a continuation of the downward long term trend. Another possible entry level could be to enter the trade once the market has moved past the low of the hanging man candle.

Trading the Hanging Man?

It is important to view the hanging man candle formation in relation to the long term trend. The best way to do this is to make use of multiple time frame analysis. Start off by viewing the market using a longer time frame chart like the daily or weekly time frame to observe the direction the market is tending to in the long term. Then, zoom-in using a smaller time frame chart (4 hour or 2 hour) to analyze the ideal entry point for your trade.

Step 1: Identify the long term trend

View the chart on a longer time frame (perhaps a daily chart) to get an idea of the direction the market is heading. You do not want to place a trade in the opposite direction of the long term trend.

Step 2: Spotting your ideal entry point

Making use of a shorter time frame chart (4 hour chart), identify the ideal entry point. The hanging man candle formation provides us with a signal for a short trade.

Step 3: Make use of supporting indicators

Does the RSI confirm that the market has turned and now in a downward trend? Has the 20 SMA line crossed over the 50 SMA line? Does the hanging man candlestick appear near the top of the short term uptrend? Is a relevant Fibonacci retracement level nearby?

Step 4: Place your trade

Look for an entry point at the low of the hanging man candlestick. If your bearish view of the market is correct, you will see subsequent price action moving down – providing you with an indication to place your short trade.

Step 5: Risk management

Be sure to place your trade in accordance with your position sizing strategy. Consider how much of your total account value you are prepared to risk at any point in time and do not deviate from this. At DailyFX, we talk about risking less than 5% on all open trades. In addition, ensure that you place your stop at the high of the hanging man candle formation.

Step 6: When to close out of the trade?

Whenever entering a trade it is always best to have at least a 1:2 Risk-to-Reward ratio. You are risking half of what you intend to gain. This means that the distance from your entry level to your take profit level should be twice the distance from your entry level to your stop loss level. Applying this simple technique will mean that even if you only get half of your trades correct, you will still have a positive trading account. We talk about these trading insights in our Traits of Successful Traders research.

GBP/USD DAILY PRICE CHART (DOWNTREND)

GBP/USD daily chart showing a downtrend in priceZooming in a little further making use of the shorter, 4 hour chart (below), you will be better equipped to spot the ideal opportunity to enter the trade.

GBP/USD (4 HOUR)HANGING MAN CANDLE

hanging man reversal pattern appears within the context of a larger downtrendOn the 4 hour chart you will see that the previous level of support 1.40000, now acting as a level of resistance. The hanging man candle appears near the peak of the short term uptrend, below the new level of resistance. At this point, we are on the lookout for a reversing market to the downside. Eventually, price breaks below the low of the hanging man delivering an entry signal to short. Stops can be placed at the level of resistance (1.40000) for risk management purposes should the market move against you.

Confirmation of the sell signal:

  1. Long term downward trending market
  2. Hanging man candle appearing near the peak of the short term uptrend
  3. Hanging man appearing near a significant level of support/resistance
  4. Subsequent candles moving lower (lower highs & lower lows)
Japanese Yen Forecast: Technical Trade Setups on USD/JPY, EUR/JPY and GBP/JPY

Japanese Yen Forecast: Technical Trade Setups on USD/JPY, EUR/JPY and GBP/JPY

USD/JPY FORECAST – TECHNICAL ANALYSIS

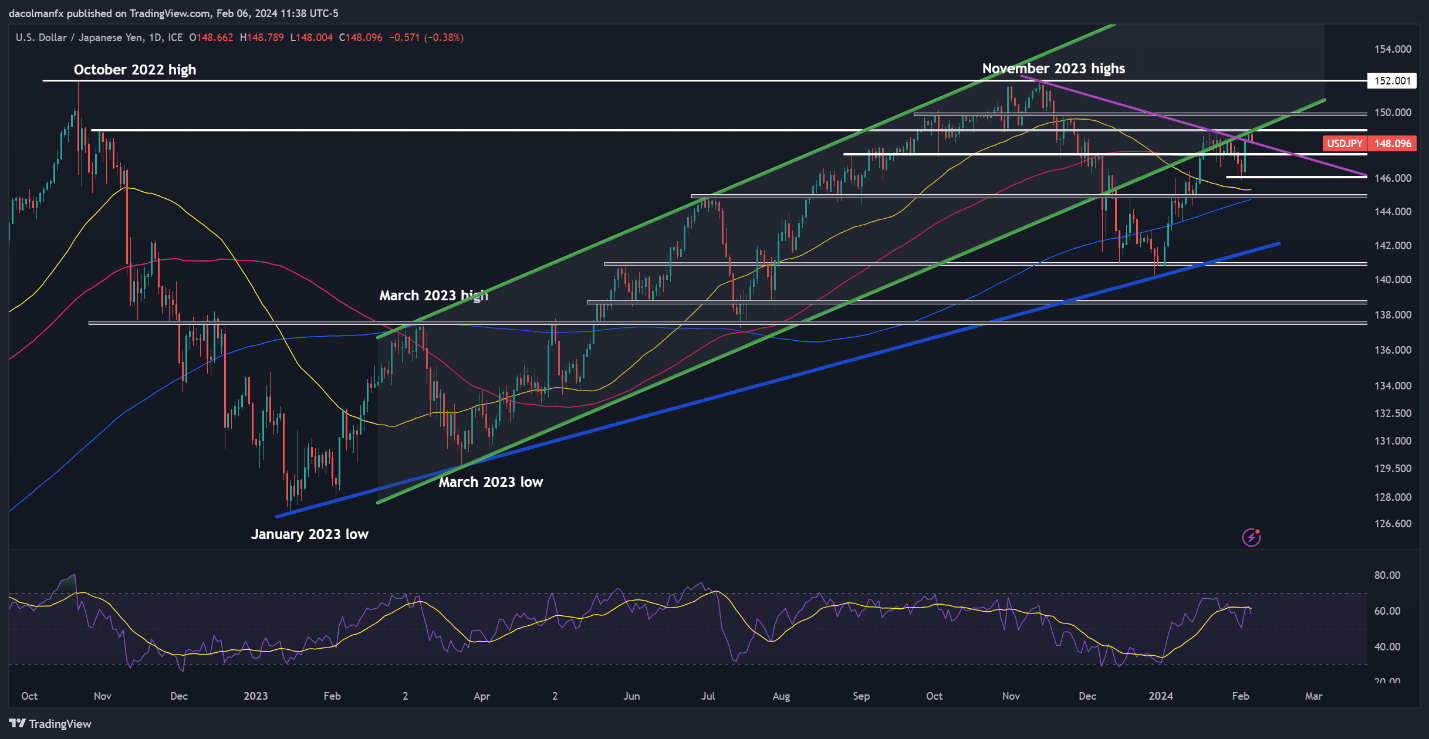
After a strong rally over the last couple of sessions, USD/JPY reversed to the downside on Tuesday following an unsuccessful attempt at breaking through resistance at 148.90, with the bearish move reinforced by falling U.S. bond yields. If losses accelerate, support is seen at 147.40, followed by 146.00.

On the flip side, if the bulls regain control, which seems a highly likely scenario given the improved outlook for the U.S. dollar in light of the Fed’s reluctance to cut rates prematurely, the first technical ceiling to watch appears at 148.90 and 150.00 thereafter. On further strength, the focus will be on 152.00.

USD/JPY TECHNICAL CHART

A screenshot of a computer  Description automatically generated

USD/JPY Chart

Want to know what lies ahead for the Japanese yen? Find all the insights in our Q1 trading forecast. Request your free copy now!

 EUR/JPY FORECAST – TECHNICAL ANALYSIS

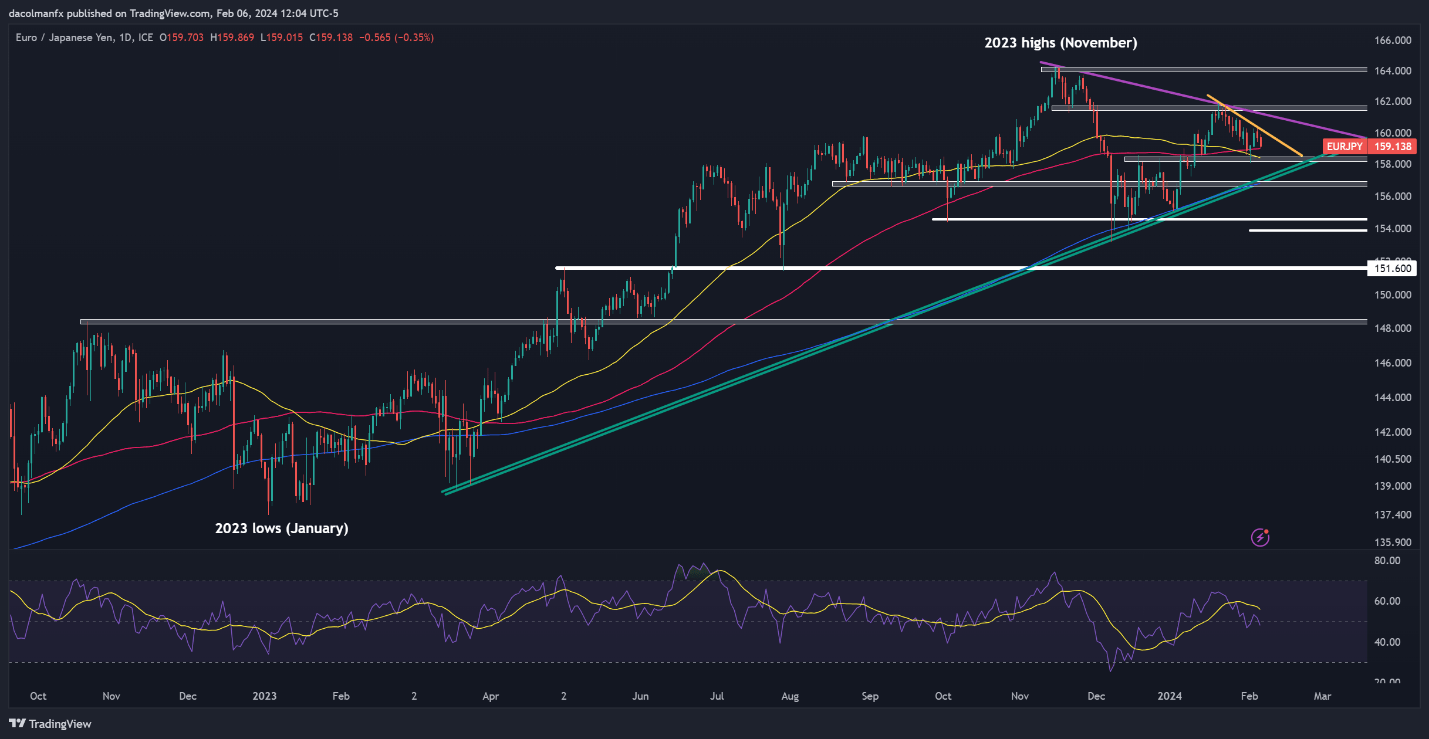
EUR/JPY has fallen over the past two weeks, guided lower by a bearish downtrend line extended off January’s highs. Following this move, the pair is stalking its 100-day SMA at 159.00. Bulls must firmly defend this floor; failure to do so may bring 158.30 into play, and maybe even trendline support at 157.00.

In the event of a bullish turnaround, trendline resistance at 160.00 will be the first barrier against an upward climb. While overcoming this technical barrier could prove difficult, a decisive breakout could open the door to a rally towards 161.00. Looking higher, all eyes will be on 161.60 and 164.00 thereafter.

EUR/JPY TECHNICAL CHART

A screenshot of a computer screen  Description automatically generated

EUR/JPY Chart

Interested in learning how retail positioning can offer clues about GBP/JPY’s near-term trajectory? Our sentiment guide has valuable information about this topic. Download it now!

GBP/JPY FORECAST – TECHNICAL ANALYSIS

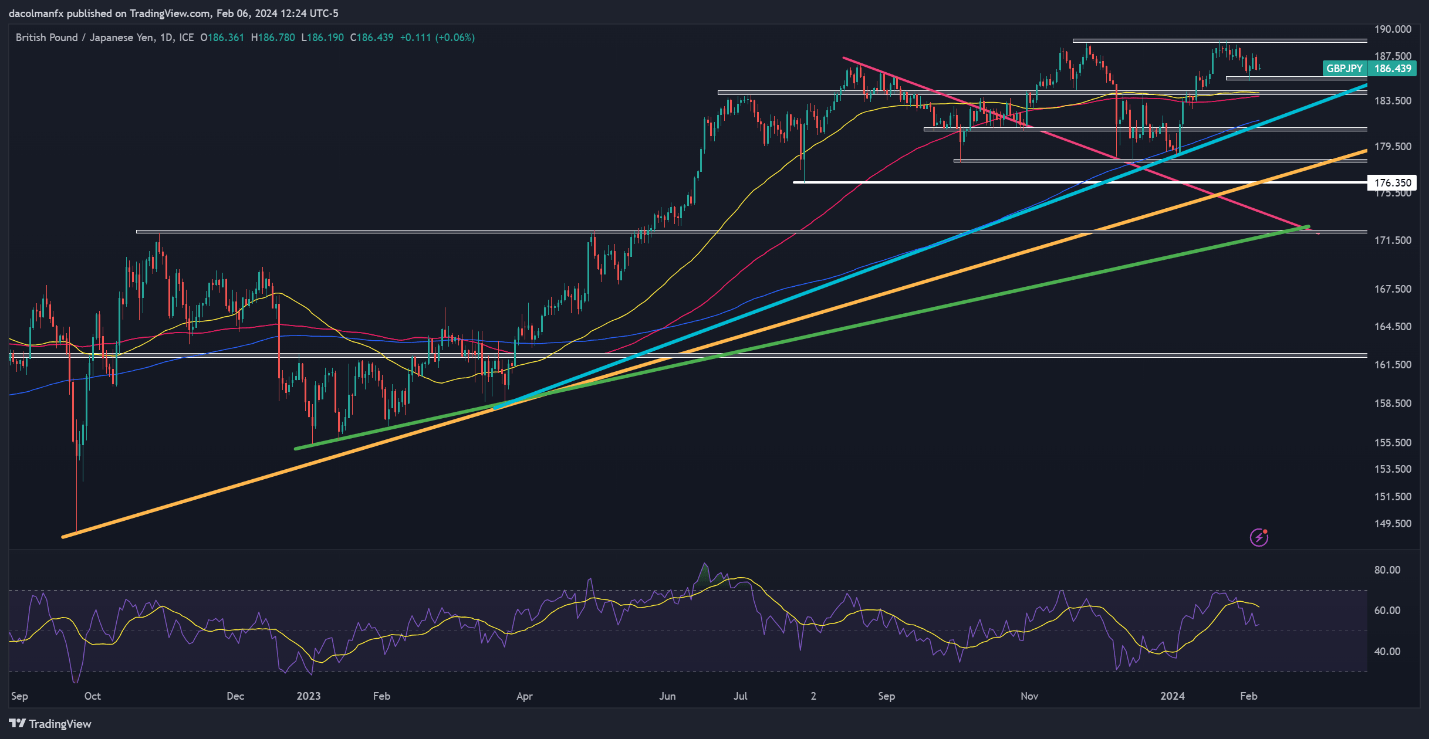
After reaching its best level in over 8 years near 189.00 last month, GBP/JPY has lost some ground, but has managed to establish a base in the vicinity of 185.50. If the pair holds above this area, buying interest could start gathering strength, paving the way for a possible retest of January’s multi-year high.

Conversely, if sellers unexpectedly return and push prices below 185.50, bearish pressure could intensify, creating the right conditions for a pullback towards 184.20, right around the 100-day and 50-day simple moving average. Below this zone, trendline support at 181.85 becomes the next critical floor to monitor.

GBP/JPY TECHNICAL CHART

A screen shot of a graph  Description automatically generated

GBP/JPY Chart

US Dollar Technical Forecast: Setups on EUR/USD, USD/JPY, GBP/USD, USD/CAD

US Dollar Technical Forecast: Setups on EUR/USD, USD/JPY, GBP/USD, USD/CAD

EUR/USD TECHNICAL ANALYSIS

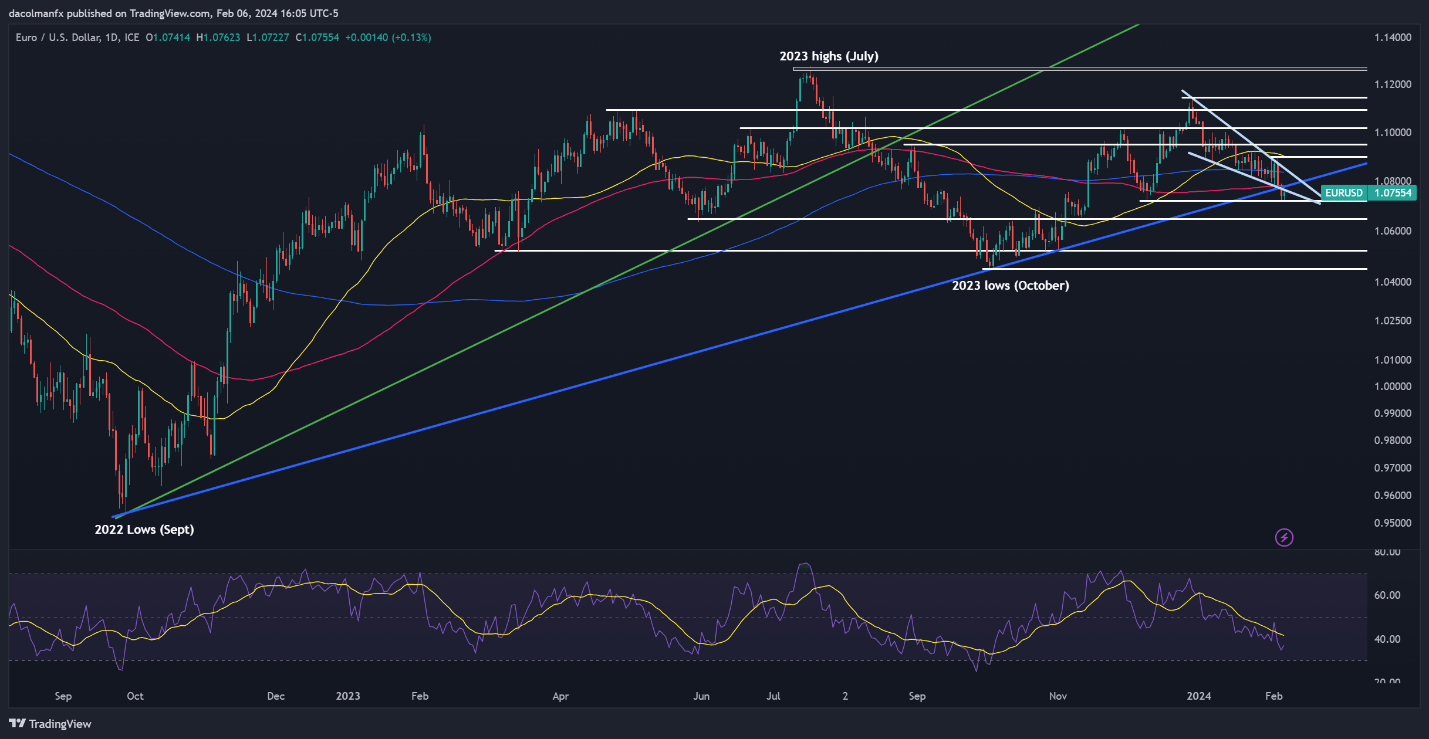
EUR/USD perked up on Tuesday after bouncing from a key floor slightly above the 1.0700 mark, with prices approaching cluster resistance at 1.0780. If the bulls manage to take out this technical barrier in the coming days, we could see a move toward the 200-day simple moving average at 1.0840.

In contrast, if sellers return and drive the pair below horizontal support at 1.0720, bearish pressure could intensify, exposing the 1.0650 region. The pair is likely to start a bottoming-out phase around these levels before staging a turnaround, but in the event of a breakdown, a rapid move towards 1.0524 could ensue.

EUR/USD TECHNICAL CHART

image1.png

EUR/USD Chart

Keen to understand how FX retail positioning can provide hints about the short-term direction of GBP/USD? Our sentiment guide holds valuable insights on this topic. Download it today!

GBP/USD TECHNICAL ANALYSIS

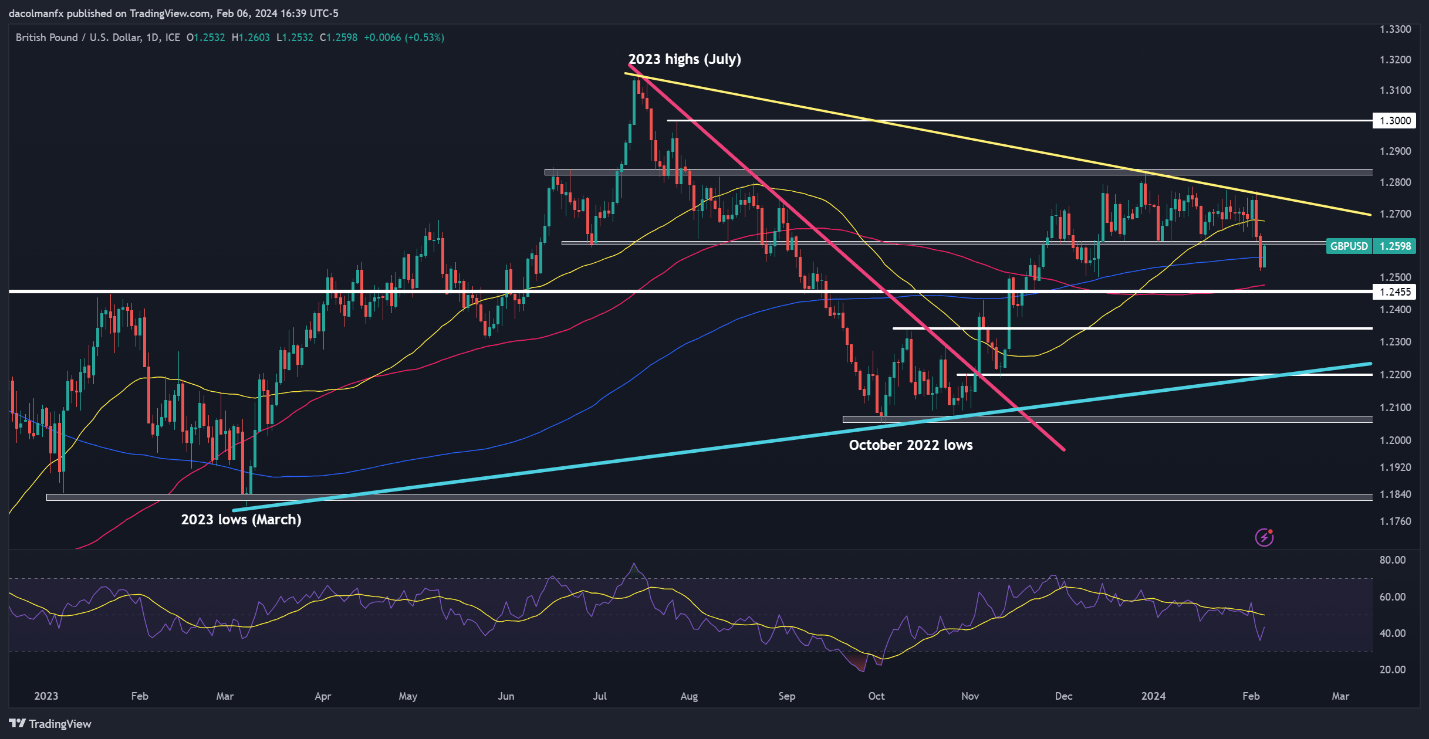
After Monday’s selloff, GBP/USD rebounded on Tuesday, climbing past its 200-day SMA but falling just shy of recapturing the 1.2600 handle. We cannot definitively state that this ceiling will hold, but if it does, sellers could resume their offensive, paving the way for a drop towards 1.2560, followed by 1.2455.

On the other hand, if cable manages to breach resistance at 1.2600, breakout traders may be enticed to jump in, reinforcing the upward push and creating optimal conditions for a rally towards the 50-day simple moving average at 1.2680. On further strength, all eyes will be on trendline resistance at 1.2750.

GBP/USD TECHNICAL CHART

A screenshot of a graph  Description automatically generated

GBP/USD Chart

Want to explore how retail positioning can mold the short-term direction of USD/CAD? Our sentiment guide offers valuable insights. Download your complimentary guide today!

USD/CAD TECHNICAL ANALYSIS

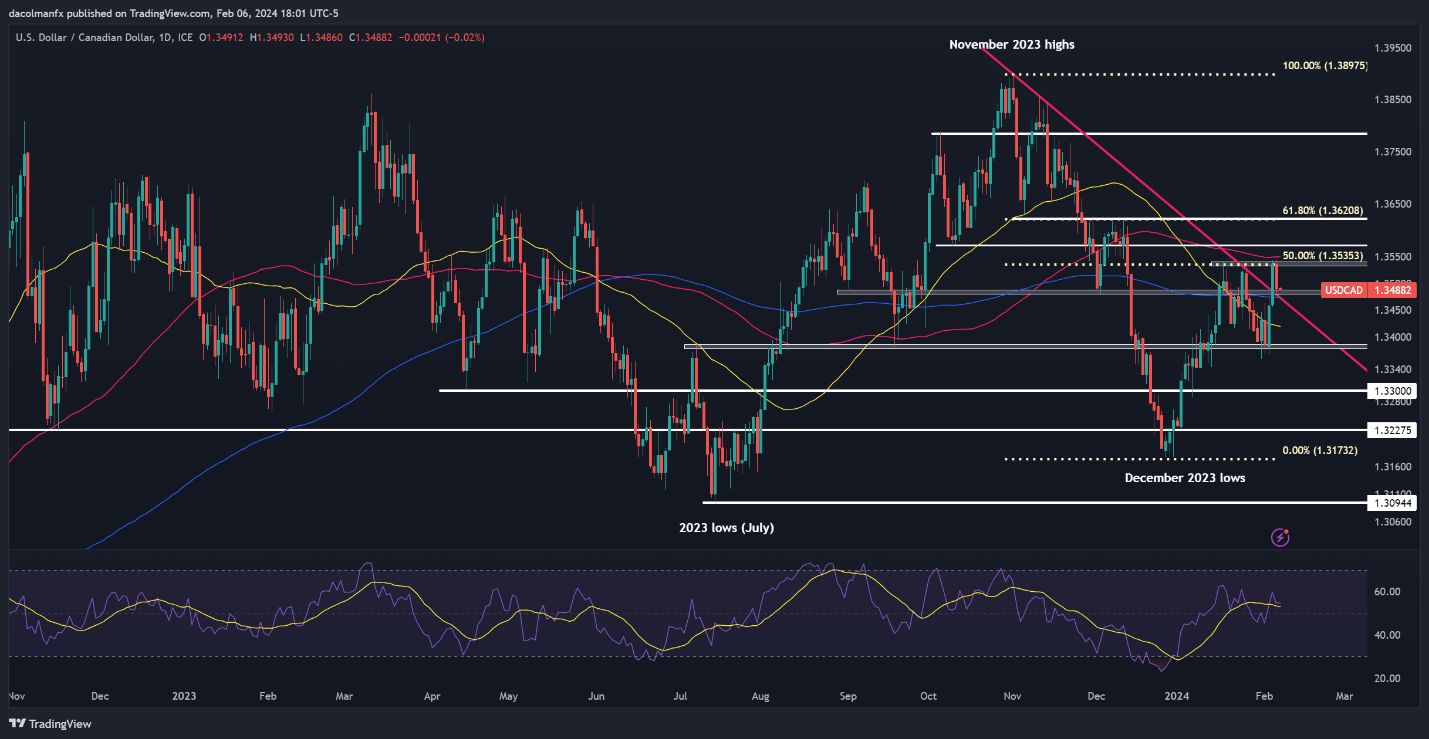
USD/CAD fell sharply on Tuesday after failing to break above confluence resistance at 1.3535, a key area where multiple previous swing highs align with the 50% Fib retracement of the Nov/Dec slump. If the decline gains steam in the coming days, support awaits around the 200-day SMA near 1.3475. Subsequent losses could shift the spotlight to the 50-day SMA at 1.3420, followed by 1.3380.

Conversely, in the event that the pair embarks on a bullish reversal from its present position, the first ceiling to watch emerges at 1.3535, as previously highlighted. Moving higher, the crosshairs will be locked onto 1.3575 and then 1.3620.

USD/CAD TECHNICAL CHART

A screenshot of a computer screen  Description automatically generated

USD/CAD Chart

Eager to discover what the future may have in store for the Japanese yen? Find comprehensive answers in our quarterly trading forecast. Claim your free copy now!

USD/JPY TECHNICAL ANALYSIS

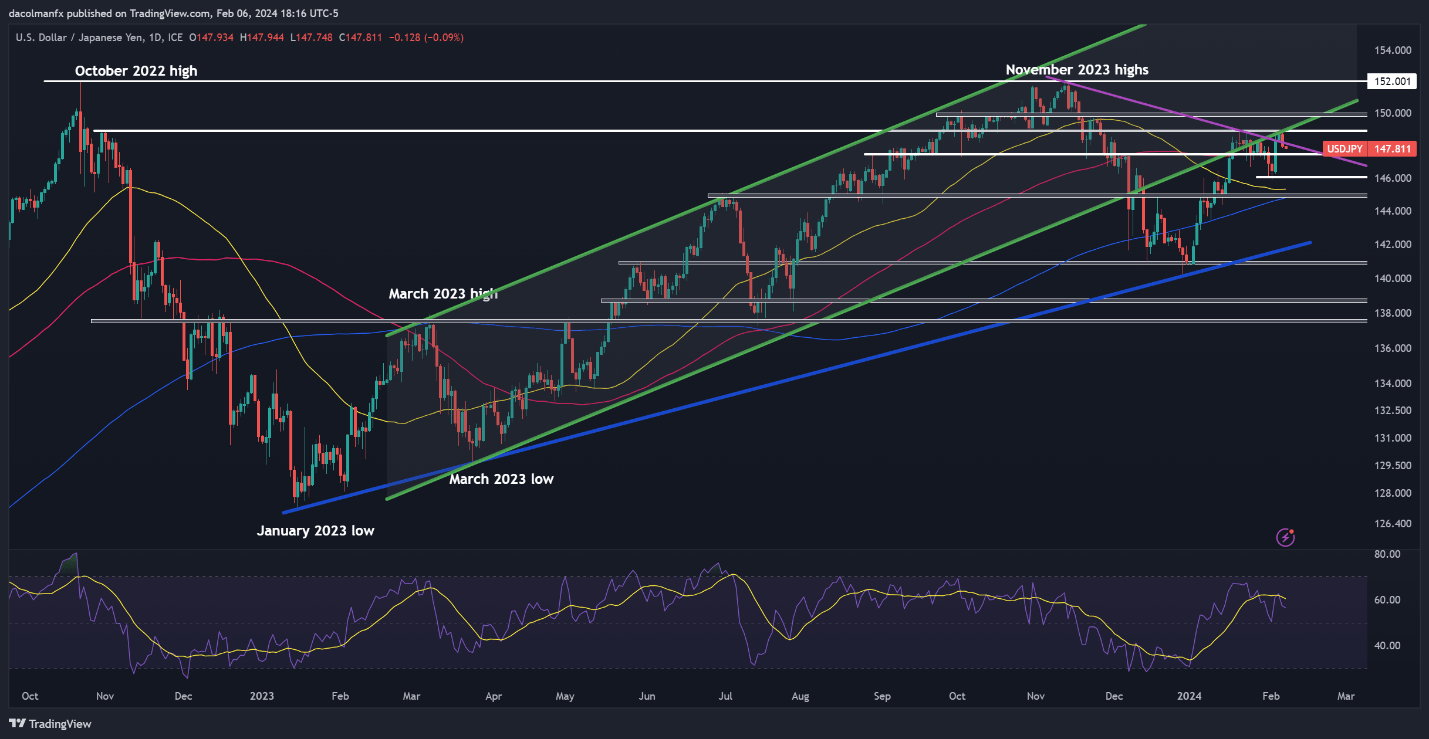
USD/JPY suffered a setback on Tuesday following a bearish rejection at technical resistance near 148.90, with the pullback seemingly amplified by falling U.S. yields. If weakness persists later this week, support is located at 147.40. Below this area, the next significant floor to consider emerges at 146.00.

On the other hand, if the bulls regain control, which appears to be a strong possibility given the improved U.S. dollar outlook stemming from the Fed’s reluctance to deliver premature rate cuts, resistance looms at 148.90, followed by 150.00. In case of further gains, attention will be directed towards 152.00.

USD/JPY TECHNICAL CHART

image4.png

USD/JPY Chart

Interest Rates and the Forex Market

Interest Rates and the Forex Market

What are interest rates and why do they matter to forex traders?

When traders talk about ‘interest rates’ they are usually referring to central bank interest rates. Interest rates are of utmost importance to forex traders because when the expected rate of interest rates change, the currency generally follows with it. The central bank has several monetary policy tools it can use to influence the interest rate. The most common being:

  • Open market operations: The purchase and sale of securities in the market with the goal of influencing interest rates.
  • The discount rate: The rate charged to commercial banks and other depository institutions on loans they receive from their regional Federal Reserve Bank’s lending facility.

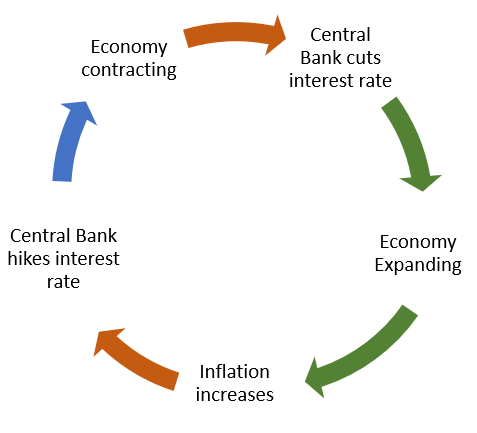
Central banks have two main tasks: to manage inflation and promote stability for their country’s exchange rate. They do this by changing interest rates and managing the nation’s money supply. When inflation is ticking upwards, above the central bank’s target, they will increase the central bank rate (using the policy tools) which can restrict the economy and bring inflation back in check.

The economic cycle and interest rates

Economies are either expanding or contracting. When economies are expanding, everyone is better off, and when economies are contracting (recession) they are worse off. The central bank aims to keep inflation in check while allowing the economy to grow at a modest pace, all by managing the interest rate.

When economies are expanding (GDP Growth positive), consumers start to earn more. More earning leads to more spending, which leads to more money chasing fewer goods – triggering inflation. If inflation is left unchecked it can be disastrous, so the central bank attempts to keep inflation at its target level, which is 2% (for most central banks), by increasing interest rates. Increased interest rates make borrowing costlier and helps reduce spending and inflation.

If the economy is contracting (GDP growth negative), deflation (negative inflation) becomes a problem. The central bank lowers interest rates to spur spending and investment. Companies start to loan money at low interest rates to invest in projects, which increases employment, growth, and ultimately inflation.

The cycle goes something like this:

Flowchart showing economic rate cycle and impact on interest rates

How do interest rates affect currencies?

The way interest rates impact the forex markets is through a change in expectations of interest rates that lead to a change in demand for the currency. The table below displays the possible scenarios that come from a change in interest rate expectations:

Market expectations Actual Results Resulting FX Impact
Rate Hike Rate Hold Depreciation of currency
Rate Cut Rate Hold Appreciation of currency
Rate Hold Rate Hike Appreciation of currency
Rate Hold Rate Cut Depreciation of currency

Interest rate relevance to forex trading

Imagine you are an investor in the UK that needs to invest a large sum of money in a risk-free asset, like a government bond. Interest rates in the US are on the rise so you start to buy US Dollars to invest in the US government bonds.

You (being the UK investor) are not alone in investing in the country with higher interest rates. Many other investors follow the increase in yield and so increase the demand for US Dollars which appreciates the currency. This is the essence of how interest rates affect currencies. Traders can attempt to forecast changes in expectations of the interest rate which can have a large effect on the currency.

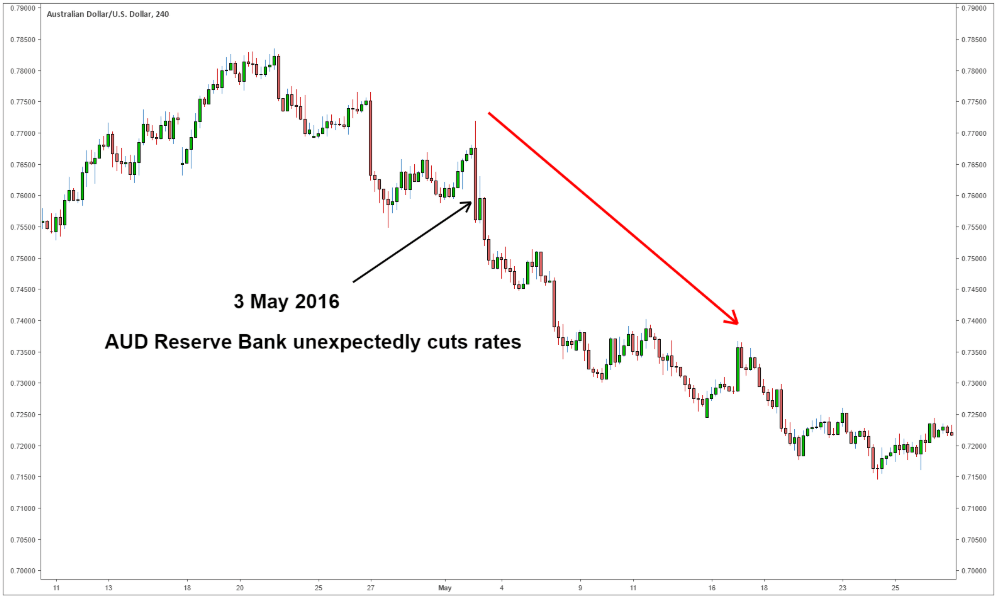
Here is an example of what happens when the market expects the central bank to keep interest rates on hold, but then central bank decreases the interest rate. In this example, the Reserve Bank of Australia was expected to keep interest rates on hold at 2% but instead cut it to 1.75%. The market was surprised by the rate cut so the AUD/USD depreciated.

Chart showing AUD/USD depreciation after Reserve Bank cut interest rates

Understanding forex interest rate differentials

Interest rate differentials are simply differences in interest rates between two countries.

If a trader expects the US to unexpectedly hike interest rates he/she anticipates the US dollar may appreciate. To increase the trader’s chances of success, the trader can buy the US Dollar against a currency with low interest rates as the two currencies are diverging in the direction of their respective interest rates.

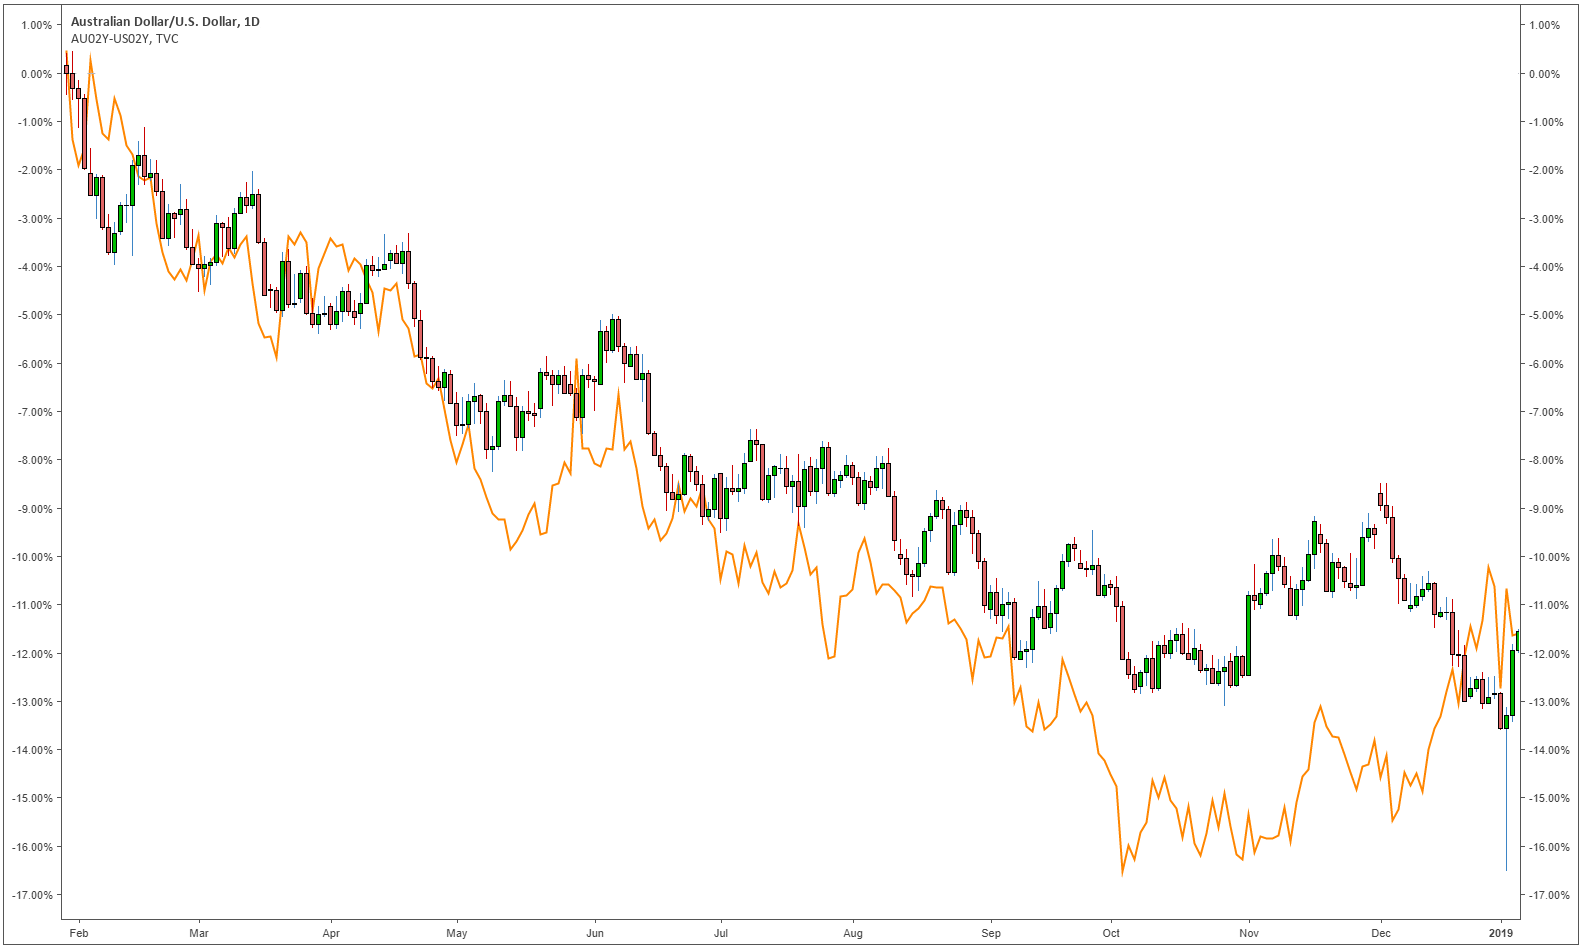
Interest rates and their differentials have a large influence on the appreciation/depreciation of the currency pair. The changes in interest rate differentials are correlated to the appreciation/depreciation of the currency pair. It is easier to understand visually. The chart below compares the AUD/USD currency pair (candlestick graph) and the difference between the two-year AUD government bonds and the two-year USD government bonds (orange graph). The relationship shows that as the AUD bonds yield decreases relative to the USD bonds, so does the currency.

AUD/USD compared with 2 year AUD/USD rate differential

Interest rate differentials are widely used in carry trades. In a carry trade money is loaned from a country with a low rate and invested in a country with a higher interest rate. There are, however, risks involved with the carry trade such as the currency invested in depreciating relative to the currency used for funding the trade.

How to forecast central bank rates and the impact on FX markets

Fed funds futures are contracts traded on the Chicago Mercantile Exchange (CME) that represent the markets expectations of where the daily official federal funds rate will be when the contract expires. The market always has its own forecast of where the interest rate will be. A trader’s job is to forecast a change in those expectations.

For a trader to forecast central bank rates he/she will need to keep a close eye on what the central bankers are currently monitoring. Central bankers try to be as transparent as possible to the public about when they expect to increase interest rates and which economic data they are currently monitoring.

The central bankers decide to increase or decrease interest rates based on several economic data points. You can keep up to date with the release of these data points using an economic calendar. Inflation, unemployment, and the exchange rate are some of the major data points. The trader must be in tune with the central bank policy makers and almost try to forecast what their actions will be before they state it to the public. This way the trader can reap the benefits of the markets change in expectations. This method of trading is based on the fundamentals which is different to trading using technical analysis. See our article on Technical vs Fundamental analysis to understand the different ways to analyze forex.

Fibonacci Projections

Fibonacci Projections

How to Use the Fibonacci Expansion Tool When Trading

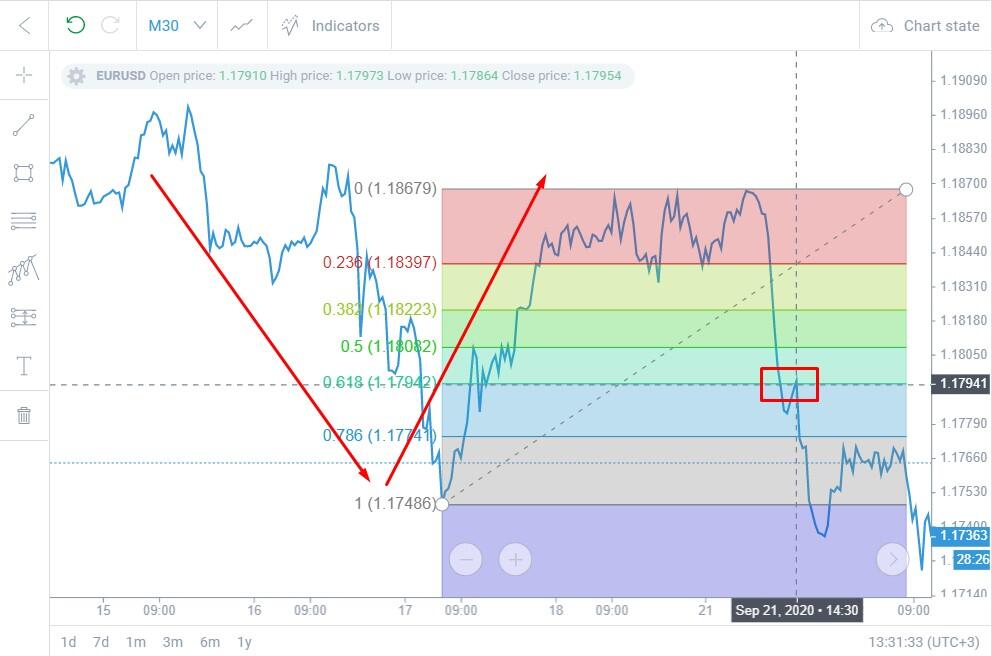
The Fibonacci extension, much like the Fibonacci retracement, makes use of Fibonacci numbers and ratios when mapping out possible future levels of support and resistance. This is a useful tool when anticipating trend continuation after the retracement of a strong initial move and can be applied to any market.

Fibonacci Extension Explained

This article builds on the foundational knowledge of Fibonacci retracements and Fibonacci numbers in general. Therefore, it is strongly recommended that you familiarize yourself with these concepts by reading our introductory article in the Fibonacci sub-module.

Fibonacci Spiral Highlighting Key Fibonacci Numbers and the 1.618 Ratio

While the familiar Fibonacci Retracements are used to determine how far the price may retrace the original move, Fibonacci Expansions can help us determine where price might head after the retracement is completed.

Applying the Fibonacci Extension to Price Charts

The Fibonacci expansion or Fibonacci extension can be applied to price charts in three simple steps. Once the Fibonacci tool has been selected, you will need to click on three points on the chart in the following sequence:

In uptrends, your reference points will be a low (A), high (B), low (C). Respectively, in downtrends, your refence points will be a high (A), low (B), high (C).

  1. The base of the large primary move: Point ‘A’ shown in the DXY chart below, depicts the base of the original/primary move
  2. The peak of the primary move: Point ‘B’ depicts the peak of the primary move and the beginning of the retracement.
  3. The end of the retracement – the swing low: Point ‘C’ marks the end of the retracement and the last of the three points for the Fibonacci extension tool. Point ‘C’ is marked with a reasonable degree of confidence based off the strong move in the direction of the primary move shown by the long green candle.
  • Primary move: The line connecting point A to point B, i.e. line AB.
  • The retracement: Line BC
  • Trend continuation: Starts from point C and projects Fibonacci extensions of possible support / resistance levels in the direction of the primary trend.

How to Apply the Fibonacci Extension when Trading

The chart below shows the standard Fibonacci levels/ratios as well as point ‘D’ which has been added to depict a 100% advance or ‘extension’ from the low of the retracement line BC in the direction of the primary move. The CD line is the same length as the AB line.

Taking a closer look, there are levels or broader zones on the chart below where price paused near Fib levels that acted as support or resistance. Of particular importance is the 61.8% level- these levels can provide potential areas of support or resistance for future price action and should be monitored closely.

For instance, a bullish trader entering the market soon after the swing low at C may look to the 61.8% level as an initial exit point while the 100% extension (point D) may serve as an indication of a secondary exit point. Often times corrections in price trends take the shape of two equal legs and as such, once price exhaustion is identified at the 100% extension, the focus shifts towards initial support back at the 61.8% extension. The subsequent charts shows price rebounding off this mark on the pullback as the extension offers support. Always keep in mind that extensions should be used like basic trendlines – a break of support turns the level into resistance and vice versa.

Traders ought to be looking for entries in the direction of the trend, unless price action reveals otherwise, hence the inclusion of the long trade in this example. But this type of analysis applies just the same for the short side of the market.

Simple Moving Average (SMA) vs Exponential Moving Average (EMA)

Simple Moving Average (SMA) vs Exponential Moving Average (EMA)

When considering the technical analysis tools to use in their charts, traders will frequently come by simple moving averages, or SMAs, and exponential moving averages, or EMAs. Both of these instruments can help market practitioners make sense of price and inform their entry and exit decisions. But how do these two indicators stack up against each other? In this piece, we’ll give the SMA vs EMA lowdown.

Simple vs Exponential Moving Average: An Overview

A Simple Moving Average (SMA) is a calculation of the average price of an asset or currency pair according to the number of periods in the range. It weights each candle and its corresponding closing price equally, with no one candle’s closing price given more significance than any other candle in the equation.

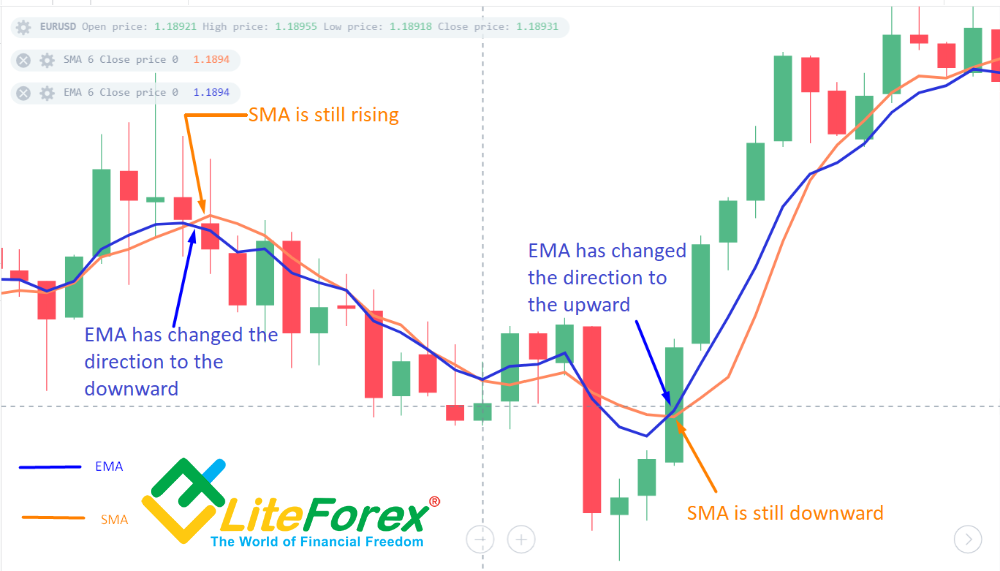
An Exponential Moving Average (EMA), however, while similar, gives more weight to the most recent candles, and so this type of moving average will react faster to the most recent trading activity. While at the outset this might appear to be the best way to go, it is important to keep in mind that whenever an indicator is ‘sped up’, it will be more likely to provide more random (false) entry signals. Most traders and trading entities such as banks and hedge funds will employ the use of SMAs.

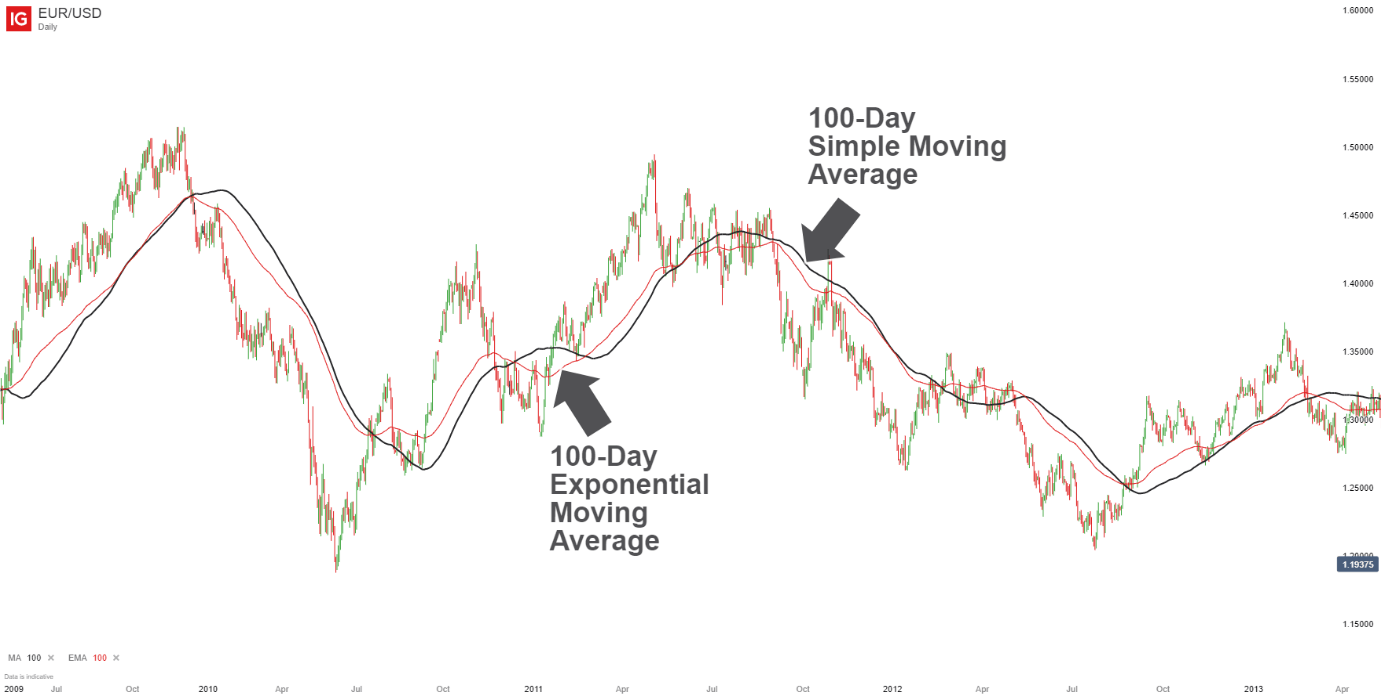
To see how these differences appear on a chart, take a look at the daily chart of the EUR/USD posted below.

Simple (SMA) vs Exponential Moving Average (EMA) on chart

Simple vs Exponential moving average: Which is better?

When it comes to the simple and exponential moving averages and the question of which is better, you can see that in the graphic above that there appears to be little difference between the two. Normally, the EMA will change sooner than the SMA because it emphasizes the more recent activity more than the older activity. But in this case there really is not much of a difference.

However, in general, the shorter the time frame and/or the more dramatic the price action, the greater the difference that you will see between the two MAs. Therefore, shorter-term traders might find the EMA more effective in implementing their trading strategies since it is more sensitive to the recent price movement.

New traders will play with both tools to find out which one they find to be better, and use that one in their trading approach. But the reality is that it is unlikely that one moving average will give you winning results if the other does not.

If you find that a switch from a SMA to an EMA turns a losing strategy into a winning strategy, it is probably your strategy that needs changing instead of the moving average. There is just not enough difference in the two to have that much of an impact in the results of a certain strategy. The 200-day SMA is popular for identifying the trend. If the market is above the 200-day SMA, the trend is considered to be up and if the market is below the SMA, the trend is considered down.

Short-term traders have made the 10-day EMA popular based on its use by some famous traders. But the only judge to what type of moving average to use is your account balance from month to month. If it helps your trading, then keep it – and if it does not help your trading, then look to replace it.