US Dollar Forecast: EUR & GBP Oversold, Mixed EU PMIs Pose Challenges

US Dollar Forecast: EUR & GBP Oversold, Mixed EU PMIs Pose Challenges

Dollar’s Subdued Reaction to Strong ISM Services PMI

During the Asian market hours, the US dollar index traded slightly bearish, experiencing a bearish retracement to $104.280, a decrease of 0.17%. This occurred despite the release of the solid ISM Services PMI, which exceeded expectations with a robust figure of 53.4, surpassing both the anticipated 52.0 and the previous 50.6. The strong PMI suggests that the service sector continues to exhibit enduring strength.

Events Recap & Review

The European economic data presented a mixed bag, with German Trade Balance exceeding expectations at 22.2B against the forecasted 19.0B, showcasing a stronger trade surplus.

Service sector PMIs across major European economies varied, with Spain and Italy reporting figures above expectations, suggesting resilience in services.

Conversely, France’s service sector struggled, as indicated by its final PMI at 45.4. The Eurozone’s investor confidence and PPI m/m data also highlighted ongoing economic challenges, with deflationary pressures evident in the PPI figures.

Events Ahead

US Dollar Index (DXY)

Dollar Index
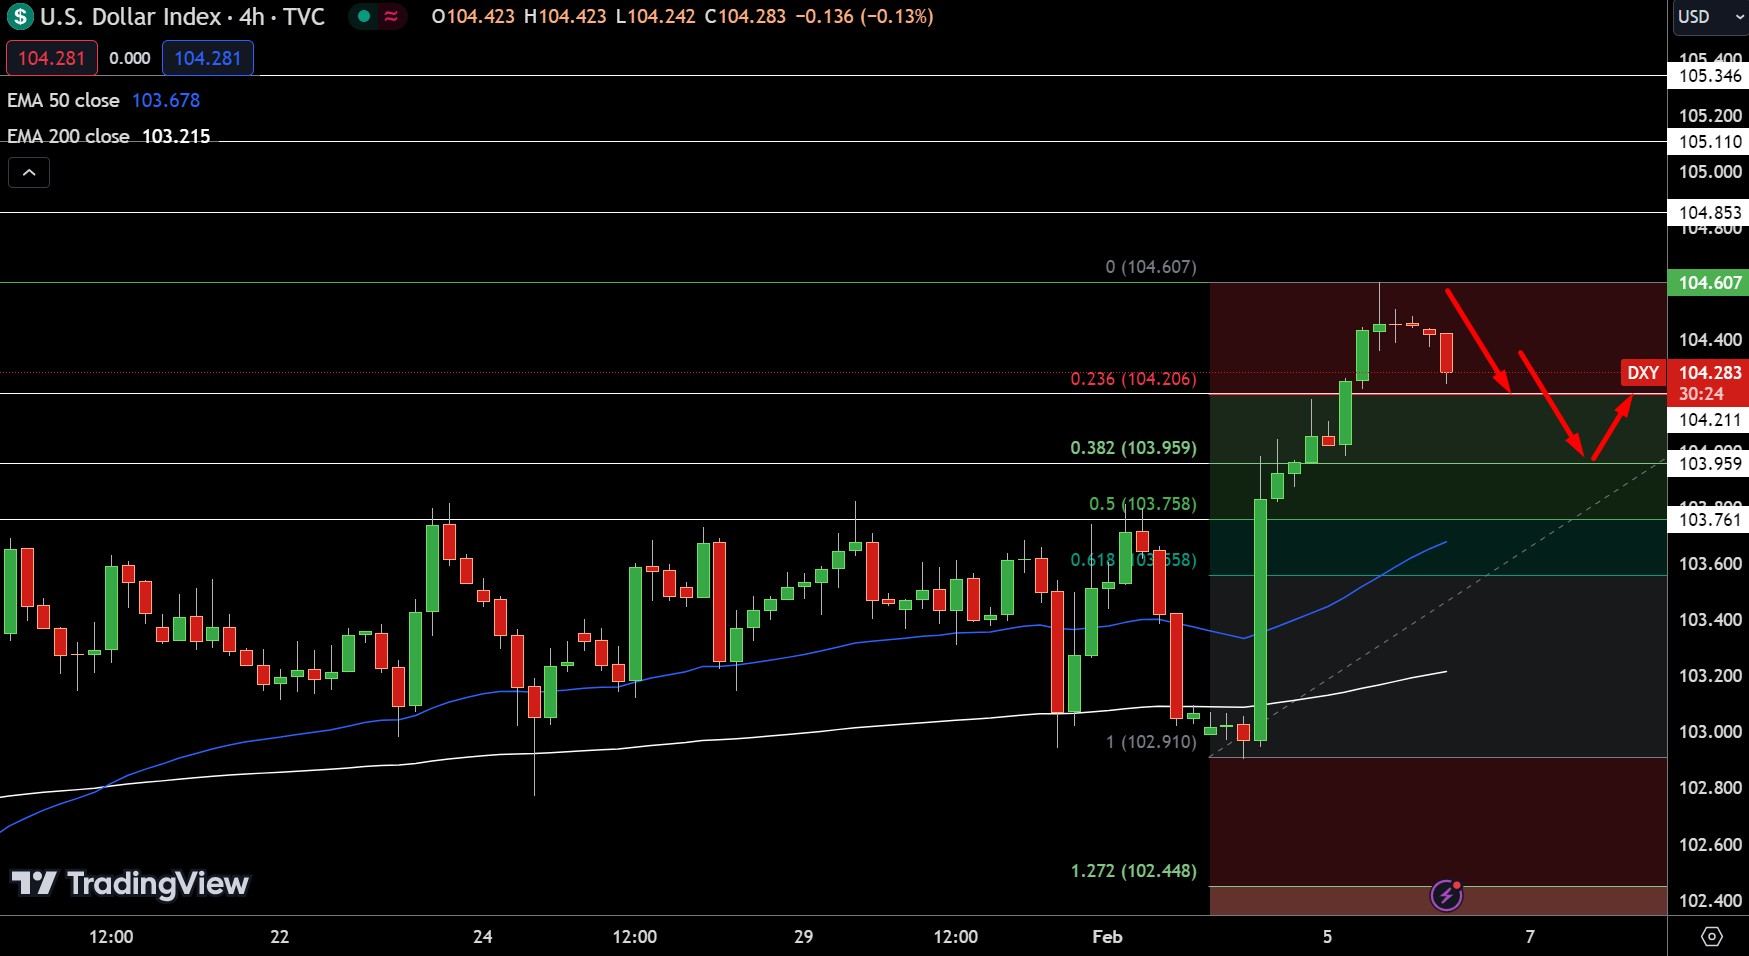
Dollar IndexThe Dollar Index finds itself at a critical juncture, with the pivot point set at 104.607. In this 4-hour chart analysis, resistance levels are delineated at 104.853, 105.110, and 105.346, each representing key thresholds for potential upward movements.

Conversely, immediate support is positioned at 104.211, marking a 23.6% Fibonacci retracement. Further support is seen at 103.959 (38.2% Fibonacci retracement) and 103.761 (50% Fibonacci retracement), crucial for holding the index from further declines.

The technical landscape is further defined by the 50-day Exponential Moving Average (EMA) at 103.678 and the 200-day EMA at 103.215, both underscoring a bearish sentiment below the pivot point.

Given these dynamics, the Dollar Index’s trend leans bearish below $104.607, highlighting a cautious outlook for the currency in the short term.

EUR/USD Price Chart - Source: Tradingview
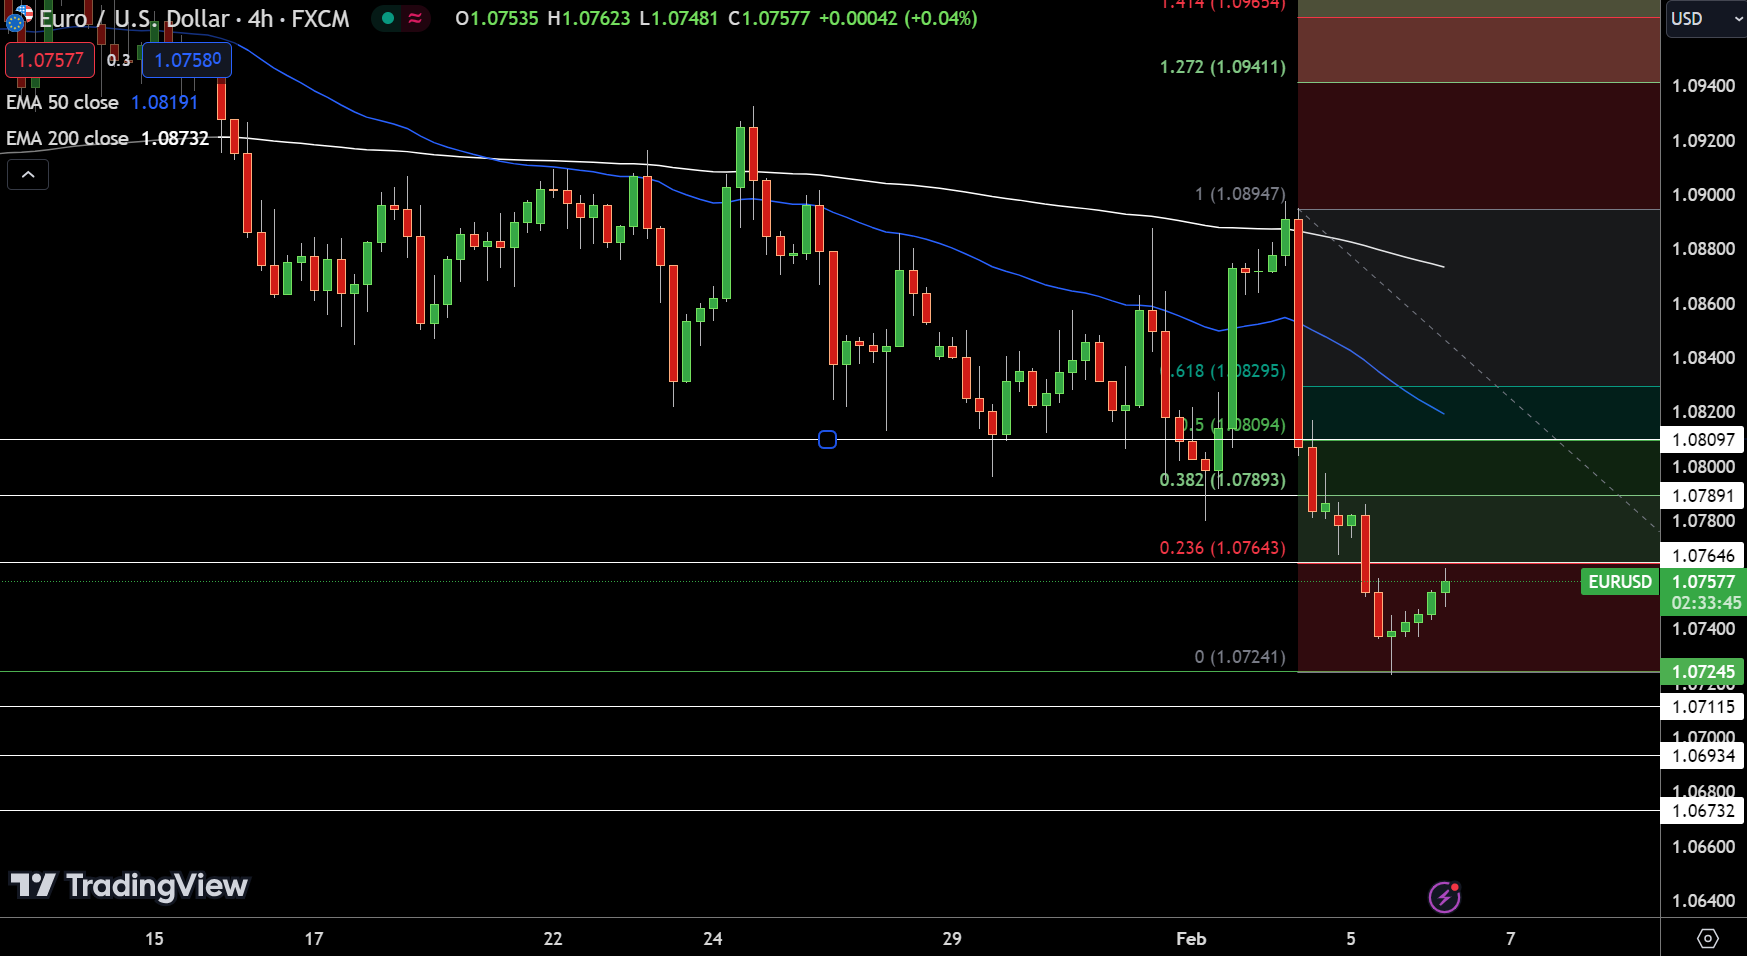
EUR/USD Price Chart – Source: TradingviewThe EUR/USD pair marks a modest increase, trading at 1.07563, up by 0.13%. Within the 4-hour chart frame, a pivotal moment is observed as it hovers around the pivot point at 1.07545.

Notably, resistance levels are set at 1.07646 (23.6% Fibonacci retracement), 1.07891 (38.2% Fibonacci retracement), and 1.08097 (50% Fibonacci retracement), outlining potential barriers to upward movement. On the downside, support is identified at 1.07115, followed by 1.06934 and 1.06732, marking key levels where buying interest could emerge.

GBP/USD Price Chart - Source: Tradingview
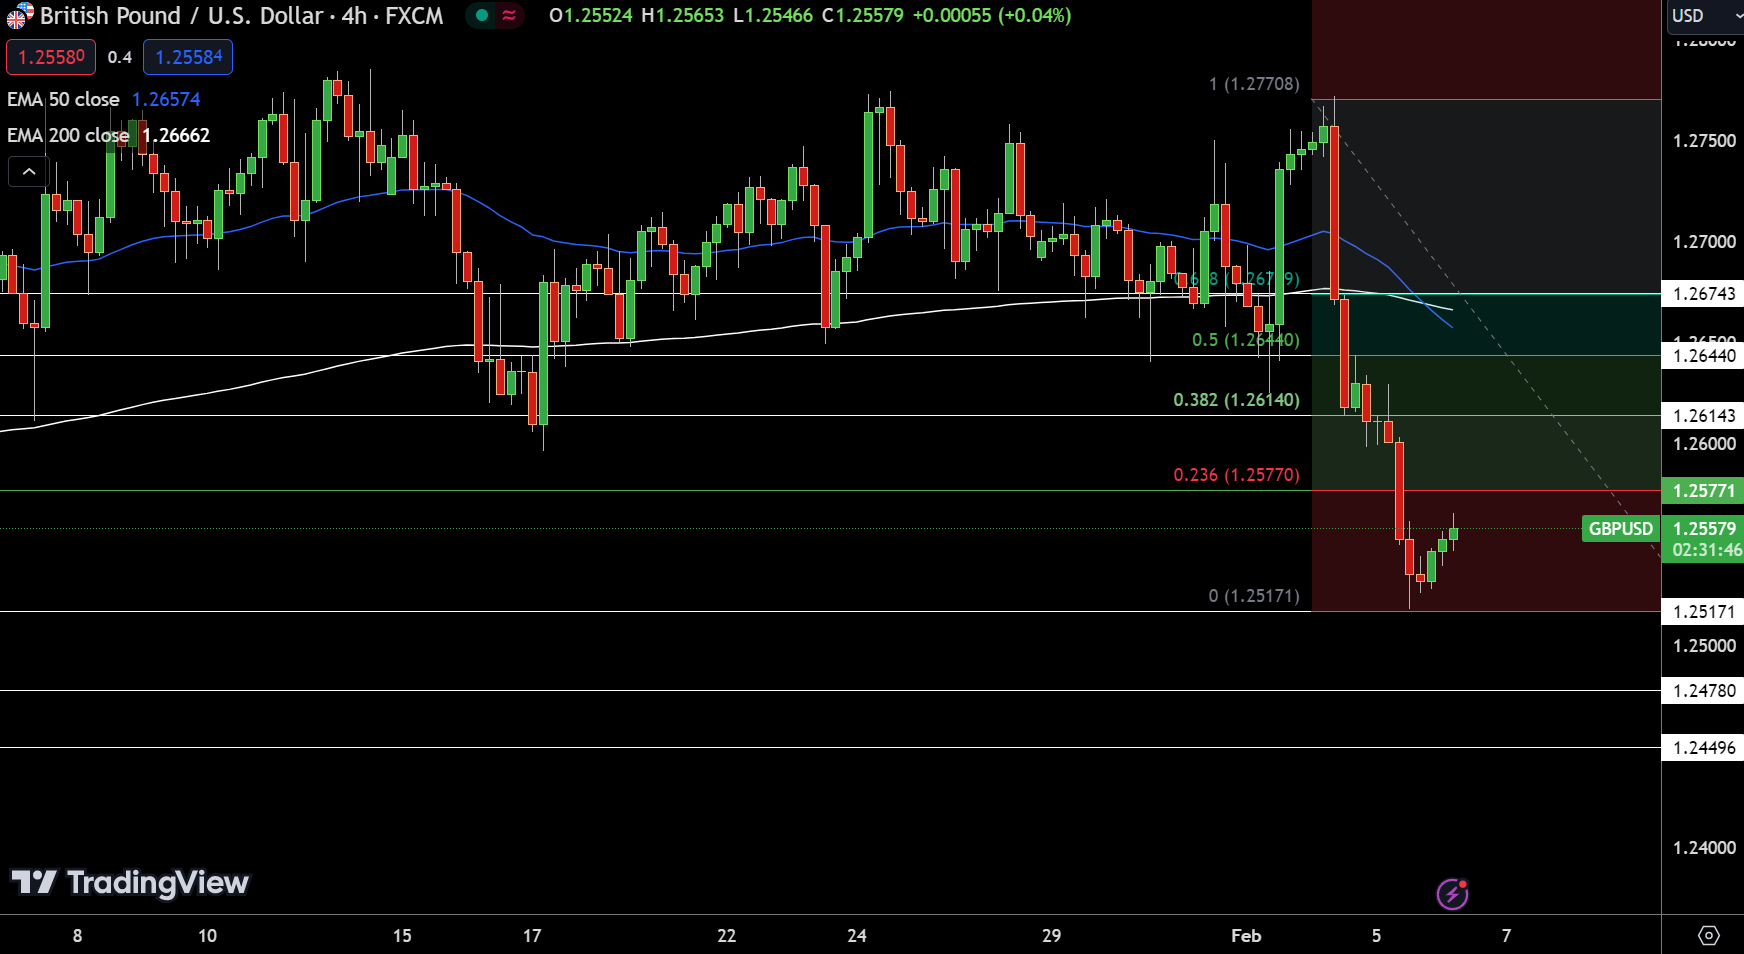
GBP/USD Price Chart – Source: Tradingview

RBA Press Conference Highlights Inflation Risks to the Economy

RBA Press Conference Highlights Inflation Risks to the Economy

RBA Press Conference

On Tuesday, RBA Governor Michele Bullock held the first monetary policy decision press conference.

  • We want to see inflation continue to decline, and that’s more important than market pricing. Inflation has a four in front of it, which is too high.
  • Productivity will return to the Australian economy when looking further out.
  • Governor Bullock discounted the impact of tax cuts on consumption, the economic outlook, and inflation.
  • RBA does not want inflation expectations to rise. On that basis, the RBA raised rates in November to mitigate inflation risks to the economy.
  • The RBA hasn’t ruled anything out or ruled anything in vis-à-vis rate decisions.
  • RBA Governor Bullock understands mortgage holders are sweating over the risk of higher interest rates. However, Governor Bullock believes tackling inflation will have more beneficial effects.
  • The RBA needs to ensure progress continues to bring inflation to target.
  • On a scale of 1-10, RBA Governor Bullock ranked her optimism of bringing inflation to target at 5.
  • On Taylor Swift tickets, RBA Governor Bullock noted that people prioritize spending habits, with Taylor Swift tickets a priority for some.
  • The Board believes it can bring inflation to target without adversely impacting the labor market.
  • RBA judges the risks to inflation as balanced, with forecasts showing inflation returning to target by 2025.
  • The RBA Board remains focused on employment, which continues to grow.
  • Board members must be confident inflation will return to the band range before cutting rates.

RBA Rate Statement Maintained a Hawkish Spin

On Tuesday, the RBA left the Cash Rate at 4.35%. However, the Rate Statement maintained a hawkish tone despite softer inflation numbers for Q4.

RBA board members noted that inflation remained too high at 4.1%, attributing sticky inflation to services price inflation. Other salient points from the Rate Statement included,

  • Wage growth may not increase significantly further and remain consistent with the inflation target.
  • The economic outlook is uncertain amidst lingering inflation risks.
  • Central forecasts are for inflation to return to the target range (2-3%) in 2025.
  • Board members expect employment to improve moderately.
  • Household consumption remains uncertain.
  • The Board expects it will take some time for inflation to sustainably return to the target range.
  • Significantly, the RBA did not rule out further interest rate hikes, and policy decisions will depend upon income data.
  • Focal points for the Board include the global economy, domestic demand trends, and the outlook for the labor market and inflation.

The RBA warned the markets of a possible rate hike if economic data warrant tighter monetary policy conditions. Notably, the more hawkish-than-expected minutes could create more monetary policy and economic uncertainty in the near term.

The monetary policy decision and RBA Rate Statement coincided with the early release of the RBA Statement on Monetary Policy.

The Quarterly Statement of Monetary Policy

On Tuesday, the Statement of Monetary Policy highlighted weaker growth and employment forecasts. Significantly, inflation forecasts were also lower.

  • GDP growth forecasts for H1 2024 were down from 1.8% to 1.3%, with full-year 2024 forecasts down from 2.0% to 1.8%.
  • The RBA expects the unemployment rate to rise to 4.2% in H1 2024, up from 4.0%, and to 4.3% by December 2024, up from 4.2%.
  • Inflation forecasts signaled a return to the 2-3% range by December 2025.
  • The RBA revised inflation for June 2024 from 3.9% to 3.3% and from 3.5% to 3.2% for December 2024.

AUD/USD Reaction to the RBA Statements and Press Conference

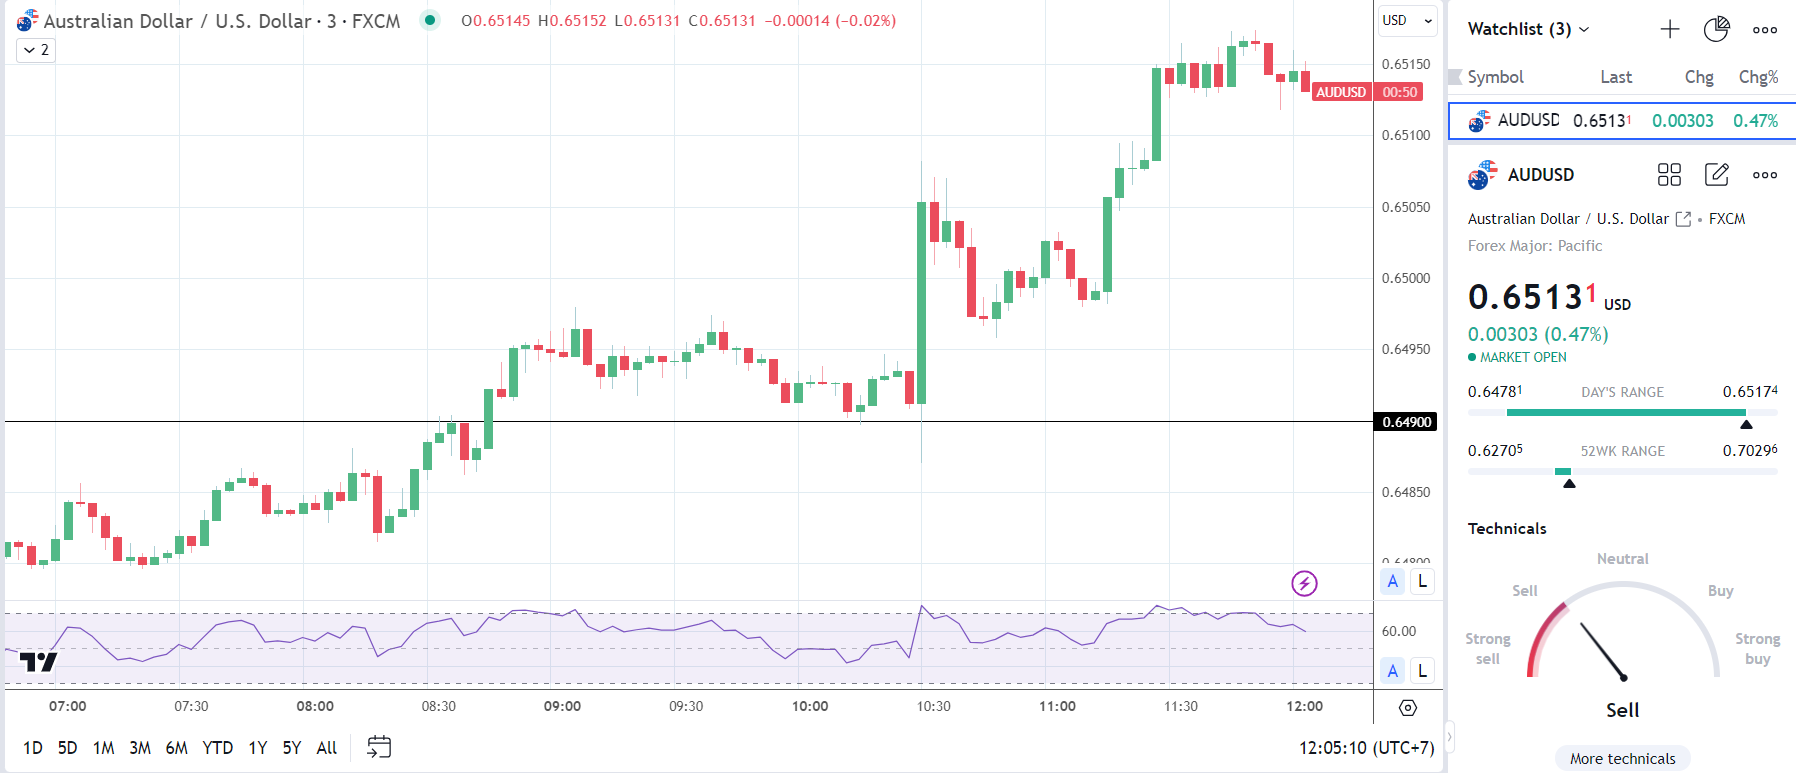
Before the statements and press conference, the AUD/USD fell to a low of $0.64781 before rising to a high of $0.65084.

However, in response to the statement and the press conference, the AUD/USD fell to a low of $0.64870 before rising to a high of $0.65174.

On Tuesday, the AUD/USD was up 0.47% to $0.65131.


RBA Press Conference


A Simple Guide to Diversifying your Stock Portfolio

A Simple Guide to Diversifying your Stock Portfolio

What is a diversified portfolio?

Diversification in a general sense is the broadening of a range of products. In finance, diversification of a portfolio is utilised to reduce the risk of exposure to one particular asset or event. In the case of stocks, portfolio diversification, this is achieved by incorporating different investments in terms of stock sectors, allocation amount, location, stock investment type and other assets.

Why is it important to diversify a stock portfolio?

It is important to diversify a stock portfolio to reduce the risk of being over exposed to one particular industry. This safeguards against “putting all your eggs in one basket.”Stock diversification is improved by holding some stocks that have a negative correlation with other held stocks. This results in a stock portfolio that manages risk and reduces the effect of market volatility. Although a portfolio may seem well diversified, it is never fully diversified even in terms of unsystematic risk.

Systematic and Unsystematic Risk

To fully understand why diversification is important, investors need to distinguish between systematic and unsystematic risk.

Systematic risk:

Systematic risk is the risk central to an entire market. This type of risk is commonly known as undiversifiable risk as it is impossible to completely evade. Systematic risk is volatile in nature making it difficult for companies to protect against. Examples of systematic risk include political events, war etc. Therefore, an individual company cannot control this type of risk.

Unsystematic risk:

Unsystematic risk is the risk associated with a specific company/stock. These types of risks can be controlled by the company and can be reduced through diversification techniques. Examples of unsystematic risk include competitors, business risk (internal operational or external legal factors) and financial risk (capital structure).

Unsystematic risk is what stock investors wish to diminish when diversifying their stock portfolios. If stock diversification is achieved, it is important to remember that the portfolio will still be subject/exposed to systematic or market-wide risk.

5 Ways to Diversify a Stock portfolio

1. By Sector

Stock sectors give investors the ability to spread risk throughout different industries. Being largely exposed to a single sector can be harmful to investors if this sector falls in value. Make sure to study each sector to gauge how they may fit into the overall financial goal of the portfolio as some industries can be spuriously correlated.

Risk-averse investors may look to add more safe haven stocks to give some downside protection during tumultuous market conditions, while risk-seeking investors may include a larger percentage of growth stocks to safe haven stocks. Still, it is important to keep in mind that even “safer” stocks may fall in a broader market downturn.

2. By Company size

Bringing in companies of different sizes (small, medium and large caps) is another popular way to diversify a stock portfolio. Generally, large-cap stocks are considered safer investments as opposed to small/mid-cap stocks, but smaller companies can offer intriguing growth opportunities.

3. Geographical

Geographical diversification can relate to stocks exposed to a specific country or location (financial, political etc.) With increasing globalization and market access, investors can invest in stocks that have exposure to other locations or countries. This can mean investing in the same stock market in a company that has dealings in other locations/countries or, gaining access to stocks in other stock markets around the world. Geographical investing has recently been made more accessible with the advent of exchange traded funds (ETFs).

4. Stock ETFs

In recent years, stock ETFs have become increasingly popular amongst investors. ETFs are a basket of stocks that is available to invest in through one investment vehicle. This makes it easier and often cheaper for investors to diversify without having to make multiple stock purchases. For example, the iShares Core S&P 500 ETF (IVV) is an ETF that tracks the S&P 500 index. Thus, an investor can gain exposure to the entire S&P 500 index through the purchase of a single IVV share.

5. Asset class

Incorporating other asset classes into an investment portfolio is another way to diversify. Typically, investors look to safer investment options such as bonds but this is not limited to bonds only as investors do venture into instruments such as commodities and forex. For example, gold is often viewed as a haven asset while currencies like the Japanese Yen and Swiss Franc are traditionally viewed as safer than their alternatives.

Stock Diversification Example

Below is an example of diversification during the coronavirus crash. This gives a practical situation whereby the coronavirus pandemic has affected global markets, and how stock investors may mitigate substantial losses.

Delta Air Lines vs Gilead Sciences:

delat air lines vs gilead sciences

The chart above shows an overlay of two stocks Delta Air Lines and Gilead Sciences respectively, prior and post to the coronavirus pandemic. The coronavirus pandemic spread worldwide which caused airline stocks to plummet on a global scale. While Delta was not the only airline stock to fall, it clearly highlights the adverse reaction in price.

Gilead Sciences on the other hand, is a pharmaceutical company conducting research into a coronavirus treatment. Prior to the World Health Organization (WHO) announcing coronavirus as a global pandemic, the two aforementioned stocks had mostly a positive correlation. After the announcement, it is clear from the chart that the two stocks moved in largely opposite directions (negative correlation). As a simplistic example, if these two stocks were the only stocks in the portfolio, this may have protected the investment from significant losses.

It is important to note that while this negative correlation is true in the single instance above, the two sectors may have a positive correlation overall.

The example shows how stocks from two different stock sectors can produce risk-adjusted returns in volatile situations.

Mistakes investors make when they diversify

1) Over diversifying

Stock investors often include too many stocks in the portfolio. Many studies have shown that excessive stock inclusions do not actually reduce risk after a certain number of stocks (+/- 30 stocks). This asymptote-like curve of risk vs number of stocks does not do ETFs and mutual funds any favors as these instruments often contain well over 30 stocks (see image below). Investors then choose to hold multiple ETFs and mutual funds thus multiplying this problem.

number of stocks vs riskiness of portfolio

Source: Study by Professors E.J Elton and M.J Gruber (NYU Stern)

2) Investing in negatively correlated stocks

Although this has been used in the example above, investors often intentionally try include stocks that do not rise and/or fall together. If the whole stock portfolio is managed in this manner, it is obvious to see that portfolio value gains are negated by the opposite movement of the diversified portion of the stock portfolio (see chart below). While extreme, the example below is purely meant to illustrate how a negatively correlated portfolio can eliminate portfolio value increases.

3) Simplified chart of perfect negative (-1) correlation:

negatively correlated stock diversification

4) Misjudging time of investment

Managing a diversified portfolio can seem straightforward in theory, but the time investment needed can be overwhelming for some investors. This often leads to mismanaged portfolios.

In extreme bear market circumstances, markets tend to fall as a whole. There is basically no escape from the decline, even with a ‘well diversified’ portfolio. Situations such as these can make the use of other asset classes crucial in warding off deeper losses.

Key Takeaways to Achieve a Diversified Stock Portfolio

In conclusion, investors need to fully realise their financial goals (term, risk etc.) and budget constraints prior to undertaking any form of investment. Once this is understood, investors may then look at diversification within their portfolio. To successfully diversify, the following points should be reflected on:

What is Crude Oil? A Trader’s Primer to Oil Trading

What is Crude Oil? A Trader’s Primer to Oil Trading

WHAT IS CRUDE OIL AND WHAT IS IT USED FOR?

Crude oil, or petroleum, is a naturally-occurring fossil fuel and currently the world’s primary energy source. It is made from ancient organic matter and can be distilled into component fuels such as gasoline, diesel, and lubricants, each of which have a multitude of industrial applications.

The commodity is usually extracted from underground reservoirs through drilling, and the countries that produce the greatest volume of crude oil, as of 2019, are the USA, Russia, and Saudi Arabia.

To understand how crude oil relates to other energy resources and assets, as well as how to trade them, visit our Major Commodities page.

BRENT AND WTI CRUDE OIL EXPLAINED

The composition of crude oil varies by source, but two types are used to benchmark global prices. They are the United States’ West Texas Intermediate (WTI) and United Kingdom’s Brent crude. The differences between them are based on factors such as composition, extraction location and prices, but for more details, as well as how to trade each asset, see our WTI vs Brent comparison.

POWER PLAYERS IN THE CRUDE OIL MARKET

The Organization for Petroleum Exporting Countries (OPEC) was established in 1960. This body sets production quotas for its members, with the aim of reducing competition and keeping prices at profitable levels. OPEC is dominated by Kuwait, Qatar, Saudi Arabia (which controls the Strait of Hormuz), and the United Arab Emirates. While OPEC generally controls a large percentage of the oil supply, the US, as of 2019, is the world’s largest producer of oil.

Institutions that supply oil to the global market are made up of international oil companies, or IOCs, such as ExxonMobil, BP and Royal Dutch Shell. These are investor-owned and look to increase shareholder value through private interests. However, national oil companies, or NOCs, such as Saudi Aramco and Gazprom, are fully or majority-owned by a national government.

For more about the power players and their role in global oil production, see our 8 Surprising Crude Oil facts.

 HISTORY OF CRUDE OIL

The history of crude oil has seen many changes since the beginning of the century, when global supply was largely controlled by OPEC, but demand was driven by the US. With OPEC calling the shots and Asian demand rising rapidly, prices went from a cost per barrel of $25 for Brent and $27 for WTI in March 2001, to $140 for both types by June 2008, representing a price bubble.

However, the last decade has seen technological advancements and deregulation facilitate increased US shale oil production, leading to shift in power from OPEC to the US. Prices fell from $112 for Brent and $105 for WTI in June 2014, to under $36 for both by January 2016. OPEC responded by colluding with several countries – including Russia – to implement ‘production quotas’ designed to stabilize prices. These brought the cost per barrel back above $70 for Brent, and $65 for WTI, by April 2018.

The below chart shows some key landmarks in the price of US Crude this century and the reasons for the swings.

WTI CRUDE OIL (2000-2019)

WHAT AFFECTS CRUDE OIL PRICES?

Crude oil prices are affected mostly by supply and demand, which in turn are influenced by factors such as outages, OPEC production cuts, seasonality, and changing consumption patterns. For more on these and why they are essential fundamental factors to understand when trading the asset, see our guide to trading crude oil.

USD AND THE PRICE OF OIL

The US Dollar and oil have historically had an inverse relationship. When USD is weak, the price of oil has traditionally been higher in dollar terms. Since the US was for long periods a net importer of oil, rising oil price has meant the US trade balance deficit has risen since more dollars are required to be sent abroad. However, some believe this relationship follows less reliable patterns in modern times.

There is a more predictable link between the Canadian Dollar and oil prices. For example, as of 2019, Canada exports some three million barrels of oil and petroleum products per day to the US, meaning a huge demand for Canadian dollars is created. If US demand rises, more oil is needed, which often means oil prices rise, and could accordingly mean a fall in USD/CAD. Conversely, if US demand falls, oil prices may fall too, meaning demand for CAD drops in turn.

Reasons to Trade Crude Oil

Oil is a dynamic, volatile and liquid market – and stands as the most traded commodity in the world. Here’s more on the benefits of engaging with this asset.

  1. The volatile nature of trading this asset makes it a favorite of swing and day traders, who react to the latest oil pricing news. While the trading can be risky, some see the oil market as an opportunity in its purest form.
  2. Crude oil is a liquid market, traded in huge volume. This means trades can be opened and closed at the price points you want and at lower trading cost.
  3. Oil can be traded as part of a hedging strategy to mitigate against the effects of the asset’s volatility.
  4. Trading oil can be part of a diversified portfolio of commodities, stocks and bonds.
The Relationship Between Interest Rates & Stock Prices

The Relationship Between Interest Rates & Stock Prices

The stock market often reacts quickly to interest rate changes – certainly more quickly than many other areas of the economy, which may take up to 12 months to catch up. This can mean many opportunities for traders who analyze stock markets, both when buying and holding or employing a shorter-term speculative approach.

Interest rates and stock prices are closely linked: In this article, we will discuss interest rates in general before moving on to explore the overall impact they can have on stocks, and how to incorporate this information into analysis.
What are interest rates and why do they change?

Put simply, interest is the cost of borrowing money. There are different types of interest rates that will affect the stock market – the main distinction is:

  • Bank rates: This is the rate at which banks lend to each other. It’s also the rate that directly influences the stock market. In the US, this is called the Fed Funds rate.
  • Consumer interest rates: These are the rates charged on loans for consumers, such as a mortgage, or car finance. They may be based on bank rates, but they are independent and do not have to reflect recent changes.

While these two types of interest rates are distinct from one another, they’re also closely linked. When banks are lending money more cheaply with a lower interest rate, this can be passed onto the consumer by lenders, keeping rates lower for borrowing as well. Traders are impacted by these interest rates because they can affect the price of stocks, causing them to move up or down.

What is the overall impact of interest rates?

Interest rates are set with the intention of having a particular impact on the economy. As a general rule:

  • Higher interest rates may slow economic growth. Borrowing becomes more expensive and there is more incentive to save money, so people may be encouraged to spend less.
  • Lower interest rates may boost economic growth. Borrowing becomes cheaper and there is less incentive to save money, so people may be encouraged to spend or invest.

Central banks will try to control these functions by setting bank rates (the target interest rate for banks lending money to other banks from their reserve balances) in an effort to keep inflation in check. A central mandate of the Federal Reserve Bank (the Fed) is to maintain stable prices and employment, chiefly through the control of interest rates.

Bookmark the Central Bank Calendar to stay up to date with interest rate announcements.

How do interest rates affect stocks?

There are two main ways in which stocks are affected by interest rates: directly and indirectly. Here is a summary of how businesses, and therefore stocks, are affected by changes to interest rates:

1. Businesses are directly affected by bank rates because they affect the amount a company can afford to borrow.When interest rates increase, it’s more expensive for companies to borrow capital. If spending decreases, growth slows down, and this can negatively impact earnings. When interest rates decrease, it’s cheaper for companies to borrow capital with the aim of achieving growth, and this may encourage stock prices to rise.

2. Businesses are indirectly affected because higher interest rates mean less disposable income in the wider economy. This means less spending on products and services, which can again impact revenues and earnings, potentially causing stock prices to fall. Conversely, when interest rates are lower and people are spending more freely, this can be good for business and help to push stock prices higher as the company experiences stronger growth rates.

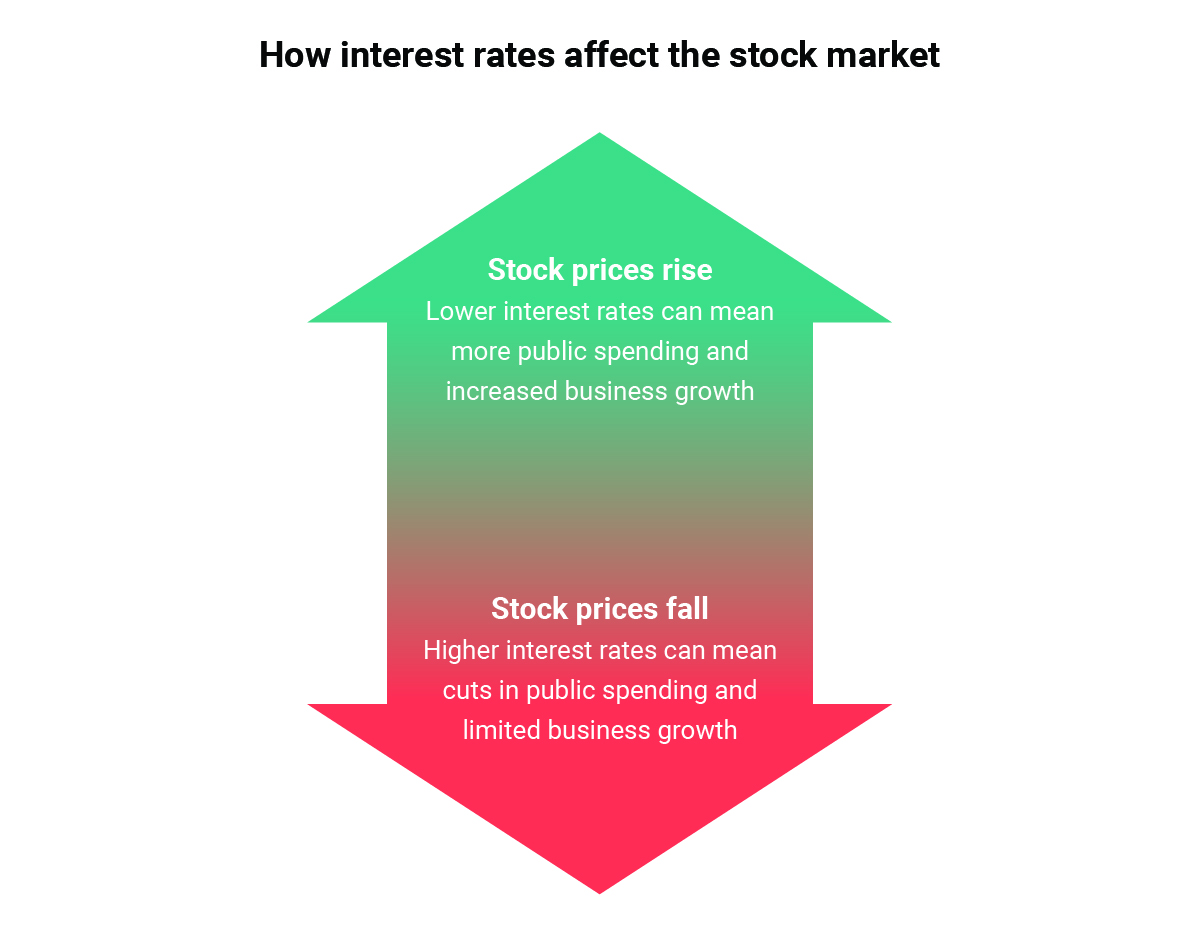
In the US, the Federal Open Market Committee (FOMC) sets the bank rate for the Fed, meeting eight times a year to confer on possible adjustments. Higher interest rates may mean lower stock prices, and lower interest rates may bring on higher stock prices.

Relationship between interest rates and stock prices

How to analyze stocks based on interest rate decisions

Changes to bank rates can cause volatility, which means there’s often opportunity to trade around the changing prices of stocks. If interest rates are higher and stock prices are falling, this could present opportunity for traders who think the price will ultimately rise again over time.

It also presents potential to speculate on the stock market via indices and prediction markets. When central banks are due to announce changes in interest rates, this in and of itself can cause volatility around the markets. As mentioned previously, the stock market is quick to react to changes in interest rates, so traders will often be making their projections ahead of major central bank announcements. Increases and decreases in demand from traders will contribute towards this volatility and can further create instability in the stock market around rate announcements.

In order to trade stocks around interest rates and upcoming interest rate decisions, traders need to be aware of the key economic dates in the calendar. This is when the significant volatility may occur in the stock market, so any stock trader will want to be aware of what’s happening, especially if speculating on short-term price movements. Check the DailyFX economic calendar to stay on top of potentially market-moving events.

Remember that volatility creates opportunity, but it also heightens risk, so it’s important that traders adhere closely to their risk management strategies and trading plan. This may help in the effort of mitigating losses when trading interest rate sensitive stocks, or volatile markets, around rate decisions.

Best stocks to analyze when interest rates fall

It may seem easier to find attractive stocks when interest rates fall because lower rates can lead to higher disposable income in an economy, along with potentially lower borrowing costs for companies. Some stocks that may embark on an bullish theme around these scenarios include:

  • Retail sector stocks: When people have more disposable income to spend thanks to lower interest rates, the retail sector may get a boost. This can be a good time to investigate stocks of retailers.
  • Utilities stocks: When interest rates are lower, this can be an attractive time to look into the potential of fairly steady dividend payments from utilities stocks. However, do be aware that rising interest rates can have a negative impact on utilities stocks.
  • Stocks listed on the S&P 500 index: This index measures stock performance of the 500 largest companies listed on US stock exchanges. If interest rate cuts affect the stock market, this can usually be tracked through the S&P 500 and traders can make buying or selling decisions based on this. Around the time of Federal Open Market Committee (FOMC) announcements, there can be significant volatility on S&P 500 stocks, signaling the potential for short-term trading opportunities.

Impact of Fed rate changes on the S&P 500

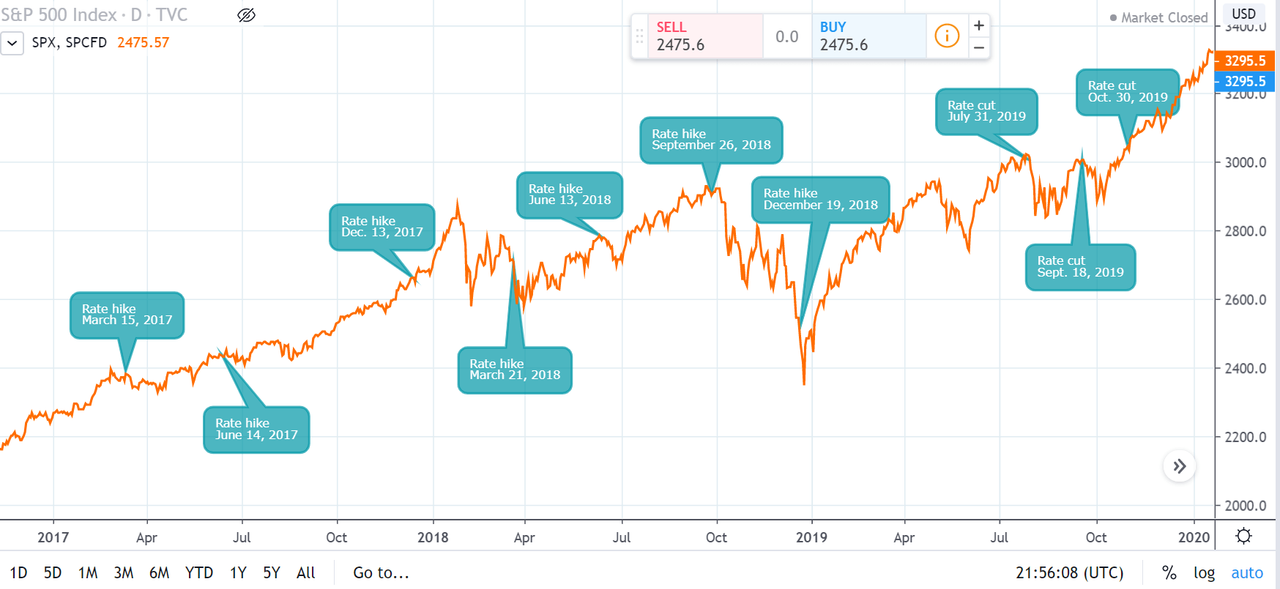
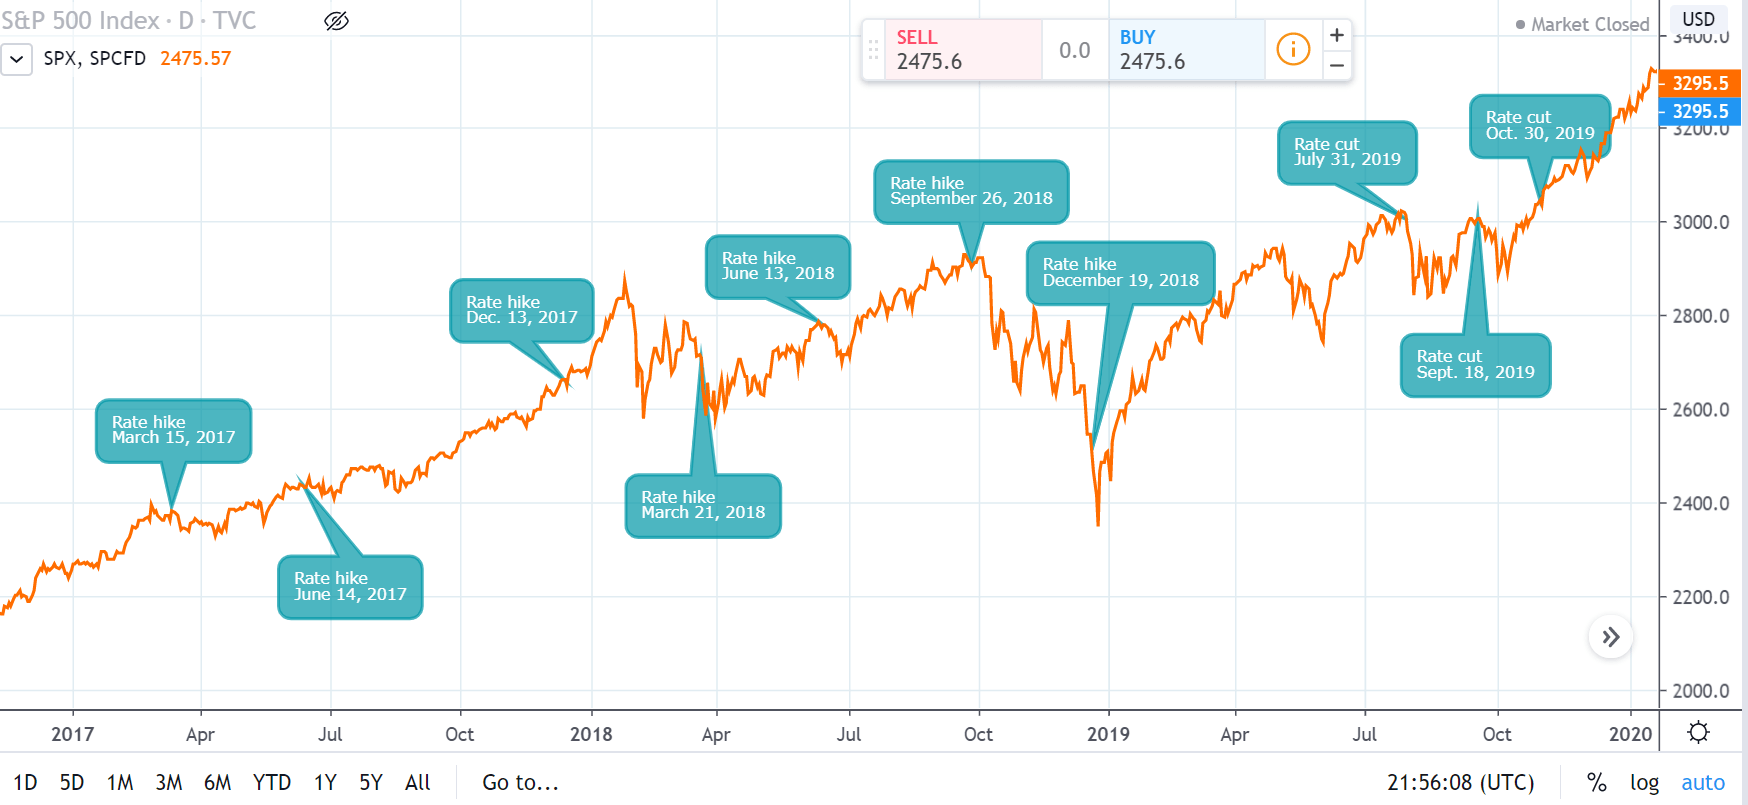
Impact of Fed interest rate changes on S&P 500 since 2017

This chart tracks the S&P 500, along with the dates that Fed rate cuts and hikes were announced over a three-year period. It’s apparent to see that trends are not always clear cut: following a quarter point rate hike in December 2017, the S&P 500 went on to defy expectations and climb almost 6% in January 2018.

The chart also shows there can be significant shifts in stock prices around the time of Federal Open Market Committee announcements. Ahead of the rate cut in October 2019, there was a period of significant volatility; after it was announced, the S&P 500 closed at a record high. It’s important to monitor news, be aware of economic events that could affect stock prices and build these into the trading plan.

Best stocks to analyze when interest rates rise

It may be more difficult to find attractive stock investment opportunities when there is an interest rate hike. However, the opportunities will often still be there, though they may require some added caution. These are some of the more attractive market segments to follow when interest rates rise:

  • Bank stocks: When interest rates rise, banks tend to make more in earnings from the higher rates that they can charge on loans, so their stock prices may rise in anticipation.
  • High dividend stock: These types of stocks can be attractive when interest rates are rising, driving investor demand up which can subsequently keep stock prices rising as well.
  • Highly liquid stocks: If interest rate rises bring on market volatility, an investor in a highly-liquid stock or ETF may have more flexibility with greater ability to maneuver out of the position without creating a large negative price impact.
Engulfing Formations for Price Action Trading

Engulfing Formations for Price Action Trading

Engulfing candlesticks are fairly simple to explain, it’s simply a candle that takes out the entirety of the prior candle. But, working with them can be a bit more difficult and new traders are seemingly perplexed by the formation so, we’ll dig into this topic in a little more depth in this article. We do have some additional materials available on the topic in DailyFX Education. We looked at bearish engulfing candlesticks and bullish engulfing in different articles and, in this piece, we’ll incorporate that formation into our broader price action education as these can be very actionable when they do show up.

The important takeaway is that the engulfing candlestick body must take out the entirety of the prior candlestick body – indicating a momentum-driven reversal.

Defining the Engulf

There are two types of engulfing patterns. The first and most common is an engulfing of the entire prior body. In FX or futures markets, where prices are streaming 24 hours a day, these are far more common as the end of one bar simply starts the next. This means that the prior candle’s close is this candle’s open, so if we’re going to see an engulfing formation take place, buyers will need to step in (in terms of a bullish engulf) to completely eclipse the move from the prior bar – and this bar still needs to close above the prior bar’s open.

The second brand of engulf is more rare but this would include a full engulf of the prior candle’s wicks. This would illustrate a wider range from the prior bar but, similarly, both show a possible shift in momentum.

Is one better than the other? That’s difficult to say as they both illustrate the same kind of thing but, the second engulf with full cover of the prior candle’s wicks does make a strong statement about an increasing rate of activity.

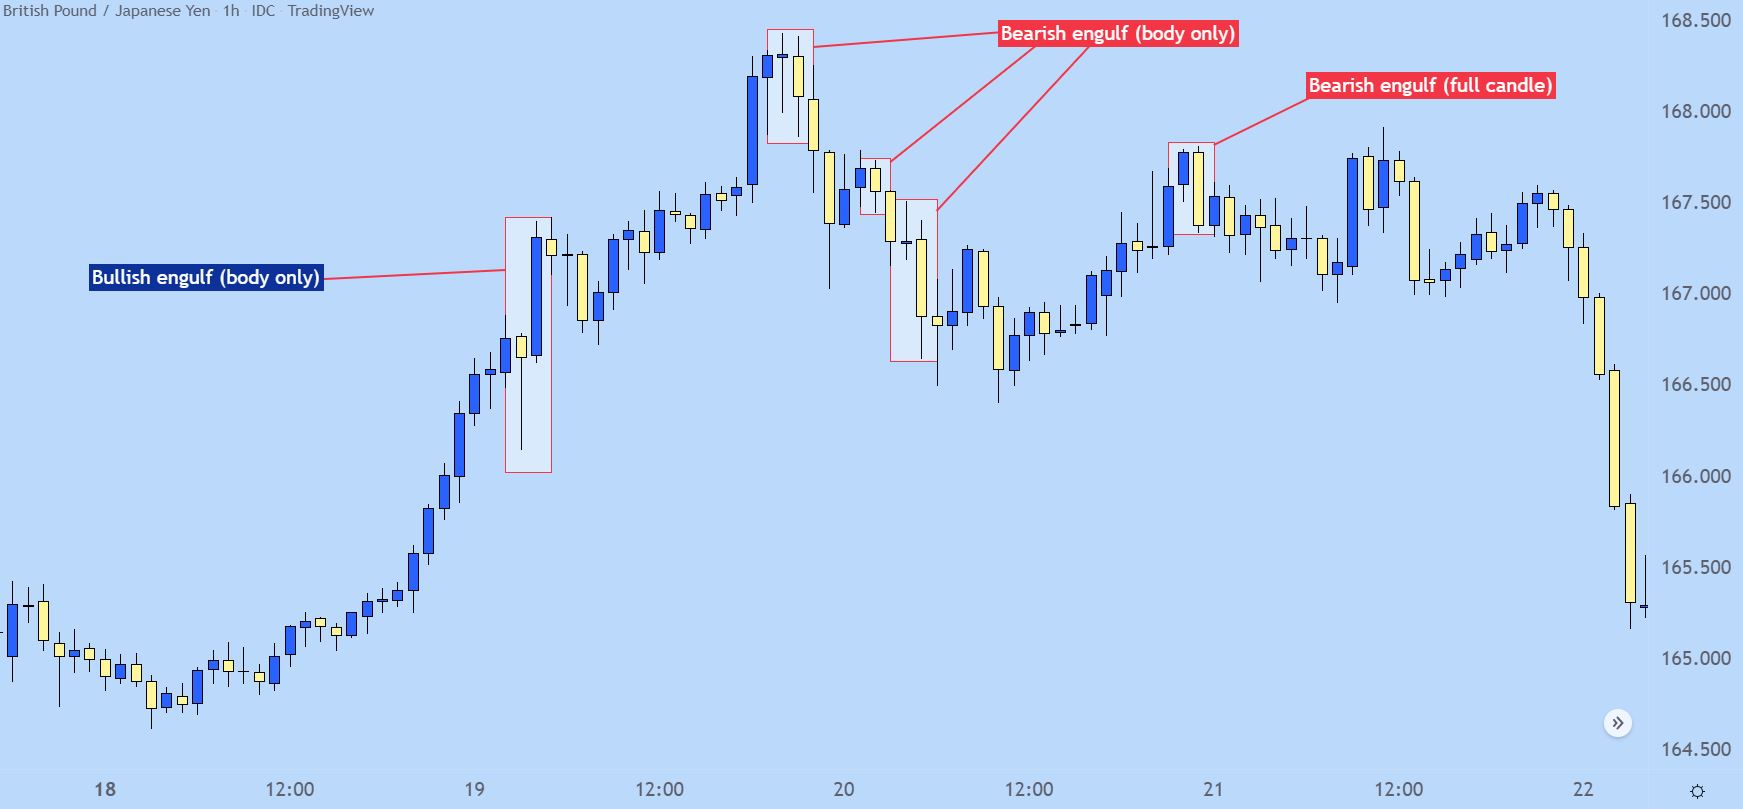
On the below hourly chart of GBP/JPY I’ve pointed out a handful of these patterns that appeared between April 17th and April 22nd, 2022. The engulf located on the far right of the chart is the only that was a full candle engulf, where even the wicks of the engulfing candlestick took out the prior bar’s entire range.

GBP/JPY Hourly Price Chart

Types of Engulfing Candlesticks

The engulfing candlestick says quite a bit and will often be approached with anticipation of something continuing to happen. There’s a few specific situations where this can come up as important, and I’ll look at a few of those below.

The Engulfing Reversal

Reversals are notoriously tough because, as traders, we’re basically saying ‘what’s been happening – is about to change.’ And by and large it’s often more advisable to follow the status quo, but when an engulfing candlestick shows up at the top of a trend that can be a big statement. And, it could also be a sign of what’s to come.

On the below GBP/JPY chart, I’m looking at a trend on the daily chart from Q4 of 2021. I’ve noted a few engulfs on the left side of the chart but the ‘reversal’ setup can be found towards the top of the below illustration, in red. At the time, the trend had jumped by more than 900 pips in the first three weeks of October, and then this bar showed up on the daily chart.

It wasn’t a full candle reversal, as only the body of this candle engulfed the prior candle’s body. This was a clear sign in shifting momentum that eventually played through for a really strong reversal. And, notably, the three engulfs that I pointed out before that reversal formation showed up – those also so continuation on the day after they had printed, further illustrating the potential for momentum to continue after one of these engulfing patterns print.

GBP/JPY Daily Price Chart (Sept -Dec 2021)

The ‘In Trend’ Engulf

Timing trends can be tricky. There’s been an observable bias so there’s a directional pull that you’d like to incorporate but, it seems that many have the same idea at the same time and this can keep trends from pulling back far enough to afford an attractive entry point. And – when the pullback does come about – how is the trader to know that it’s a pullback and not a reversal? What’s the proper way of timing re-entry in the trend-side direction?

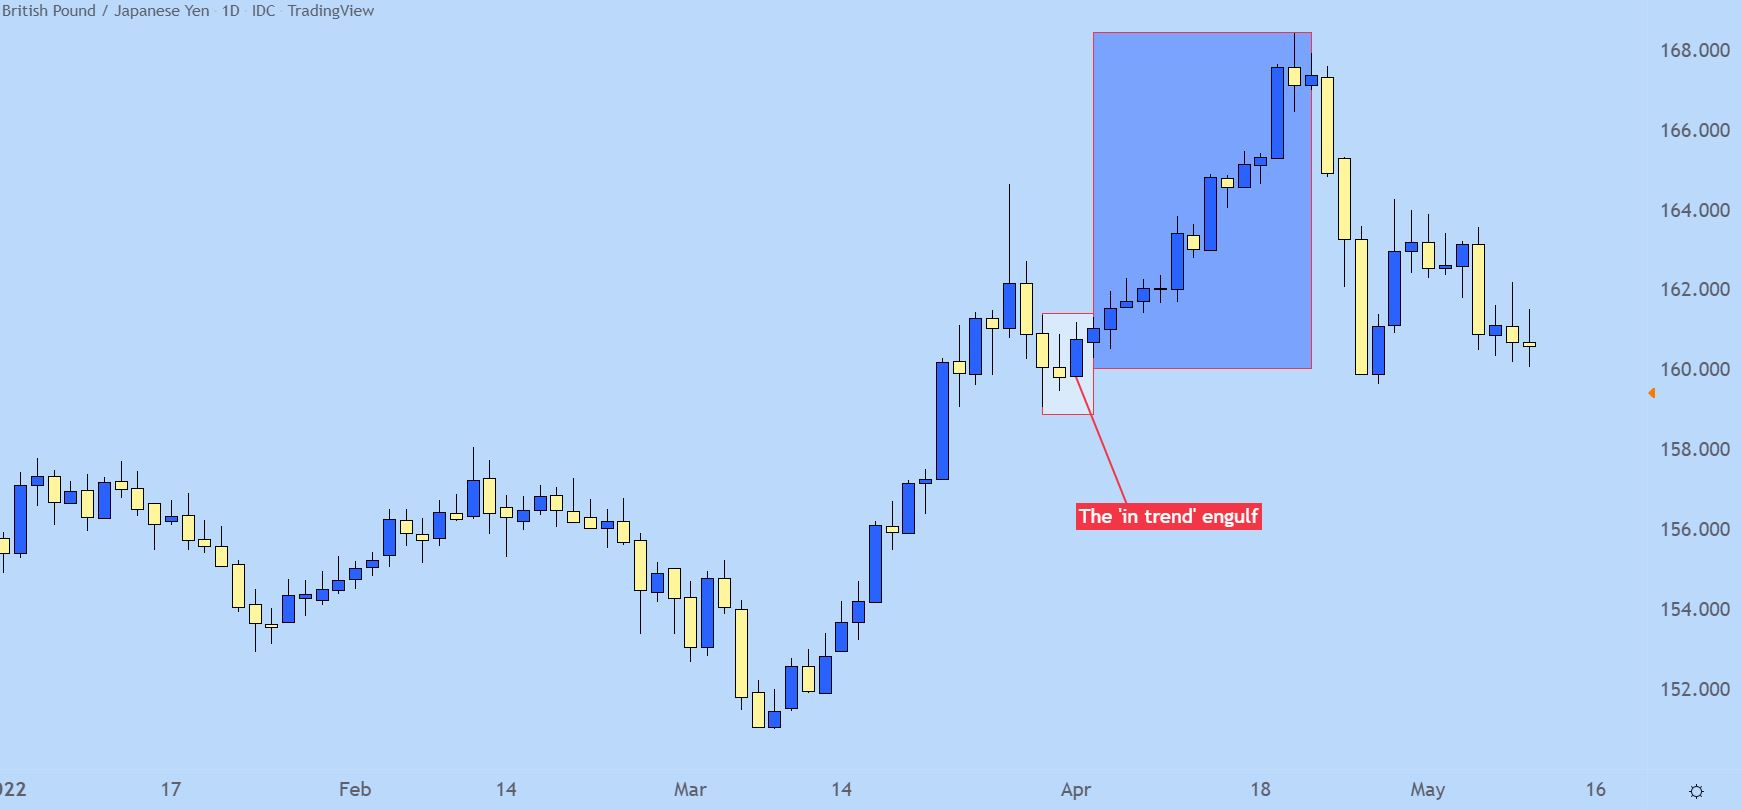
The ‘in trend’ engulfing candlestick can help with this. It’s basically looking for a pullback, followed by an engulf in the direction of the trend, thereby giving the idea that buyers are back and the trend may be ready to continue up to fresh highs.

GBP/JPY Daily Price Chart (2022 – May 2022)

The Counter Trend Engulf

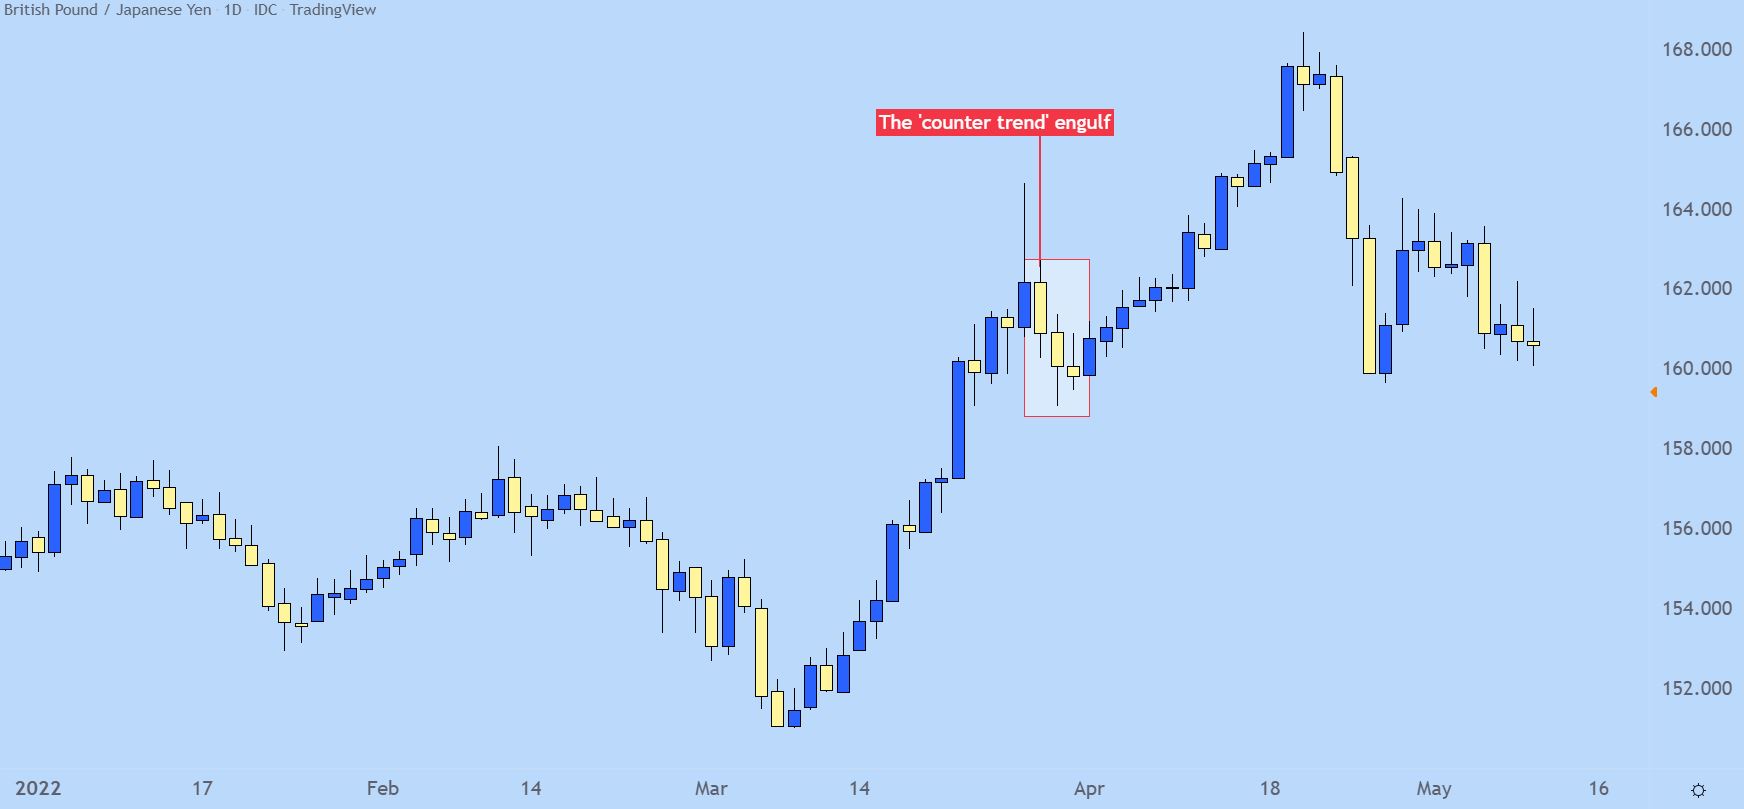
On that topic of trends – for traders looking to fade the move, engulfs can help there, as well. The essential logic would be waiting for an engulf to print in the opposing direction of the trend, which may turn into a bigger picture reversal.

Sure, not everyone will turn into a full-fledged reversal. But – it can help to open the door for reversal strategies and the momentum that can carry through such a formation will usually allow for some fast counter-trend movement.

GBP/JPY Daily Price Chart

Euro Weekly Forecast: Stagnant EU Growth Exposes Euro Vulnerabilities

Euro Weekly Forecast: Stagnant EU Growth Exposes Euro Vulnerabilities

Rampant NFP Data Pushes Back on US Rate Cut Hopes – Propping up USD

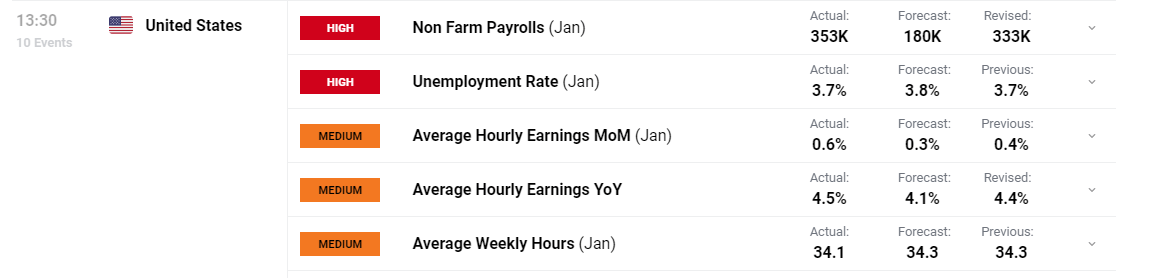
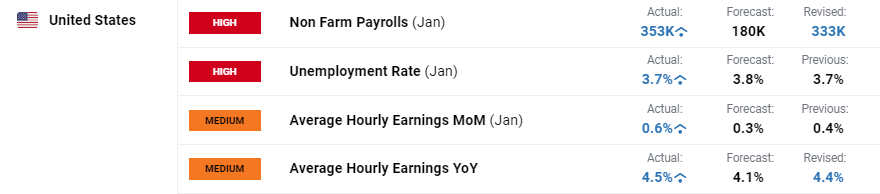
Nonfarm payroll data on Friday revealed a red-hot jobs market, revealing nearly twice as many jobs were added to the US economy in January than was originally anticipated. Not only that, but the December figure was revised much higher, from 216k to 333k, suggesting that January simply followed on from job gains over the holiday season.

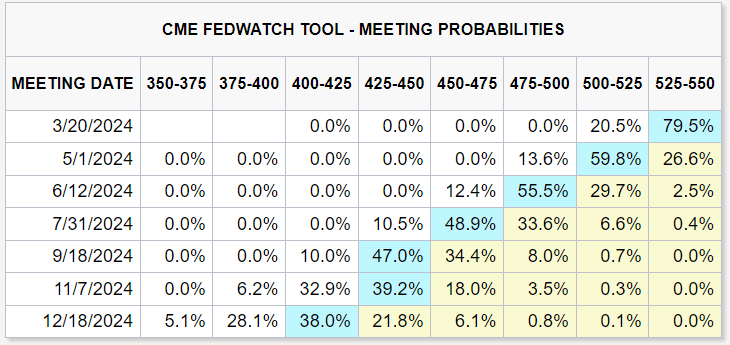
For the Fed, the monthly and yearly comparisons regarding wage growth rose to levels not seen since November 2022 and February 2023, respectively. This is likely to keep policy setters busy as they attempt to gauge the effect this may have in keeping inflation pressures lower on a consistent basis. Markets on Friday already lowered the likelihood of the first rate cut in March from 38% (yesterday) to 20.5% late on Friday (GMT). The probability stood at 46.2% a week ago. The US dollar rose sharply on Friday after markets acknowledged that the Fed may have to keep rates higher for longer and delay that much anticipated interest rate cut.

image1.png

EUR/USD Notches up Fourth Weekly Decline in a Row: Bearish

The EUR/USD weekly chart built on existing bearish momentum, taking the pair below 1.0830 with relative ease, approaching the 38.2% Fibonacci retracement at 1.0764 before potentially making a move towards 1.0700.

With a notable stepdown in ‘high importance’ economic data this week apart from the ISM services PMI print, the Friday momentum is likely to trickle into the coming week, pushing EUR/USD lower.

image2.pngElevate your trading skills and gain a competitive edge. Get your hands on the Euro Q1 outlook today for exclusive insights into key market catalysts that should be on every trader’s radar:

 The EUR/USD daily chart shows the recent decline and how price action grappled with the 200-day simple moving average (SMA). A Friday close does not rule out another test of the key, trend indicator especially as price approaches a notable zone of support – the confluence of channel support and the 38.2% Fib level – where the inability to drop further may see a temporary reprieve. However, assessing the fundamental differences in the US and EU currently, alongside the longer-term bearish posture of the pair, provides a bearish weekly bias for EUR/USD

EUR/USD Daily Chart

image3.png

EUR/GBP Attempts to Halt the Decline at Support Zone: Neutral

On Thursday this week, the Bank of England (BoE) surprised many with a three-way vote split between cutting, holding, or hiking interest rates. Two of the prior three hawks remain in favour of another 25-basis point hike, while known dove Swati Dhingra signalled her preference for a rate cut.

The Bank of England revealed a lot of information this week after releasing its updated forecasts which shows inflation dropping to the 2% target by the end of the second quarter this year instead of at the end of next year as forecasted back in November. This brings rate cuts closer in theory, but signs of inflation remain in the services sector and private sector wages are still elevated, although, both are expected to moderate over time.

EUR/GBP nevertheless nestled around the major zone of support (0.8515) late on Friday, failing to extend the recent selloff. The zone has provided stern support but given the euro’s fundamental frailties, could still give way next week. In the same breath, if the support zone continues to hold as it has already this week, EUR/GBP may benefit from temporary relief with the prior swing low 0f 0.8550 the first hurdle to overcome or bulls. The above substantiates the neutral weekly bias for EUR/GBP.

EUR/GBP Daily Chart

image4.png

EUR/JPY Provides a Technical Clue Ahead of Trading Next Week

EUR/JPY came under pressure after the Bank of Japan (BoJ) Governor mentioned that the likelihood of reaching the 2% target is gradually rising – stoking optimism that the Bank will step away from its current negative interest rate policy and hike into positive territory at some point this year.

The bearish momentum capitulated before the pair could even test the major pivot level of 157.90. The level witnessed pivots in June and July, as well as December and once again repelled prices upon approach. The 50-day SMA (blue line) provides dynamic support on a closing basis and the last three daily candles combine to provide a morning star pattern.

It must be noted that the bullish candle (third candle) is larger than a textbook image of the bullish candles stick pattern would suggest but prior versions of the pattern (highlighted in purple) have led to some extended moves to the upside after an immediate pullback.

EUR/JPY bulls may be eying 161.87 as a level of consideration after any shorter-term pullback plays out. The first hurdle for bears is the 50-day SMA followed by the 157.93 level of significance. The bullish candlestick pattern and its prior success, helps to inform the EUR/JPY weekly bullish bias.

EUR/JPY Daily Chart

image5.png

Gold Weekly Forecast – XAU/USD Testing Support After US NFPs Hammer Rate Expectations

Gold Weekly Forecast – XAU/USD Testing Support After US NFPs Hammer Rate Expectations

The January US Jobs Report surprised the market on Friday as 353k new jobs were added compared to forecasts of 180k. In addition, the December number was revised sharply higher, from 216k to 333k, while average hourly earnings y/y rose to 4.5% from an upwardly revised 4.4% and a forecast of 4.1%. The US labor market remains robust and will allow the Fed more breathing room to study inflation data over the coming weeks before they decide when they will start reducing borrowing costs. A March rate cut, widely forecast over the past few weeks, is now looking increasingly unlikely, while a total of 125 basis points of cuts is now seen in 2024, down from around 150 basis points at the start of the year.

image1.png

After a week of heavyweight economic data releases and events, not to mention earnings from five of the Mag 7 tech stocks, the week ahead is altogether calmer with little on the docket to steer risk sentiment. We can expect a fresh round of Federal Reserve commentary now that the FOMC blackout period has passed.

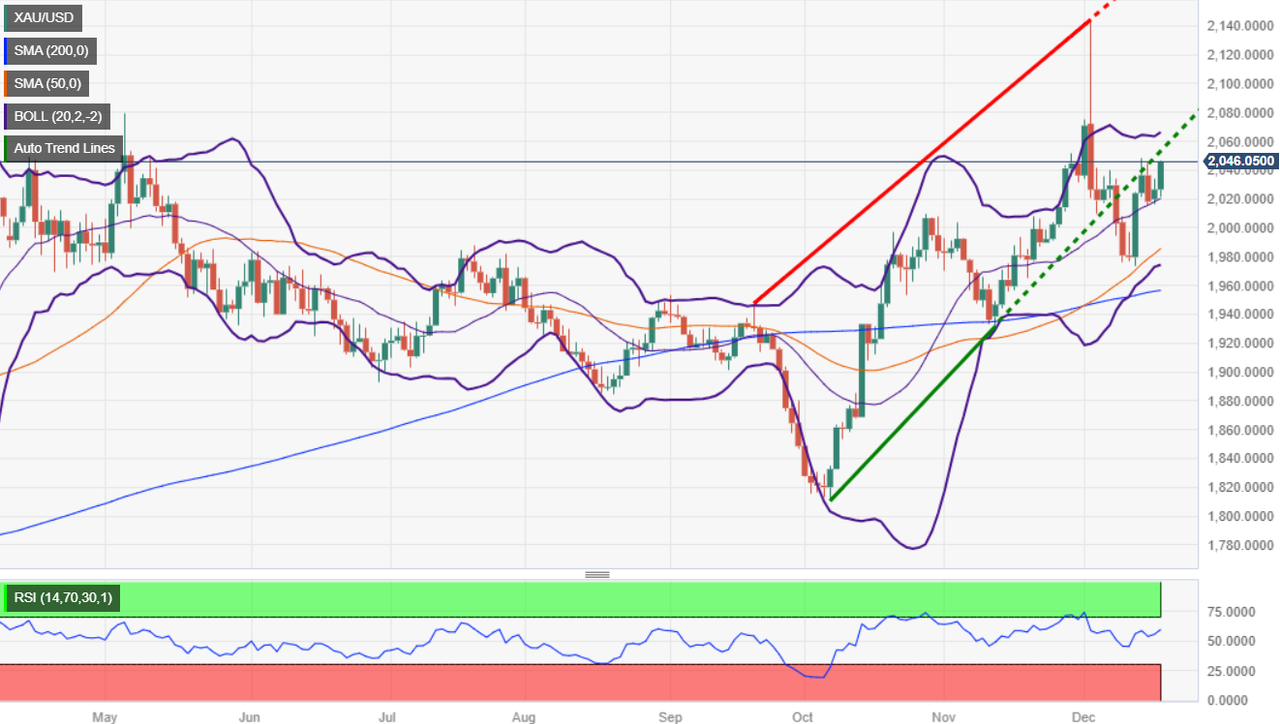
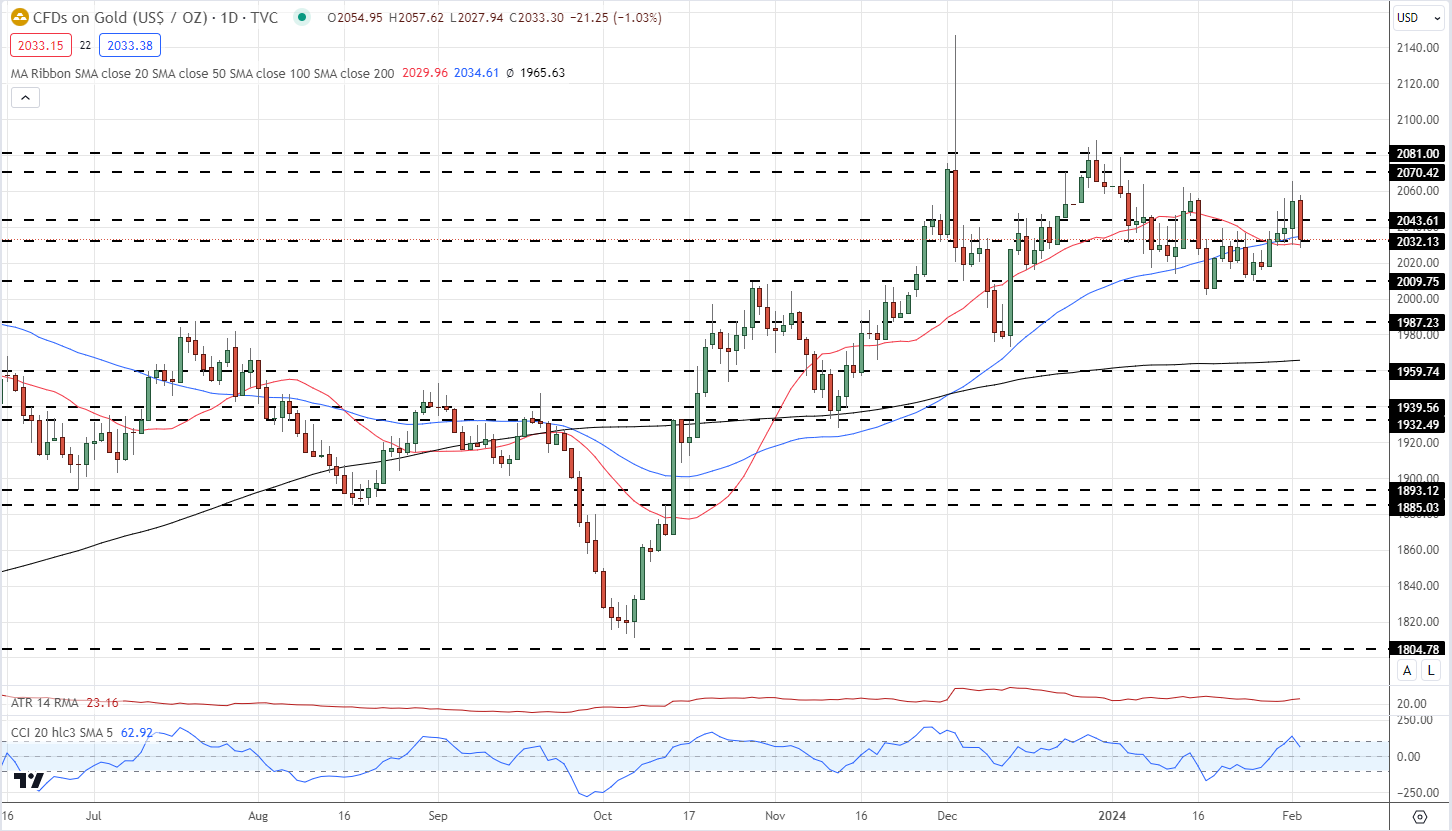
With US rates now looking to stay untouched for longer than previously forecast, non-interest-bearing gold will struggle to move higher in the short-term. The precious metal may receive a haven boost from any heightening of tensions in the Middle East, but the interest rate backdrop will remain the dominant driver.

Gold is testing prior horizontal support around $2,033/0z. and both the 20- and 50-day simple moving averages. A short-term series of higher lows has been broken and unless buyers step in, the precious metal will likely test support around $2,010/oz. and then $2,000/oz. The upside looks limited in the coming days with recent prior highs up to $2,065/oz. likely to prove difficult to break.

Gold Daily Price Chart

image2.png

Retail trader data show 53.76% of traders are net-long with the ratio of traders long to short at 1.16 to 1.The number of traders’ net long is 6.08% lower than yesterday and 12.28% lower than last week, while the number of traders’ net short is 26.89% higher than yesterday and 18.84% higher than last week.

We typically take a contrarian view to crowd sentiment, and the fact traders are net-long suggests Gold prices may continue to fall.


US Dollar Forecast: Bulls Return as Bears Bail; Setups on EUR/USD, USD/JPY, AUD/USD

US Dollar Forecast: Bulls Return as Bears Bail; Setups on EUR/USD, USD/JPY, AUD/USD

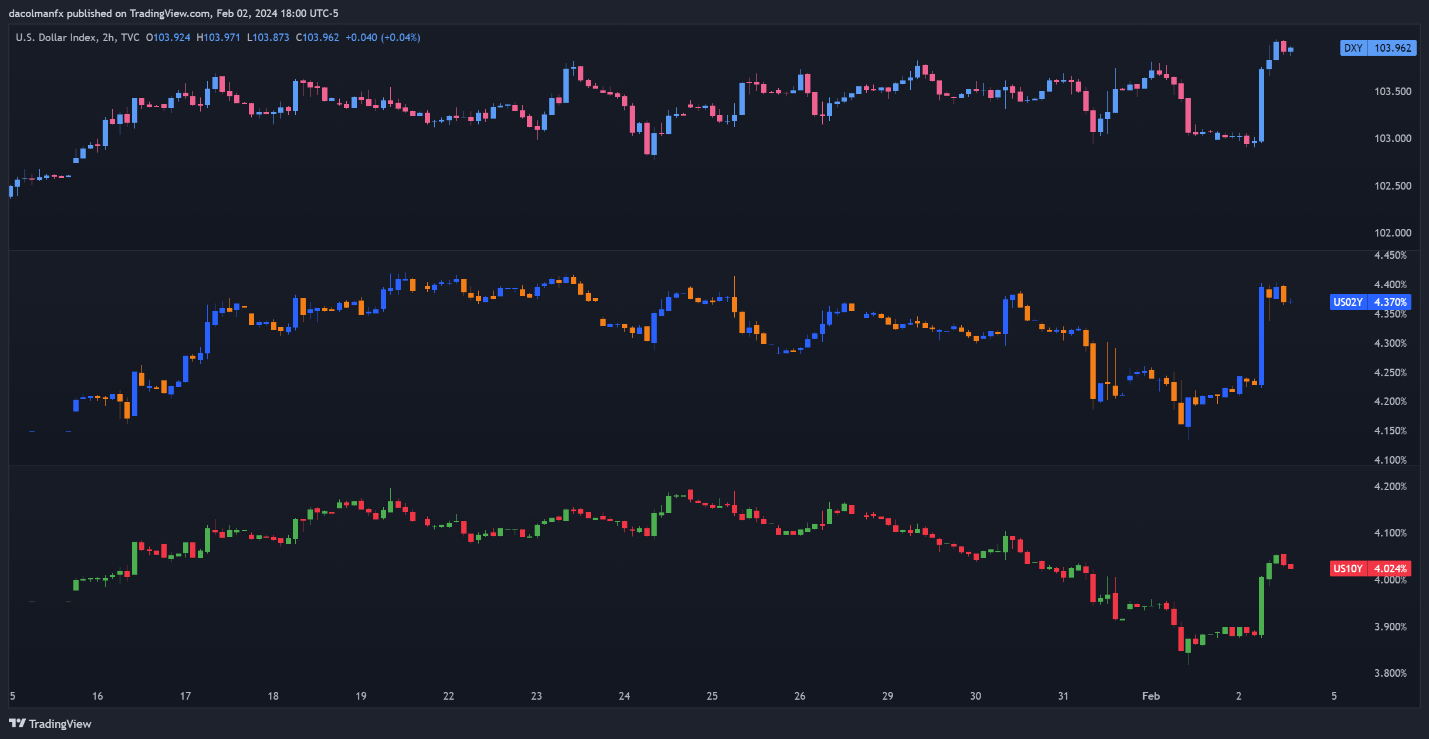
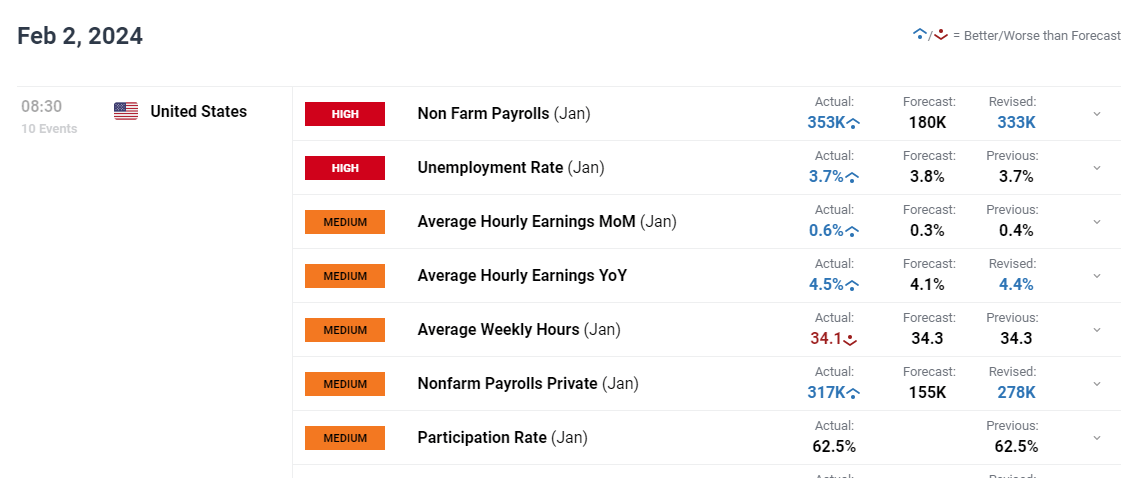
The US dollar, as measured by the DXY index, blasted higher on Friday after the U.S. jobs report revealed that U.S. employers added 353,000 workers in January, nearly double Wall Street consensus estimates. Average hourly earnings also surprised to the upside, with the year-over-year reading clocking in at 4.5% versus 4.1% expected – a sign that wages are reaccelerating (a possible headache for the FOMC).

US DOLLAR AND YIELDS PERFORMANCE

image1.png

US LABOR MARKET DATA

image2.png

Solid job creation, coupled with red-hot pay growth, indicates that the American economy is holding up remarkably well and may even have picked up momentum at the outset of the new year, a situation that could delay the start of the Fed’s easing cycle and limit the number of rate cuts once the process gets underway. The chart below shows FOMC interest rate probabilities following the latest NFP report.

Wondering about the U.S. dollar’s technical and fundamental outlook? Gain clarity with our latest forecast. Download a free copy now!

image3.png

ith the U.S. labor market still firing on all cylinders, policymakers will be reluctant to move off their restrictive stance anytime soon for fear that a premature rate cut could complicate their fight against inflation. Against this backdrop, we could see U.S. Treasury yields push higher in the coming days and weeks, creating a constructive environment for the U.S. dollar.

In the following section, we will set fundamentals aside and examine the technical outlook for three major U.S. dollar pairs: EUR/USD, USD/JPY and AUD/USD. In the analysis, we will dissect important price thresholds that could act as support or resistance, information that every forex trader should have on their radar for the upcoming trading sessions.

For a comprehensive analysis of the euro’s medium-term prospects, make sure to download our Q1 trading forecast today. It is totally free!

EUR/USD TECHNICAL ANALYSIS

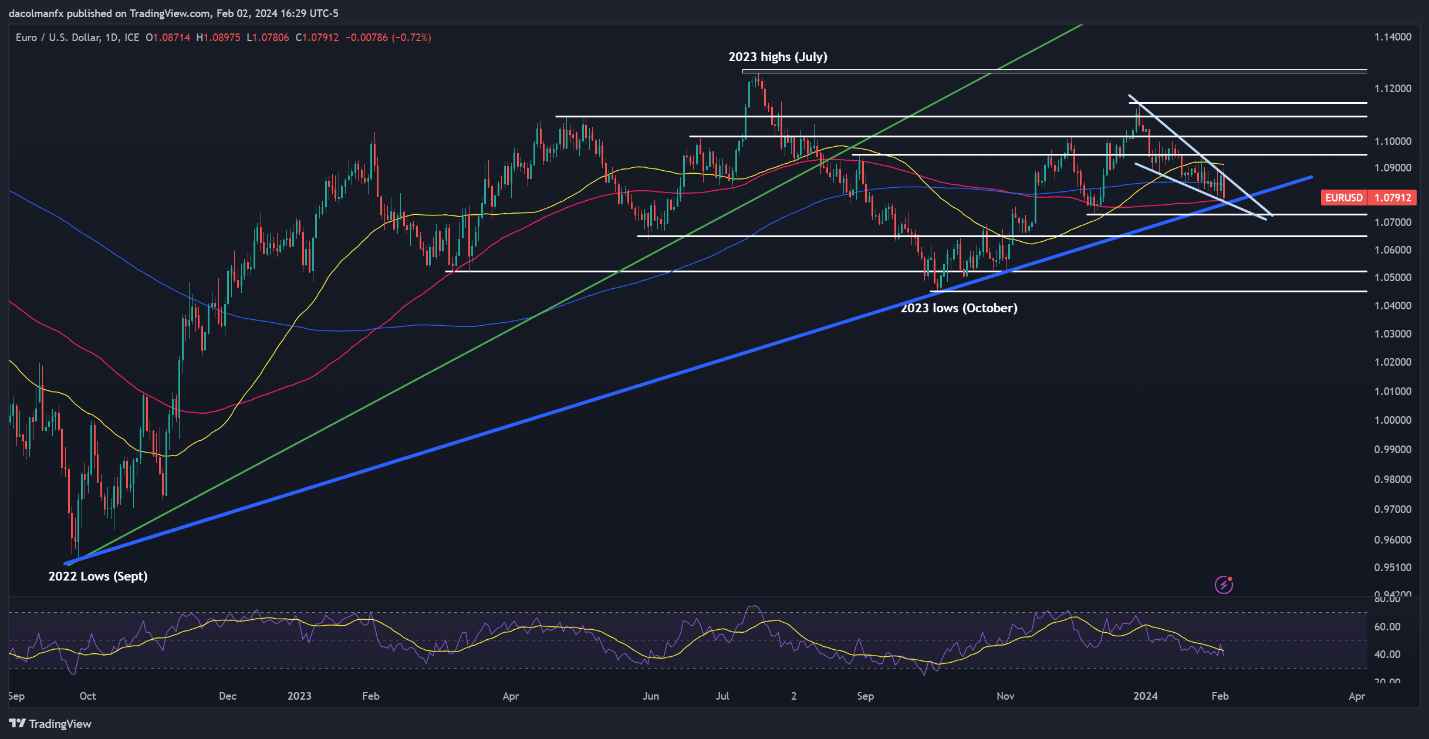
EUR/USD nearly broke the upper boundary of a falling wedge but reversed lower heading into the weekend following strong U.S. data, with prices tumbling towards cluster support at 1.0780. This area must hold at all costs; failure to do so could result in a drop towards 1.0730, followed by 1.0650.

In the event of a bullish turnaround from current levels, overhead resistance stretches from 1.0840 to 1.0860. Moving beyond this range, FX traders are likely to shift their attention towards the 50-day simple moving average at 1.0915 and 1.0950 thereafter.

EUR/USD TECHNICAL ANALYSIS CHART

A screen shot of a graph  Description automatically generated

Interested in learning how retail positioning can offer clues about USD/JPY’s short-term direction? Our sentiment guide has all the answers you seek. Get the complimentary guide now!

USD/JPY TECHNICAL ANALYSIS

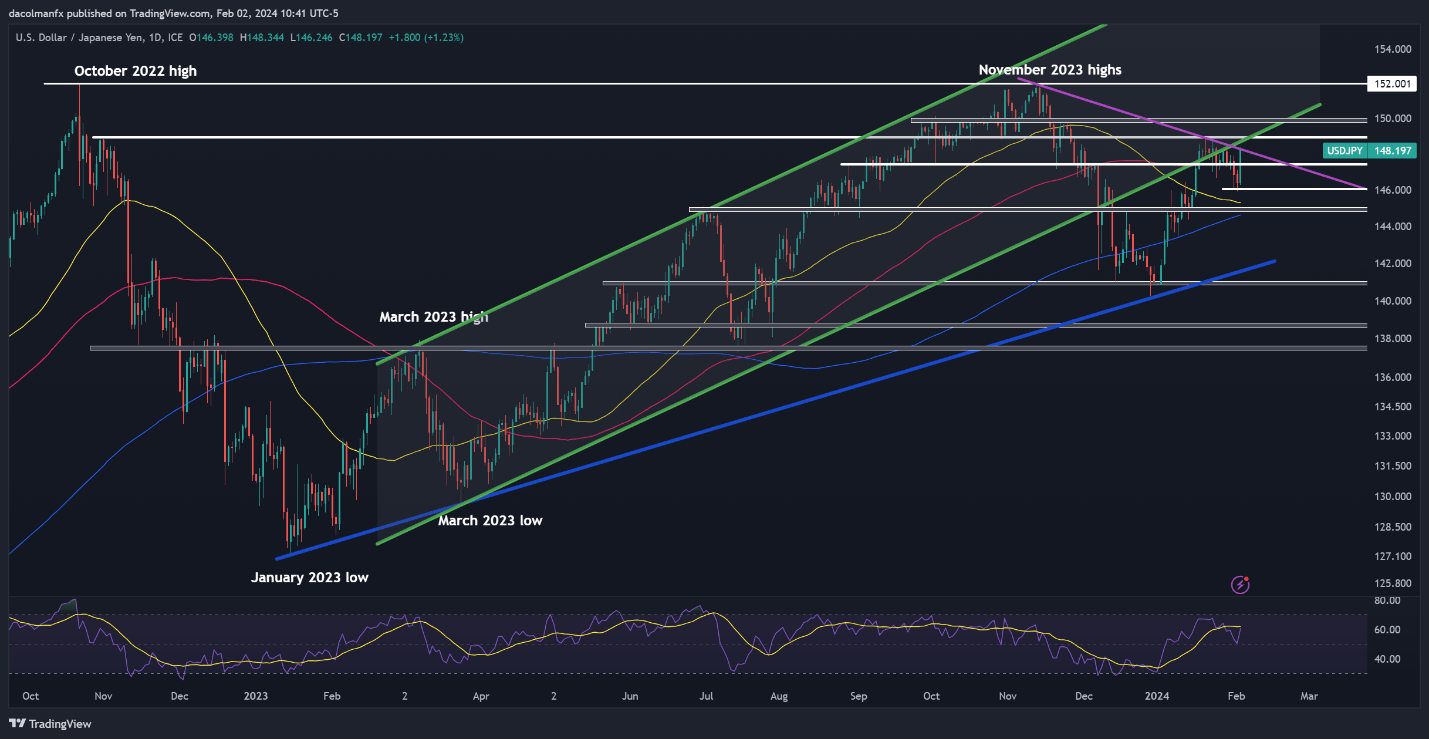
USD/JPY broke above key tech levels on Friday, but stopped short of clearing trendline resistance at 148.35. With the bulls back in control of the market, however, this ceiling could be breached any day now. When that happens, we could see a move towards 148.90 and 150.00 in case of further strength.

On the other hand, if sellers regain the upper hand and manage to spark a bearish reversal, traders should keep an eye on the 100-day simple moving average at 147.40. Below this area, the next support zone to watch appears at 146.00 ahead of 145.30, which corresponds to the 50-day simple moving average.

USD/JPY TECHNICAL CHART

image5.png

Explore the impact of crowd mentality on FX trading dynamics. Download our sentiment guide to understand how market positioning can offer clues about AUD/USD’s trajectory.

AUD/USD TECHNICAL ANALYSIS

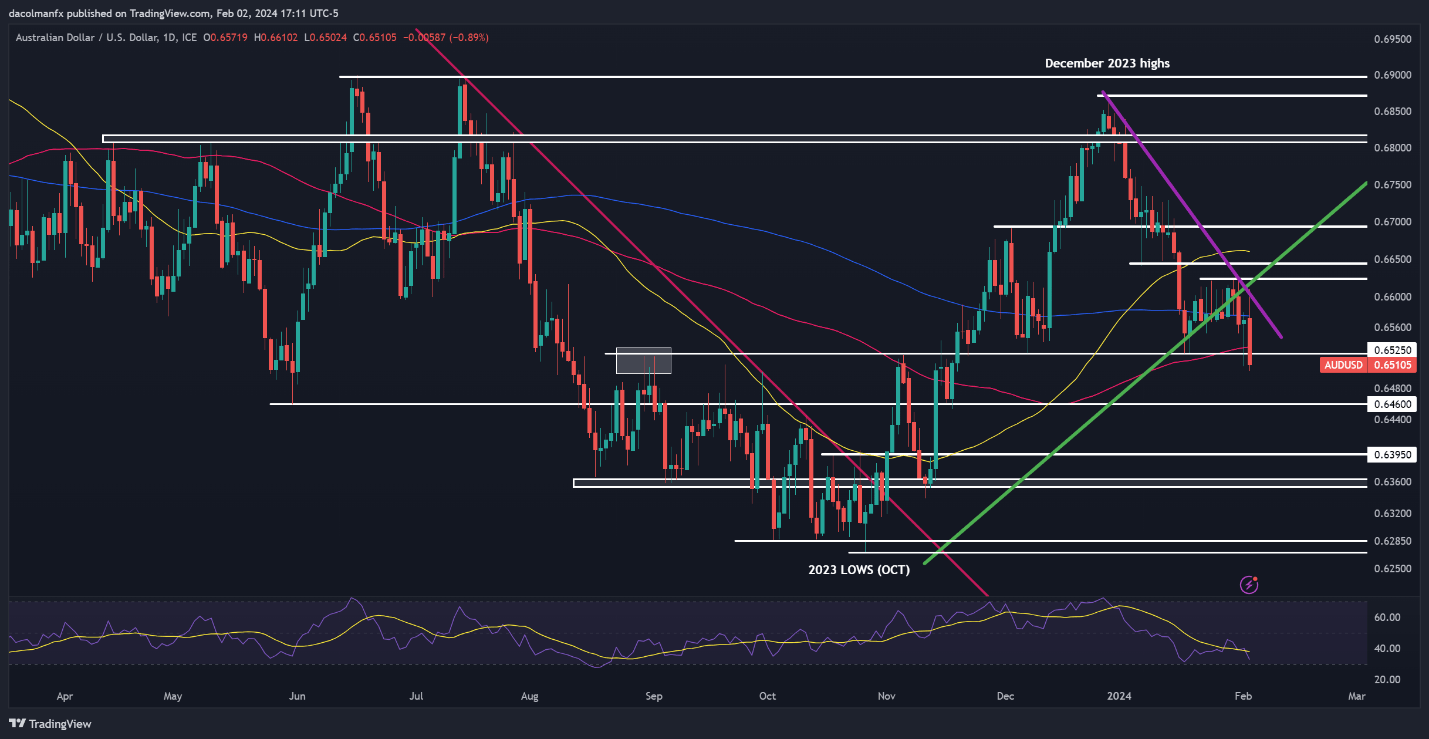
AUD/USD plummeted on Friday, piercing an important support region at 0.6525 and closing the week below it – a negative technical signal for the pair. If the downward momentum persists in the coming trading sessions, the next line of defense against a bearish attack emerges at 0.6460, followed by 0.6395.

Conversely, if market sentiment improves and the Australian dollar stages a turnaround, resistance looms at 0.6525, followed by 0.6575/0.6600. The bulls will have a hard time pushing prices above this barrier, but if they manage to do it successfully, we can’t rule out a revisit of the 0.6625 region.

AUD/USD TECHNICAL CHART

A screenshot of a computer screen  Description automatically generated

US Dollar Forecast: DXY Slips 0.80%, Eyes on NFP Impact on EUR/USD and GBP/USD

US Dollar Forecast: DXY Slips 0.80%, Eyes on NFP Impact on EUR/USD and GBP/USD

Dollar Index Dips as NFP Looms: A Critical Juncture for USD

The US Dollar has experienced a significant retreat, with the Dollar Index sliding approximately 0.80% from the previous day, pushing it below the 103 mark. The US Unemployment Claims edged up to 224K, surpassing expectations and previous figures, while the ISM Manufacturing PMI showed a slight improvement to 49.1, still indicating contraction. The ISM Manufacturing Prices also rose to 52.9, suggesting increasing costs in the sector.

Events Ahead

Looking ahead, forecasts indicate Average Hourly Earnings may see a slight deceleration to 0.3% month-over-month, while Non-Farm Employment Change is expected to dip to 187K from 216K.

Additionally, the Unemployment Rate is anticipated to increase marginally to 3.8%. The Revised University of Michigan Consumer Sentiment Index is also on the horizon, with expectations set at 78.9, slightly above the previous figure.

This upcoming data presents a pivotal moment for the US Dollar, offering potential insights into wage inflation, job market health, and consumer sentiment—factors critical to understanding the Federal Reserve’s next moves and the broader economic outlook.

US Dollar Index (DXY)

Dollar Index

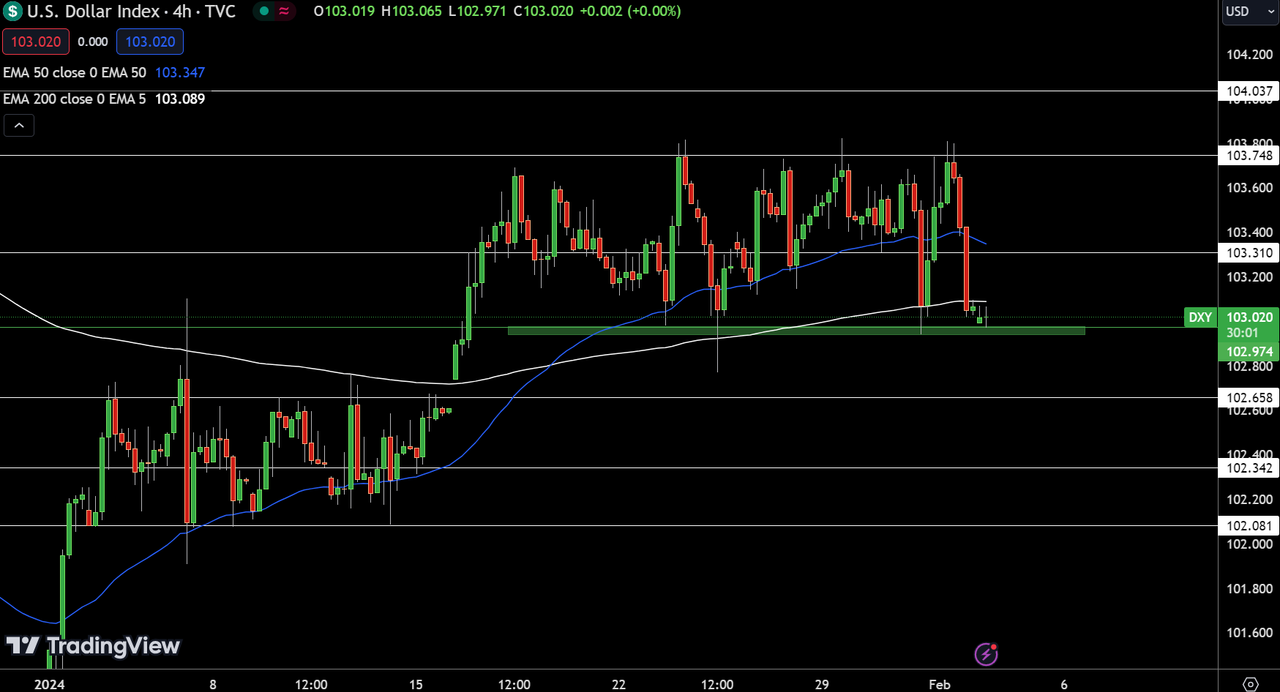
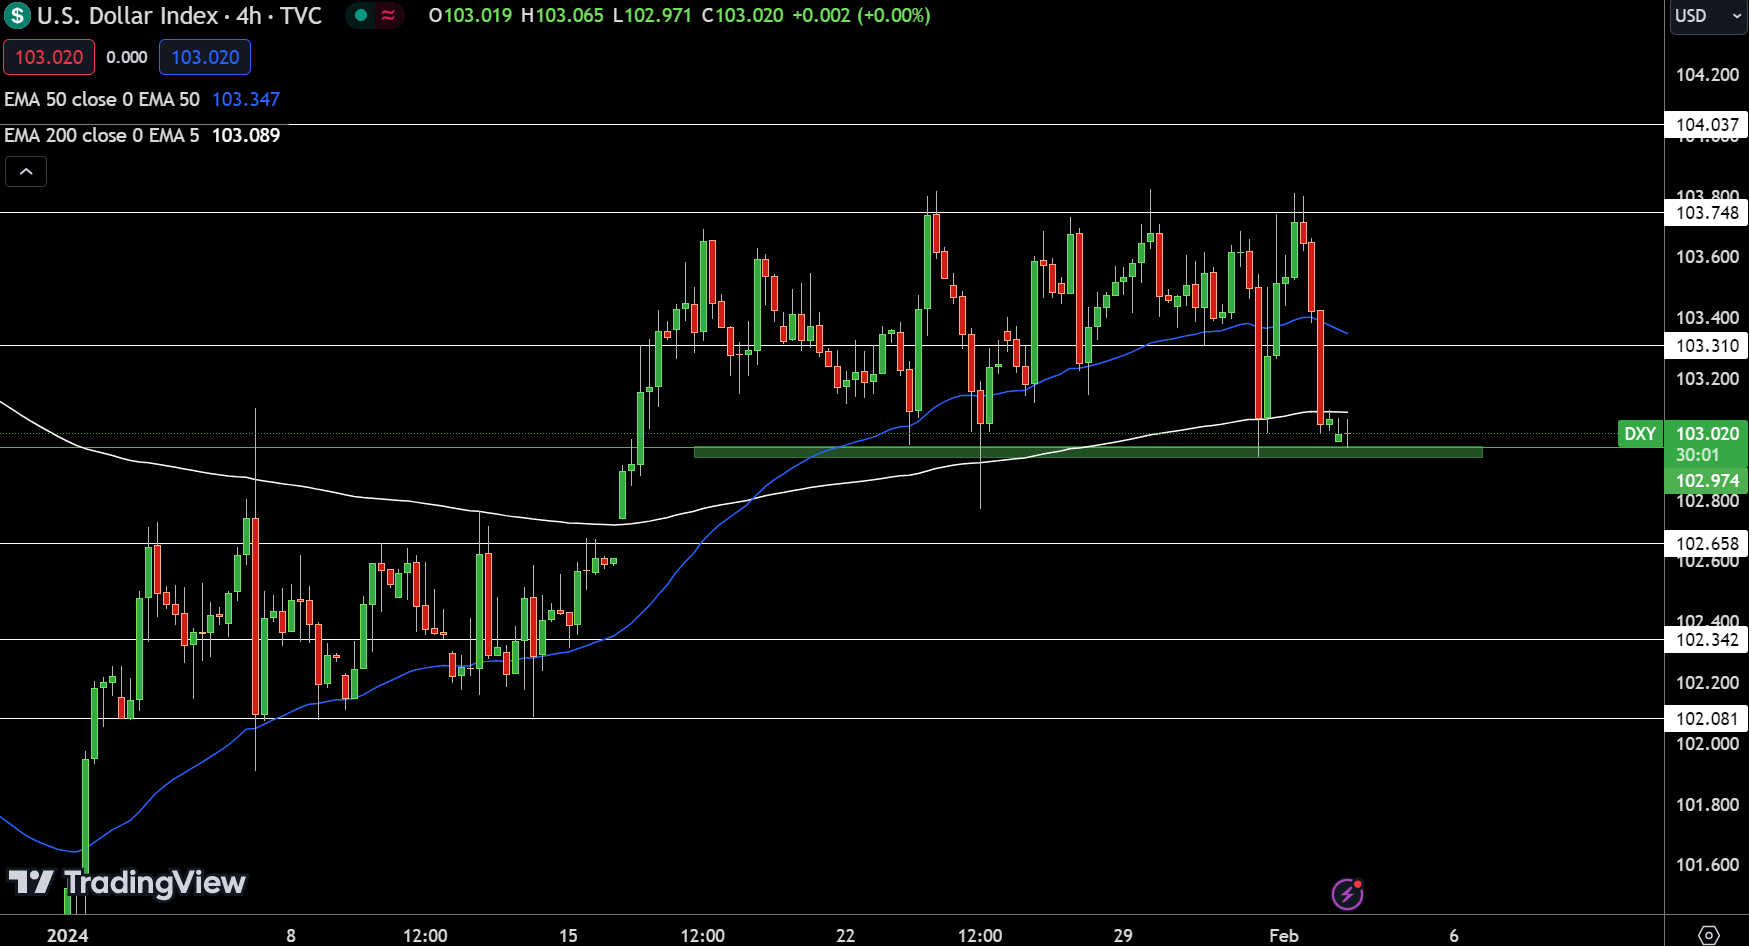
Dollar IndexThe Dollar Index is hovering around a pivot point of 102.974, faces immediate resistance levels at 103.310, 103.748, and 104.037, while support is found at 102.658, 102.342, and 102.081.

The 50-day Exponential Moving Average (EMA) at 103.347 and the 200-day EMA at 103.089 hint at a prevailing downtrend, yet the formation of a doji candle near the pivot suggests potential exhaustion of bearish momentum.

This technical setup indicates a critical juncture; a movement above 102.974 could signal a bullish correction, whereas a dip below this level may reinforce the downtrend.

The Dollar Index’s direction is contingent on its stance relative to 102.974, with a bullish outlook above this threshold and a bearish perspective if it falls below.

EUR/USD Technical Forecast

EUR/USD Price Chart - Source: Tradingview

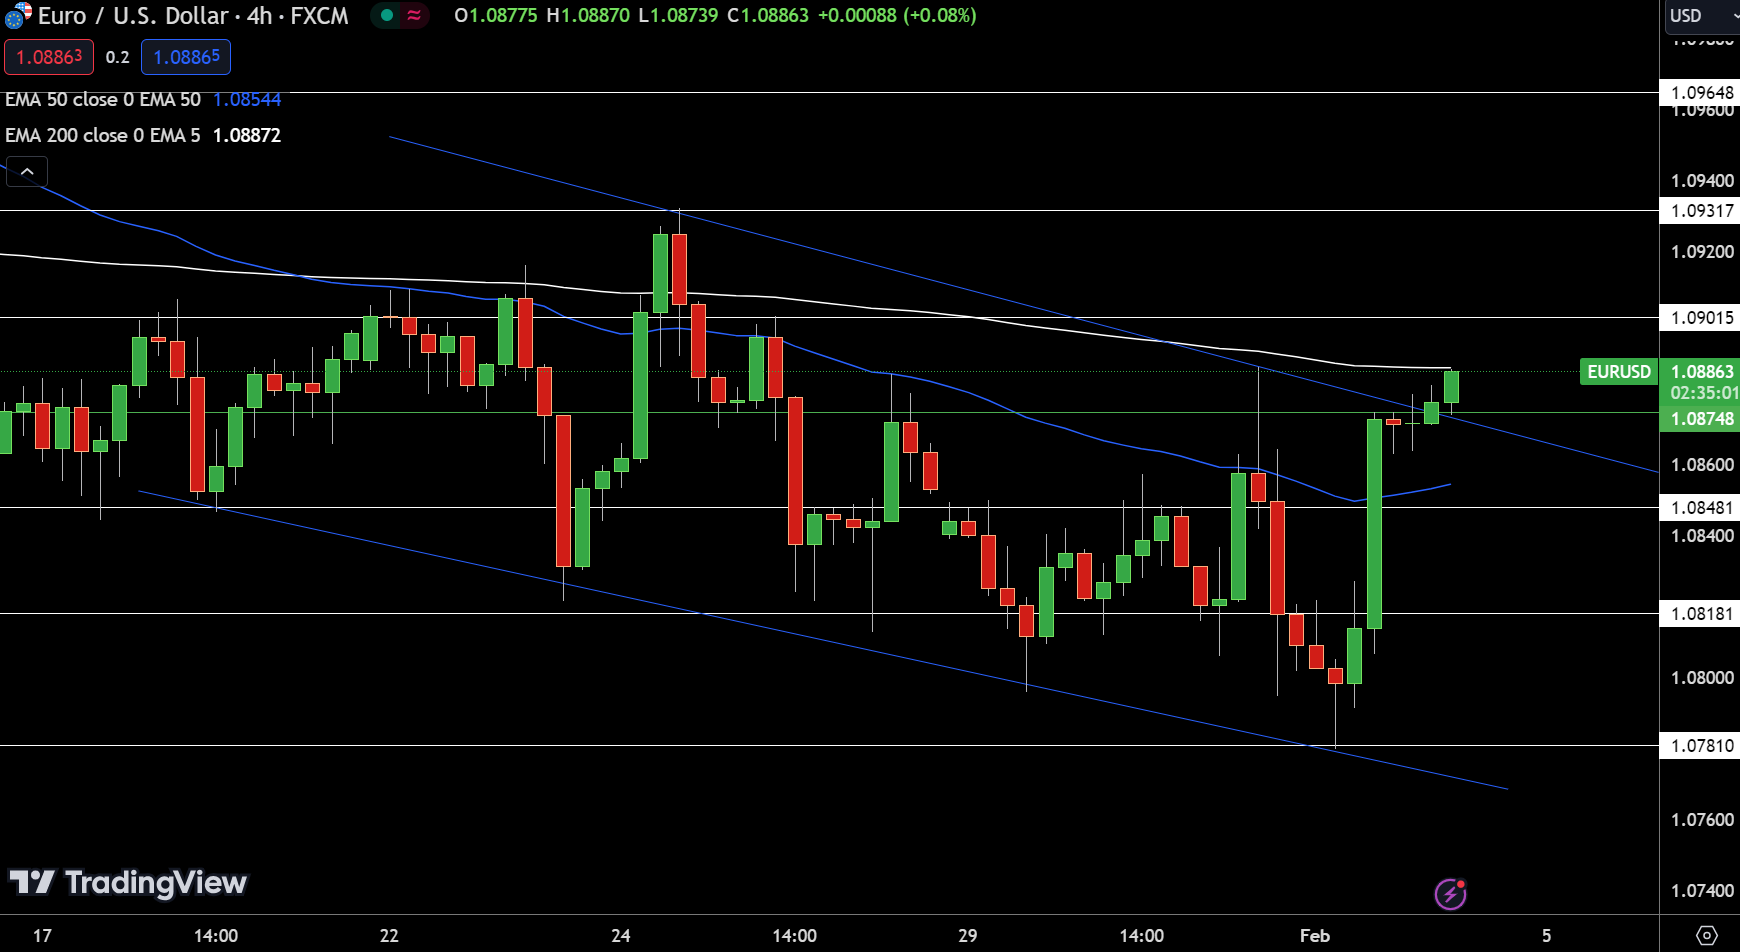
EUR/USD Price Chart – Source: TradingviewThe EUR/USD pair has shown a slight increase of 0.10%, currently trading at 1.08863. Within the 4-hour chart framework, the pair navigates above the pivot point at 1.08748, indicating a slight bullish momentum. Resistance levels are set at 1.09015, 1.09317, and 1.09648, suggesting potential ceilings for upward movements. Conversely, support is found at 1.08481, followed by 1.08181 and 1.07810, marking critical junctures for the pair’s stability.

Technical indicators reveal a 50-day Exponential Moving Average (EMA) at 1.08544 and a 200-day EMA at 1.08872, closely aligning with the current price, showcasing a balanced market sentiment. A significant chart pattern has emerged as EUR/USD broke its downward trend line at the 1.0874 level, supported by a bullish candle formation, hinting at the possibility of continued upward trajectory.

The current technical stance for EUR/USD is bullish, conditional on maintaining above the 1.08748 mark, hinting at further gains if this level holds as support.

GBP/USD Technical Forecast

GBP/USD Price Chart - Source: Tradingview

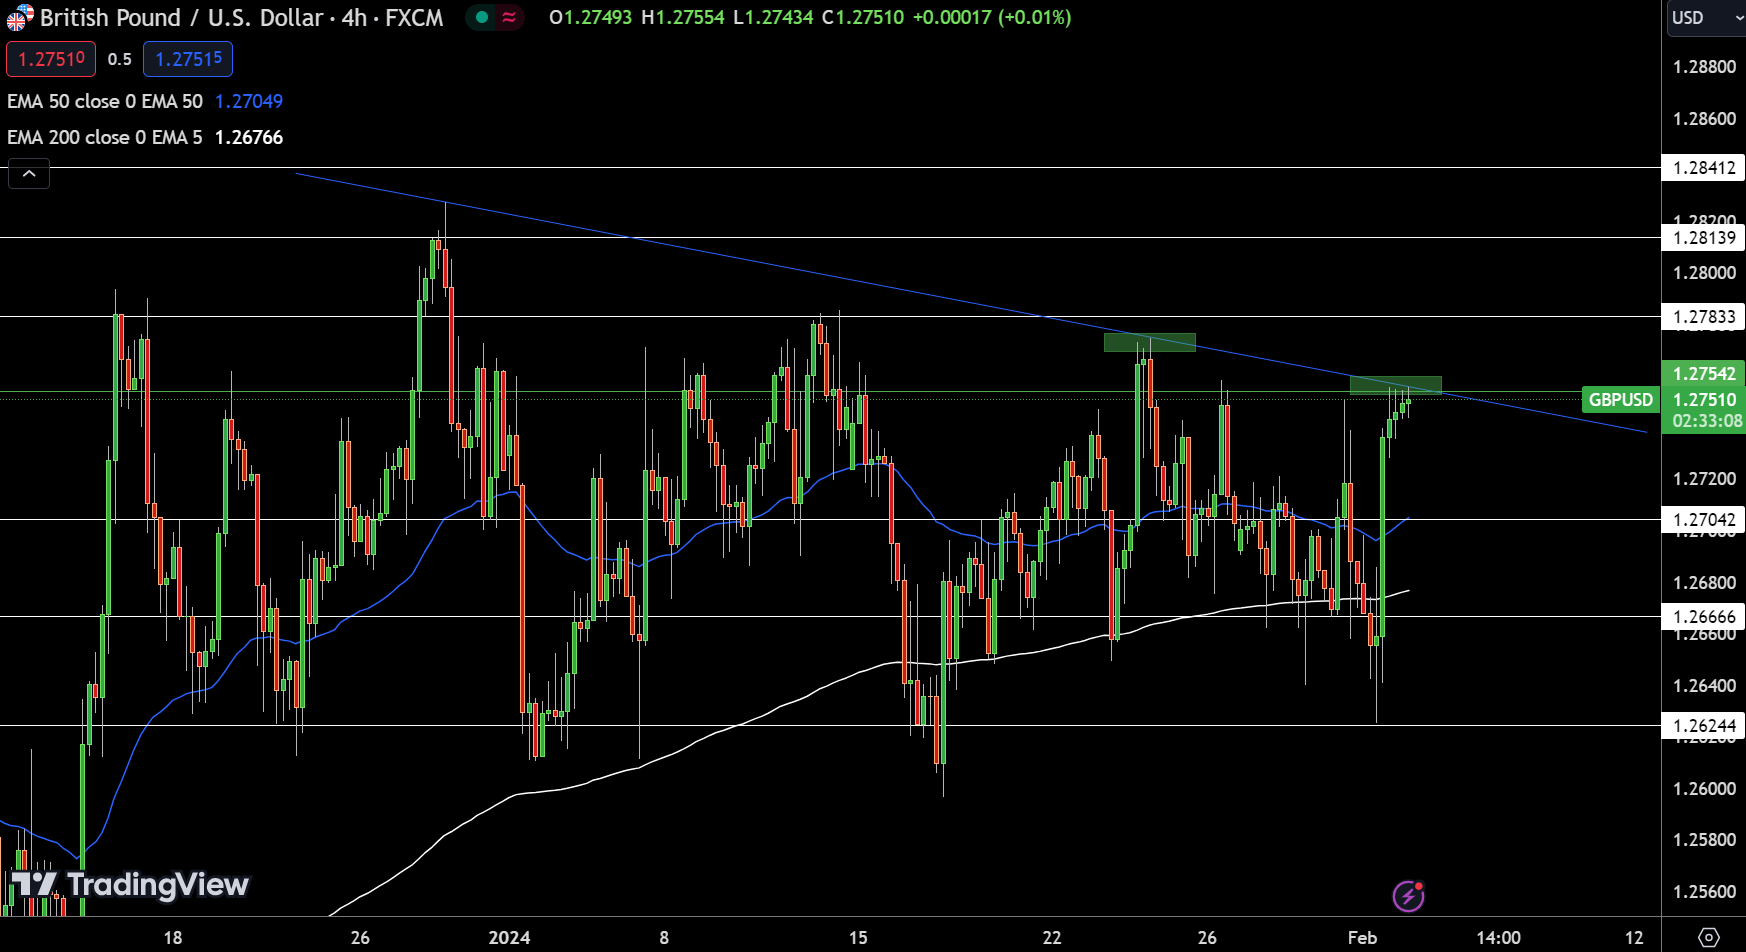
GBP/USD Price Chart – Source: TradingviewThe GBP/USD pair slightly ascended today, registering a 0.07% increase to 1.27513. On the 4-hour chart, the pivot point is marked at 1.27542, delineating the immediate trajectory for the currency pair. Resistance levels are identified at 1.27833, 1.28139, and 1.28412, hinting at potential upward barriers. Meanwhile, support is established at 1.27042, with further cushions at 1.26666 and 1.26244, underscoring key levels for any downward adjustments.

Technical analysis reveals a 50-day Exponential Moving Average (EMA) at 1.27049 and a 200-day EMA at 1.26766, indicating a slight bullish undertone. However, the presence of a doji candlestick pattern below the critical level of 1.2754, coupled with a descending trend line on the four-hourly chart, suggests that bullish momentum might be waning.

This scenario points to a potential bearish correction below this level. Conversely, a breach above this level could pave the way for further gains. The GBP/USD stands at a crossroads, with a bearish outlook below the pivot point of 1.27542.