XRP News: Amicus Curia Attorney Deaton Talks SEC v Ripple and Appeals

XRP News: Amicus Curia Attorney Deaton Talks SEC v Ripple and Appeals

Amicus Curiae Attorney John E Deaton Shares Views on the SEC v Ripple Case

On Thursday, Amicus Curiae attorney and founder of CryptoLaw US, John E Deaton, discussed the ongoing SEC v Ripple case.

Significantly, Deaton focused on the SEC Motion to Compel and Ripple’s opposition filing.

The SEC filed the Motion to Compel, asking the court to order Ripple to provide,

  • Financial statements for 2022/23.
  • Post-complaint contracts governing XRP sales to institutional investors.

Deaton said that Ripple could find an exception to Section 5 of the Securities Act, noting Ripple could demonstrate that XRP sales were to accredited investors.

Considering the previous rulings from the SEC v Ripple case, Deaton said.

“It is quite possible that Ripple would be able to show an exemption to the vast majority of those institutional sales. […] It’s quite possible that the Judge could fine Ripple something like $10 million.”

Deaton highlighted that the SEC’s biggest fear would be for Ripple to show a significant portion of sales were to accredited investors.

Importantly, Deaton believes the Judge will fine Ripple significantly less than the legal fees of circa $200 million.

Deaton talked about the Hinman speech-related documents, SEC Chair Gary Gensler, and the application of the pre-internet securities laws.

The CryptoLaw US founder continued to think there are no discussions about a settlement.

Deaton also discussed the possible outcomes and impact on XRP price trends, saying a hefty fine could adversely affect XRP. However, Deaton believes the size of the fine is unlikely to influence XRP.

About an SEC appeal, Deaton believes the Second Circuit Court would not overturn the appeal. Judge Torres went straight to the third factor of the Howey Test, which is the reasonable expectation of profits from Ripple. If the second circuit sends the case back to Judge Torres, Judge Torres could review the case and rule based on the second prong of the Howey Test, a Common Enterprise.

Deaton believes the programmatic XRP sales also failed to meet the second prong of the Howey Test.

XRP Price Action
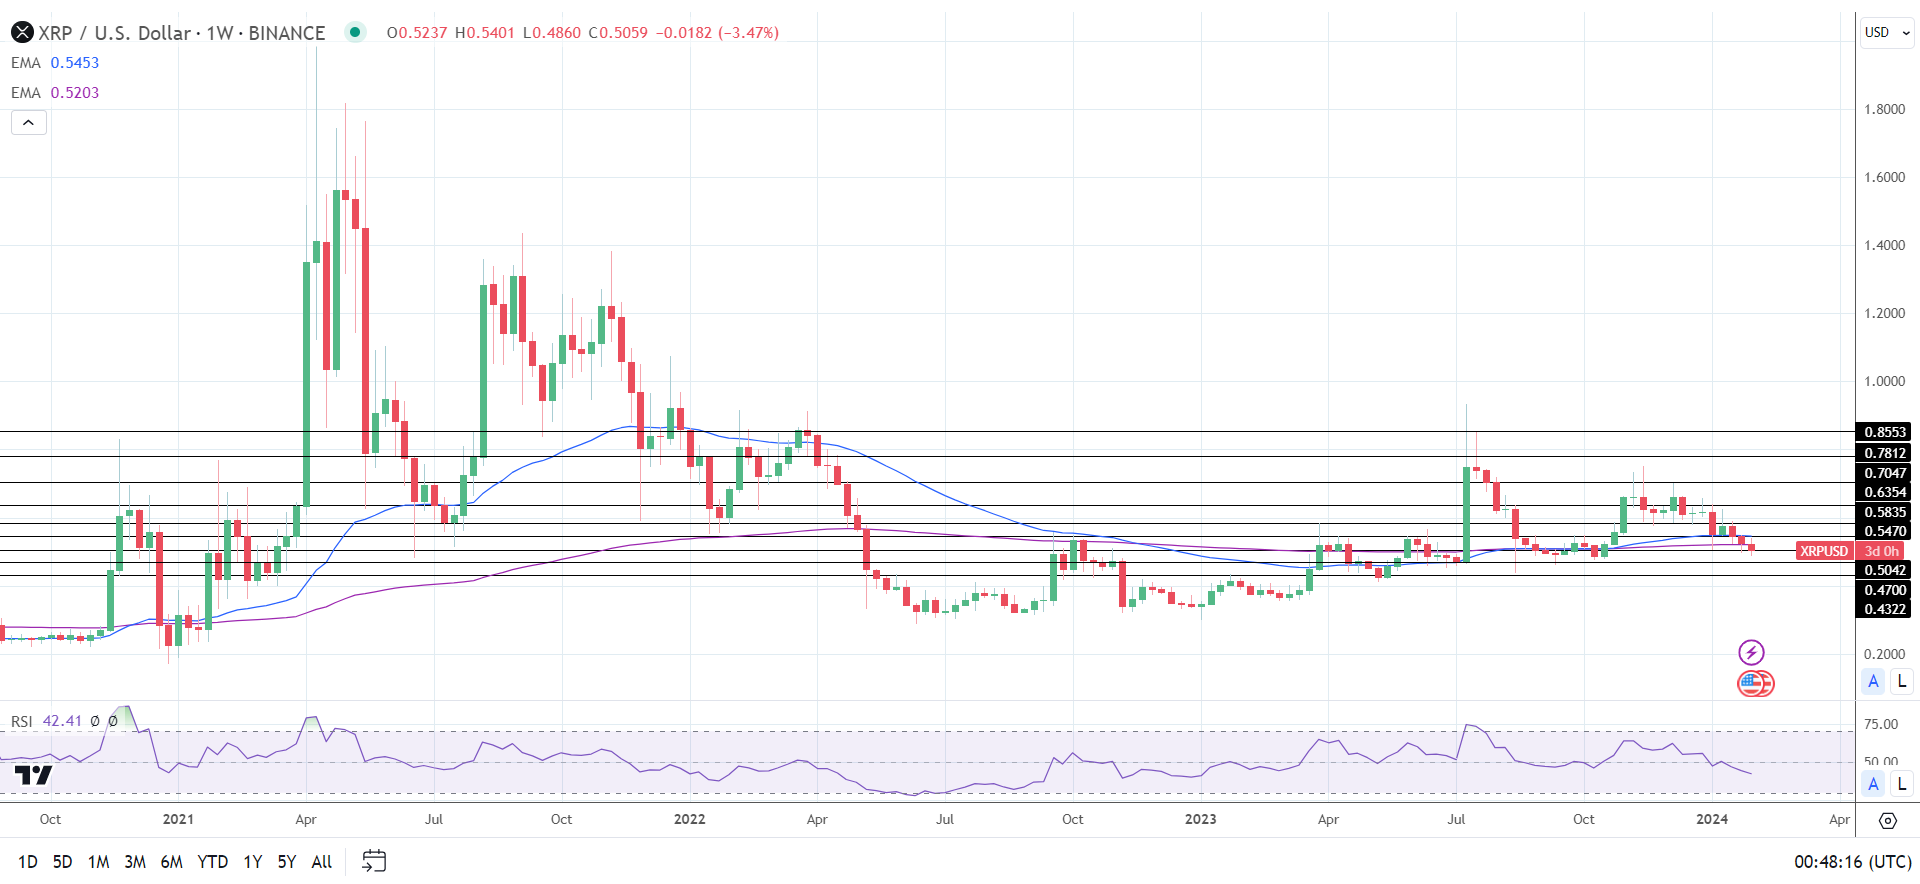
Weekly Chart sends bearish price signals.
XRPUSD 020224 Weekly Chart

Daily Chart

XRP remained below the 50-day and 200-day EMAs, sending bearish price signals. On Thursday, the 50-day EMA crossed through the 200-day EMA, affirming bearish price trends.

An XRP return to the $0.52 handle would give the bulls a run at the $0.5470 resistance level.

US lawmaker chatter, SEC activity, and SEC v Ripple case-related updates need consideration.

However, a break below the $0.5042 support level would bring the $0.4700 support level into play.

The 14-day RSI reading, 34.41, suggests an XRP fall below the $0.50 handle before entering oversold territory.
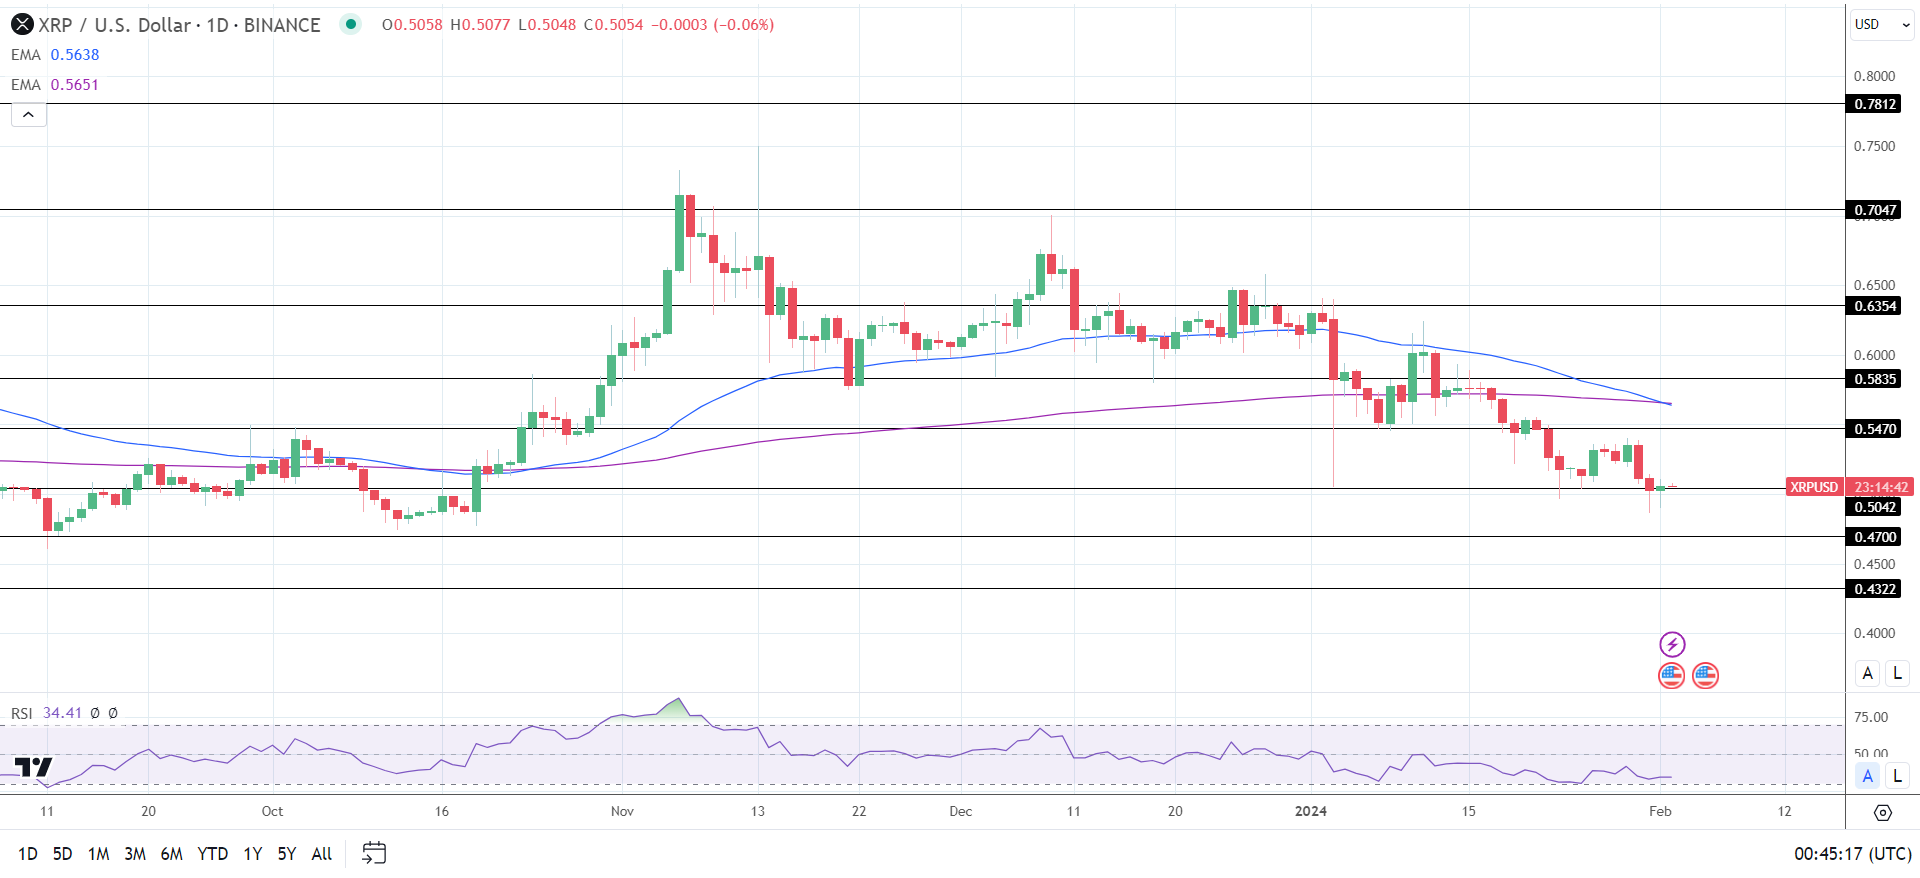
XRP Daily Chart sends bearish price signals.
XRPUSD 020224 Daily Chart

4-Hourly Chart

On the 4-hourly, XRP sat below the 50-day and 200-day EMA. The EMAs reaffirmed the bearish price signals.

An XRP break above the 50-day EMA would give the bulls a run at the $0.5470 resistance level.

However, a break below the $0.5042 support level would support a fall toward the $0.4700 support level.

The 4-hourly RSI, with a reading of 43.12, suggests an XRP fall to the $0.48 handle before entering the oversold territory.
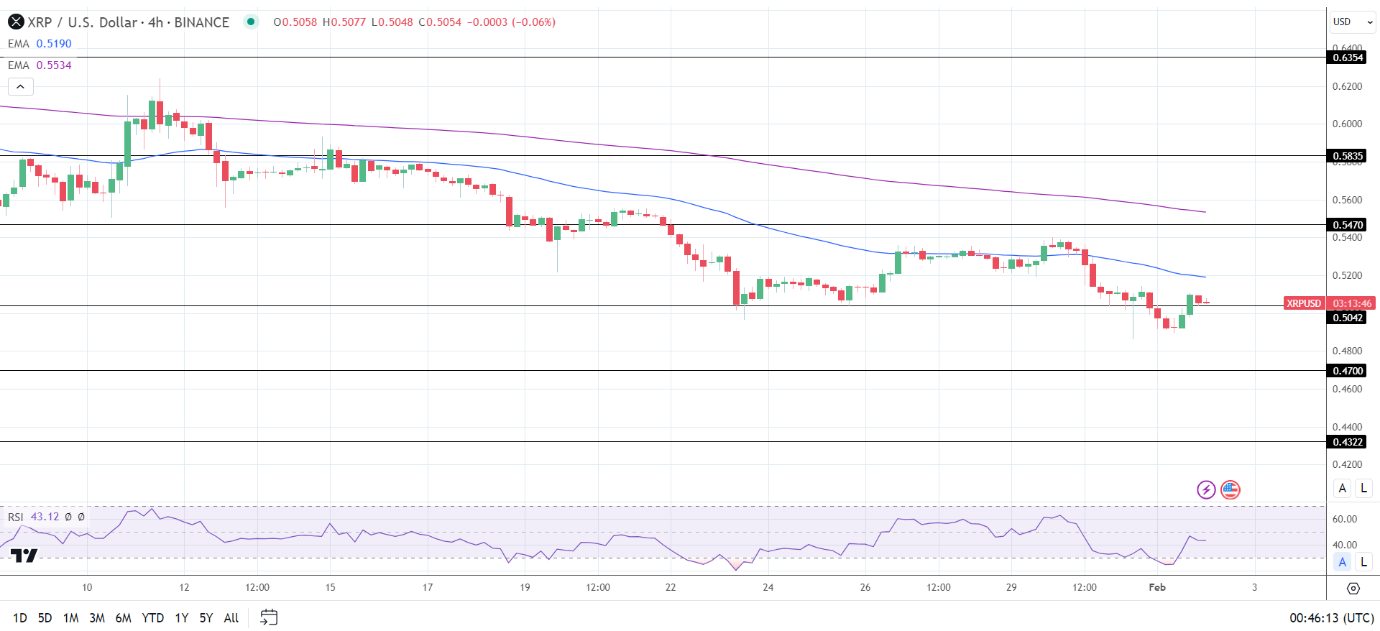
XRP 4-Hourly Chart affirms bearish price signals.
XRPUSD 020224 4-Hourly Chart
Apple Surpasses Earnings Expectations, China Sales Waver

Apple Surpasses Earnings Expectations, China Sales Waver

Earnings Overview

Apple Inc. reported its fiscal first-quarter results, surpassing LSEG consensus expectations on both revenue and earnings per share fronts. The tech giant posted an earnings per share (EPS) of $2.18, compared to the estimated $2.10, while revenue reached $119.58 billion against predictions of $117.91 billion. This performance marks a notable rebound, breaking a year-long streak of revenue declines.

Product Line Breakdown

The quarter witnessed mixed outcomes across various product lines. iPhone sales, a critical driver of Apple’s revenue, exceeded expectations with a nearly 6% growth, amounting to $69.70 billion. This surge is significant, especially considering it’s the first full quarter reflecting iPhone 15’s market presence. Mac revenue also saw a modest increase, aligning with estimates at $7.78 billion.

However, iPad revenue didn’t meet expectations, recording a 25% drop to $7.02 billion. This decline aligns with the absence of new iPad models in 2023, a first in the product’s history. The ‘Other Products’ segment, encompassing wearables like AirPods and Apple Watch, despite an 11% year-over-year decline, still surpassed estimates with $11.95 billion in sales.

Services and Margins

Apple’s services sector, including Apple Music and App Store subscriptions, rose 11% to $23.11 billion, slightly missing the mark on estimates. This segment’s growth is integral, given its higher margin contribution compared to hardware sales. Speaking of margins, Apple’s gross margin impressively nearly hit 46% during the quarter.

Regional Sales and China’s Decline

Geographically, Apple showed growth in all regions except Greater China, which includes mainland China, Hong Kong, and Taiwan. Sales in this critical market fell nearly 13%, raising concerns about Apple’s traction in its third-largest market. CEO Tim Cook attributed this to strong currency fluctuations and noted that when adjusted for currency, the decline is less severe.

Outlook and Forecast

Looking ahead, Apple didn’t provide explicit guidance for the upcoming quarter. However, the company’s resilience amidst global economic challenges and its continued innovation in product lines and services suggest a cautiously optimistic outlook. Investors might expect steady growth in core segments like iPhones and services, although global economic factors and competition in key markets like China could influence performance.

In summary, Apple’s fiscal first-quarter results paint a picture of resilience and adaptability in a challenging economic landscape, with key growth areas balancing out weaker segments. While challenges remain, particularly in the Chinese market, Apple’s diverse product and service portfolio continues to drive its overall growth trajectory.

Japanese Yen Provides Reversal Hints: USD/JPY, EUR/JPY, GBP/JPY Setups

Japanese Yen Provides Reversal Hints: USD/JPY, EUR/JPY, GBP/JPY Setups

Japanese Yen Adds to Bullish Lift

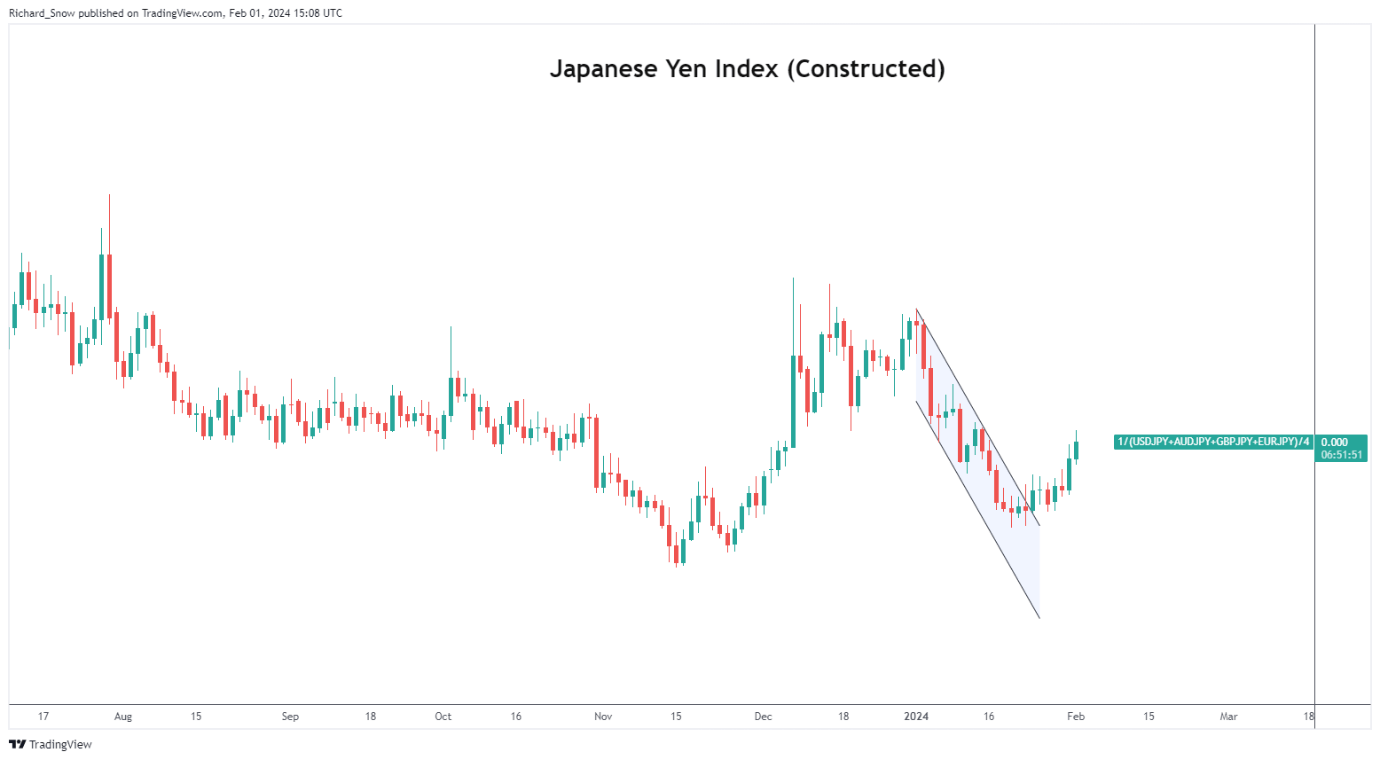
The Japanese yen appears to be building on some early upward momentum, in the aftermath of a moderately hawkish Bank of Japan meeting in January. While there was no change to negative interest rate or alterations to the ongoing yield curve control, BoJ Governor Kazuo Ueda sees the likelihood of reaching the 2% target as “gradually increasing”. A simple, constructed Japanese yen index below shows a steady rise in the value of the yen yesterday and today thus far.

Constructed Japanese Yen Index- Equal Weighted Average of USD/JPY, GBP/JPY, EUR/JPY, AUD/JPY

image1.png

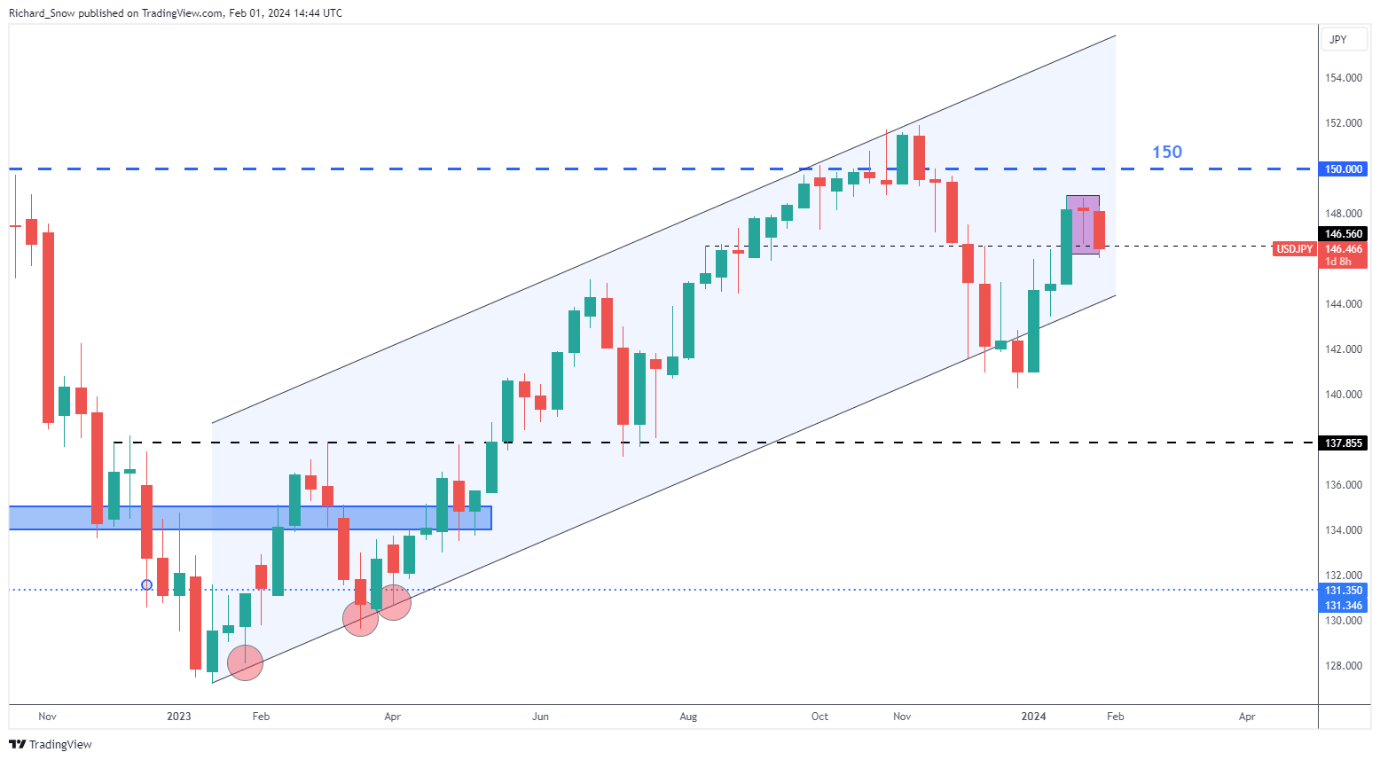
The weekly hanging man candle was identified in the weekly US dollar forecast and it signalled a possible move lower in USD/JPY ahead of this week. Since then, the subsequent red candle (this week thus far) heads lower, testing the 146.56 mark.

USD/JPY Weekly Chart

image2.png

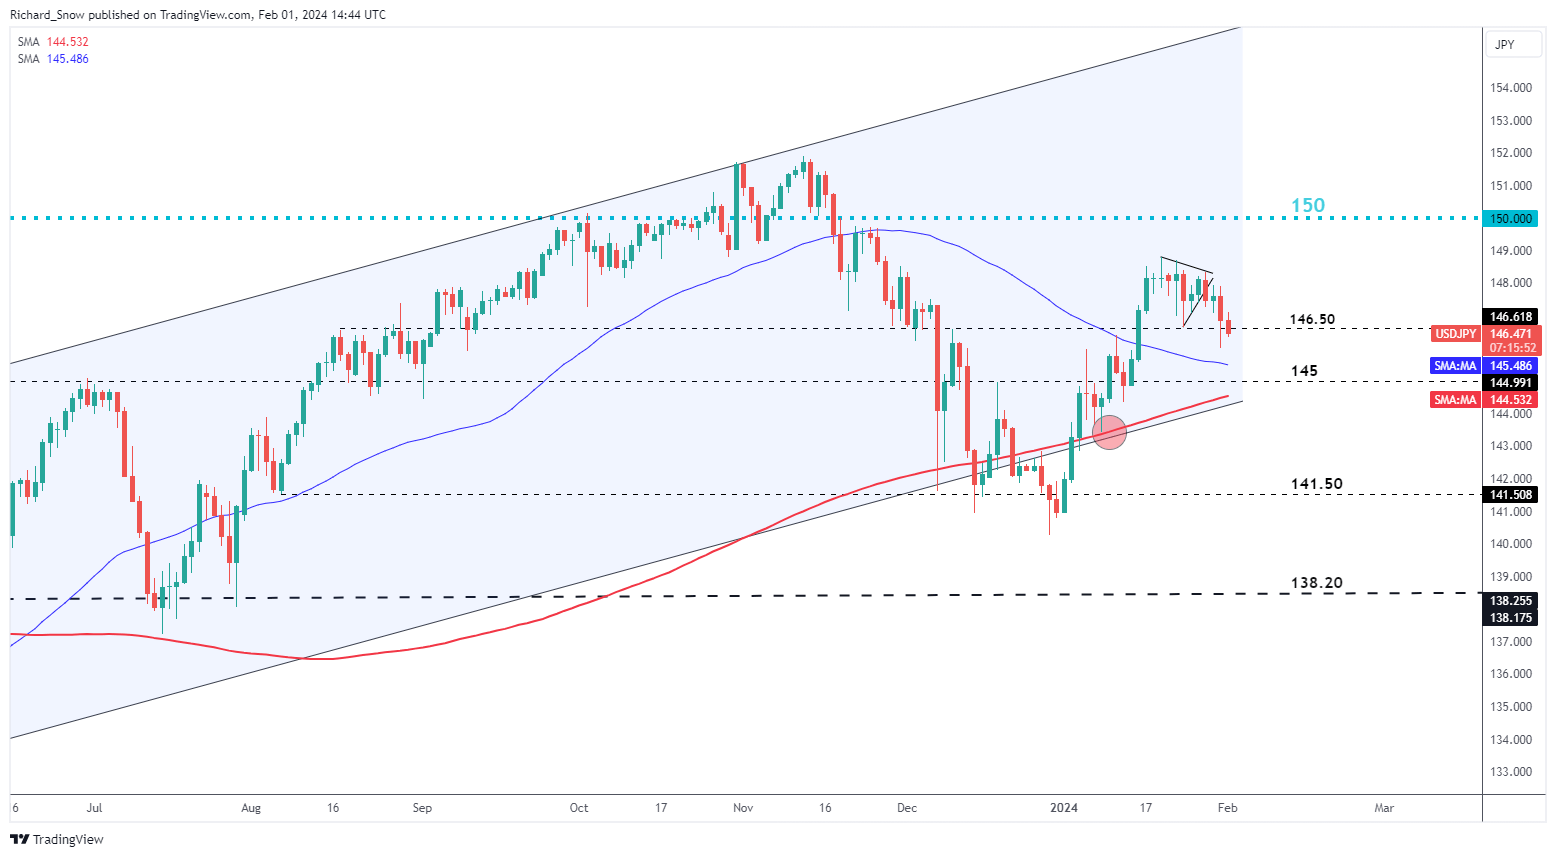
The daily chart shows the invalidation of a developing bullish pennant as price action heads lower. This presented an example where the longer timeframe view clashed with shorter-term, daily developments -highlighting the importance of multi-timeframe analysis and recognition of the longer-term dynamics.

The pair currently tests the 146.50 level with 145 not far away. It is then that the 200-day simple moving average appears at long-term channel support. The zone of support may be difficult to breach should price action drop enough to test the area.

USD/JPY Daily Chart

image3.png

EUR/JPY Approaches Key Pivot Point

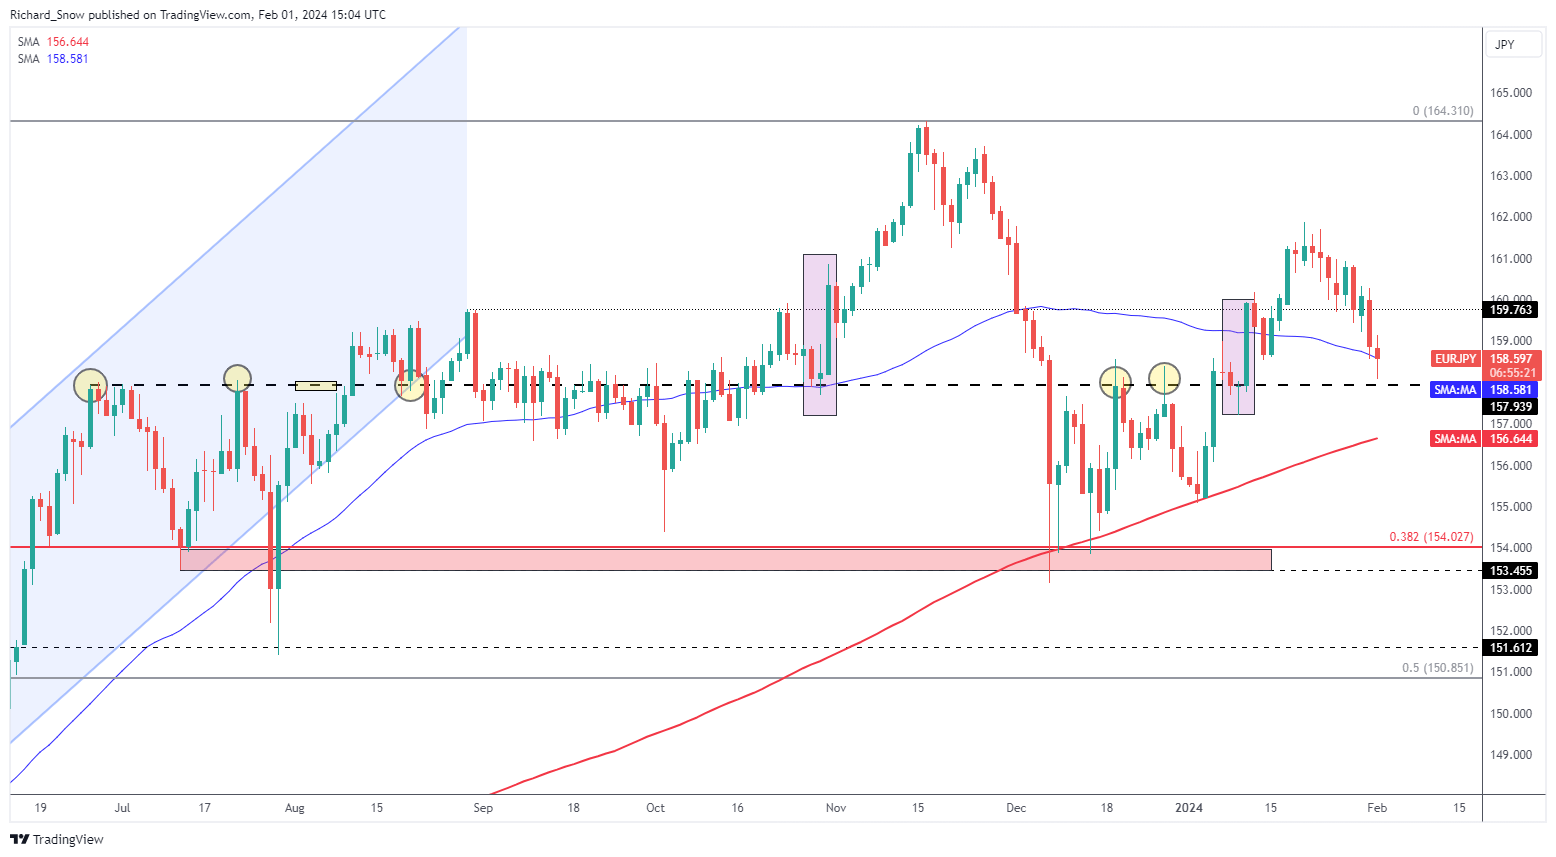
EUR/JPY signalled a slowdown in bullish momentum (evidenced by longer upper wicks) before stalling and heading lower. The pair now tests the 50-day simple moving average but more importantly, heads towards a key pivot point in 157.94. The level has come into play as resistance in June, July and December of last year and provided a zone of resistance throughout September (on a closing basis).

The recent selloff has been characterised by two bearish engulfing candles, helping to spur on sellers. The 200 SMA is the next level of support at 156.64 if the pair has enough momentum to breach 157.94. In the event Support process too much to handle once again, 159.76.

EUR/JPY Daily Chart

image4.png

GBP/JPY ‘Double Top’ Limits Further Upside Potential

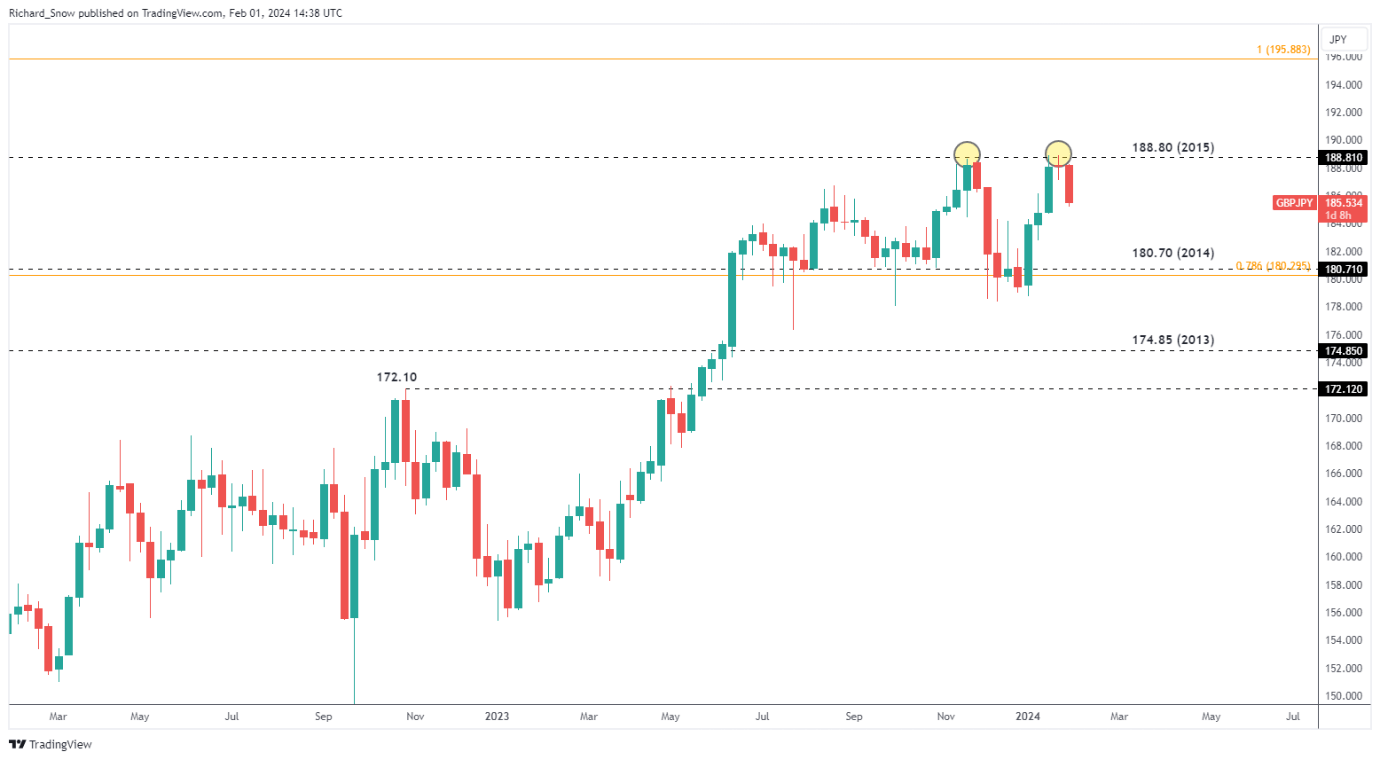
On the weekly GBP/USD chart, a notable double top appears to be limiting a bullish continuation over the long-term. 188.80 has proven to be too tough to crack with prices easing before potentially attempting another go.

GBP/USD Weekly Chart

image5.png

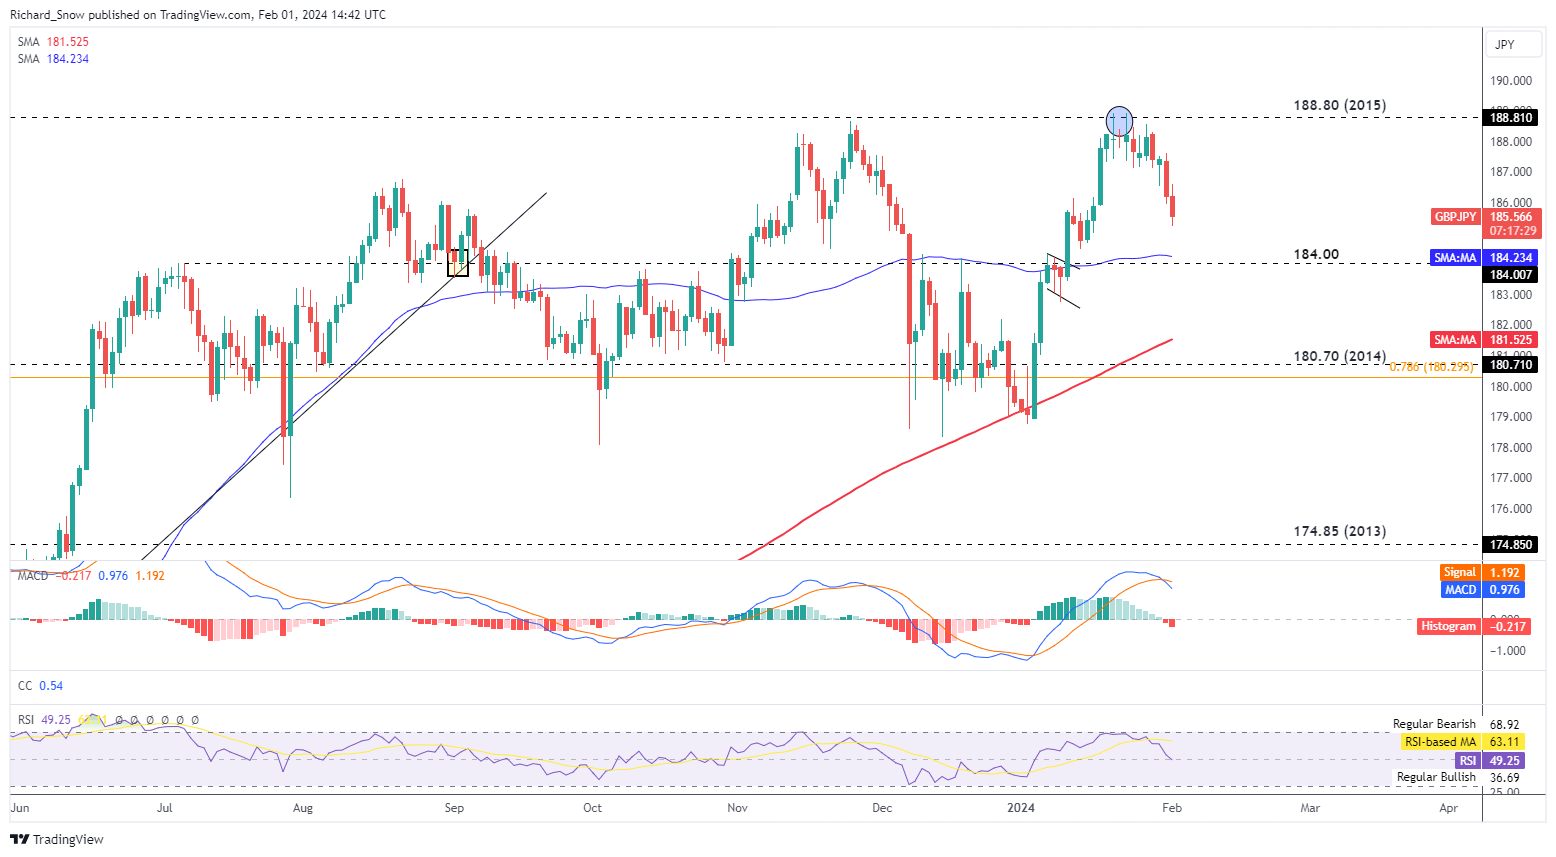
GBP/USD exhibited very little movement considering we heard from the Bank of England provide its monetary policy update alongside the release of its updated forecasts. 188.80 appears a long way away now that the pair had headed lower in recent sessions.

184.00 flat is the next level of support to keep in mind as it also coincides with the 50-day simple moving average. The MACD supports the continuation of bearish momentum after exhibiting a bearish crossover and the RSI currently sits in the neutral zone – suggesting that any attempt to arrest this decline would have to be substantial.

GBP/USD Daily Chart

image6.png


US Dollar Forecast: Technical Analysis on USD/CAD, AUD/USD and NZD/USD

US Dollar Forecast: Technical Analysis on USD/CAD, AUD/USD and NZD/USD

USD/CAD TECHNICAL ANALYSIS

USD/CAD showed strength after the FOMC decision, but pivoted to the downside on Thursday, nudging lower towards cluster support resting at 1.3390. It is imperative for the bulls to fiercely safeguard this region; any failure to do so could potentially trigger a retracement towards the 1.3300 handle.

Conversely, if the pair regains its poise, its first challenge lies in surpassing the 50-day simple moving average. Beyond this point, the focus shifts to trendline resistance and the 200-day simple moving average, situated in the proximity of 1.3480.

USD/CAD TECHNICAL CHART

A screenshot of a computer screen  Description automatically generated

USD/CAD Chart

Curious about what lies ahead for the Australian dollar? Find comprehensive answers in our quarterly trading forecast. Claim your free copy now!

AUD/USD TECHNICAL ANALYSIS

A shift towards a risk-off sentiment weighed on AUD/USD during Thursday’s trading session, though the pair managed to maintain its position above technical support at 0.6525. For market conditions to be conducive to a bullish reversal, this floor must hold; any breach could trigger a move towards 0.6460.

On the flip side, if the mood brightens and the Aussie mounts a comeback, resistance awaits at 0.6600 and then 0.6625. If history is any guide, prices could be rejected from this region on a retest; however, a successful breakout could lead to a move towards 0.6645, followed by 0.6695.

AUD/USD TECHNICAL CHART

A screenshot of a computer screen  Description automatically generated

AUD/USD Chart

If you are discouraged by trading losses, why not take a proactive step to improve your strategy? Download our guide, “Traits of Successful Traders,” and access invaluable insights to assist you in avoiding common trading errors.

 NZD/USD TECHNICAL ANALYSIS

After a subdued performance after the Fed’s monetary policy announcement, NZD/USD rebounded on Thursday, making strides toward trendline resistance at 0.6155. While this technical ceiling is expected to act as a staunch barrier to further advances, a breakout could bring a key Fib level at 0.6180 into play.

In contrast, should sellers reemerge and trigger a market retracement, cluster support spanning from 0.6085 to 0.6050 will be the first line of defense against a bearish assault. The bears may struggle to push prices below this region, but if they succeed, a move towards 0.6000 could ensue.

NZD/USD TECHNICAL CHART

A screenshot of a computer screen  Description automatically generated

NZD/USD Chart

Gold Price Forecast: US Jobs Data to Shape Near-Term Trend, Setup on XAU/USD

Gold Price Forecast: US Jobs Data to Shape Near-Term Trend, Setup on XAU/USD

The Federal Reserve concluded earlier this week its first meeting of 2024, voting to maintain its policy settings unchanged. The FOMC also abandoned its tightening bias, but indicated it will not rush to cut borrowing costs. Chairman Powell went a step further by acknowledging that officials may not yet be confident enough to remove restriction at their next gathering.

Although the possibility of a rate cut in March has diminished, the situation could change again if incoming information shows that activity is starting roll over. In the grand scheme of things, a weaker economy could prompt policymakers to reconsider their stance; after all, data dependency has been the guiding principle for the central bank recently.

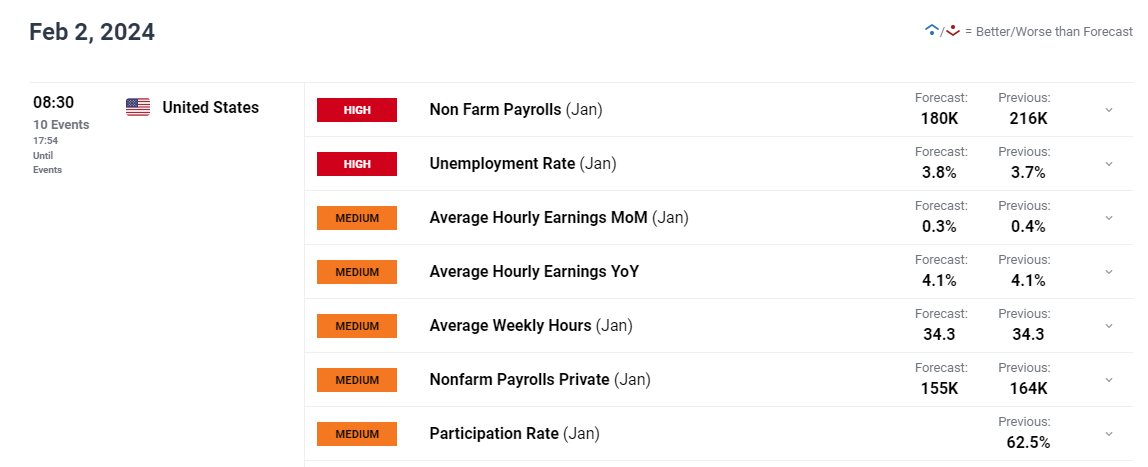
Given the present state of events, the January U.S. employment report will assume greater importance and carry added weight. That said, Wall Street projections suggest U.S. employers added 180,000 workers last month, though a softer outcome should come as no surprise following a subdued ADP reading and rising jobless claims for the period in question.

Eager to gain insights into gold’s future path? Discover the answers in our complimentary quarterly trading guide. Request a copy now!

UPCOMING US JOBS REPORT

image1.png

If nonfarm payrolls figures prove lackluster and fall well short of expectations, a March rate cut might be back on the table. Under these circumstances, we could observe a sharp retracement in U.S. Treasury yields and the U.S. dollar. This scenario is likely to foster a constructive environment for gold in the near term.

On the other hand, if NFP numbers beat consensus estimates by a wide margin, there’s potential for further reduction of dovish wagers on the Federal Reserve’s monetary policy outlook. In this scenario, bond yields and the greenback could accelerate to the upside, weighing on the precious metals complex. In this context, bullion could find itself in a precarious position in February.

Wondering how retail positioning can shape gold prices? Our sentiment guide provides the answers you are looking for—don’t miss out, get the guide now!

GOLD PRICE TECHNICAL ANALYSIS

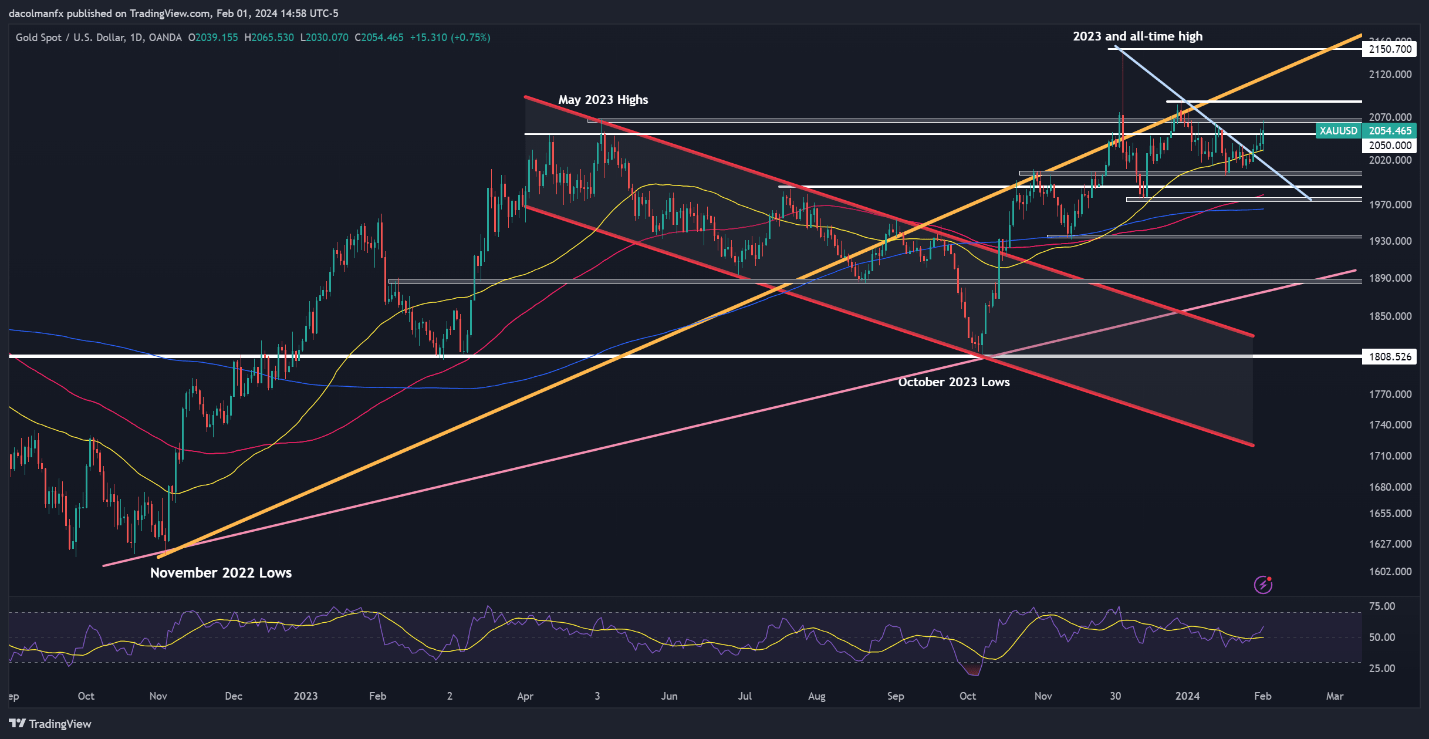
Gold climbed on Thursday, pushing past the $2,050 barrier and coming within a hair’s breadth of breaking $2,065, a key ceiling. With the bulls reasserting control, this resistance could soon be overcome. If that scenario plays out, a rally toward $2,085 is possible. On further strength, the focus will turn to $2,150.

Conversely, if buying interest fades and XAU/USD pivots lower, it’s vital for traders to watch the $2,050 level for bearish activity. If this area fails to offer support, a drop toward the 50-day simple moving average may unfold, followed by a possible retest of $2,005. Below this floor, all eyes will be on $1,990.

GOLD PRICE TECHNICAL CHART

A screen shot of a graph  Description automatically generated


NFP and Forex: What is NFP and How to Trade It?

NFP and Forex: What is NFP and How to Trade It?

What is the NFP?

The non-farm payroll (NFP) figure is a key economic indicator for the United States economy. It represents the number of jobs added, excluding farm employees, government employees, private household employees and employees of nonprofit organizations.

US Non Farm Payroll historical results

NFP releases generally cause large movements in the forex market. The NFP data is normally released on the first Friday of every month at 8:30 AM ET. This article will explain the role NFPs play in economics and how to apply NFP release data to a forex trading strategy.

How does the NFP affect forex?

NFP data is important because it is released monthly, making it a very good indicator of the current state of the economy. The data is released by the Bureau of Labor Statistics and the next release can be found on an economic calendar.

Employment is a very important indicator to the Federal Reserve Bank. When unemployment is high, policy makers tend to have an expansionary monetary policy (stimulatory, with low interest rates). The goal of an expansionary monetary policy is to increase economic output and increase employment.

So, if the unemployment rate is higher than usual, the economy is thought to be running below its potential and policy makers will try to stimulate it. A stimulatory monetary policy entails lower interest rates and reduces demand for the Dollar (money flows out of a low yielding currency). To learn exactly how this works, see our article on how interest rates effect forex.

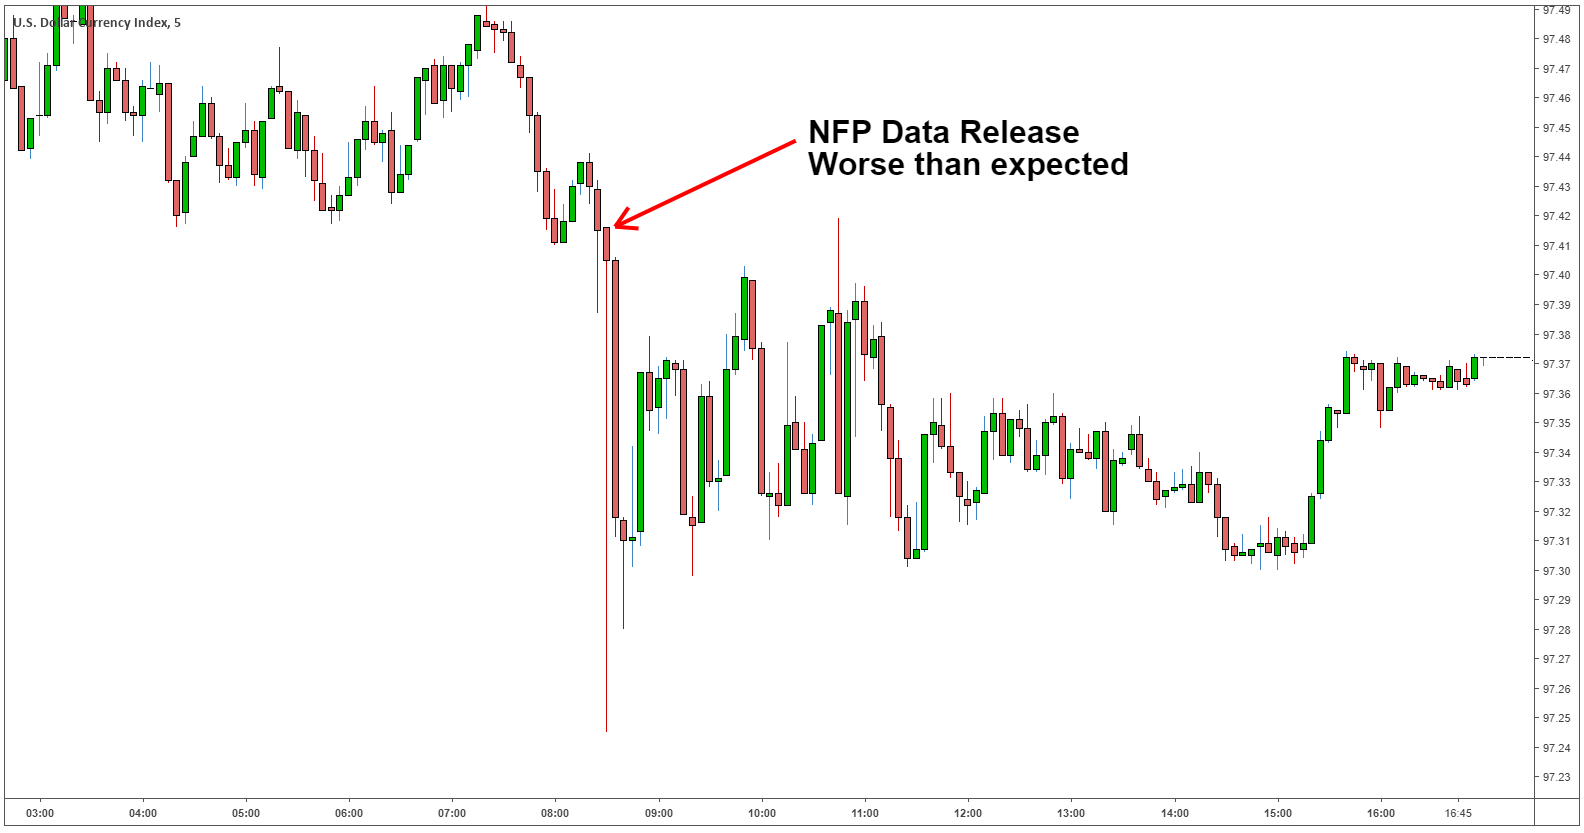
The chart below shows how volatile forex can be after an NFP release. The expected NFP results for March 8, 2019 were 180k (job additions), the actual result disappointed with only 20k jobs being added. As a result, the Dollar Index (DXY) depreciated in value and volatility increased.

NFP forex reaction

Forex traders must be wary of data releases like the NFP. Traders could get stopped-out due to the sudden increase in volatility. When volatility increases, spreads do too, and increased spreads can lead to margin calls.

Which currency pairs are most affected by NFP

The NFP data is an indicator of American employment, so your currency pairs that include the US Dollar (EUR/USD, USD/JPY, GBP/USD, AUD/USD, USD/CHF and others) are most affected by the data release.

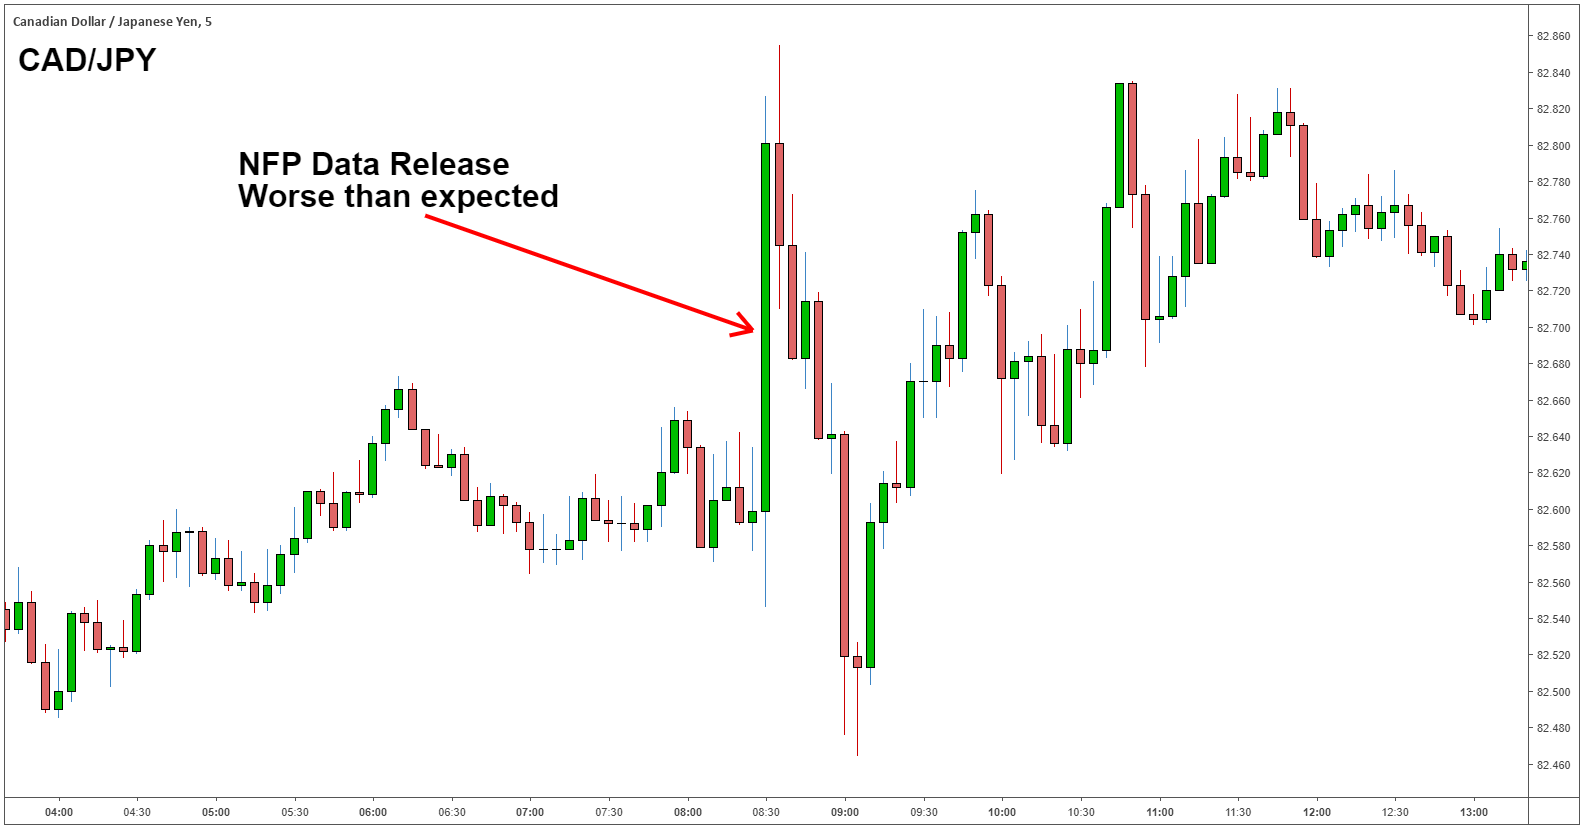
Other currency pairs also display an increase in volatility when the NFP releases, and traders must be aware of this as well, because they may get stopped out. The chart below shows the CAD/JPY during the NFP data release. As you can see, the increase in volatility could stop a trader out of their position even though they are not trading a currency pair linked to the US Dollar.

CAD/JPY NFP reaction

Non-farm payroll release dates

The Bureau of Labor statistics normally releases the NFP data on the first Friday of each month at 8:30 AM ET. The release dates can be found on the Bureau of Labor Statistic’s website.

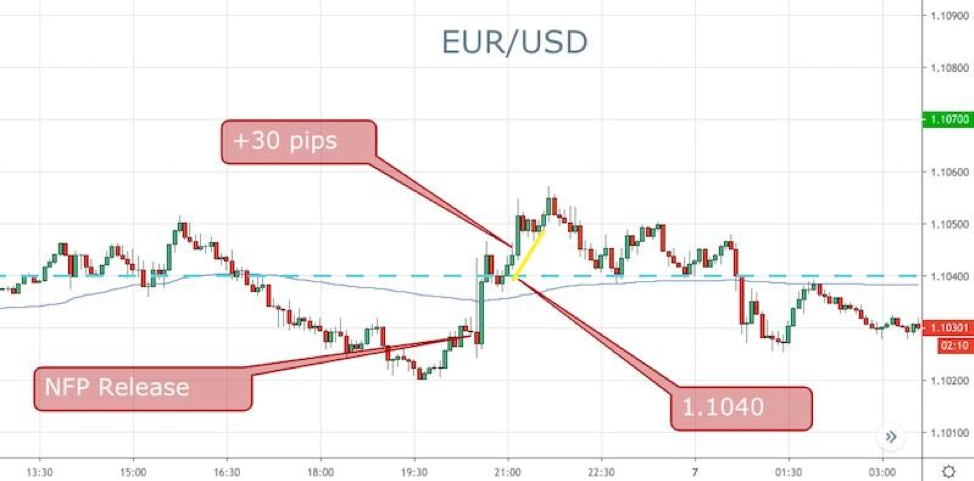
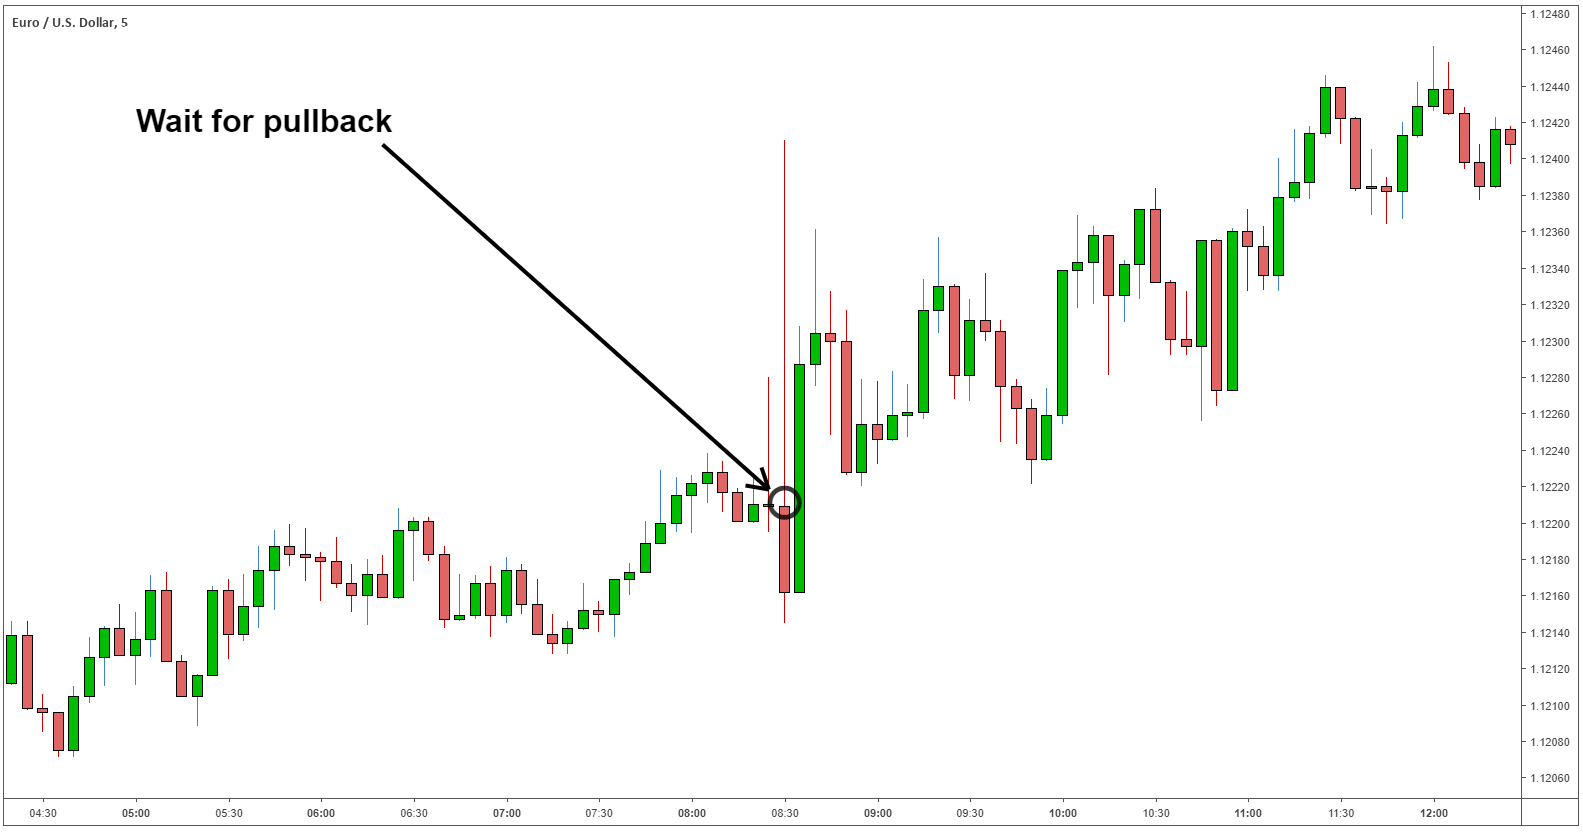
Due to the volatile nature of the NFP release, we recommend using a pull-back strategy rather than a breakout strategy. Using a pullback strategy, traders should wait for the currency pair to retrace before entering a trade.

Using the same example as above (NFP results 20k vs 180k expected) we expect the US Dollar to depreciate. In the example below, we use the EUR/USD. Because the NFP data came out worse than expected, we forecast the EUR/USD to appreciate.

EUR/USD NFP data pullback strategy

Trading the NFP data releases: Top tips & further reading

Here are a few tips to remember when using NFP data releases to inform your forex trading:

  1. NFP data is released on the first Friday of every month.
  2. The NFP data release is accompanied with increased volatility and widening spreads.
  3. Currency pairs not related to the US Dollar could also see increased volatility and widening spreads.
  4. Trading the NFP data release can be dangerous due to the increase in volatility and possible widening of spreads. To combat this, and to avoid getting stopped-out, we recommend using the appropriate leverage, or no leverage at all
Trading the Gap: What are Gaps & How to Trade Them?

Trading the Gap: What are Gaps & How to Trade Them?

What is a gap?

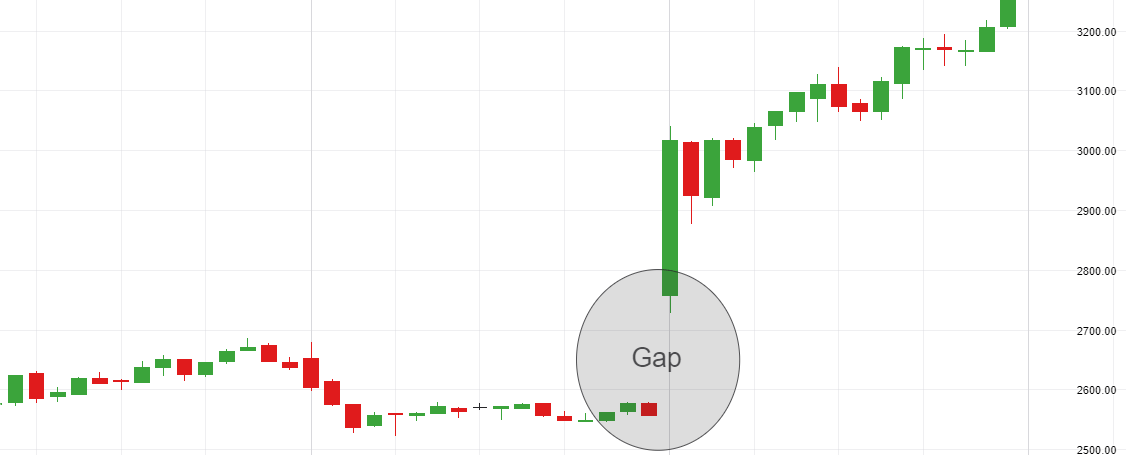
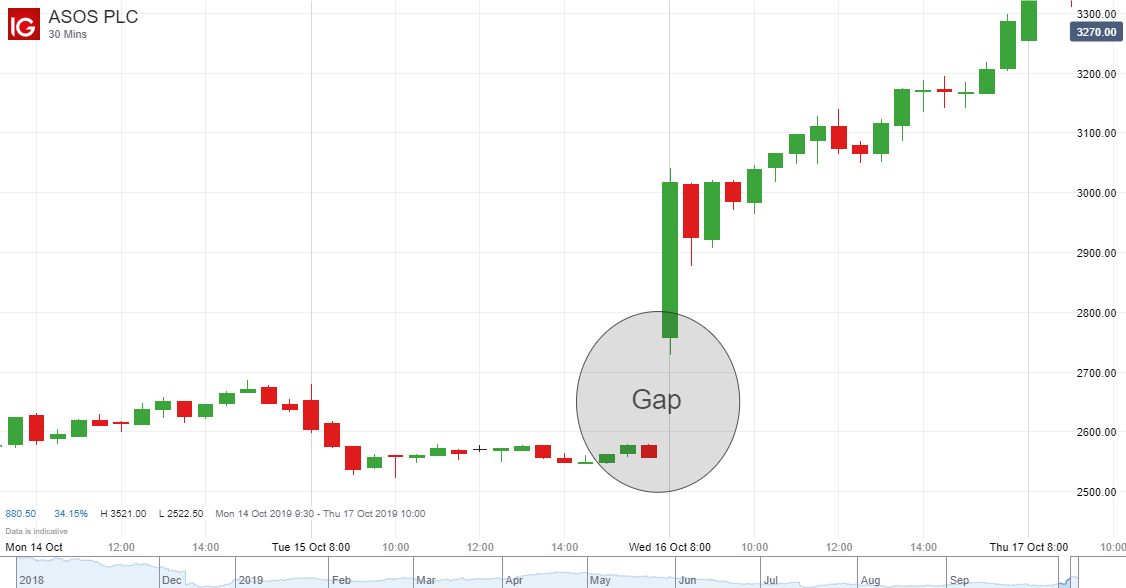
A gap refers to the area on a chart where no trading activity has taken place. This will appear as an asset’s price moves sharply up or down with nothing in between, meaning the market has opened at a different price to its prior close.

Example of a gap shown on candlestick chart

Why does the gap occur? The most frequent cause is fundamental factors. For example, in the chart above, ASOS stock rallied overnight as the company’s full year results showed it avoided another profit warning – along with traders showing confidence in the company’s ability to fix critical operational issues.

Other news such as product announcements, analyst upgrades and downgrades, and new senior appointments can lead to gaps. This is because they can move the market significantly between trading sessions in either direction.

Gap down stocks vs Gap up stocks

Gap down stocks and gap up stocks refer to the direction of the price movement either side of the gap. A full gap down is when the opening price is lower than the prior low price, while a full gap up (as shown above) occurs when the opening price is greater than the prior high price.

The four types of gaps in trading

Aside from gap down and gap up, there are four main types of gap, dependent on where they show up on a chart: common gaps, breakway gaps, continuation or runaway gaps, and exhaustion gaps.

1. Common gaps simply show a gap in price action independent of price patterns and usually don’t provide exciting trading opportunities.

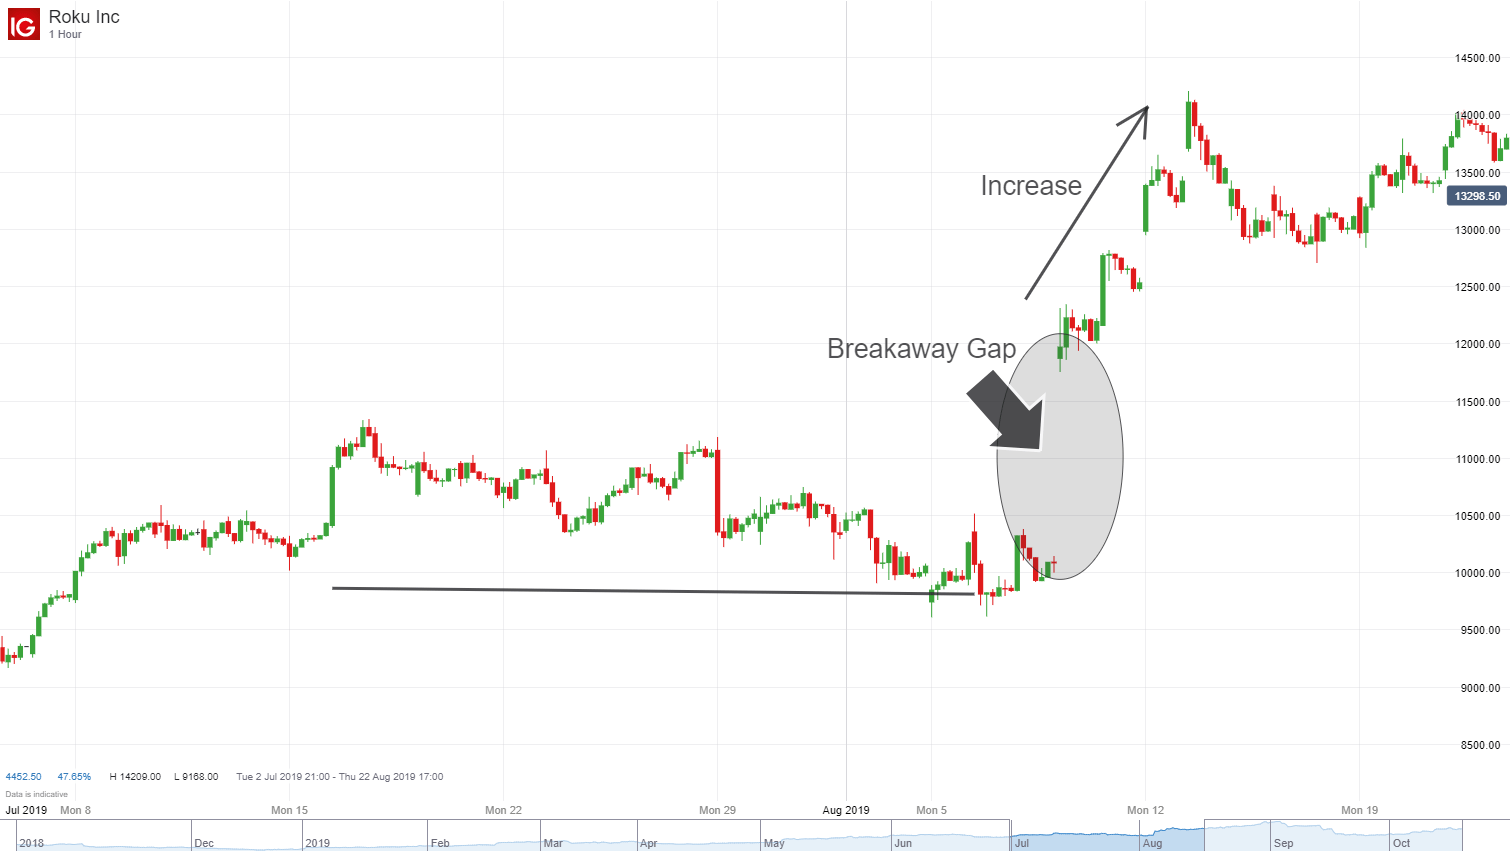
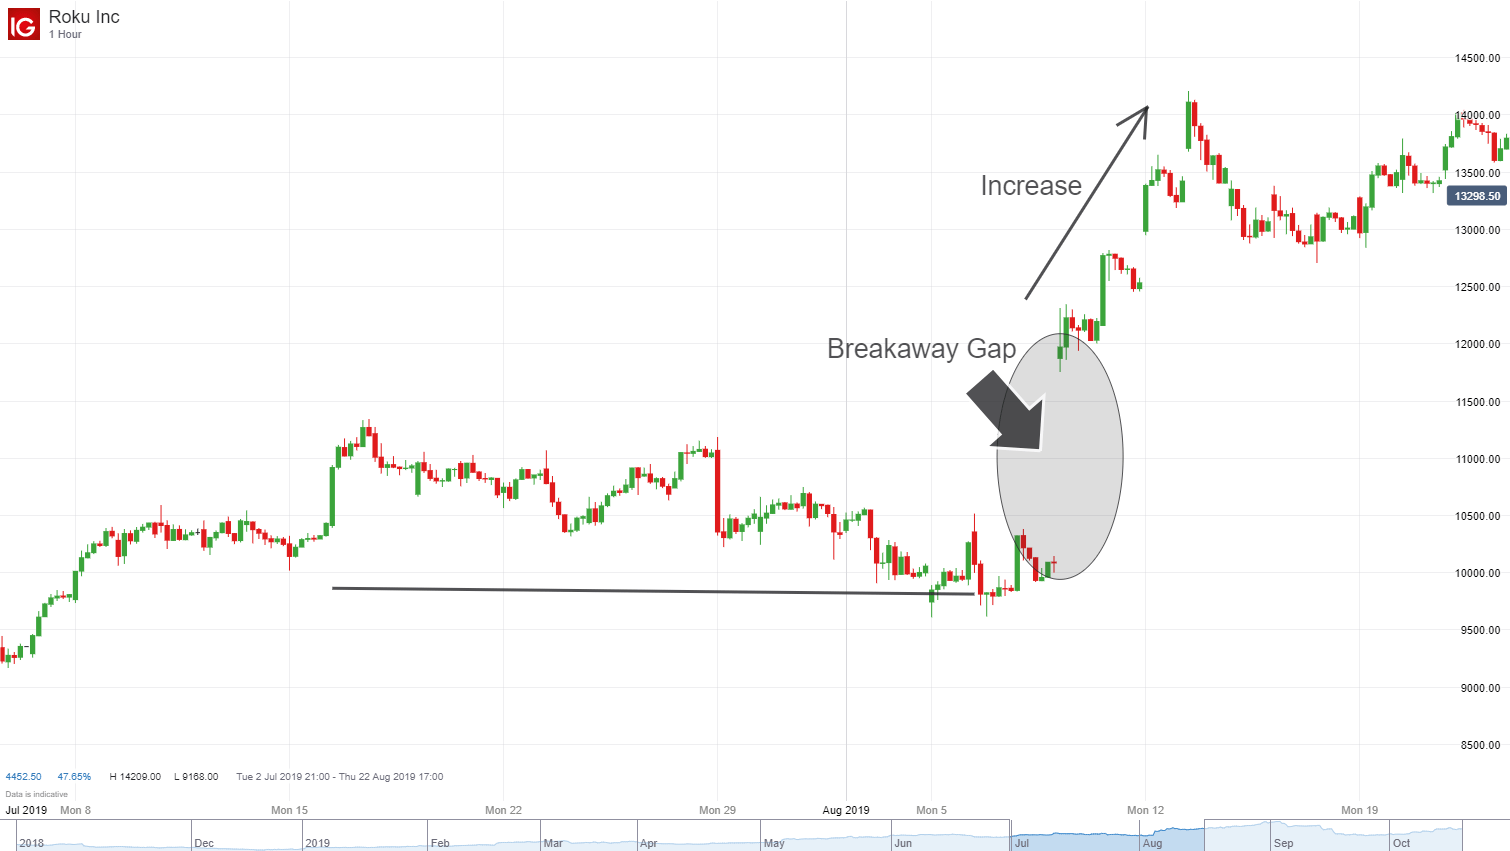
2. Breakway gaps signal a new trend where the asset ‘gaps away’ from the price pattern, as can be seen below where the gap triggers a breakout. If a breakaway gap is accompanied by higher trading volume, it may be worth taking a position long for a breakaway gap up, and short for a breakaway gap down, on the candle following the gap. (see our gap trading example below).

A breakaway gap shown on a candlestick chart

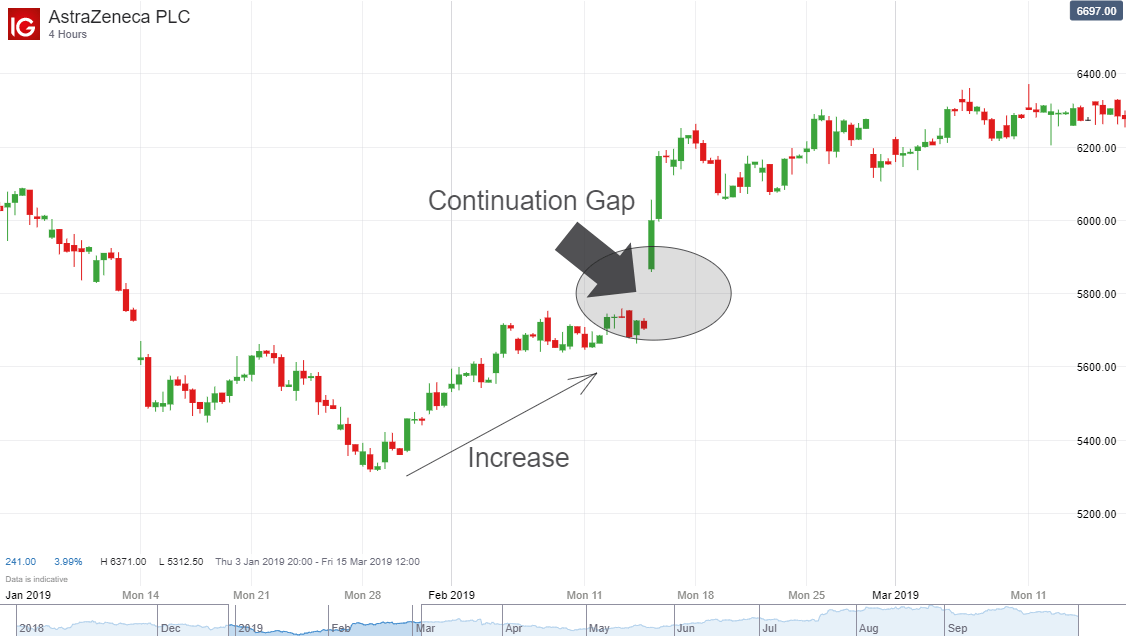
3. Continuation or runaway gaps show an acceleration of an already bullish or bearish pattern in the same direction. This can be caused by a news event that confirms the sentiment and furthers the trend. Traders might look to follow the trend and place a stop just below the gap for a bullish runaway gap and just above for a bearish runaway gap.

A continuation gap shown on a candlestick chart

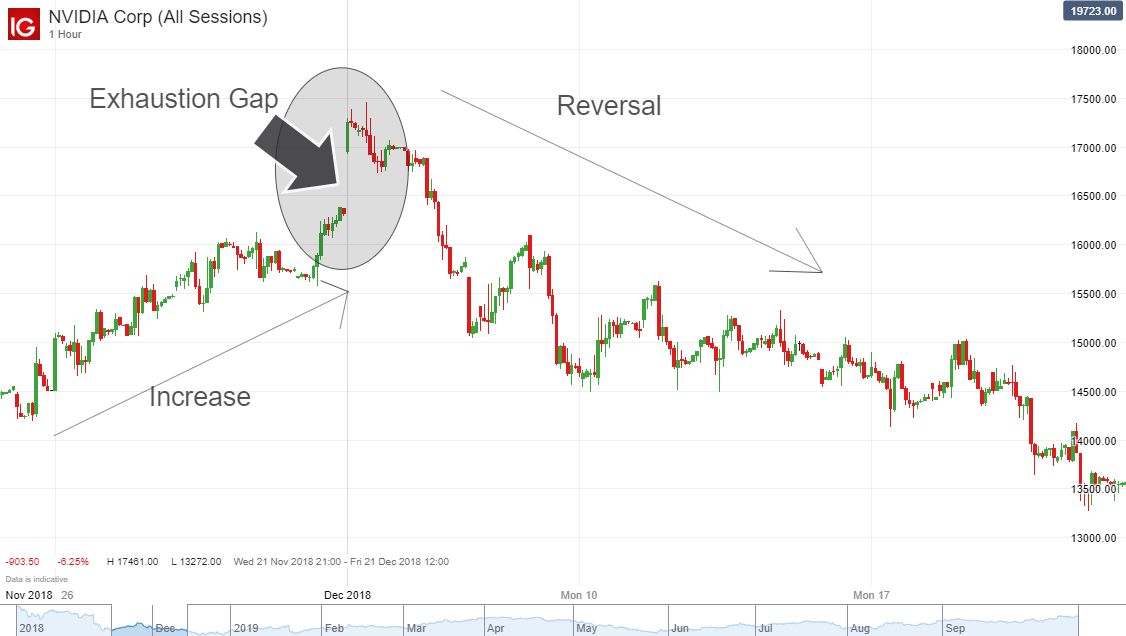
4. Exhaustion gaps are, conversely to continuation gaps, where price makes a final gap in the trend direction, but then reverses. This is often caused by a herd mentality of traders rushing to the trend and moving the stock into overbought territory. Therefore, experienced traders will be watching for the reversal and take the contrary position to the prior trend.

What does it mean when a gap has been ‘filled’?

A gap being ‘filled’ refers to the price returning to the original level before the gap happened. This usually means the price action, in the following days or weeks, retraces to the last day before a gap.

There are a range of factors that come into play with gap fill stocks:

  • Price corrections: An overly optimistic or pessimistic initial spike may invite a correction.
  • Support and resistance isn’t left behind when a price moves up or down sharply.
  • Patterns: Price patterns dictate the likelihood of a gap being filled. For example, price reversals seen with exhaustion gaps are likely to be filled as this type of gap signals the end of a price trend.

Trading the gap: Gap trading strategies & tips

There are a range of gap trading techniques to explore,from fading and predicting gaps to using indicators to help you gauge price action.

Fading the gap

‘Fading the gap’ is when gaps are filled within the trading day they occur. Let’s say a stock gapped up at the open with a higher price than the previous close, on a positive earnings report. Now let’s say, as the day progresses, tradersdelve deeper into the company’s presentation deck, see things they don’t like, and start selling. Eventually, the price hits yesterday’s close, and the gap is filled.

Irrational exuberance from less experienced traders can be particularly advantageous for more seasoned market practitioners when it comes to fading the gap, as the volume that causes the gap is often caused by FOMO in trading .

Predicting a gap

If technical or fundamental factors point to the potential for a gap on the next trading day, it may be time to enter a position. For example, having detailed knowledge of a given company and its operations can help a trader predict a gap for that stock ahead of an earnings report.

Using indicators

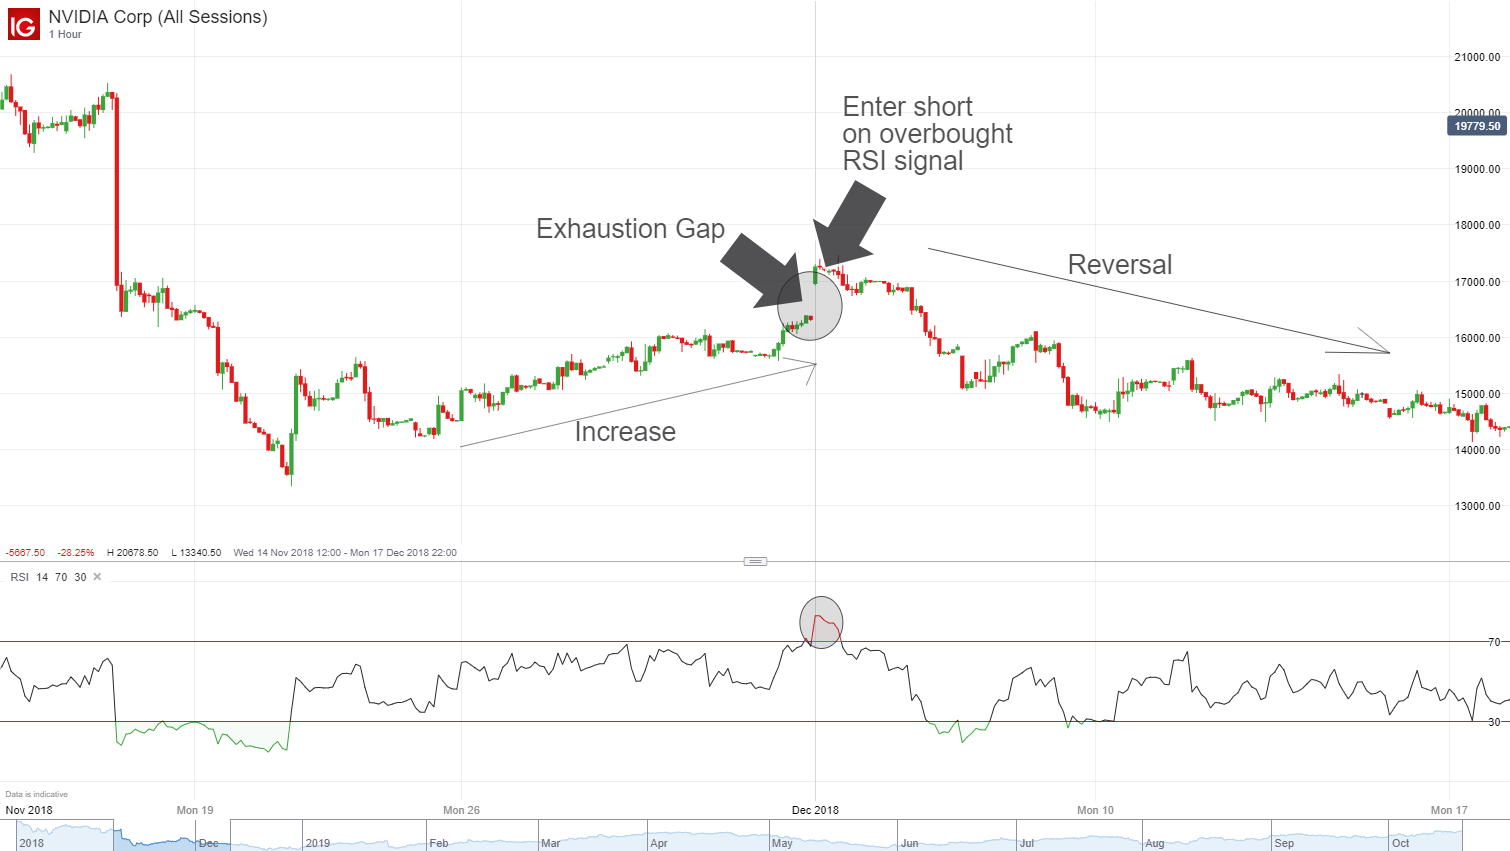
Traders can use tools such as the Exponential Moving Average and RSI to ascertain key price points and inform their decisions. For example, the below chart shows how an overbought RSI signal can be used to enter short after an exhaustion gap.

Chart showing how to trade exhaustion gap

The next chart shows an aggressive approach to the breakaway gap example. It reveals where a long position is entered in response to increased trading volume following the gap, and a possible initial stop loss level to protect against the higher risk.

A more conservative approach to this breakaway gap would be to enter on a pullback , which gives the opportunity to test the gap. While it may offer smaller upside, this approach means traders can get away with a much tighter initial stop loss order.

Chart to show how to trade a breakaway gap

Gap Trading Rules: Key things to consider

  • Classify the gap you are going to play : It’s important to know which of the four types of gap you have identified. A continuation gap will prolong a trend while an exhaustion gap is set to reverse it – two very different outcomes.
  • When a gap has started filling, it will rarely stop due to there often being no immediate support or resistance.
  • Has a move been fueled by amateur or professional investors? Amateur investors may exhibit irrational exuberance that sets up an exhaustion gap, so waiting for the price to start to break before taking a position may be wise.
  • Pay attention to volume. Breakaway gaps normally exhibit high volume (see trading example above) while low volume should occur in exhaustion gaps.
  • Be careful. Trading the gap means trading stock market volatility with low liquidity so caution must be exercised. Read more on trading psychology and using stop loss orders to make sure you’re trading with the right mindset and managing risk properly.
How to Manage the Emotions of Trading

How to Manage the Emotions of Trading

The Importance of Controlling Emotions While Trading

The importance of day trading emotional control cannot be overstated.

Imagine you’ve just taken a trade ahead of Non-Farm Payrolls (NFP) with the expectation that if the reported number is higher than forecasts, you will see the price of EUR/USD increase quickly, enabling you to make a hefty short-term profit.

NFP comes, and just as you had hoped, the number beats forecasts. But for some reason, the price goes down!

You think back to all the analysis you had done, all the reasons that EUR/USD should be going up – and the more you think, the further the price falls.

As you see the red stacking up on your losing position, emotions begin to take over – this is the ‘Fight or Flight’ instinct. This impulse can often prevent us from accomplishing our goals and, for traders, this issue can be very problematic, leading to knee-jerk reactions.

Professional traders don’t want to take the chance that a rash decision will damage their account – they want to make sure that one knee-jerk reaction doesn’t ruin their entire career. It can take a lot of practice, and many trades, to learn how to minimize emotional trading.

The 3 Most Common Emotions Traders Experience

Some of the most common emotions traders experience include fear, nervousness, conviction, excitement, greed and overconfidence.

Fear/Nervousness

A common cause of fear is trading too big. Trading with improper size magnifies volatility unnecessarily and causes you to make mistakes you normally wouldn’t make if you weren’t under the stress of risking larger losses than normal.

Another culprit for fear (or nervousness) is you are in the ‘wrong’ trade, meaning one that doesn’t fit your trading plan.

Conviction/Excitement

Conviction and excitement are key emotions you’ll want to feed off, and you should feel these in every trade you enter. Conviction is the final piece of any good trade, and if you don’t have a level of excitement or conviction then there is a good chance you are not in the ‘right’ trade for you.

By ‘right’ we mean the correct trade according to your trading plan. Good trades can be losers just as bad trades can be winners. The idea is to keep yourself winning and losing on only good trades. Making sure you have conviction on a trade will help ensure this.

Greed/Overconfidence

If you find yourself only wanting to take trades that you deem as possible big winners, you could be getting greedy. Your greed may have been the result of doing well, but if you aren’t careful you may slip and end up in a drawdown.

Always check that you are using proper trade mechanics (i.e. sticking to stops, targets, good risk/management, and good trade set-ups). Sloppy trading as a result of overconfidence can end a strong run.

Forex Vs Stocks: Top Differences & How to Trade Them

Forex Vs Stocks: Top Differences & How to Trade Them

Traders often compare forex vs stocks to determine which market is better to trade. Despite being interconnected, the forex and stock market are vastly different. The forex market has unique characteristics that set it apart from other markets, and in the eyes of many, also make it far more attractive to trade.

When choosing to trade forex or stocks, it often comes down to knowing which trading style suits you best.But knowing the differences and similarities between the stock and forex market also enables traders to make informed trading decisions based on factors such as market conditions, liquidity and volume.

Top 5 Differences between forex and stocks

The table below summarizes a few key differences between the forex market and the stock market:

Forex Market Stock Market
Large volume- Around $5 Trillion per day Less volume – Roughly $200 billion per day
Highly Liquid Less liquid
24 Hour Markets 8 Hour Markets
Minimal or no commissions Commissions
Narrow Focus Wide Focus

Let’s take a more in-depth look into how exactly the forex market compares with equities (stocks).

1) Volume

One of the biggest differences between forex and stocks is the sheer size of the forex market. Forex is estimated to trade around $5 trillion a day, with most trading concentrated on a few major pairs like the EUR/USD, USD/JPY, GBP/USD and AUD/USD. The forex market volume dwarfs the dollar volume of all the world’s stock markets combined, which average roughly $200 billion per day.

Having such a large trading volume can bring many advantages to traders. High volume means traders can typically get their orders executed more easily and closer to the prices they want. While all markets are prone to gaps, having more liquidity at each pricing point better equips traders to enter and exit the market.

2) Liquidity

A market that trades in high volume generally has high liquidity. Liquidity leads to tighter spreads and lower transaction costs. Forex major pairs typically have extremely low spreads and transactions costs when compared to stocks and this is one of the major advantages of trading the forex market versus trading the stock market. Read more on the differences in liquidity between the forex and stock market.

3) 24 Hour Markets

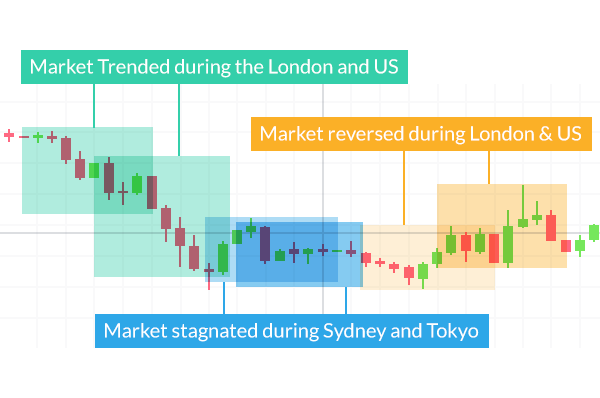
Forex is an over the counter market meaning that it is not transacted over a traditional exchange. Trading is facilitated through the interbank market. This means that trading can go on all around the world during different countries business hours and trading sessions. Therefore, the forex trader has access to trading virtually 24 hours a day, 5 days a week. Major stock indices on the other hand, trade at different times and are affected by different variables. Visit the Major Indices page to find out more about trading these markets-including information on trading hours.

Forex market trading sessions highlighted4) Minimal or no commission

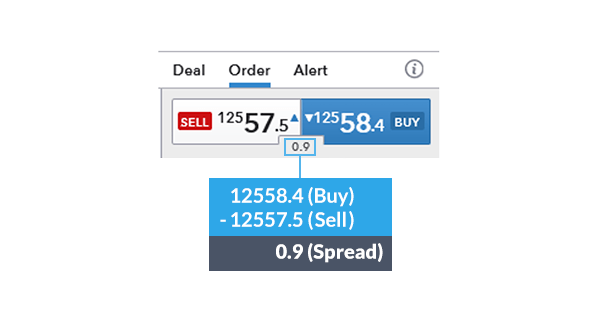
Most forex brokers charge no commission, instead they make their margin on the spread – which is the difference between the buy price and the sell price. When trading equities (stocks) or a futures contract, or a major index like the S&P 500, often traders must pay the spread along with a commission to a broker.

Forex spreads are quite transparent compared to costs of trading other contracts. Below you will see the spread of the EUR/USD highlighted inside of the executable dealing rates. The spread can be used to calculate the cost for your position size upfront prior to execution.

Deal ticket showing spread cost of forex pair, EURUSD5) Narrow focus vs wide focus

There are eight major currencies traders can focus on, while in the stock universe there are thousands. With only eight economies to focus on and since forex is traded in pairs, traders will look for diverging and converging trends between the currencies to match up a forex pair to trade. Eight currencies are easier to keep an eye on than thousands of stocks.

The variables that effect the major currencies can be easily monitored using an economic calendar.

Should you trade forex or stocks?

Whether you choose to trade forex or stocks depends greatly on your goals and preferred trading style.

The table below shows different types of trading styles, including the pros and cons of each when trading forex and stocks.

Type of Trader Definition Advantages Disadvantages Forex vs Stocks
Short- Term (Scalping) A trading style where the trader looks to open and close trades within minutes, taking advantage of small price movements. Traders can focus more on volatility and less on fundamental variables that move the market. As a result of placing more trades, beginner traders may lose more money if their strategy isn’t fine-tuned. Suited to forex trading due to inexpensive costs of executing positions. Some exchanges require large capital account balances to trade. Most forex brokers only require you to have enough capital to sustain the margin requirements.
Medium-Term A trading style where the trader looks to hold positions for one or more days, where the trades are often initiated due to technical reasons. Lower capital requirements compared with other styles because a trader is looking for larger moves. Trades must be accompanies with analysis which may take time. Suited to trading forex and stocks.
Long-Term A trading style where a trader looks to hold positions for months or years, often basing decisions on long-term fundamental factors. Traders do not have to spend as much time analysing. Large capital requirements required to cover volatile movements. Suited more to stock trading because the forex market tends to vary in direction more than stocks.


US Dollar Price Forecast: DXY Rises to 103.65 After Fed Hold; BOE Policy Ahead

US Dollar Price Forecast: DXY Rises to 103.65 After Fed Hold; BOE Policy Ahead

US Dollar Strengthens; Eyes on BOE’s Rates 

The US Dollar is currently exhibiting bullish behavior, trading around 103.650 with an uptick of 0.13%. Recent events have seen the ADP Non-Farm Employment Change report lower figures than expected at 107K against the forecast of 148K, juxtaposed with a steady Federal Funds Rate maintained at 5.50%.

In contrast, the EUR zone witnessed a slight uptick in the German Prelim CPI month-over-month, recording a 0.2% increase, indicative of subtle inflationary pressures.

Events Ahead

For the US, Unemployment Claims are forecasted at 213K, closely followed by the ISM Manufacturing PMI and Prices, expected at 47.2 and 46.0, respectively, painting a mixed picture of the manufacturing sector’s health and pricing pressures.

In the Eurozone, attention pivots towards ECB President Lagarde’s speech and critical inflation data with the Core CPI Flash Estimate year-over-year forecasted at 3.2%, and the CPI Flash Estimate at 2.7%, potentially signaling inflation trends and monetary policy directions.

US Dollar Index (DXY)

Dollar Index
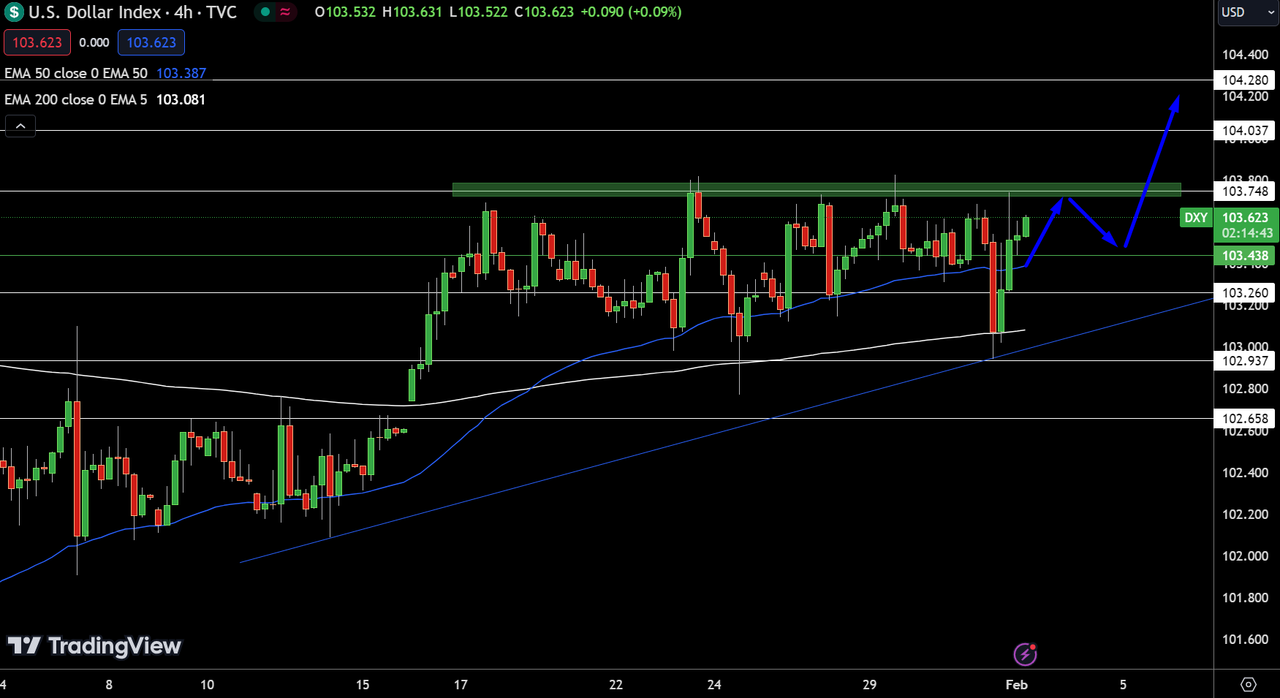
Dollar IndexOn February 1, the Dollar Index’s pivot point stands at 103.438, suggesting potential shifts in trading dynamics. Resistance levels are set at 103.748, 104.037, and 104.280, challenging upward movement.

Conversely, immediate support at 103.260 and further support at 102.937 and 102.658 offer buffers against declines. The 50-day and 200-day EMAs at 103.387 and 103.081, respectively, hint at a bullish sentiment.

The observation of a triple top pattern near the 103.748 level indicates strong resistance, with a breakout potentially leading to further gains. Thus, the Dollar Index’s trend appears bullish above 103.438, suggesting an optimistic outlook for the near term.

EUR/USD Technical Forecast

EUR/USD Price Chart - Source: Tradingview
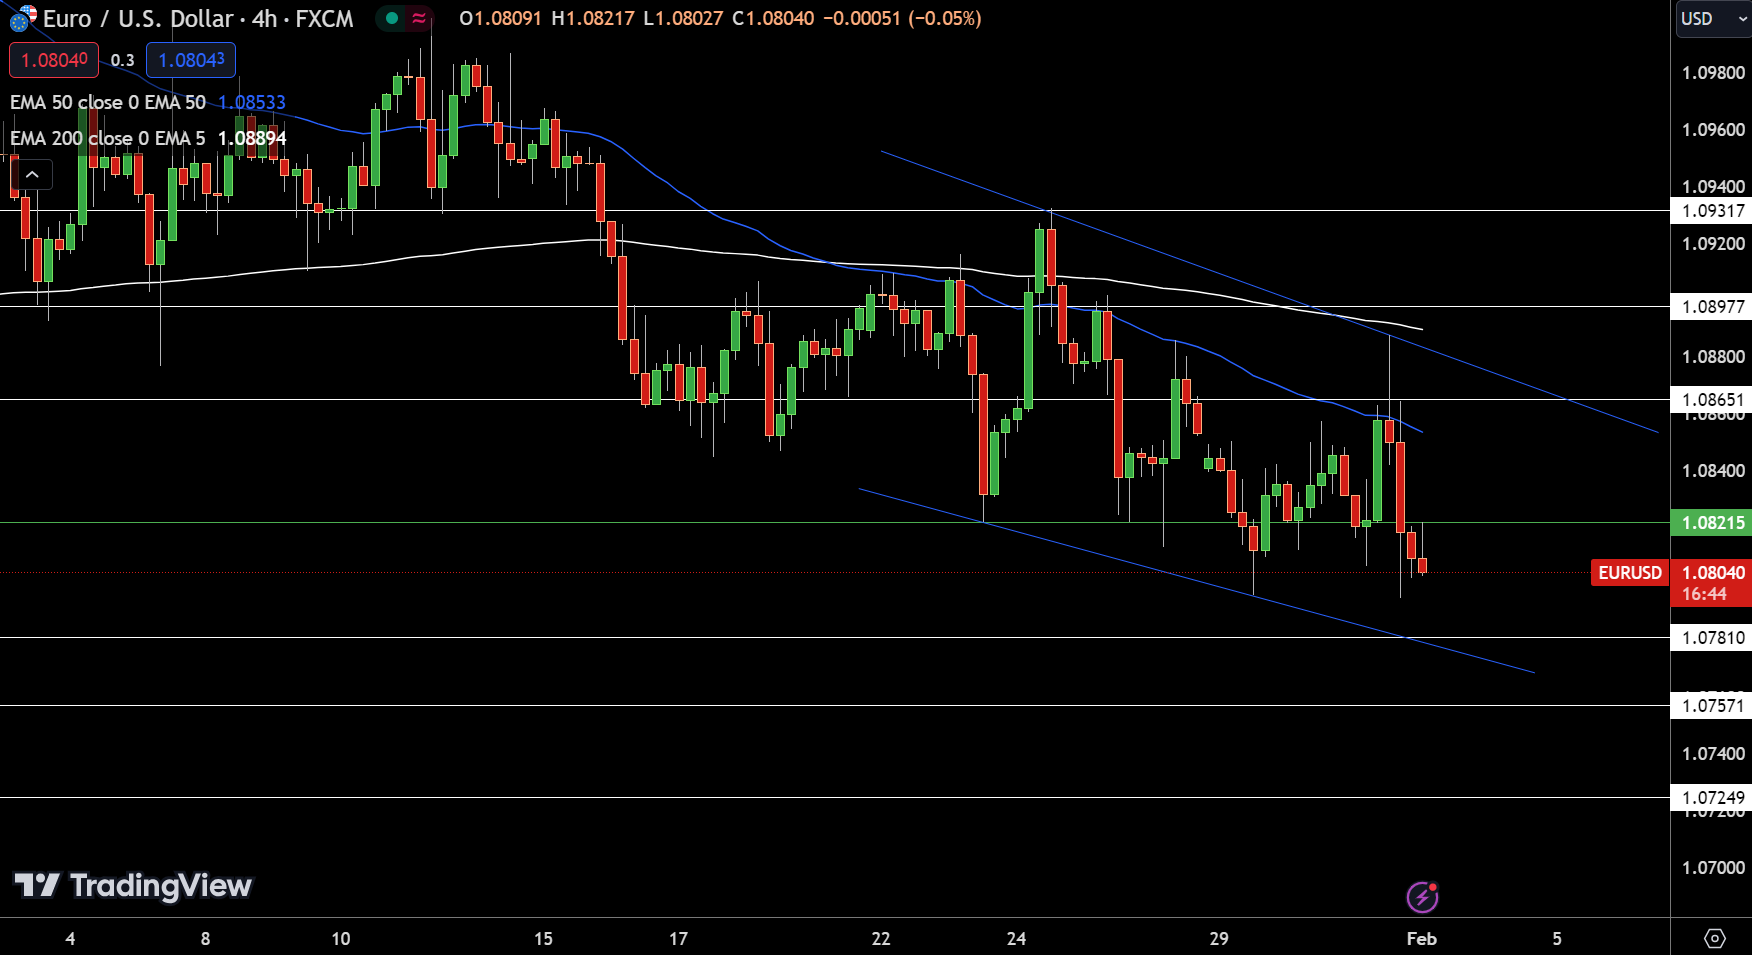
EUR/USD Price Chart – Source: TradingviewOn February 1st, the EUR/USD pair is trading at 1.08044, marking a slight decline of 0.12% within a 24-hour frame. The currency pair’s technical outlook reveals a critical pivot point at 1.08215, setting the stage for upcoming trading dynamics. Resistance levels are identified at 1.08651, 1.08977, and 1.09317, potentially challenging upward movements.

Conversely, immediate support at 1.07810, followed by 1.07571 and 1.07249, underscores the lower boundaries that could stabilize or further pressurize the pair. The 50-day and 200-day Exponential Moving Averages (EMAs) at 1.08533 and 1.08894, respectively, currently act as ceilings for the price, hinting at a bearish sentiment.

The presence of bearish engulfing candlestick patterns below both EMAs further supports the likelihood of a continuing downtrend. Given these observations, the EUR/USD’s trajectory appears bearish below the pivot point of 1.08215, suggesting a cautious approach for traders eyeing potential entry and exit points.

GBP/USD Technical Forecast

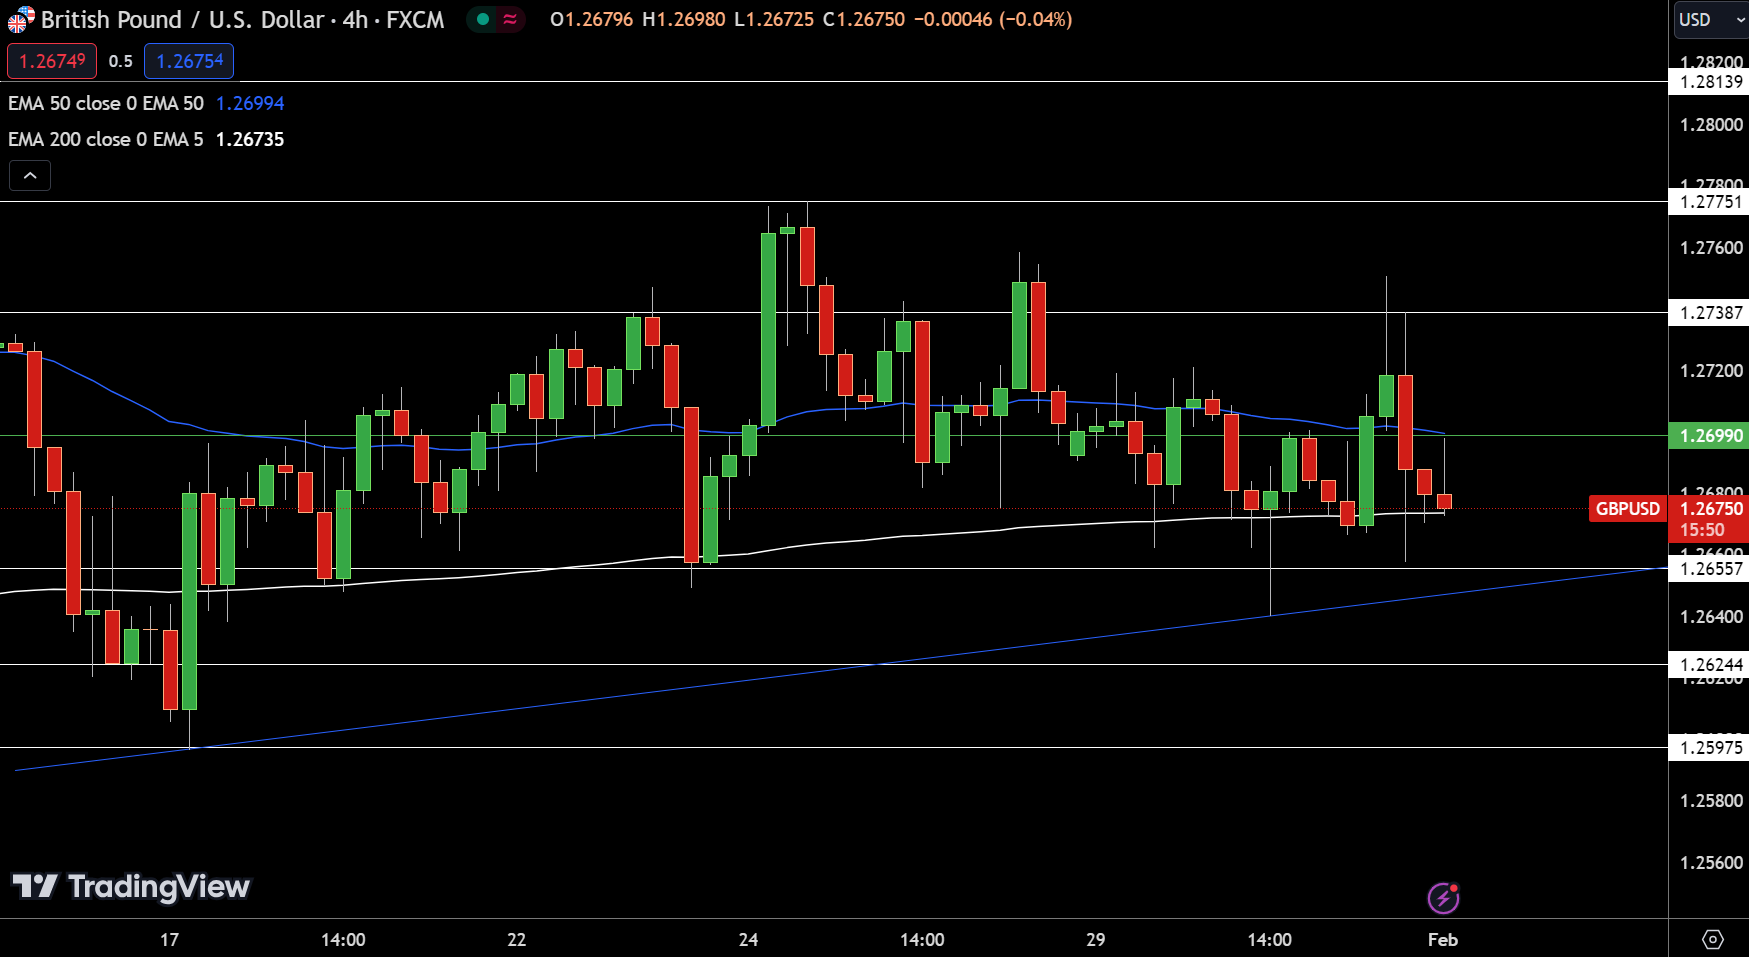
GBP/USD Price Chart - Source: Tradingview
GBP/USD Price Chart – Source: TradingviewOn February 1st, the GBP/USD pair is observed at 1.26732, experiencing a modest decline of 0.12%. The technical landscape for this currency pair is defined by a pivotal point at 1.26990, guiding the day’s trading sentiment. Resistance levels are strategically placed at 1.27387, 1.27751, and 1.28139, delineating potential hurdles for upward price action.

Conversely, support is established at 1.26557, with subsequent levels at 1.26244 and 1.25975 offering a cushion against further declines. The 50-day and 200-day Exponential Moving Averages (EMAs) at 1.26994 and 1.26735, respectively, hover around the current price, suggesting a tight trading range. The GBP/USD’s ongoing consolidation between 1.2740 and 1.2650 indicates a cautious market approach.

In summary, the GBP/USD exhibits a bearish bias below the pivot point of 1.26990, underscoring a need for vigilance among traders watching for a potential shift in momentum.