China Caixin Manufacturing PMI Holds at 50.8 in January Despite Stimulus

China Caixin Manufacturing PMI Holds at 50.8 in January Despite Stimulus

China Manufacturing Sector Crawls into January

On Thursday, the Chinese economy was under the spotlight. Disappointing NBS private sector PMI numbers for January impacted riskier assets on Tuesday. However, the Caixin Manufacturing PMI has more weight.

The Caixin Manufacturing PMI remained at 50.8 in January. Economists forecast a decline to 50.6. According to the January survey,

  • New business increased at the least marked pace since October 2023.
  • Overseas demand rose for the first time since June 2023, albeit marginally.
  • Manufacturers responded to the pickup in overseas demand, ramping up purchasing activity.
  • Firms reduced workforce numbers, though the rate of decline was the weakest in five months.
  • Input prices increased moderately while the competitive landscape impacted factory gate prices.
  • Nonetheless, business confidence for the next 12 months was the most marked in nine months.

January Survey Takeaways

Weaker domestic demand may raise concerns considering stimulus measures from Beijing to bolster the economy. Despite a moderate pickup in demand from overseas, factory gate price trends continued to paint a deflationary backdrop.

The Aussie Dollar Reaction to the Caixin Manufacturing PMI

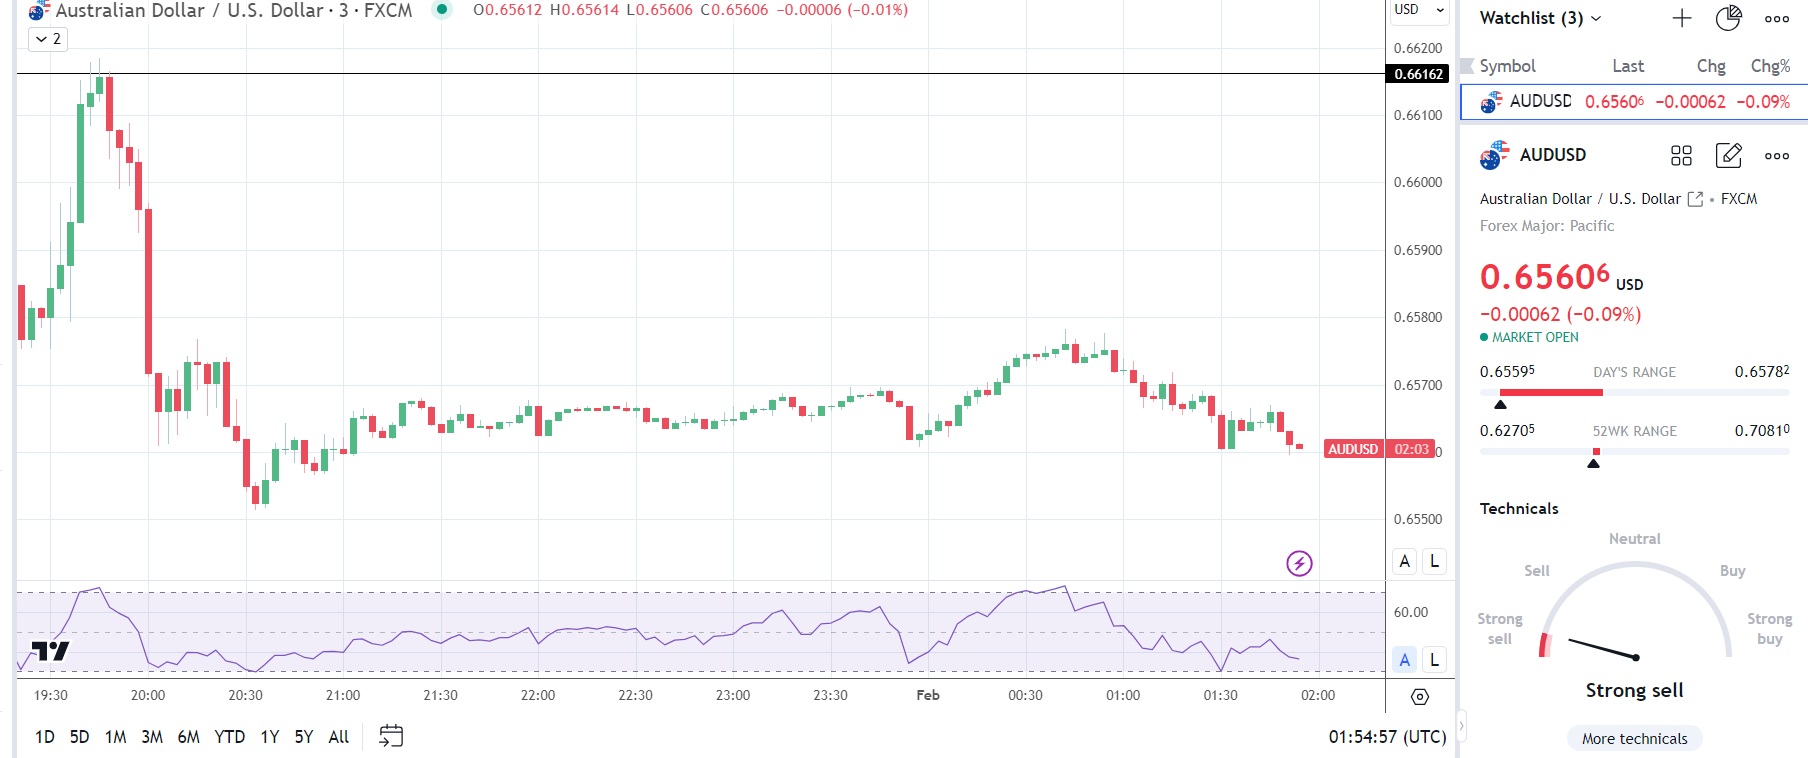
Before the PMI numbers, the AUD/USD rose to a high of $0.65782 before falling to a low of $0.65603.

However, in response to the PMI data, the AUD/USD rose to a high of $0.65670 before falling to a low of $0.65595.

On Thursday, the AUD/USD was down 0.09% to $0.65606.

AUD to USD retreats on release of China Caixin Manufacturing PMI.
010224 AUDUSD 3 Minute Chart

Up Next

US Manufacturing PMIs and US labor market data will draw investor interest. However, the labor market data would likely warrant more investor attention before the US Jobs Report (Fri). Tight labor market conditions support wage growth, fueling consumer spending and demand-driven inflation.

Economists forecast unit labor costs to increase by 1.6% quarter-on-quarter in Q4 2023 after falling by 1.2% in Q3 2023. Economists predict nonfarm productivity to increase by 2.5% in Q4 after rising by 5.2% in Q3. Significantly, economists expect initial jobless claims to fall from 214k to 212k in the week ending January 27

Meta Stock Price at Record High Ahead of Earnings

Meta Stock Price at Record High Ahead of Earnings

How has Meta performed?

​The tech giant saw a staggering 194% jump in its stock price in 2023, a testament to the company’s robust performance in key areas such as user growth, engagement, and monetization—all achieved with a leaner operation.

​The surge in Meta’s stock can primarily be attributed to significant improvements in user engagement. The company’s platforms have seen a consistent increase in active users, which translates to a wider audience for advertisers to target. This growth in user base is a clear indicator that the company continues to innovate and remain relevant in the ever-changing social media landscape.

​Furthermore, Meta’s monetization strategies have proven to be highly effective. One of the key drivers of this success has been the company’s focus on Reels, its short-form video feature that competes with the likes of TikTok. Reels have not only captured the attention of users but also that of advertisers. The increasing attraction of advertisers to this feature suggests that Meta has successfully created a new revenue stream that is likely to have a positive impact on its advertising revenue, especially after a period of neutral and even negative impacts in previous quarters.

​Another factor contributing to Meta’s success is its investment in data analytics, campaign planning, and measurement tools powered by artificial intelligence (AI). These advanced tools enable advertisers to target their campaigns more effectively, ensuring better returns on investment.

​An important aspect of the trading landscape is the pricing of ads. Data indicates that ad prices have seen an increase from the previous year, which is a positive sign for social media companies like Meta. Higher ad prices can lead to increased revenue, which in turn can drive stock prices up.

​However, traders should always be aware of the broader economic context in which companies operate. While Meta’s performance has been strong, forecasts by entities like Morningstar suggest a deceleration in revenue growth in 2024. As the transition from traditional to digital advertising nears completion, the explosive growth rates seen in recent years may not be sustainable. Additionally, projections of a slowdown in U.S. economic growth in 2024 could impact advertising budgets and, consequently, Meta’s revenue.

​On the operational front, Meta has indicated a slowdown in hiring. This strategic decision aligns with the company’s efforts to boost efficiency and productivity among its existing workforce rather than expanding headcount significantly.

​Analyst ratings for Meta

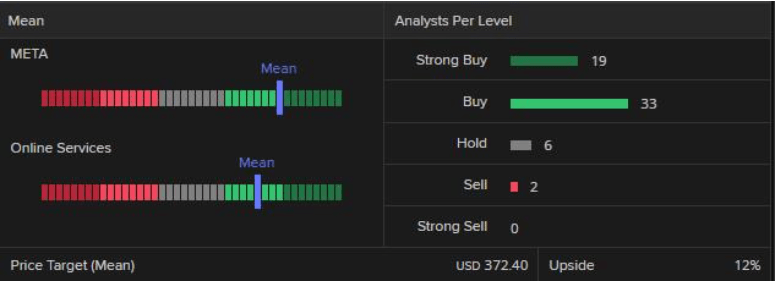
​Refinitiv data show a consensus analyst rating of ‘buy’ for Meta with 19 strong buys, 33 buys, 7 holds, and 2 sells – and a mean of estimates suggesting a long-term price target of $372.40 for the share, roughly 3% higher than the current price (as of 22 January 2024).

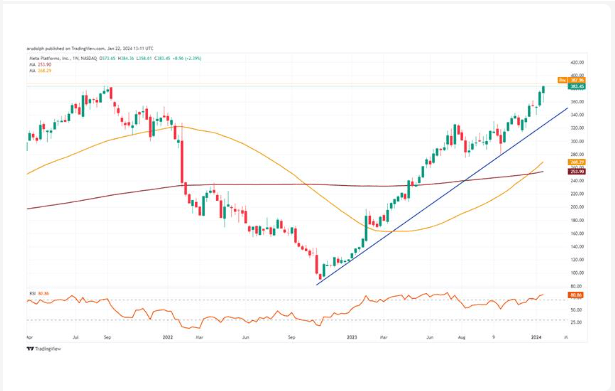
​Meta’s share price is in the process of making a new record high by overcoming its August 2021 peak at $384.33, a rise and weekly chart close above which would engage the minor psychological $400 mark.

​Meta Weekly Candlestick Chart

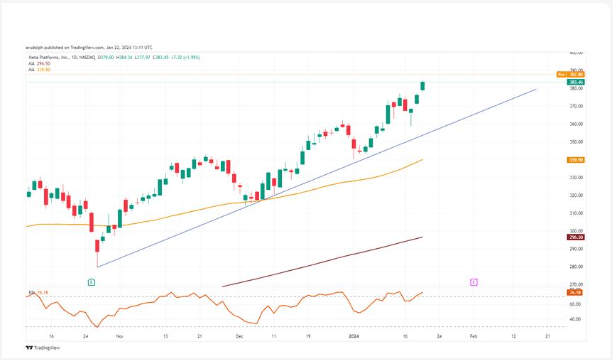
​The Meta share price is on track for its third straight week of gains with it retaining a strongly bullish outlook while it remains above its last reaction low, a low on the daily candlestick chart which is lower than the one on the preceding and the following days. This was made at $358.61 on Wednesday the 17 January.

​Meta Daily Candlestick Chart

​The fact that the Meta share price gapped higher twice since last Wednesday is positive for the bulls as it shows how strong the buying pressure currently is.

​While the October-to-January uptrend line at $353.51 and, more importantly, the second-to-last reaction low on the 2 of January at $340.01 underpin, the current medium-term bullish outlook remains in play.

US Dollar Looks to Jobs Data After Fed; Setups on Gold, EUR/USD, USD/JPY, GBP/USD

US Dollar Looks to Jobs Data After Fed; Setups on Gold, EUR/USD, USD/JPY, GBP/USD

The Federal Reserve on Wednesday concluded its first monetary policy meeting of the year, voting to maintain borrowing costs unchanged at their present 5.25% to 5.50% range, in a decision widely expected by market participants.

The FOMC also dropped its tightening bias, but signaled that it is not yet ready to ease its stance imminently. Powell went further during his post-meeting press conference, admitting that policymakers may not be confident enough to slash the cost of money at their next gathering.

With the likelihood of a March cut appearing slim at the moment, the U.S. dollar may have room to rebound in the near term, but the recovery thesis depends on incoming information showing that the economy continues to perform well. In the absence of good data, a March move is still a possibility.
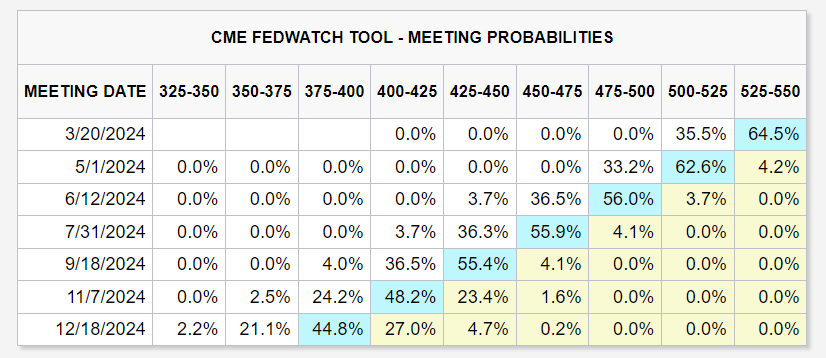
image1.png

In the current context, the December U.S. nonfarm payrolls report will take on added significance. In terms of estimates, U.S. employers are forecast to have added 180,000 jobs last month, though the weakness in the ADP and several PMI surveys for the same period argue for a softer print.

Want to know if the U.S. dollar will rally or lose ground in the coming months? Find all the answers in our Q1 trading forecast. Grab your copy now!

UPCOMING US JOBS REPORT
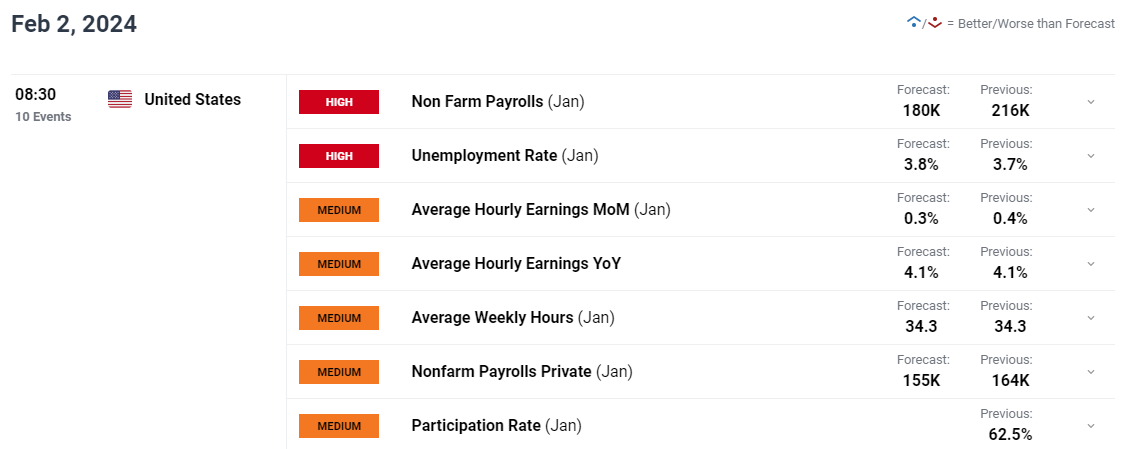
image2.png

If job growth surprises to the downside by a wide margin, a March rate cut could reenter the picture. This would exert downward pressure on Treasury yields and the U.S. dollar, but should support gold prices and other precious metals, including silver.

Conversely, if NFP numbers beat expectations and come on the strong side, we could see further unwinding of dovish bets on the Fed’s policy path – a bullish outcome for yields and the greenback. Gold, however, would not fare well in this scenario.

Interested in learning how retail positioning can offer clues about gold’s directional bias? Our sentiment guide contains valuable insights into market psychology as a trend indicator. Download it now!

GOLD PRICE TECHNICAL ANALYSIS

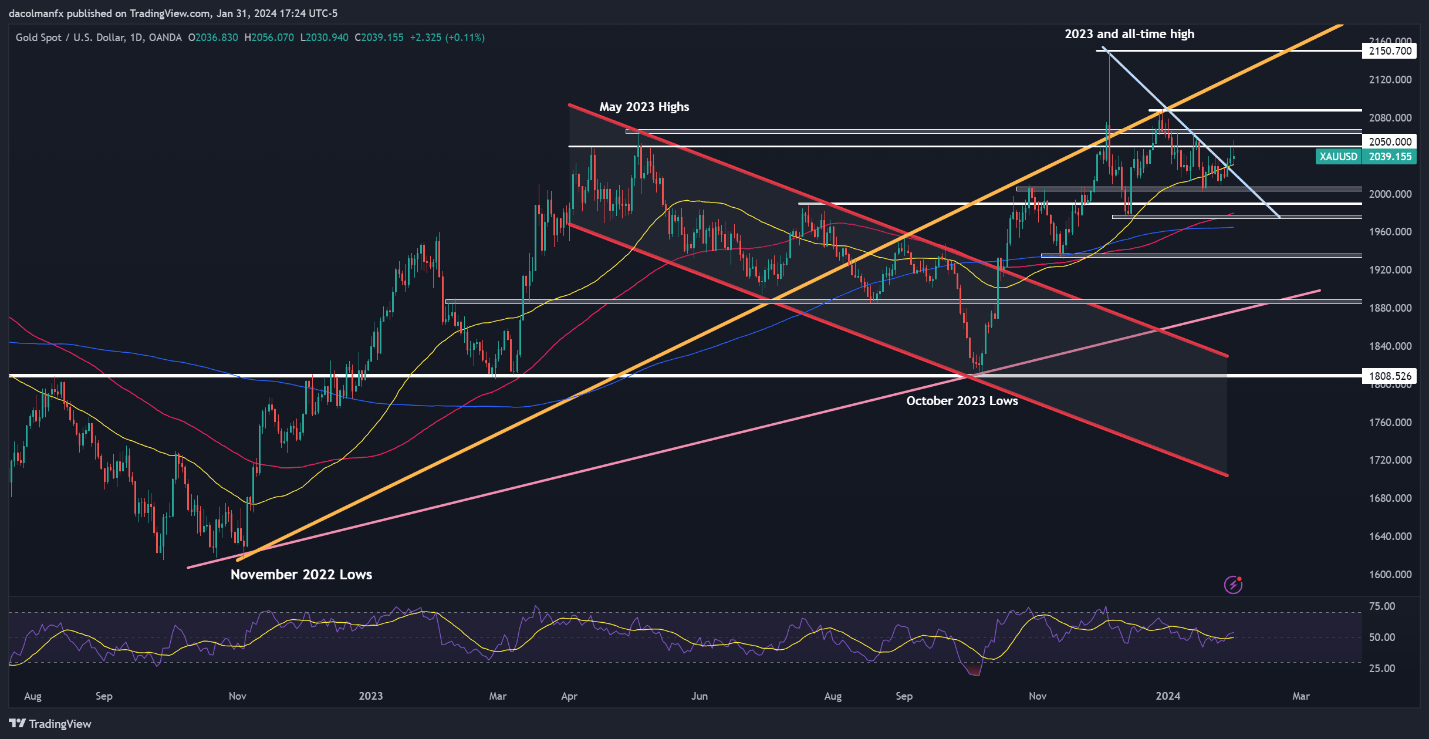
Gold inched higher on Wednesday but failed to clear resistance at $2,050, with prices pulling back after testing this area. It’s too early to determine if this technical ceiling will hold, but in case it does, XAU/USD may retreat towards $2,005. On further weakness, a move towards $1,990 could materialize.

In contrast, if bulls regain decisive control of the market and manage to drive prices decisively above $2,050, buying momentum could gather pace, setting the stage for a possible rally towards $2,065. Above this pivotal level, all eyes will be on $2,065—the highs from late December.

GOLD PRICE TECHNICAL CHART
A screen shot of a graph  Description automatically generated

EUR/USD TECHNICAL ANALYSIS

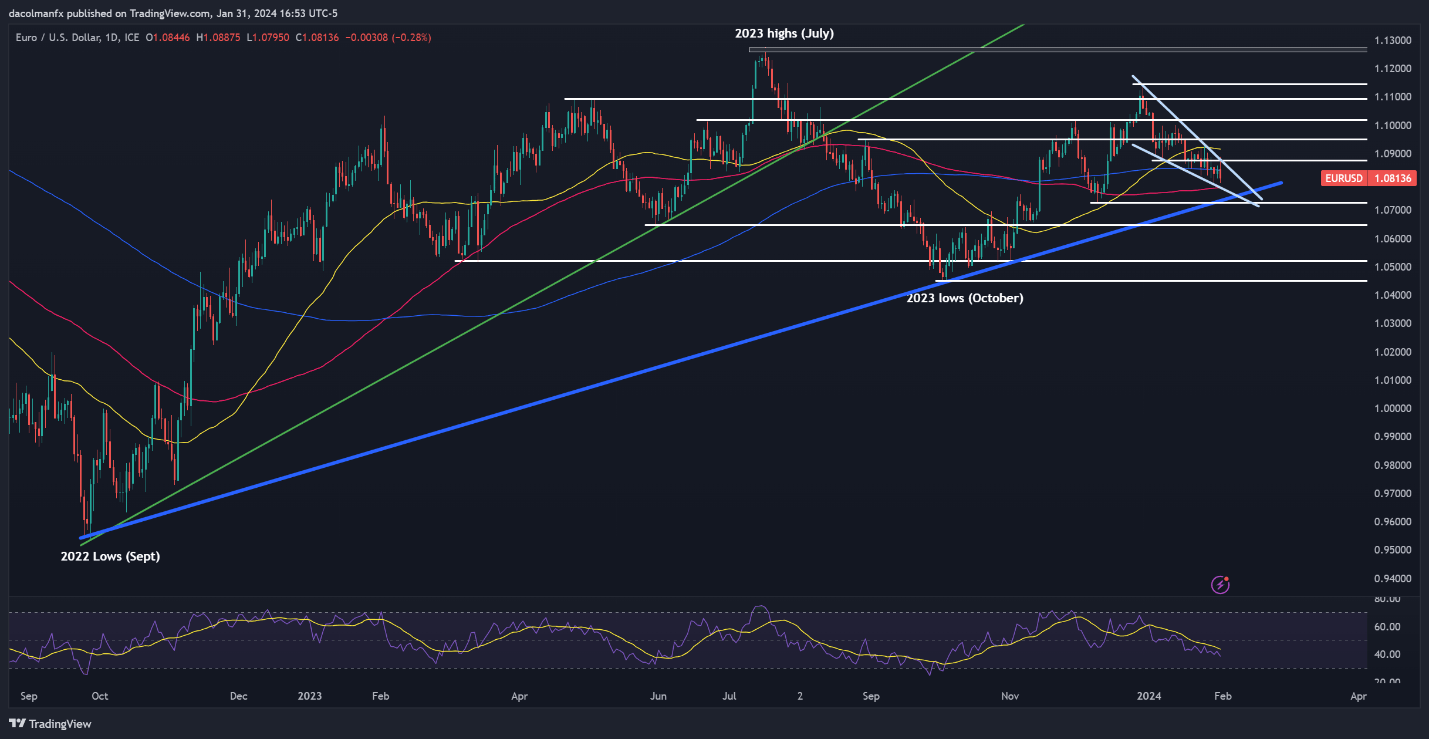
EUR/USD has declined sharply recently, guided lower by the upper boundary of a falling wedge—a bullish pattern. To confirm this technical setup, prices must take out resistance at 1.0870. Such a scenario could usher in a rally toward the 50-day simple moving average at 1.0920, with the next target at 1.0950.

Conversely, if EUR/USD deepens losses, initial support looms at 1.0780, followed by 1.0730, an important floor created by a long-term ascending trendline in play since September 2022. Vigilant defense of this zone by the bulls is imperative; any failure to protect this barrier may trigger a drop toward 1.0650.

EUR/USD TECHNICAL CHART
A screen shot of a graph  Description automatically generated

EUR/USD Chart Created Using TradingView

Curious about the correlation between retail positioning and USD/JPY’s short-term path? Discover all the insights in our sentiment guide. Request a free copy now!

USD/JPY TECHNICAL ANALYSIS

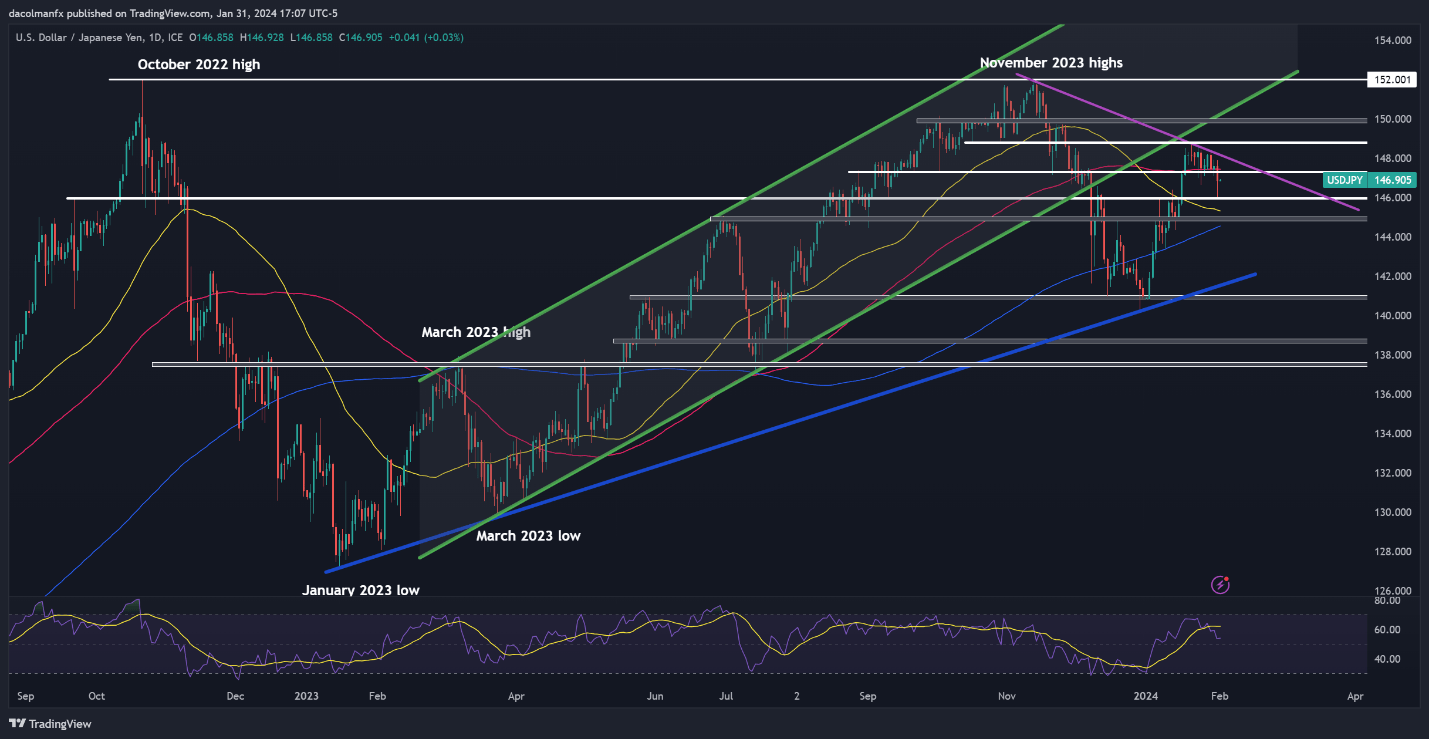
After a positive performance on Tuesday, USD/JPY changed course and slipped beneath the 100-day SMA at 147.40, signaling a bearish shift for the pair. If the retreat continues later this week, support is seen at 146.00. Below that, all eyes will be on the 50-day simple moving average.

On the other hand, if the bulls reemerge and trigger a meaningful rebound, the first technical barrier against further advances is located at 147.40. Beyond that, the next hurdle for the bullish camp will be trendline resistance at 148.00. Further up, the focus will be on 148.80.

USD/JPY TECHNICAL CHART
A screenshot of a computer screen  Description automatically generated

GBP/USD TECHNICAL ANALYSIS

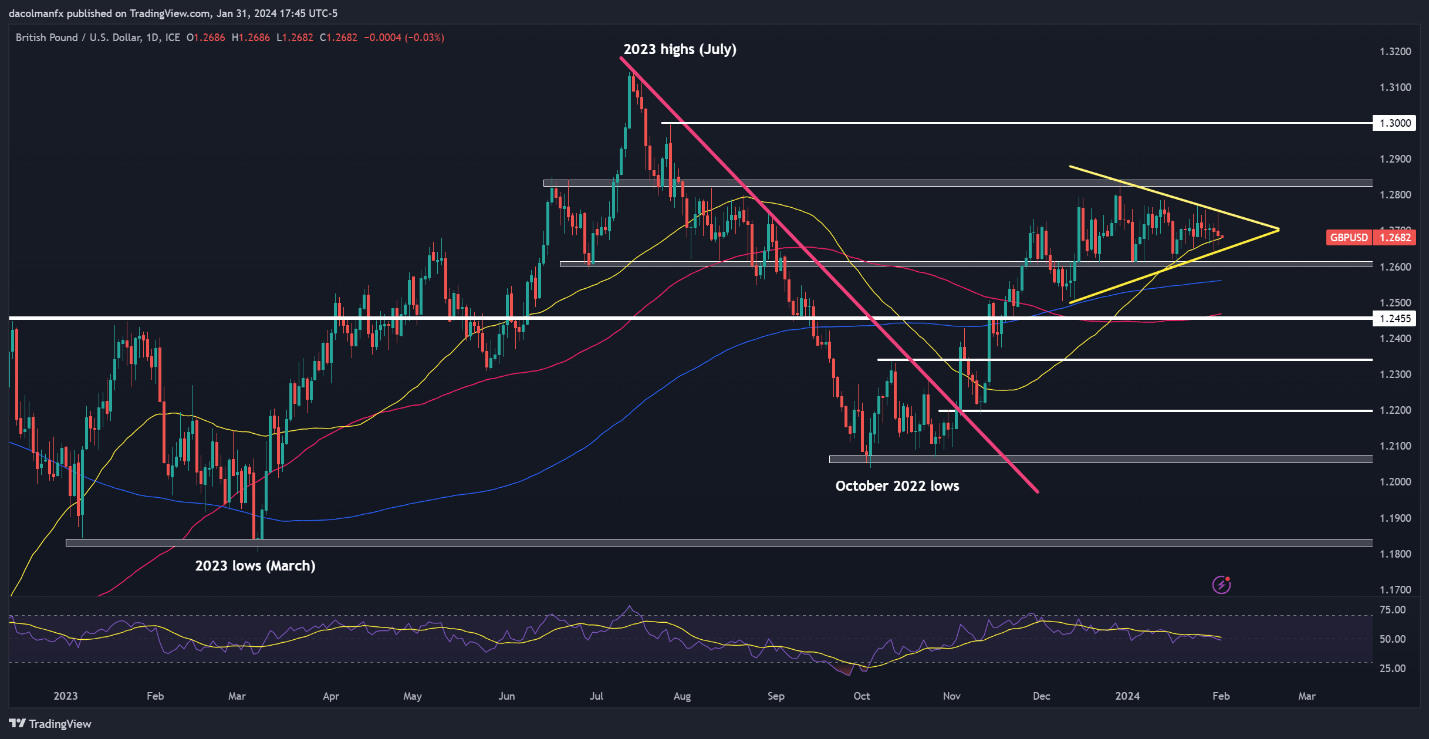
Over the past few weeks, GBP/USD has been consolidating within a symmetrical triangle- a continuation pattern composed of two converging trendlines: an ascending one connecting a sequence of higher highs and a descending one linking a series of lower lows.

The symmetrical triangle is validated once prices of the underlying asset move outside the boundaries of the geometric shape, with the confirmation signal carrying greater strength if the break happens in the direction of the broader trend.

In the case of GBP/USD, traders should watch two areas: resistance at 1.2750 and support at 1.2645. If support gives way, the bearish camp will likely focus on 1.2600, 1.2550 and 1.2455. On the flip side, if resistance is taken out, bulls may set their sights on 1.2830 and possibly even 1.3000.

GBP/USD TECHNICAL CHART
A screen shot of a graph  Description automatically generated


Morning Star Candlestick: A Forex Trader’s Guide

Morning Star Candlestick: A Forex Trader’s Guide

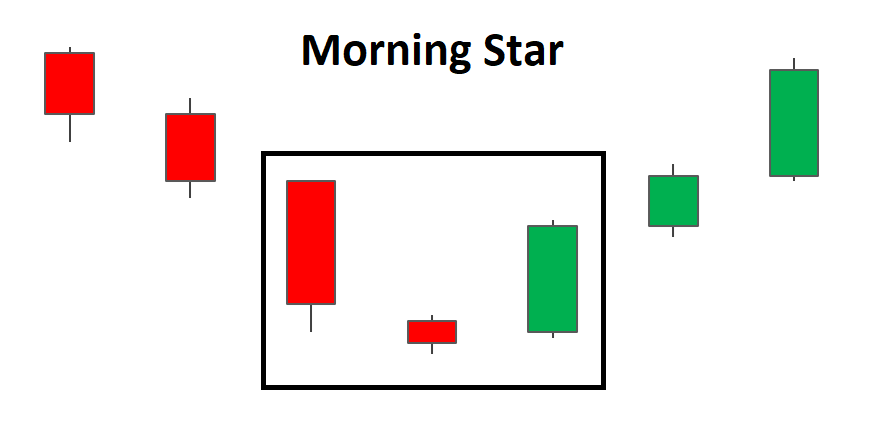
The Morning Star candlestick is a three-candle pattern that signals a reversal in the market and can be used when trading forex or any other market. Correctly spotting reversals is crucial when trading financial markets because it allows traders to enter at attractive levels at the very start of a possible trend reversal.

This article explores the following talking points:

  • What is a Morning Star candlestick?
  • How to Identify a Morning Star on forex charts
  • How to trade the Morning Star pattern
  • How reliable is the Morning Star in forex trading?

What is a Morning Star Candlestick?

The Morning Star pattern is a three-candle, bullish reversal candlestick pattern that appears at the bottom of a downtrend. It reveals a slowing down of downward momentum before a large bullish move lays the foundation for a new uptrend.

Morning Star pattern

Morning Star Doji

Traders will often look for signs of indecision in the market where selling pressure subsides and leaves the market somewhat flat. This is where Doji candles can be observed as the market opens and closes at the same level or very close to the same level. This indecision paves the way for a bullish move as bulls see value at this level and prevent further selling. The appearance of the bullish candle after the Doji provides this bullish confirmation.

Morning Star Doji

What about the Evening Star?

The bearish version of the Morning Star is the evening star and it signifies a potential turning point in a rising market ( bearish reversal pattern). The same analysis applied to the Morning Star can be implemented with the evening star however, it will be the opposite direction.

How to identify a Morning Star on Forex Charts

Identifying the Morning Star on forex charts involves more than simply identifying the three main candles. What is required, is an understanding of previous price action and where the pattern appears within the existing trend.

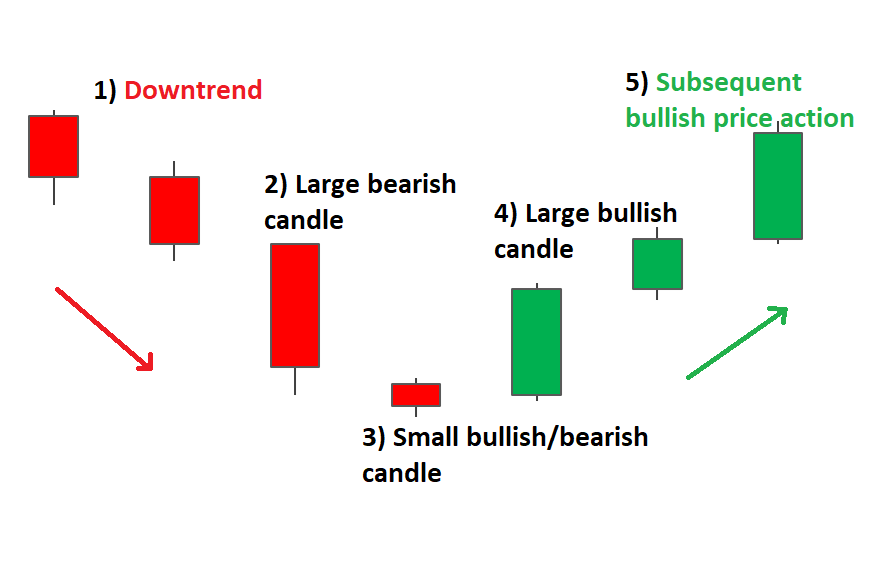
  1. Establish an existing downtrend: The market should be exhibiting lower highs and lower lows.
  2. Large bearish candle: The large bearish candle is the result of large selling pressure and a continuation of the existing downtrend. At this point traders should only be looking for short trades as there is no evidence of a reversal yet.
  3. Small bearish/bullish candle: The second candle is a small candle – sometimes a Doji candle – that presents the first sign of a fatigued downtrend. Often this candle gaps lower as it makes a lower low. It does not matter if the candle is bearish or bullish as the main takeaway here is that the market is somewhat undecided.
  4. Large bullish candle: The first real sign of new buying pressure is revealed in this candle. In non forex markets, this candle gaps up from the close of the previous candle and signals the start of a new uptrend.
  5. Subsequent price action: After a successful reversal, traders will observe higher highs and higher lows but should always manage the risk of a failed move through the use of well-placed stops.

how to identify a Morning Star pattern

How to Trade the Morning Star Pattern

The Morning Star pattern can be observed in the EUR/GBP chart below, where there is an established downtrend leading up to the formation of the reversal pattern.

Looking at the chart, once the formation has completed, traders can look to enter at the open of the very next candle. More conservative traders could delay their entry and wait to see if price action moves higher. However, the drawback of this is that the trader could enter at a much worse level, especially in fast moving markets.

Targets can be placed at previous levels of resistance or previous area of consolidation. Stops can be placed below the recent swing low, as a break of this level would invalidate the reversal. Since there are no guarantees in the forex market, traders should always adopt sound risk management while maintaining a positive risk to reward ratio.

trading the Morning Star EUR/GBP

When trading the Morning Star on forex markets, the price will very rarely gap like they do with stocks and so the three-candle pattern usually opens very close to the previous closing level.

How reliable is the Morning Star in Forex Trading?

The Morning Star, like most candlestick patterns, should be assessed in line with the current trend and whether there is supporting evidence in favour of the trade, when looking at an indicator. Below are the advantages and limitations of the Morning Star pattern:

How Forex Traders Use ISM Data

How Forex Traders Use ISM Data

What is ISM?

The Institute for Supply Management (ISM) measures the economic activity from both the manufacturing side as well as the service side. Monthly ISM data releases include key information such as changes in production levels.

ISM was formed in 1915 and is the first management institute in the world with members in 300 countries. The data gleaned from its large membership of purchasing managers means ISM is a reliable guide to global economic activity, and as a result, currency prices. A country’s economy is often determined by its supply chain, as a result, the monthly ISM manufacturing and non-manufacturing PMI economic news releases are carefully watched by forex traders around the world.

ISM Surveys

ISM publishes three surveys – manufacturing, construction, and services – on the first business day of every month. The ISM Purchasing Managers Index (PMI) is compiled from surveys of 400 manufacturing purchasing managers. These purchasing managers from different sectors represent five different fields:

  1. Inventories
  2. Employment
  3. Speed of supplier deliveries
  4. Production level
  5. New orders from customers.

In addition, ISM construction PMI is released on the second business day of the month, followed by services on the third business day. Forex traders will look to these releases to determine the risks at any given time in the market.

How does ISM Impact currencies?

The Manufacturing and Non-manufacturing PMIs are big market movers. When these reports are released at 10:30am ET, currencies can become very volatile. Since these economic releases are based on the previous month’s historical data gathered directly from industry professionals, forex traders can determine if the US economy is expanding or contracting – much like non-farm payrolls (NFP) data.

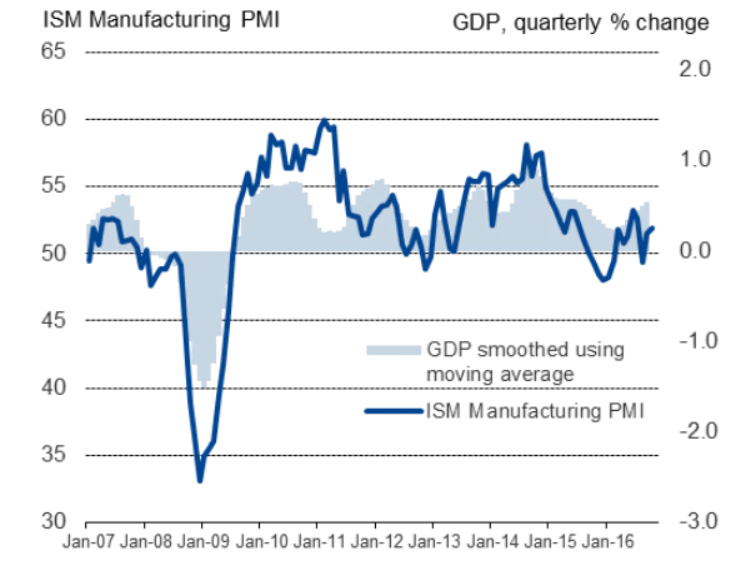
Currencies react with this information as it represents a gauge of US economic health (see image below).

ISM manufacturing PMI vs GDP

How forex traders use ISM data

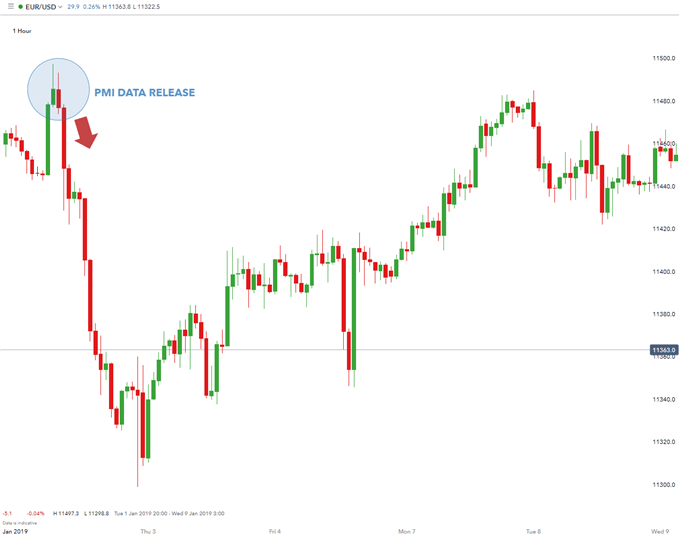
Forex traders will compare the previous month’s ISM data figure with the forecasted number that economists have published. If the released PMI number is better than the previous number and higher than the forecasted number, the US dollar tends to rally. This is where fundamental and technical analysis comes together to create a trade setup.

EUR/USD drops as a result of better than expected data

ism manufacturing index

In the example above, notice how the better than expected PMI number triggered a US dollar rally against the Euro. As seen in the chart (EUR/USD – one hour), the ISM Manufacturing PMI came in higher than the previous month at 54.9.

When an economic releases beats expectation, sharp fast moves can ensue. In this case, EUR/USD dropped 150 pips in a few hours. Traders often choose the Euro as the “anti-dollar” to take advantage of capital flows between two of the largest economies.

Read more on using pips in forex trading.

The Eurozone has large liquid capital markets which can absorb the huge waves of capital seeking refuge from the US. A weak US ISM Non-Manufacturing number usually leads to a dollar sell-off and a rise in the Euro. Another scenario is when the number released is in line with forecasts and/or unchanged from the previous month, then the US dollar may not react at all to the number.

Overall, an ISM PMI number above 50 indicates that the economy is expanding and is healthy. However, a number below 50 indicates that the economy is weak and contracting. This number is so important that if the PMI is below 50 for two consecutive months, an economy is considered in recession.

PMIs are also compiled for Euro zone countries by the Markit Group while US regional and national PMIs are compiled by ISM. As you can see, traders have good reason to pay special attention to the important releases from the ISM manufacturing index.

The Bank of England: A Forex Trader’s Guide

The Bank of England: A Forex Trader’s Guide

The Bank of England: A Forex Trader’s Guide

The Bank of England (BOE) is the UK’s central bank. Their mission is to promote and maintain monetary and financial stability. It is important for forex traders to keep up to date with the Bank of England’s latest changes to monetary policy because it can have a large effect on the Sterling Pound (GBP) and relevant currency pairs, like the EUR which is highly correlated to the Pound.

Central Bank of England

What is the Bank of England (BOE)?

Established in 1694, the Bank of England is the banker to, and owned by, the British government but is independent when setting monetary policy. Its roles include the setting of monetary policy – which includes targeting interest rates and using other tools to stimulate or contract the economy – producing the UK’s bank notes, supervising some bank payment systems, and ensuring the stability and safety of the financial system.

For traders, the BOE’s setting of monetary policy is a key factor to consider as it can have a big impact on the financial markets. Other factors, like the independence of the central bank are also important but are more prevalent issues in emerging market economies.

Key Economic Mandates of the Bank of England

According to the Bank of England, their two core purposes or mandates are:

1) Monetary stability – which is price stability or inflation

2) Financial stability – which is the stability and health of the economy

Monetary Stability

Monetary policy is extremely important for the entire economy. It prevents runaway inflation and attempts to ground inflation expectations so that the economy can grow at a regular pace. In order to maintain price stability, the Bank of England and their monetary policy committee (MPC) have set an inflation target of 2%.

If inflation goes above the target of 2% the Bank of England may increase interest rates. The increase in interest rates may cause an appreciation in the Pound as investors increase capital flows into the higher yielding currency. It may also have a negative affect on the stock market, as businesses will have to pay higher rates to lend and equity valuations will be discounted at a higher interest rate. Monetary policy data can be found on our economic calendar.

However, it is not always the case that the Bank of England will increase interest rates if inflation is above target. In some cases, like when GDP growth is still low or negative, the Bank of England may keep interest rates low to stimulate the economy. It is important to know the Bank of England will be looking for a balance between healthy inflation and economic growth.

Join our central bank webinar to watch our senior currency strategist discuss and analyze current central bank trends.

Financial Stability

The resilience of the financial system is paramount to the health of the UK economy and therefore necessary for the Bank of England to accommodate. To support Financial Stability mandates, the bank also has a Financial Policy Committee or FPC which was established in June 2011. From an FX point of view, the Monetary Stability is the key driver of spot rates for the GBP.

How BOE interest rates affect the Pound

Interest rate impact on the Pound

The Bank of England can affect the value of the Pound through changes in interest rate expectations. Traders should understand that currencies appreciate when interest rate expectations increase, not just from increases in the nominal interest rate.

For example, if the Bank of England keeps interest rates unchanged but issues forward guidance (tells the market) that they expect more interest rate hikes in future, the value of the Pound will appreciate. Likewise, decreases in future interest rate hike expectations, or expectations of an interest rate cut can lead to a decrease in the value of the Pound.

This is the general principle for how interest rates affect the Pound and stock market, although they sometimes react differently:

  1. Higher interest rate expectations increase the strength of the Pound (GBP) and negatively affect equity values.
  2. Lower interest rate expectations decrease the strength of the Pound (GBP) and positively affect equity values.

Interest rates aren’t the only monetary policy tool that can affect the currency, tools like quantitative easing can also lead to increases and decreases in the value of a currency. If the Bank of England announces that it plans to start a quantitative easing program (QE), the pound will likely depreciate as a large amount of liquidity enters the market, increasing the supply of money in the market and leading to a decrease in interest rates, or, simply to maintain current rates.

Interest rate impact on the economy

The Bank of England lowers interest rates when it is trying to stimulate the economy (GDP) and increases interest rates when it is trying to contain inflation caused by an economy operating above potential (overheating).

Lower interest rates stimulate an economy in a few ways:

  1. Businesses can borrow money and invest in projects that will receive more than the risk borrowing rate.
  2. When interest rates are lower the stock market is discounted at a lower rate, leading to an appreciation in stock market values which causes a wealth effect.
  3. People invest their money into the economy (stocks and other assets) because they can earn more in these assets than at currently low interest rates.

How to trade BOE interest rate decisions

The table below displays the possible scenarios that come from a change in interest rate expectations. Traders can use this information to forecast if the currency is likely to appreciate or depreciate and how to trade it.

Market expectations Actual Results Resulting FX Impact
Rate Hike Rate Hold Depreciation of currency
Rate Cut Rate Hold Appreciation of currency
Rate Hold Rate Hike Appreciation of currency
Rate Hold Rate Cut Depreciation of currency

Let’s look at the example below on GBP/USD. On August 4, 2016 the Bank of England cut interest rates and announced a stimulus package (quantitative easing program). The market reacted negatively and the Pound depreciated.

Bank of England cuts interest rate to new low

Top Takeaways of the BOE and Forex Trading

  • The Bank of England is fundamental to the value of the Pound
  • The Pound will appreciate or depreciate depending on changes in interest rate expectations, not just on actual changes.
  • Quantitative easing has a similar effect to changes in interest rates. Changes in expectations of quantitative easing will have an effect on the Pound.
  • Rising inflation does not mean the Bank of England will increase interest rates, it depends on the balance between economic growth and inflation.
US Dollar Holding Post-FOMC Gains for Now, Gold Continues to Nudge Higher

US Dollar Holding Post-FOMC Gains for Now, Gold Continues to Nudge Higher

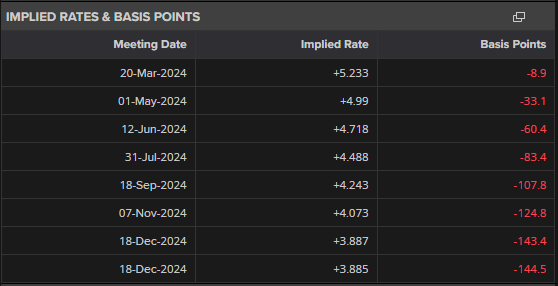
Federal Reserve Chair Jerome Powell tempered market rate cut expectations yesterday, saying that the central bank needed greater confidence that inflation would hit target adding, ’I don’t think it’s likely that we’ll reach a level of confidence by the time of the March meeting, I don’t think that’s the base case.’ Going into the meeting the market was pricing a 50/50 chance of a March rate cut, the current probability is seen at just 35%. Despite the Fed pushback, financial markets still expect the US central bank to cut interest rates by nearly 150 basis points this year.

image1.png

With the Fed reiterating that they remain data dependent, Friday’s US Jobs Report (NFPs) takes even greater significance than usual especially after yesterday’s US ADP Report missed expectations (+107k actual vs. +145k forecast). Nonfarm payrolls are expected to show 180k new jobs added in January, compared to 216k in December, while the unemployment rate is seen rising to 3.8% from a prior reading of 3.7%.

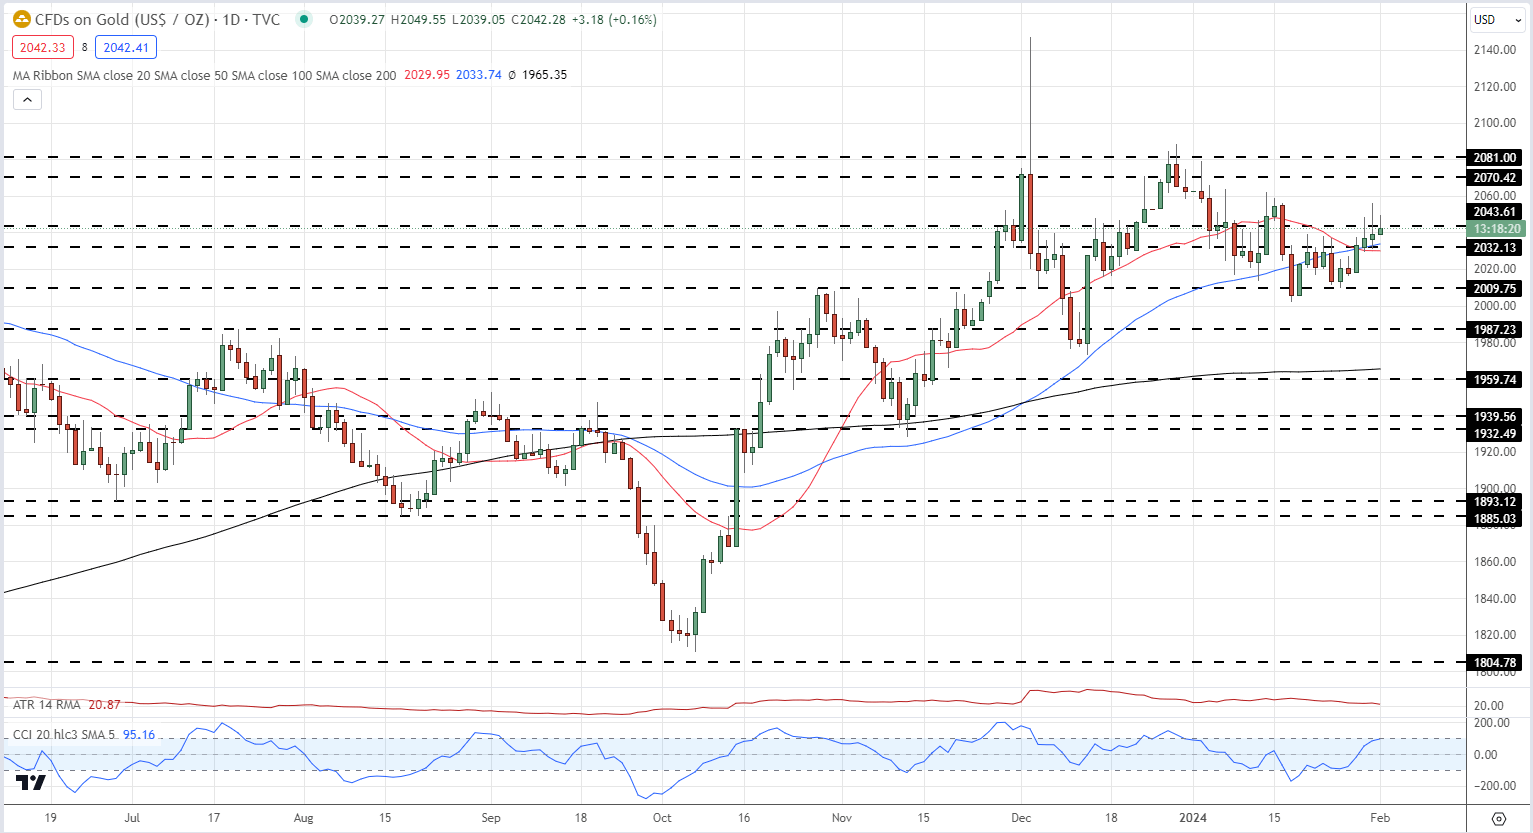
After posting a multi-week low of $2,002/oz. in mid-January, gold has put in a solid, if unspectacular, performance. The precious metal hit a pre-FOMC high yesterday of $2,056/oz. before fading lower to trade around $2,042/oz. Gold has posted six consecutive higher lows and is back above all three simple moving averages for the first time in a month. The CCI indicator shows gold heading towards overbought territory. Initial support is seen around $2,032/oz. ahead of $2,010/oz. and $2,002/oz. A break above Wednesday’s high should leave gold bulls looking at $2,088/oz. as the first short-term target.

Gold Daily Price Chart

image2.png

Chart via TradingView

Retail trader data show 58.92% of traders are net-long with the ratio of traders long to short at 1.43 to 1.The number of traders net-long is 9.22% lower than yesterday and 15.32% lower than last week, while the number of traders net-short is 5.16% higher than yesterday and 7.10% higher than last week.