The Basics of Technical Analysis

The Basics of Technical Analysis

An Introduction to Technical Analysis

Technical analysis is becoming an increasingly popular approach to trading, thanks in part to the advancement in charting packages and trading platforms. However, for a novice trader, understanding technical analysis – and how it can help predict trends in the market – can be daunting and challenging.

Technical analysis is the study of price movements in a market, whereby traders make use of historic chart patterns and indicators to predict future trends in the market. It is a visual representation of the past and present performance of a market and allows the trader to use this information in the form of price action, indicators and patterns to guide and inform future trends before entering a trade.

This technical analysis beginners guide will introduce you to the basics of this trading approach, and how it can be used to trade the financial markets.

Understanding Technical Analysis

Technical analysis involves the interpretation of patterns from charts. Trader’s make use of historic data, based primarily on price and volume and use this information to identify trading opportunities based on common patterns in the market. Different indicators are applied to charts to determine entry and exit points for traders to maximize a trades potential at good risk-reward ratios.

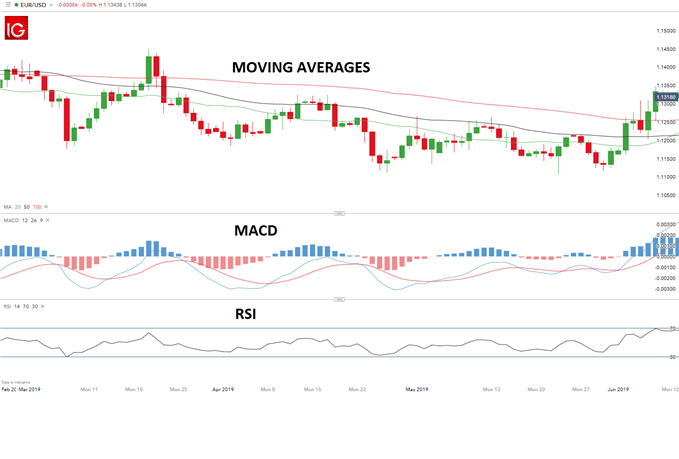
The below chart is an example of a chart with the use of the MACD and RSI indicator.
EUR/USD chart with indicators

While advocates of fundamental analysis believe that economic factors are the main contributors to movements in the markets, technical analysis traders maintain that past trends can assist in predicting future price movements. Although these trading styles can vary, understanding the differences between fundamental and technical analysis – and how to combine them – can be extremely beneficial.

How Technical Analysis can help traders

Many traders have found technical analysis to be a useful tool for risk-management, which can be a key stumbling block. Once a trader understands the concepts and principles of technical analysis, it can be applied to any market, making it a flexible analytical tool. Where fundamental analysis looks to identify intrinsic value in a market, technical analysis looks to identify trends, which conveniently can be caused by the underlying fundamentals.

Benefits of using technical analysis include the following:

  • Can be applied to any market using any timeframe
  • Technical analysis can be used as a standalone method
  • Allows traders to identify trends in the market

Using Charts in Technical Analysis

The below chart is an example of a candlestick chart for the EUR/USD currency pair.
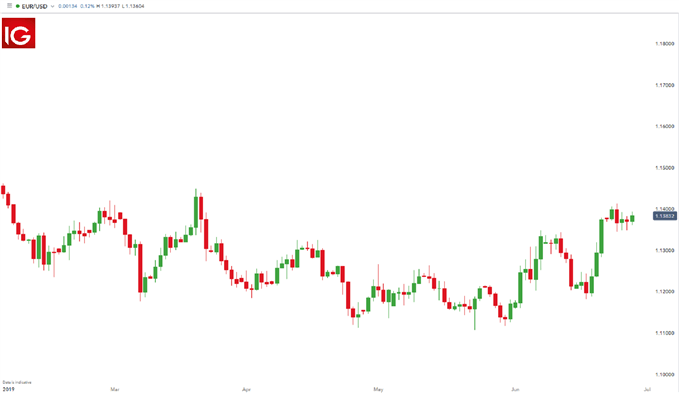
EUR/USD candlestick chart

Charts are key to technical analysis. This is because the most important measure of a market’s past and current performance is the price itself; this is the starting point when delving into analyzing the potential of a trade. Price action can be represented on a chart as this is the clearest indication of what the price is doing.

Charts assist in determining the overall trend, whether there’s an upward or downward trend, either over the long or short term or to identify range bound conditions. The most common types of technical analysis charts are line charts, bar charts and candlestick charts.

When using a bar or candlestick chart each period will give the technical analyst information on the price from where it opened, the high or low of the period as well as the close. Candlestick analysis is especially useful as the patterns and relationship within them can assist in making forecasts about the future direction of the price.

Once a trader has mastered the basics of charting, they can then make use of indicators to assist in determining the trend.

Technical Analysis Indicators

Indicators are used by technical traders when looking for opportunities in the market. Although many indicators exist, traders often make use of volume and priced-based indicators. These assist in determining where the levels of support and resistance are, how often they are maintained or breached as well ascertaining the length of a trend.

A trader can view the price or any other indicator using multiple time frame analysis, ranging from one second to a month which gives the trader a different perspective of the price action.

The more popular indicators for technical analysis include:

The EUR/USD chart below shows how to make use of different indicators.

Moving averages and MACD are often used to identify trends in the market while the RSI is typically used to determine possible entry and exit points. Indicators assist traders in analyzing the market, validating trade set ups and determining entry points.
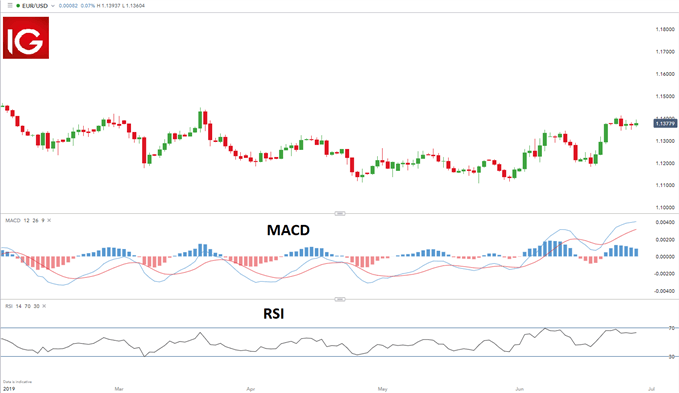
Technical analysis basics using indicators

Learn More about Technical Analysis

Big Mistake Leads Technical Trader to Top Three Tools

Big Mistake Leads Technical Trader to Top Three Tools

The 116 Death Trap

Developing your strategy comes at a cost –often a lot of time, money and frustration. I came to this realization in 2003 as USD/JPY was pulling back from multi-year highs. The ‘116 death trap,’ as I’ve dubbed it, was a seemingly rock solid zone of support. It had caught the lows since 2001 with numerous defenses suggesting a perfect opportunity for me to ‘catch the lows’ and cost average in. Even when price broke, my hope was that every rebound was the low. Not quite. In September of 2003, the death trap began with a drop of more than 12% over the next year, taking USD/JPY to lows not seen since the late-90s. Even a glimmer of hope offered by a multi-week rally in early 2004 reversed. With the pain finally too hard to tolerate, I exited at the lows. So much for cost averaging into a loser. That was my hard lesson learned.

USD/JPY Daily Price Chart

Where did I go wrong?

Well, there was a lot, but for starters, emotions are not your friend. Most of all, my error was not having a plan and not recognizing market conditions. Knowing the style of trading that works best for your personality, risk tolerance and goals is critical and without a plan you are on a ship without a rudder.

Everyone comes to this realization differently. I learned through years of managing market flow for one of the first brokers to offer online retail FX trading. It was through close observations of retail market flow and tracking near-term price-action that Ideveloped three basic principles for my technical trading strategy. It boils down to assigning a value for price, time and momentum.

Price Value – Key reversals, Fibonacci, High/Low-day Closes

It’s all about the levels – identifying support / resistance is a critical part of being able to create actionable trade ideas targeting or countering key levels in price. These lateral levels can be identified using various methods. The three I rely on most are key reversals (outside-day reversals), high and low-day closes and Fibonacci.

The word “Fibonacci” often appears in trading and it is likely that you have already seen or heard of it — for good reason. It is a simple measurement based on the golden ratio of 61.8%. This ratio can be observed everywhere in nature from trees to galaxy formations and is also very relevant to buying and selling behavior in markets. It is a tool you can implement in both trending and range-bound markets to help identify areas of possible support / resistance. We have a lot more in the education section: Fibonacci Application in Financial Markets (dailyfx.com)
Time value indicator – Slope and Trend lines

One discipline I rely heavily on is pitchfork and median-line analysis. The goal of this style of analysis is to identify the slope or gradient of a given market in an attempt to highlight when a price level may be significant. It is this time value that adds another dimension to the lateral levels identified earlier – these “confluence zones” are often points in price and time that can offer major pivots in near-term price-action. Trading into / off these inflection points todayform the basis of my favored technical trade setups.

Momentum value – RSI

The speed of a market can tell The Relative Strength Index (RSI). The RSI is an oscillator that is used as a measure of momentum — the speed of the recent price movement in either direction. While all oscillators are inherently backward looking, they can still be of value when you are trying to asses when the market maybe overextended in either the overbought or oversold conditions. The ability to assess the inertia of a given market is critical for near-term swing and trend trading as it offers a window into the possible longevity and strength of a given move as well as ideas on when it may expire.

Bottom line

Having a multi-faceted approach that takes into account price value, momentum value and time value could help steer you not only to possible opportunities, but also help you avoid failure. Knowing the condition of the market using price, time and momentum has been a major philosophy of my trading.

What is the Best Time Frame to Trade Forex?

What is the Best Time Frame to Trade Forex?

“Is there a best time frame to trade forex?” is a common question a lot of traders ask, especially those new to the forex market. The truth is, there is no single answer. It all depends on your preferred trading strategy and style.Traders utilize varying time frames to speculate in the forex market. The two most common are long- and short-term-time frames which transmits through to trend and trigger charts. Trend charts refer to longer-term time frame charts that assist traders in recognizing the trend, whilst trigger chart pick out possible trade entry points. This article will explore these forex trading time frames in depth, whilst offering tips on which can best serve your trading goals.

Talking points:

  • How to decide the best time frame to trade forex
  • What are the main forex time frames
  • Using multiple time frame analysis

How to decide the best time frame to trade forex

As mentioned above, the best time frame to trade forex will vary depending on the trading strategy you employ to meet your specific goals. The table below summarizes variable forex time frames used by different traders for trend identification and trade entries, which are explored in more depth below:

CHART DAY TRADING SWING TRADING POSITION TRADING
TREND CHART 30 minutes – 4 hours Daily Weekly
TRIGGER CHART 5 – 60 minutes 2 – 4 hours Daily

Main forex trading time frames

Traders utilize different strategies which will determine the time frame used. For example, a day trader will hold trades for a significantly shorter period than that of a swing trader. Read our guide for a basic introduction to different trading styles.

1) Position trading time frames
The position trading time frame varies for different trading strategies as summarized in the table above. This could fluctuate from daily to yearly under the ‘long-term’ definition.


Many new traders tend to avoid this approach because it means long periods of time before trades are realized. However, by many accounts, trading with a shorter-term (day trading) approach can be far more problematic to execute successfully, and it often takes traders considerably longer to develop their strategy.
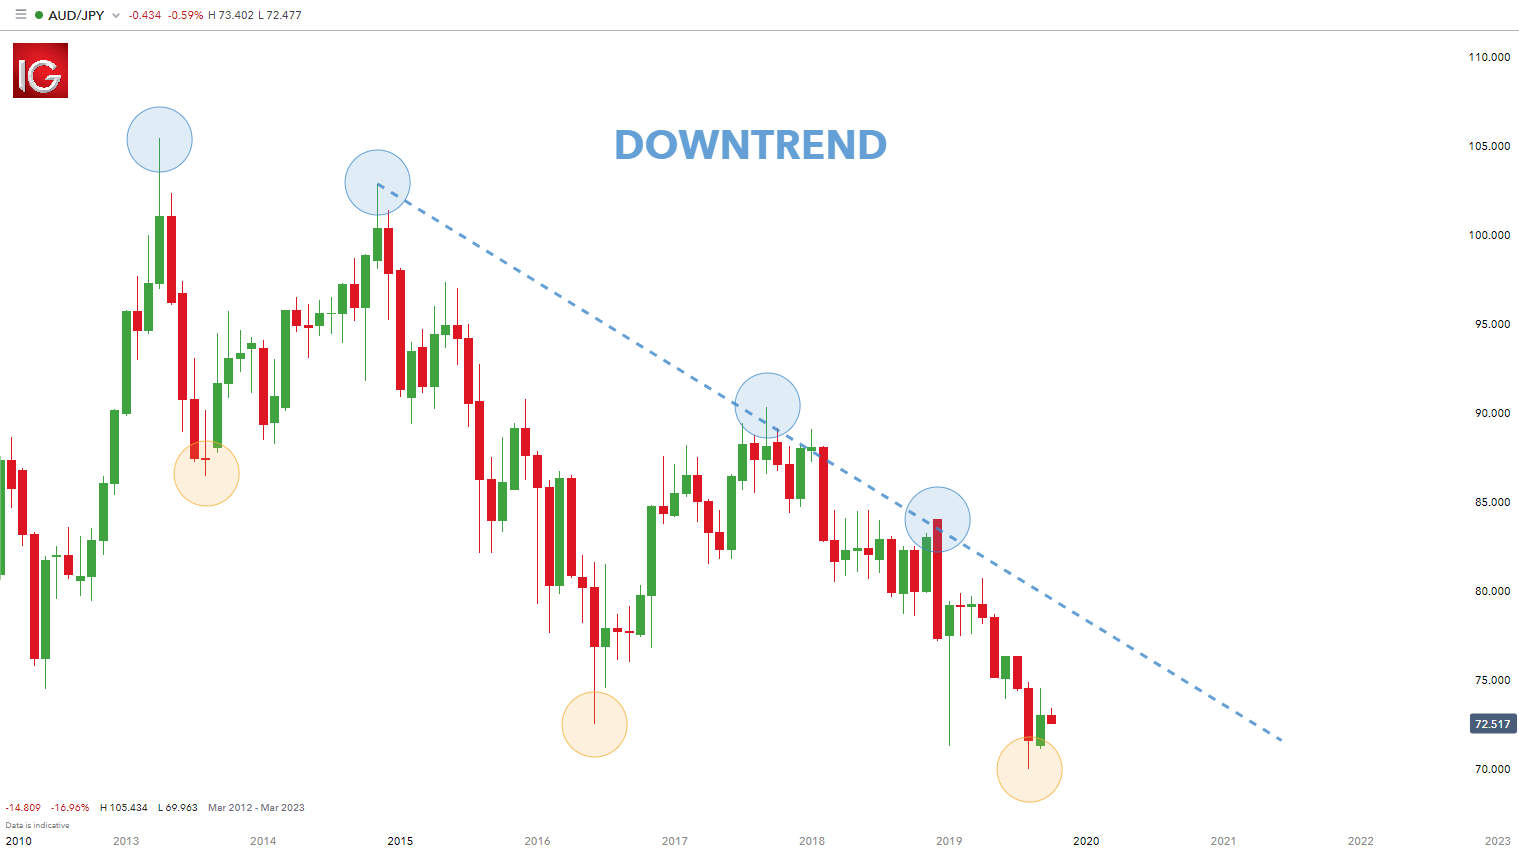
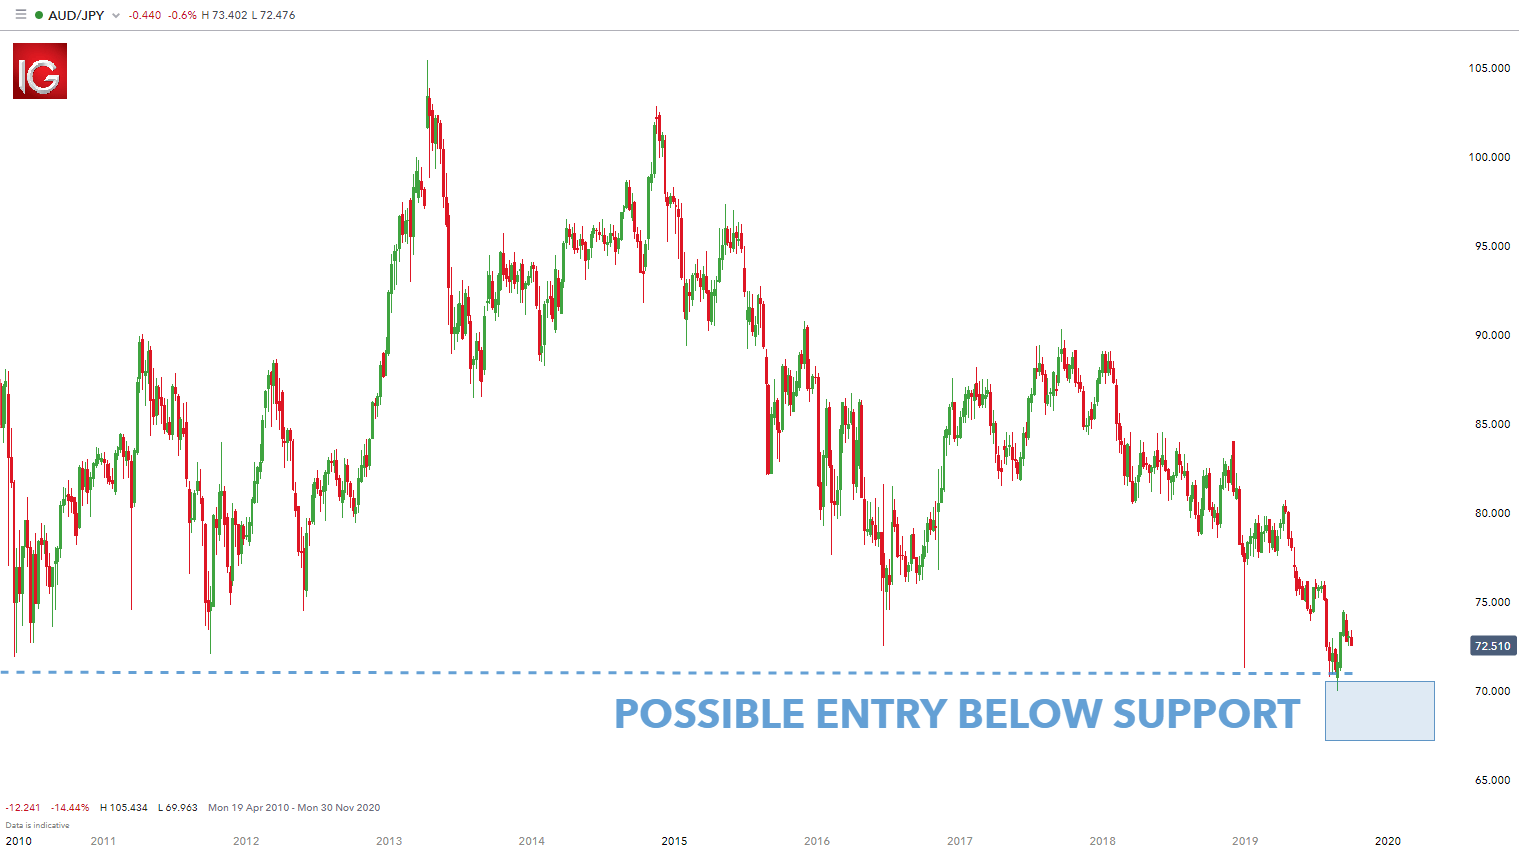
Position trading (longer-term) approaches can look to the monthly chart for grading trends, and the weekly chart for potential entry points.
Position trading example
After the trend has been determined on the monthly chart (lower highs and lower lows), traders can look to enter positions on the weekly chart in a variety of ways. Many traders look to utilize price action (as seen in the weekly chart below) for determining trends and/or entering positions, but indicators can absolutely be utilized here as well.

Monthly AUD/JPY trend chart:

long-term time frame monthlyWeekly AUD/JPY trigger chart:

long-term time frame weekly2) Swing trading time frames

After a trader has gained comfort on the longer-term chart, they can then look to move slightly shorter in their approach and desired holding times. This can introduce more variability into the trader’s approach, so risk and money management should be addressed before moving down to shorter time frames.

Swing trading is a happy medium between a long-term trading time frame and a short-term, scalping approach. One of the best benefits of swing trading is that traders can get the benefits of both styles without necessarily taking on all the downsides. As a result, this makes swing trading a very popular approach to the markets.

Swing traders will check the charts a couple times per day in case any big moves occur in the marketplace. This affords traders the benefit of not having to watch markets continuously while they’re trading. Once an opportunity is identified, traders place the trade with a stop attached and monitor at a later stage to see the progress of the trade.

Another advantage of this approach is that the trader is still looking at charts often enough to seize opportunities as they exist. This eliminates one of the downsides of longer-term trading in which entries are generally placed on the weekly/daily charts.

Swing trading example

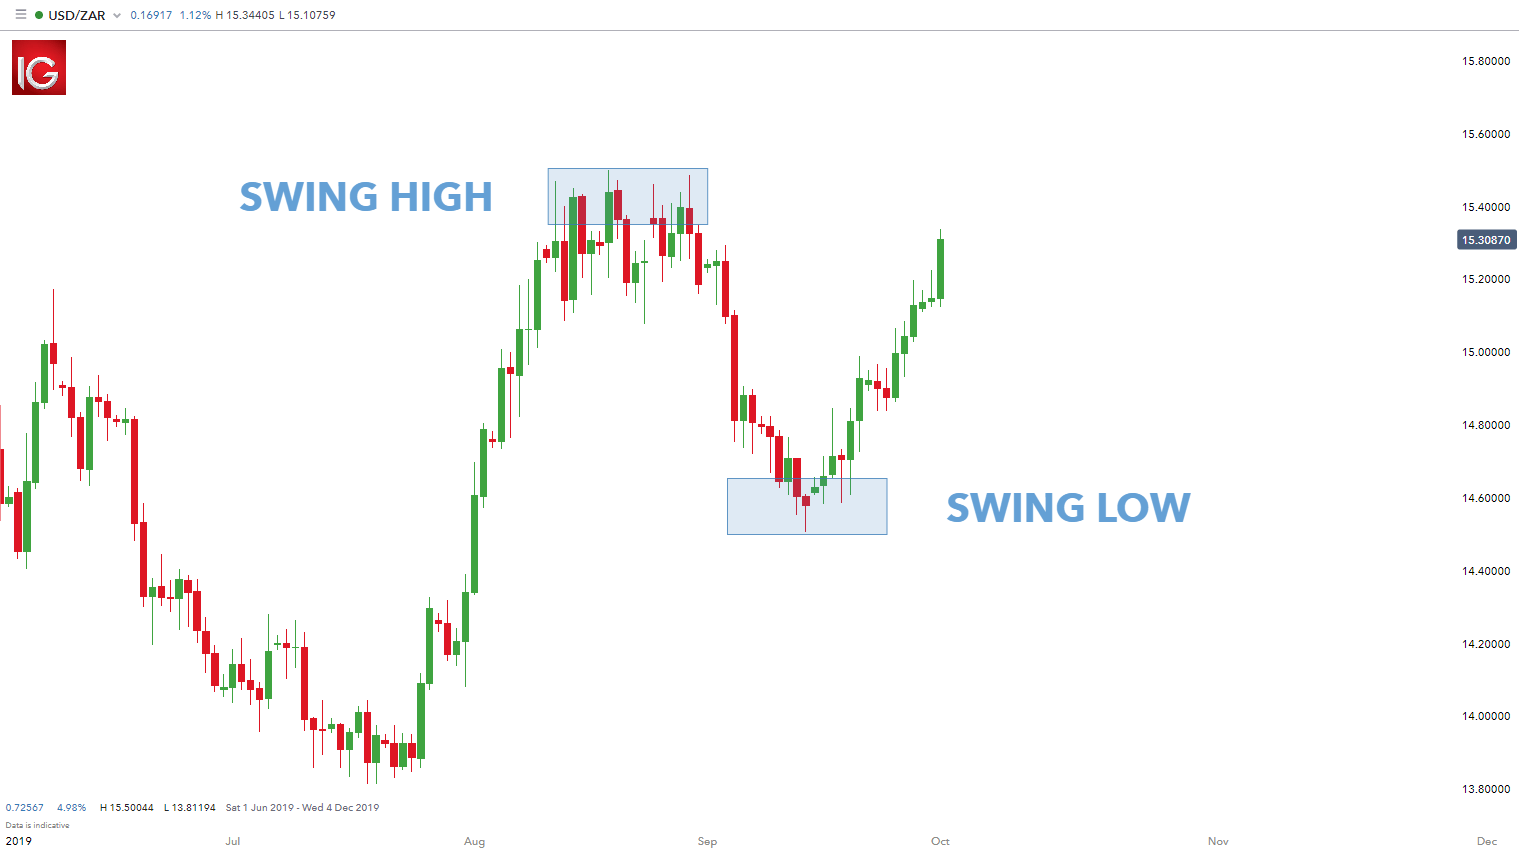
For this approach, the daily chart is often used for determining trends or general market direction and the four-hour chart is used for entering trades and placing positions (see below). The daily chart shows the recent swing high and low respectively. Traders usually trade swings back in the direction of the preceding trend – in this example the preceding trend is upwards.

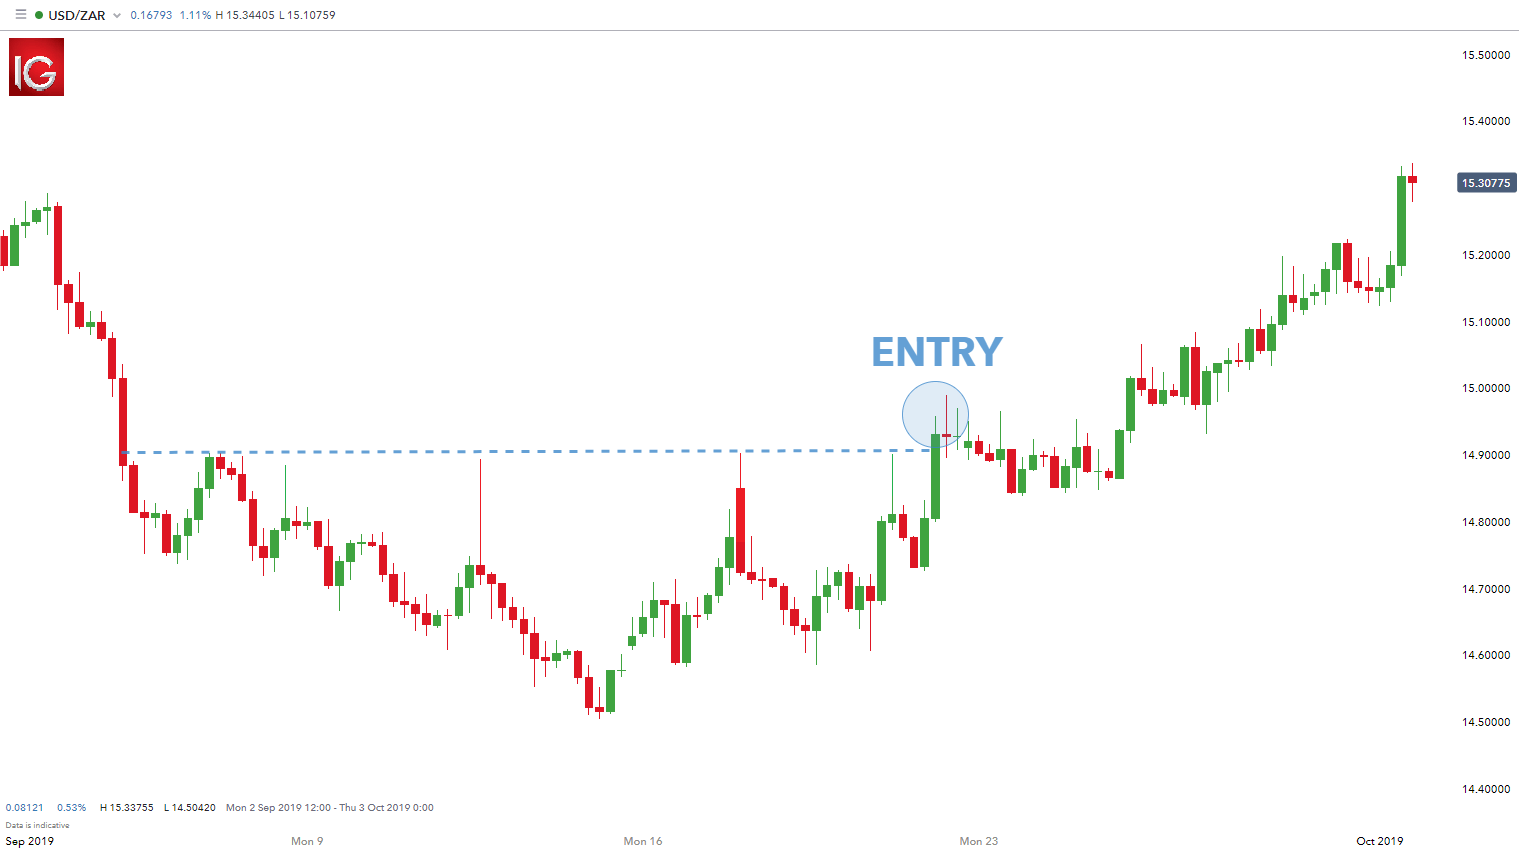
Now that the trade direction has been identified, the swing trader will then diminish the time frame to four-hours to look for entry points. In the example below, there is a clear price resistance level that the swing trader will look at when entering a long trade. Once price breaks or the candle closes above the designated resistance level, traders can look to enter.

Daily USD/ZAR trend chart:

medium-term time frame daily4-hour USD/ZAR trigger chart:

medium-term time frame 4-hour3) Day trading time frames

Day trading can be one of the most difficult strategies of finding profitability. Newer traders implementing a day trading strategy are exposing themselves to more frequent trading decisions that may not have been practiced for very long. This combination of experience and frequency opens the door for losses that might have been prevented had the trader opted for a slightly longer approach like swing trading.

The scalper or day trader is in the unenviable position of needing the price to move quickly in the direction of the trade. Therefore, the day trader becomes tied to the charts as they seek the market’s trends for that day. Obsessing over charts for long periods of time can lead to fatigue. The shorter-term approach also affords a smaller margin of error.

Generally, there is less profit potential in short-term trading which leads to tighter stops levels. These tighter stops mean higher probability of failed trades as opposed to longer-term trading.To trade with a very short-term approach, it’s advisable for a trader to get comfortable with a longer-term, and swing-trading approach before moving down to the very short time frames.

Resembling longer-term trading, day traders can look to evaluate trends on the hourly chart and locate entry opportunities on the ‘minute’ time frames such as five or ten-minute charts. The one-minute time frame is also an option, but extreme caution should be used as the variability on the one-minute chart can be very random and difficult to work with. Once again, traders can use a variety of triggers to initiate positions once the trend has been determined – price action or technical indicators.

Day trading example

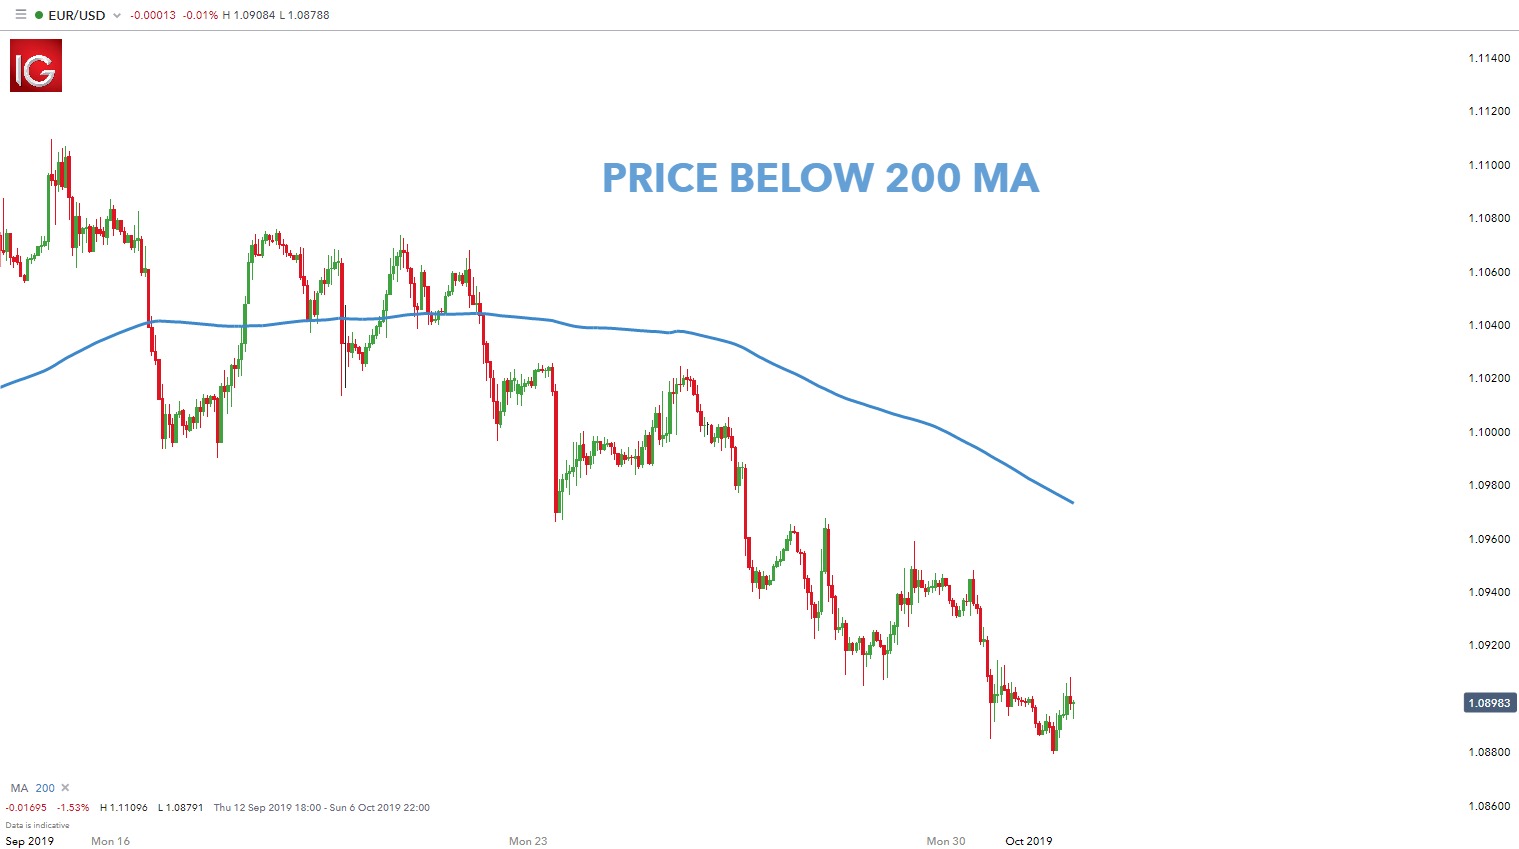
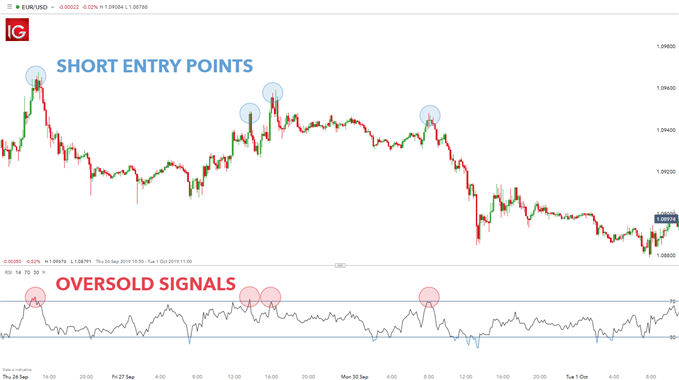
The charts below use the hourly chart to determine the trend – price below 200-day moving average indicating a downtrend. The second 10-minute chart uses the RSI indicator to assist in short-term entry points. In this case, the trader only identifies overbought signals on the RSI (highlighted in red) because of the longer-term preceding downtrend.

Hourly EUR/USD trend chart:

short-term time frame hourly10-minute EUR/USD trigger chart:

short-term time frame 10 minute

Solana Maintains $150 Price Target Despite $1 Billion Pullback

Solana Maintains $150 Price Target Despite $1 Billion Pullback

Key Insights:

Solana (SOL) price soared to a 2024 peak of $118.44 on Feb 15 as bullish headwinds from crypto market rally spread toward the layer-1 sector.

Interestingly, as SOL price reject just below the critical $120 resistance,  investors have increasingly refrained from trading rather then enter a large-scale sell-off.

Are the bulls revving up for a breakout towards $150 in the week ahead?

Solana Bulls Refrain from Selling Despite Price Pullback

Solana, like other top-ranked layer-1 coins like and Avalanche (AVAX), Ethereum (ETH) was at the forefront of the market rally last week, soaring to a new 2024 peak of $118.

Increased demand on the Solana DeFi ecosystem and positive sentiment across the overall market have been major drivers of the rally.

However, after hitting the local top on Feb 15, SOL price has suffered a 10% pullback to a local low of $105 at the weekend.

But interestingly, on-chain data trends show that the majority of current SOL holders maintained a bullish outlook amid the Solana price pullback.

Indicatively, the Santiment chart below shows the Solana trading volume at $2.7 billion at the peak of last week’s rally of Feb 15. But as prices began to drop, SOL holders have increasingly refrained from trading.

The latest reading shows that SOL trading volume is down by $1.1 billion compared to last week’s peak, with only $1.6 billion worth of trades recorded at the close of Feb 18.

Solana (SOL) Daily Trading Volume vs. Price | Source: Santiment
Solana (SOL) Daily Trading Volume vs. Price
Effectively, SOL trading volume has now dropped by 40% between Feb 15 and Feb 19. But notably, Solana price only declined by a maximum of 10% during that period.

When trading volume declines significantly faster than price downtrend as observed in the Solana charts above, strategic investors interpret it as a sign of dominant positive conviction that the consolidation will be quickly followed by another rebound phase.

Also, with critical fundamental factors, such as rising demand from increased DeFi activity still trending upwards, it lends further credence to the bullish outlook.

Solana Price Forecast: $150 Target in Focus

The curtailed selling pressure observed at the weekend puts Solana in a prime position for another rebound phase toward $150 in the days ahead.

However, the upper Bollinger band indicator shows that the bulls face initial resistance at the previous peak around $119

If the bullish scenario plays out as predicted, SOL price could enter a major breakout above $120, putting the $150 target in firm focus.

Solana (SOL) Price Forecast, Feb, 2024 | Source: TradingView
Solana (SOL) Price Forecast, Feb, 2024
On the flip side, the bears can summarily negate this bullish Solana price forecast if they force a reversal below the $90 area. However, as outlined by the lower-Bollinger band, the buy-wall at $91 could offer major support in the short-term.

US Dollar Forecast: DXY Up 0.19% on Retail Boost, EUR/USD Eyes German Report Impact

US Dollar Forecast: DXY Up 0.19% on Retail Boost, EUR/USD Eyes German Report Impact

Market Eyes German Report Impact

The trading landscape for the US Dollar has shown a notable uptick, closing last week at 104.275 with a 0.19% increase. This movement comes in the wake of pivotal economic indicators from the US, including Core PPI and PPI monthly movements at 0.5% and 0.3% respectively, outpacing expectations.

Moreover, preliminary University of Michigan Consumer Sentiment edged closer to forecasts, registering at 79.6 against an anticipated 80.0.

Across the pond, the Eurozone and the UK revealed mixed signals; France’s Final CPI dropped by 0.2%, while the UK’s Retail Sales surged by 3.4% month-on-month, significantly outperforming expectations and painting a varied picture of consumer behavior.

Events Ahead

Looking ahead, the immediate calendar highlights a bank holiday in the US for Presidents’ Day, temporarily pausing local market activities.

However, Europe remains active with the release of the German Buba Monthly Report, a key economic indicator that provides insight into the Bundesbank’s perspective on economic conditions.

A more hawkish tone than expected could buoy the Euro, impacting the EUR/USD pair.

US Dollar Index (DXY)

Dollar Index
Dollar IndexThe Dollar Index is slightly lower today, recording a decrease of 0.05% to stand at 104.226. In this 4-hour chart analysis, the pivot point is noted at 104.418. Looking ahead, the index faces resistance at 104.683, with further barriers at 104.987 and 105.283. Support levels are identified at 104.095, 103.803, and 103.527, offering critical points for potential rebounds or further declines.

Technical indicators, including the 50-Day Exponential Moving Average (EMA) at 104.294 and the 200-Day EMA at 103.696, alongside an upward trendline support at 104.200, suggest a bullish sentiment above this level. The Dollar Index’s current positioning above the 104.200 mark indicates a positive outlook, with investors advised to monitor these key technical levels for insights into future movements.

EUR/USD Technical Forecast

EUR/USD Price Chart - Source: Tradingview
The EUR/USD pair has seen a slight uptick of 0.06%, trading at 1.07806. Analyzing the 4-hour chart, the pivot point is established at $1.07718. Looking ahead, the currency faces immediate resistance at $1.08064, with further ceilings at $1.08355 and $1.08619. Support levels are positioned at $1.07440, $1.07223, and $1.06937, indicating potential zones for buyers.

GBP/USD Price Chart - Source: Tradingview
GBP/USD Price ChartThe GBP/USD pair is currently experiencing a modest rise, up 0.13% at 1.26148. On the 4-hour chart, the pivot point stands at $1.26108. The pair encounters immediate resistance at $1.26548, with subsequent levels at $1.26832 and $1.27195. Support is found at $1.25523, followed by $1.25116 and $1.24793, marking critical junctures for potential reversals.

Technical indicators, including the 50-Day Exponential Moving Average (EMA) at $1.26043 and the 200-Day EMA at $1.26392, suggest a bullish bias above the pivot point. The overall trend for GBP/USD appears bullish above $1.26108, indicating a favorable outlook for buyers, contingent on sustained momentum above this threshold.

Hang Seng Index, ASX 200, Nikkei 225: Fed Rate Path Uncertainty and China in Focus

Hang Seng Index, ASX 200, Nikkei 225: Fed Rate Path Uncertainty and China in Focus

Overview of the Friday Session

On Friday, the Hang Seng Index continued enjoying a positive start to the Year of the Dragon, extending its winning streak to three sessions. The ASX 200 and Nikkei 225 also ended the day in positive territory.

US economic indicators from Thursday influenced investor bets on Fed rate hikes. Retail sales fell by more than expected in January.

10-year US Treasury yields fell by 0.54%, ending the session at 4.236%. The US equity markets reacted to the US retail sales figures. On Thursday, the Nasdaq Composite Index ended the session up 0.30%. The S&P 500 and the Dow saw gains of 0.58% and 0.91%, respectively.

On Friday, there were no Asian economic indicators to affect market risk sentiment. However, investors reacted to media reports from China about travel numbers during the Chinese New Year holidays. A pickup in demand would be a boon for the regional markets.

Bank of Japan Governor Kazuo Ueda contributed to a softer Yen and demand for Nikkei export-listed stocks. Governor Ueda said monetary policy would remain accommodative.

US Producer Prices, HK Earnings, and Central Banks

On Monday, US producer prices from Friday could test buyer demand for riskier assets. Producer prices increased by more than expected in January. Producer prices increased by 0.3%, with core producer prices up 0.6%. Economists forecast producer and core producer prices to increase by 0.1% after falling by 0.1% in December. 10-year US Treasury yields climbed 1.11% to 4.283%.

The US equity markets also reacted to the numbers, with the Nasdaq Composite Index falling 0.82%. On Friday, the Dow and S&P 500 ended the session down 0.37% and 0.48%, respectively.

However, investors must consider the Asian economic calendar. Machinery orders from Japan could influence the timeline for a Bank of Japan pivot from negative rates. Economists forecast machinery orders to increase by 2.5% in December. Machinery orders slid by 4.9% in November.

Beyond the economic calendar, positive reports from China on spending during Chinese New Year could fuel demand for riskier assets.

HK corporate earnings could also move the dial. Sands China (HK: 1928) released earnings after the closing bell on Friday. A surge in reported sales could fuel demand for Hang Seng-listed stocks.

On Monday, Westpac Banking Corp. (ASX), BHP Group (ASX), and Lend Lease Group (ASX) will release earnings reports.

However, central bank commentary and stimulus chatter from Beijing also need consideration.

On Monday, the ASX 200 and Nikkei futures were up 13 and 170 points, respectively.

ASX 200

ASX 200 had a positive Friday session.
ASX200 190224 Daily ChartThe ASX 200 rose by 0.69% on Friday. Gains were broad-based, with gold, oil, mining, and bank stocks contributing to the gains. Tech stocks also ended the session in positive territory. The S&P ASX All Technology Index (XTX) gained 0.61%.

Gold (XAU/USD) stocks led the way, with Northern Star Resources Ltd. (NST) and Evolution Mining Ltd. rallying 3.05% and 2.01%, respectively. Oil stocks Woodside Energy Group Ltd (WDS) and Santos Ltd (STO) gained 1.52% and 0.55%, respectively.

The Commonwealth Bank of Australia (CBA) led the big four banks, rising by 1.86%. ANZ Group Holdings Ltd (ANZ) and Westpac Banking Corp. (WBC) ended the day up 0.71% and 0.82%, respectively. National Australia Bank Ltd. (NAB) rose by 0.67%.

Despite concerns about BHP Group Ltd (BHP) and warnings about writedowns, mining stocks also had a positive session. BHP Group Ltd (BHP) and Rio Tinto Ltd. (RIO) ended the session up 0.97% and 1.23%, respectively. Fortescue Metals Group Ltd. (FMG) gained 1.14%.

Hang Seng Index

Hang Seng continued Year of the Dragon rally.
HSI 190224 Daily ChartOn Friday, the Hang Seng Index rallied 2.48%. Real estate and tech stocks contributed to the gains. The Hang Seng Mainland Properties Index (HSMPI) surged 6.76%. The Hang Seng Tech Index (HSTECH) ended the day up 3.71%.

Alibaba (9988) and Tencent (0700) saw gains of 2.38% and 2.24%, respectively.

Bank stocks also had a positive session. HSBC (0005) rose by 0.98%. China Construction Bank (0939) and Industrial Commercial Bank (1398) ended the day up 0.64% and 1.03%, respectively.

The Nikkei 225

Nikkei moved closer to the December 1989 all-time high.
Nikkei 190224 Daily Chart(Graph for reference purposes only)

The Nikkei ended the Friday session up 0.86%.

Bank stocks enjoyed a positive end to the week. Sumitomo Mitsui Financial Group Inc. (8316) and Mitsubishi UFJ Financial Group Inc. (8306) rallied 3.20% and 2.71%, respectively.

However, the main components of the Nikkei had another mixed session.

KDDI Corp. (9433) and Fast Retailing Co. Ltd. ended the day up 1.64% and 1.08%, respectively. Tokyo Electron Ltd. (8035) gained 0.40%.

Softbank Group Corp. (9948) and Sony Group Corp. (6758) ended the session down 2.20% and 1.71%, respectively.

XRP News: Legal Battles Looming – Ripple vs. SEC Unveils Uncertainties

XRP News: Legal Battles Looming – Ripple vs. SEC Unveils Uncertainties

The Sunday Overview

On Sunday, XRP gained 1.35%. Partially reversing a 2.69% loss from Saturday, XRP ended the session at $0.5571.

SEC v Ripple: Remedies-Related Discovery

On Sunday, there were no SEC v Ripple case-related updates to consider. Remedies-related discovery ends on Tuesday. After discovery, the SEC and Ripple will argue for and against a punitive disgorgement.

In July, Judge Analisa Torres ruled Ripple breached Section 5 of the US Securities Act for selling XRP to institutional investors. The influence of the penalty on XRP will hinge on the size of the penalty and whether the size could materially impact Ripple’s ability to continue doing business.

SEC plans to appeal against the Programmatic Sales of XRP ruling may have greater significance. In July, Judge Torres also ruled programmatic sales of XRP do not satisfy the third prong of the Howey Test.

SEC v Ripple: Programmatic Sales and an Appeal

In October, Judge Torres rejected the SEC motion for interlocutory appeal. As a result, the SEC must wait until the end of the trial to appeal against court rulings. Judge Torres could decide on a penalty by the summer, meaning the SEC could appeal this year and extend the case into 2025.

The uncertainty regarding the potential reversal of the Programmatic Sales ruling increased due to developments in the SEC v Terraform Labs case. In December, Judge Rakoff ruled Luna and TerraUSD were securities.

However, two curveballs could significantly affect SEC plans to appeal the Programmatic Sales ruling.

Curveball One

The outcome of an ongoing investigation into possible conflicts of interest within the SEC could affect the direction of the SEC v Ripple case.

On Thursday, Empower Oversight issued a press release saying the Office of Inspector General was in the final stages of an investigation. The investigation related to reports of conflicts of interest. Empower Oversight reported the conflict-of-interest issues to the OIG in 2022.

Significantly, Empower Oversight filed a lawsuit against the SEC in 2021, claiming former SEC officials were biased against Ripple Labs and XRP.

If the OIG finds wrongdoing, the SEC may end plans to appeal the ruling, a boon for XRP and the broader market.

Curveball Two

The second curveball could be the SEC v Coinbase (COIN) case. Coinbase filed a Motion to Dismiss (MTD) in August, arguing the SEC lacks the statutory authority to regulate US crypto exchanges.

Amicus Curiae attorney and CryptoLaw US founder John E. Deaton believed the SEC would settle the case against Ripple if the Court grants the Coinbase MTD. In September, Deaton said,

“I doubt the Solicitor General would allow an appeal in that scenario, one that could reach the Supreme Court, allowing for the High Court to strip away, not only the SEC’s power, but all other federal agencies as well.”

A court ruling on the Coinbase MTD could happen at any time. Judge Katherine Failla heard oral arguments from both sides on January 17.

The OIG investigation and the ruling on the Coinbase MTD could firmly shut the door on SEC plans to appeal. Adverse outcomes for the SEC may also force the SEC to step back from regulating the crypto space by enforcement.

XRP Price Action

Weekly Chart sends bullish price signals.
XRPUSD 190224 Weekly Chart

Daily Chart

XRP held above the 50-day and 200 EMAs, sending bullish price signals. XRP broke above the 50-day EMA on Sunday and through the 200-day EMA on Monday.

An XRP break above the Friday high of $0.5796 would support a move to the $0.5835 resistance level.

SEC v Ripple and Coinbase case-related chatter, SEC activity, and updates from the OIG investigation need consideration.

However, a break below the 200-day EMA would support a fall to the 50-day EMA and the $0.5470 support level.

The 14-day RSI reading, 59.50, indicates an XRP move to the $0.5835 resistance level before entering overbought territory.

XRP Daily Chart sends bullish price signals.
XRPUSD 190224 Daily Chart

4-Hourly Chart

On the 4-hourly, XRP sat above the 50-day and 200-day EMAs, sending bullish price signals.

An XRP move to the $0.57 handle would bring the $0.5835 resistance level into play.

However, a drop below the $0.5470 support level and 50-day EMA would give the bears a run at the 200-day EMA.

The 4-hourly RSI, with a reading of 58.07, suggests an XRP move to the $0.5835 resistance level before entering overbought territory.

4-Hourly Chart affirmed bullish price signals.
XRPUSD 190224 4-Hourly Chart
Gold, Silver Forecast: Metals Challenged by Stronger USD, Delayed Rate Cuts

Gold, Silver Forecast: Metals Challenged by Stronger USD, Delayed Rate Cuts

Gold Continues to Track USD and Treasury Yields

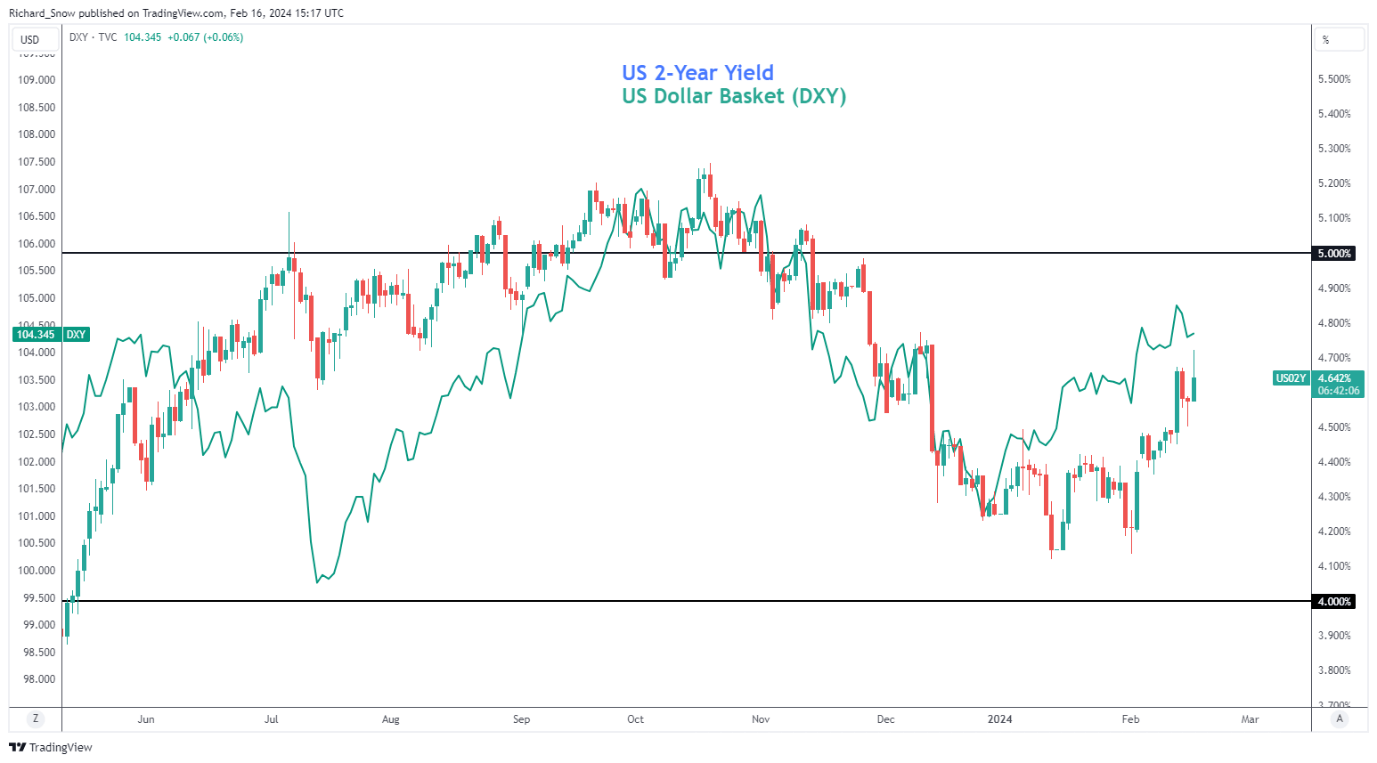
A hotter-than-expected PPI print on Friday added to Tuesday’s stubborn US CPI data, helping lift the US dollar and US yields into the weekend. The chart below depicts the US 2-year treasury yield and the US Dollar Basket (DXY), which both rose on Friday – weighing on metal prices.

Yields and the dollar have rallied this year as the US economy continues to advance at a decent pace, beating expectations despite the constraints of high interest rates. US GDP grew at a rate of 4.9% in Q3 and 3.3% in Q4 with both figures smashing estimates. The Atlanta Fed’s ‘GDPNow’ forecast sees Q1 2024 GDP at 2.9% based off current data. The figure may represent a downgrade from the final quarter of last year but represents a strong base for another potential upward surprise.

Therefore, it appears as if the dollar and market expectations could see further readjustments as the Fed’s first rate cut looks further and further away.

US 2-Year Yields and US Dollar Basket

image1.png

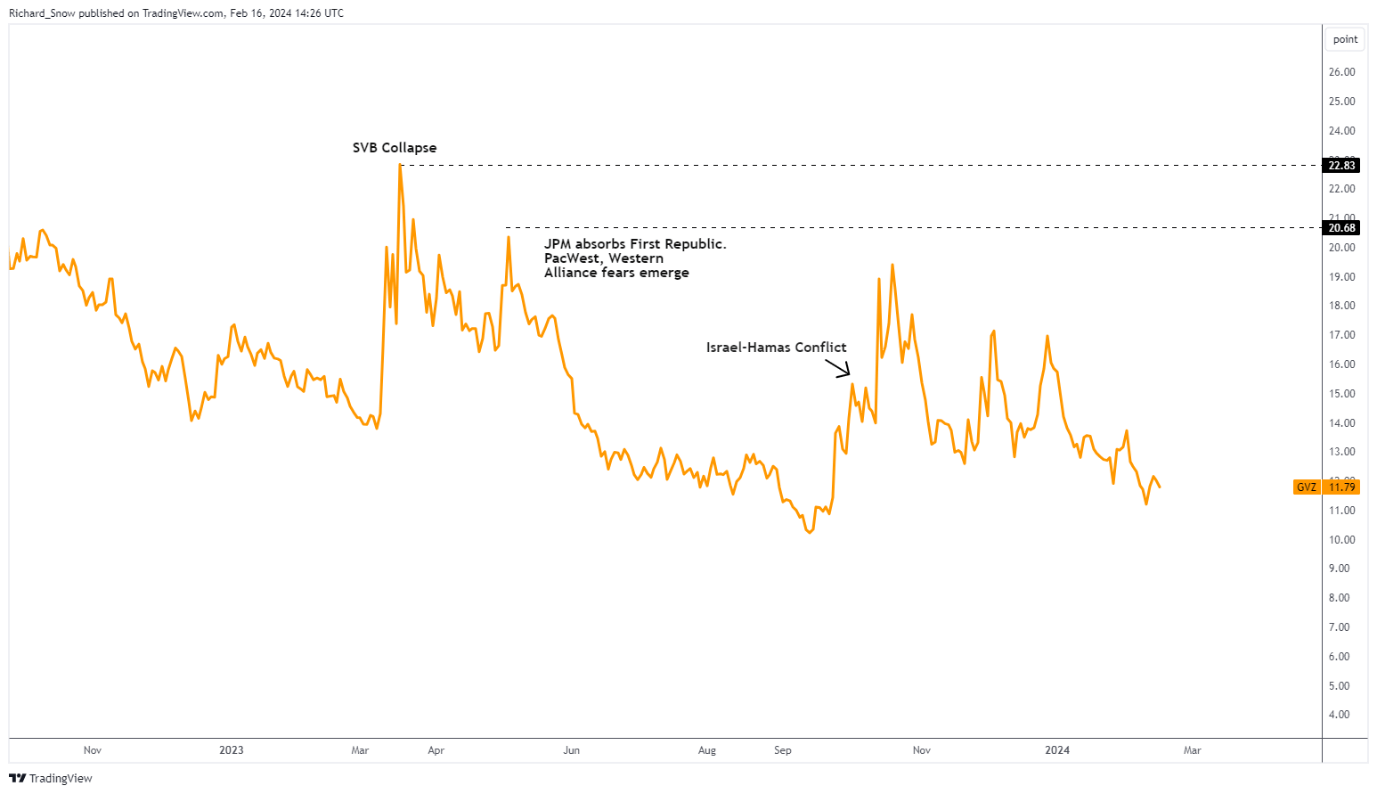
In addition, implied 30-day gold volatility continues to peter out as global conflict drags on. For context, gold prices tend to thrive in more volatile conditions meaning that the current volatility downturn may limit upside potential for the precious metal.

Implied 30-Day Volatility (GVZ)

image2.png

If you’re puzzled by trading losses, why not take a step in the right direction? Download our guide, “Traits of Successful Traders,” and gain valuable insights to steer clear of common pitfalls:

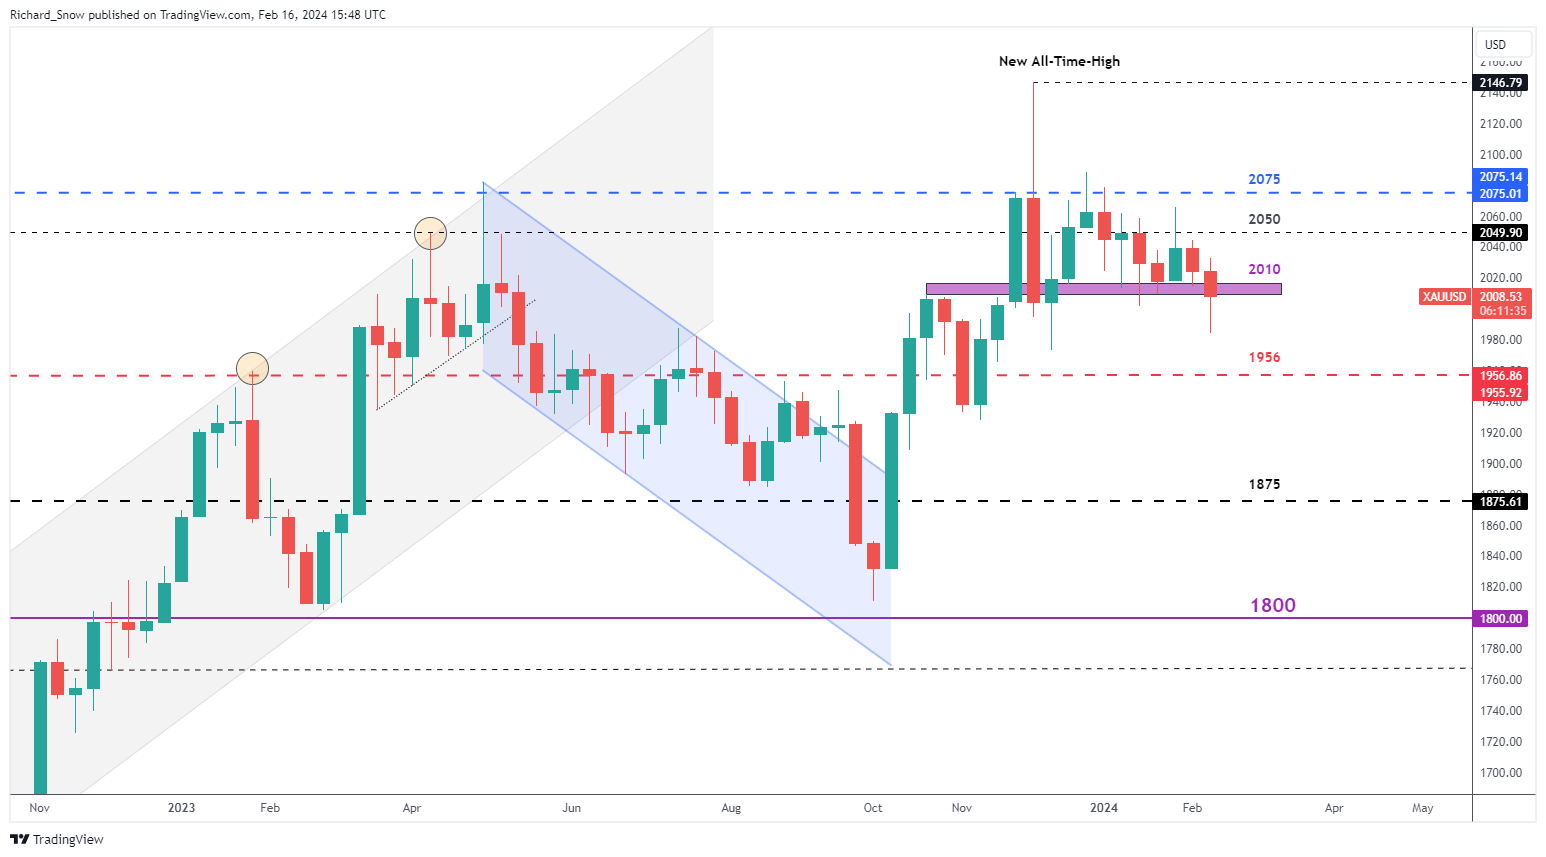
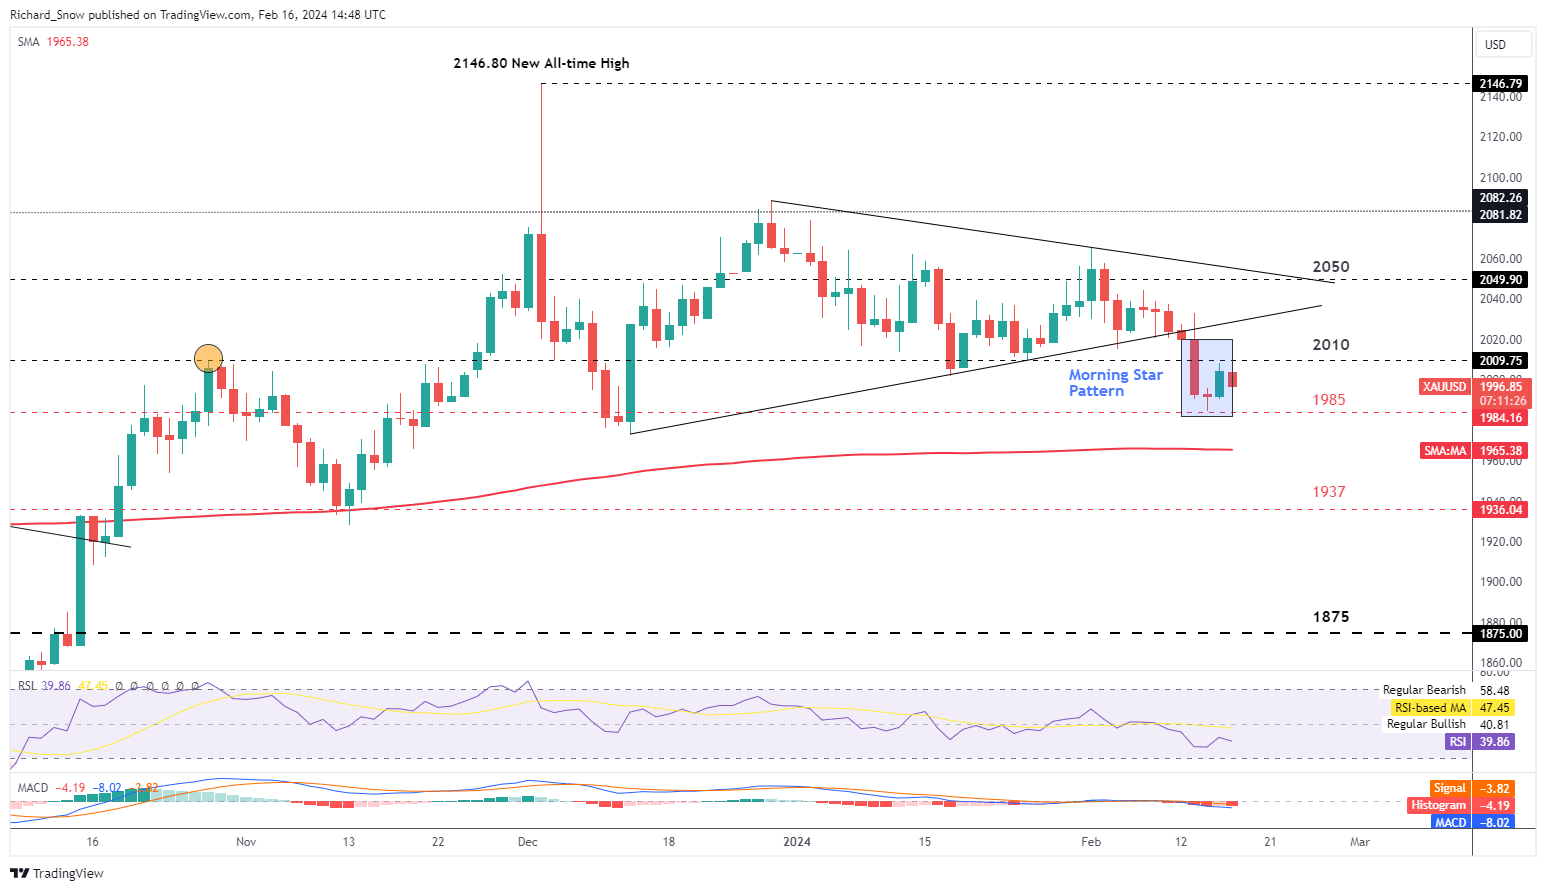
Gold Reluctant to Break Down – $2010 Level Remains Key

Gold appeared on track to close below the zone of support around $2010 but the post PPI dollar pullback saw the precious metal claw back weekly losses. The weekly chart shows persistent pressure on the support zone with lower highs continuing from the end of last year. The narrowing of price action suggests another attempt to break below $2010 is just a matter of time. Next week scheduled event risk is relatively quiet with the FOMC minutes and flash PMI the pick of the ‘high impact’ events that may add to the positive sentiment around the US economy, weighing on gold.

In the event gold does close below the support zone, the next challenge appears via the prior spike lows at $1984 and $1973 respectively. However, failure to overcome the resistance zone, may sideline bears for the time being before inevitably mounting another attempt from more attractive levels. $2050 stands firm as resistance followed by $2075 which appears a long way from current levels.

Gold Weekly Chart

image3.png

The daily chart reveals a more bullish outlook for short-term gold prices. On Friday gold rose at the end of the trading session in line with the morning star candlestick pattern provided on Thursday (highlighted in blue).

The pattern attracts greater conviction at the bottom or a mature downtrend but still provides a valuable signal that bearish momentum was halted abruptly, followed by early signs of a move higher. The pattern also found support at $1985 (a prior level of resistance) before reversing higher.

Gold Daily Chart

image4.png

Silver Faces Short-Term Resistance but Consolidates over the Longer-term

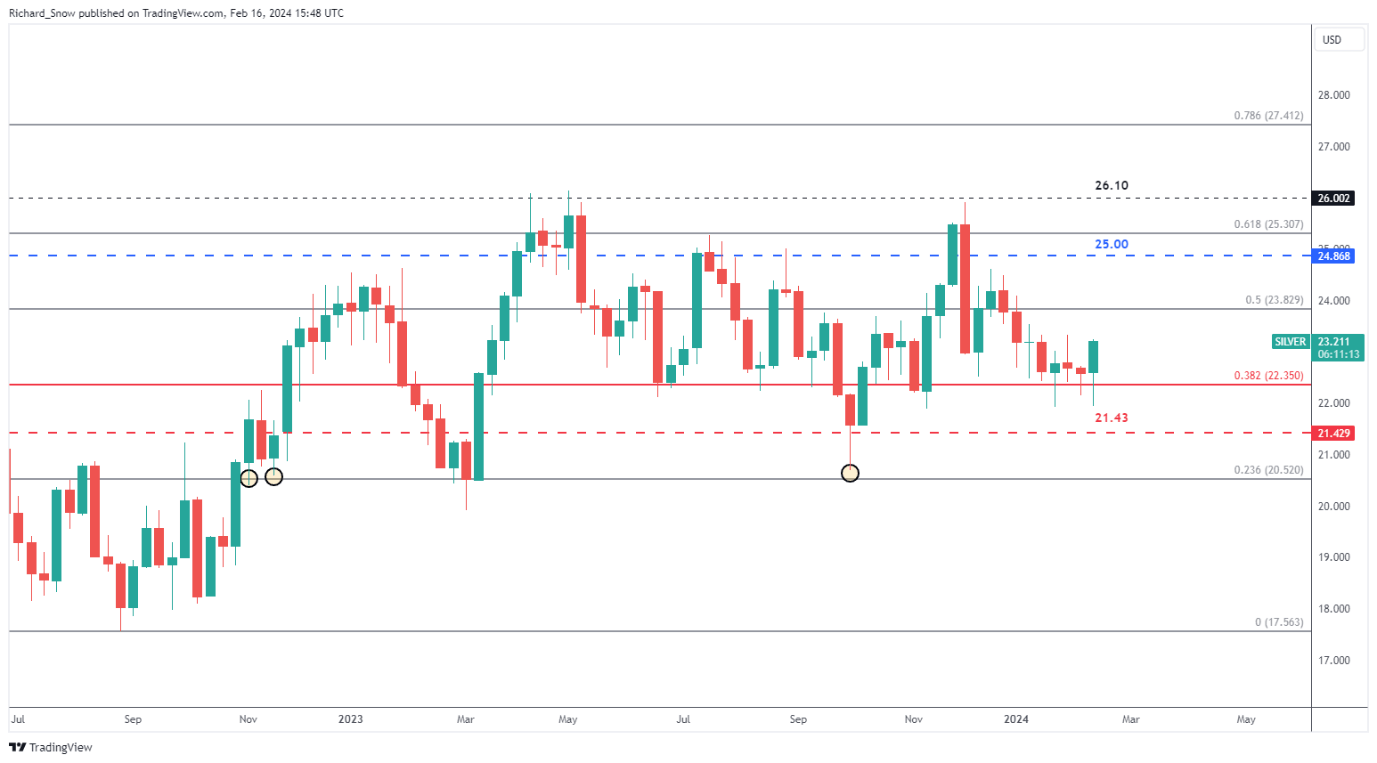
The weekly silver chart reveals a strong tendency for prices to find support at the 38.2% Fibonacci retracement of the 2021 to 2022 major decline highlighted as the solid red line ($22.45). As the week draws to a close, prices have attempted once again to close below this key level but without success. Therefore, when taking a step back, it appears that silver prices may be in the midst of a longer-term mean reversion towards $23.90 and even $25.00.

Silver Weekly Chart

image5.png

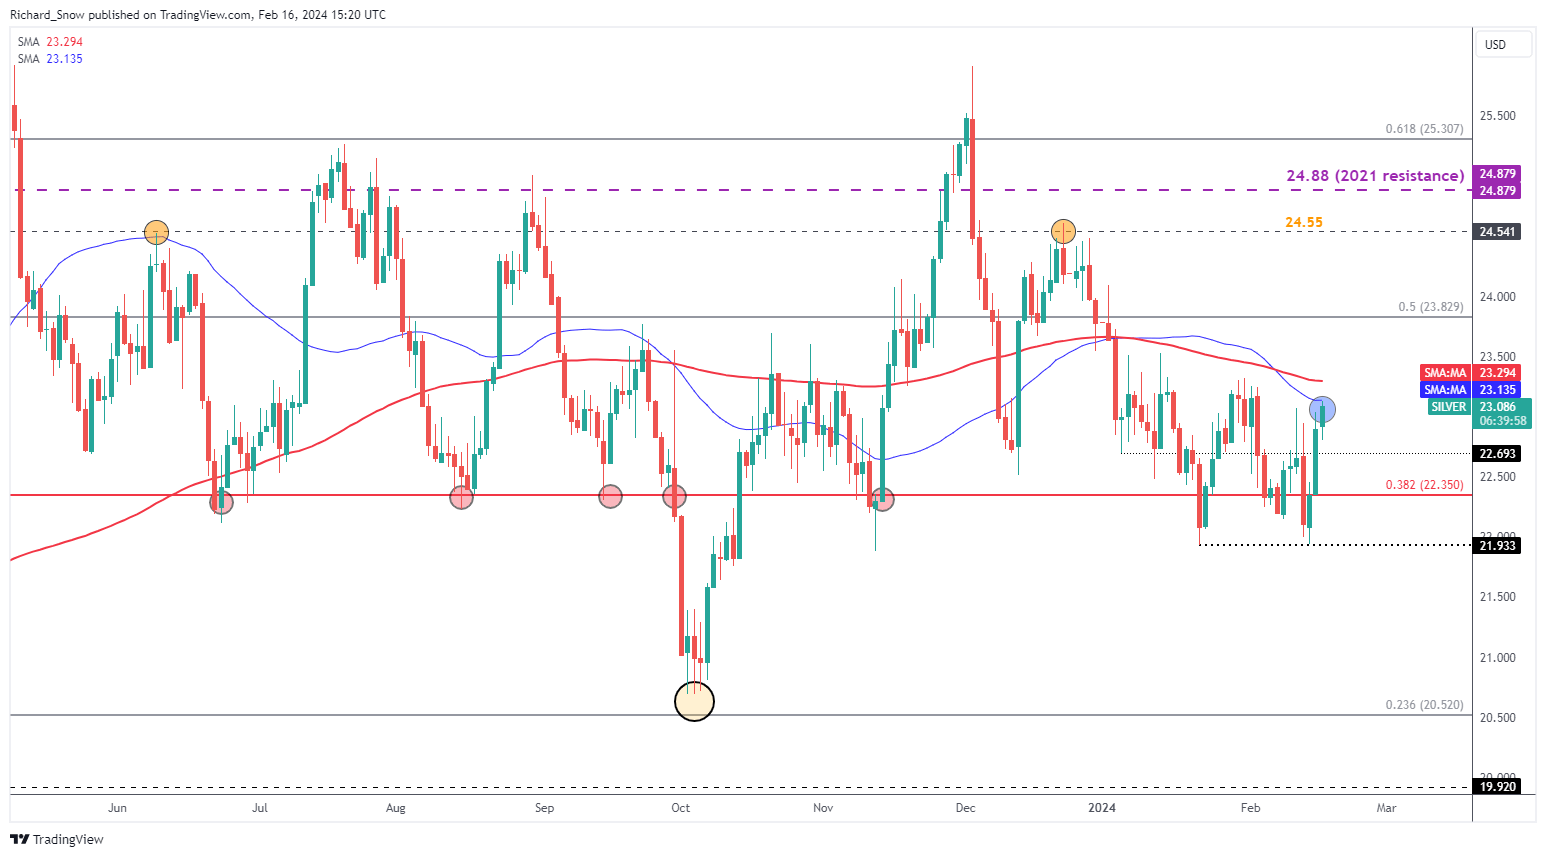
However, on the daily chart silver appears to have run into a zone of resistance comprised of the 50 and 200-day simple moving averages. The 200 SMA has acted as dynamic resistance for silver during 2024 thus far, capping upside potential for the metal.

Keep a watchful eye on how silver responds to this latest test of bullish resolve in the week to come. This year, the market has been unable to break and close above it opening the door to a retest of $23.30 again.

Silver Daily Chart

image6.png

US Dollar Forecast: Bullish Bias Prevails; Setups on EUR/USD, USD/JPY, USD/CAD

US Dollar Forecast: Bullish Bias Prevails; Setups on EUR/USD, USD/JPY, USD/CAD

Earlier this year, the market consensus indicated the Federal Reserve would deliver about 160 basis points of easing in 2024. However, these dovish expectations have been dialed back this month following stronger-than-forecast U.S. jobs growth and sticky inflation data, with traders now anticipating only 80 basis points of rate cuts for the year.

The recent repricing of the Fed’s policy outlook has boosted the U.S. dollar across the board, propelling the DXY index up by about 1.8% in the last three weeks. While gains may not unfold linearly going forward, there appears to be room for further upside, especially if incoming information confirms that progress on disinflation is faltering.

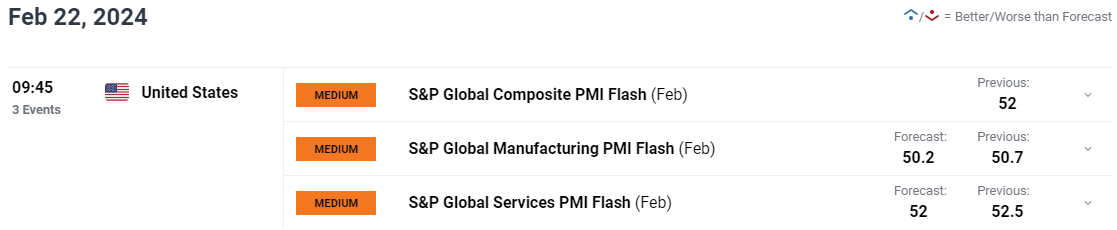
Looking ahead to the coming week, the spotlight will be on two key events: the FOMC minutes and the release of the S&P Global PMIs for February. The former could provide illuminating details on discussions surrounding the start of the easing cycle, while the latter stands to offer valuable insights into the current state of the U.S. economy.

image1.pngimage2.png

Leaving fundamental analysis aside for now, in the next part of this article we’ll delve into the technical outlook for the three major U.S. dollar pairs: EUR/USD, USD/JPY and USD/CAD. Here we will examine the significant price thresholds that every forex trader should have on their radar in the upcoming sessions.

Access our Q1 trading forecast to get a detailed analysis of the euro‘s medium-term prospects. Download it for free today!

 EUR/USD FORECAST – TECHNICAL ANALYSIS

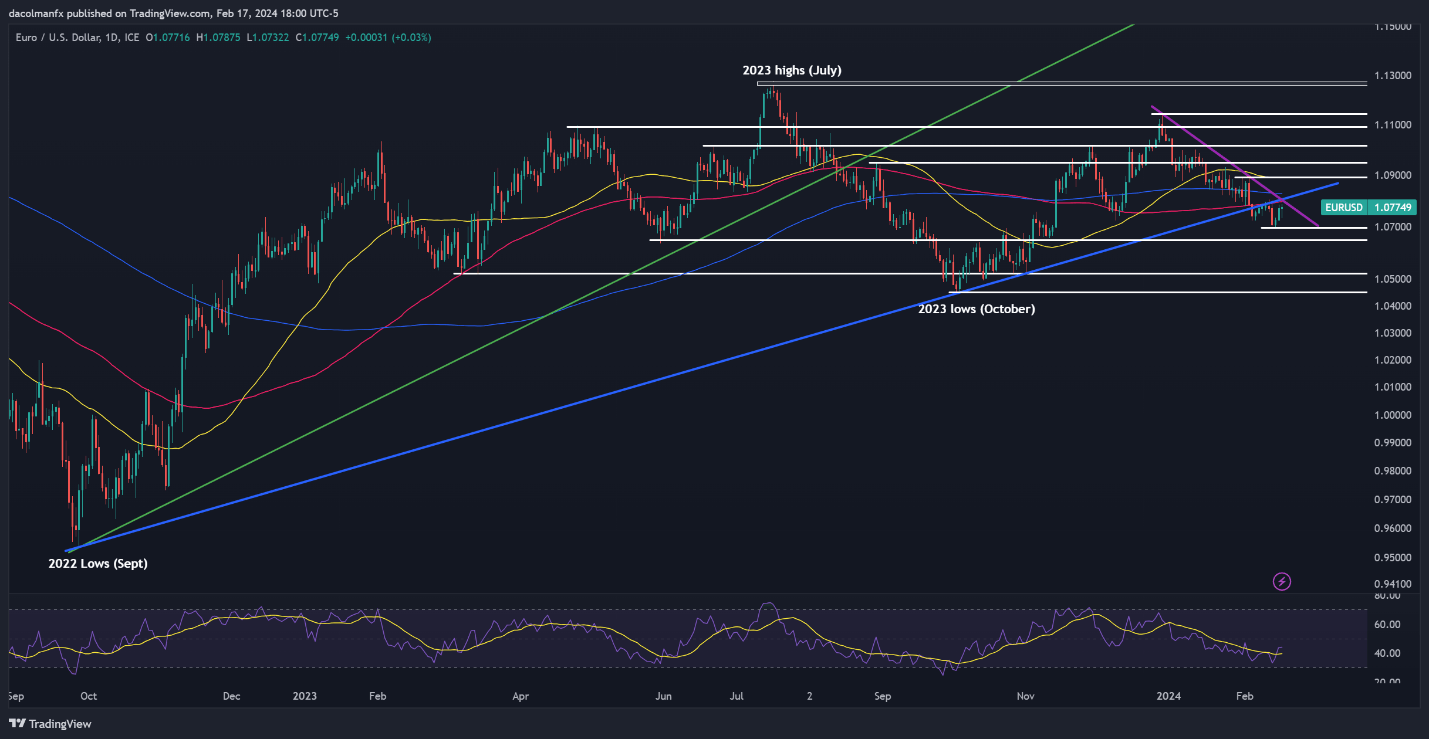
EUR/USD edged up on Friday after bouncing off technical support near the 1.0700 handle earlier in the week. If gains accelerate in the coming days, confluence resistance around 1.0800 will act as the first line of defense against further advances. Beyond this point, attention will be on the 200-day simple moving average at 1.0825, followed by the 50-day simple moving average at 1.0890.

Conversely, if sellers stage a comeback and trigger a bearish reversal, support emerges at 1.0700, as previously indicated. Bulls will need to vigorously defend this region; failure to do so could lead to a downward move towards 1.0650. Prices are likely to stabilize in this area during a pullback, but a decisive breakdown could prompt a drop towards 1.0520.

EUR/USD CHART – TECHNICAL ANALYSIS

A screenshot of a computer screen  Description automatically generated

Eager to discover what the future holds for the Japanese yen? Delve into our Q1 trading forecast for expert insights. Get your free copy now!

USD/JPY FORECAST – TECHNICAL ANALYSIS

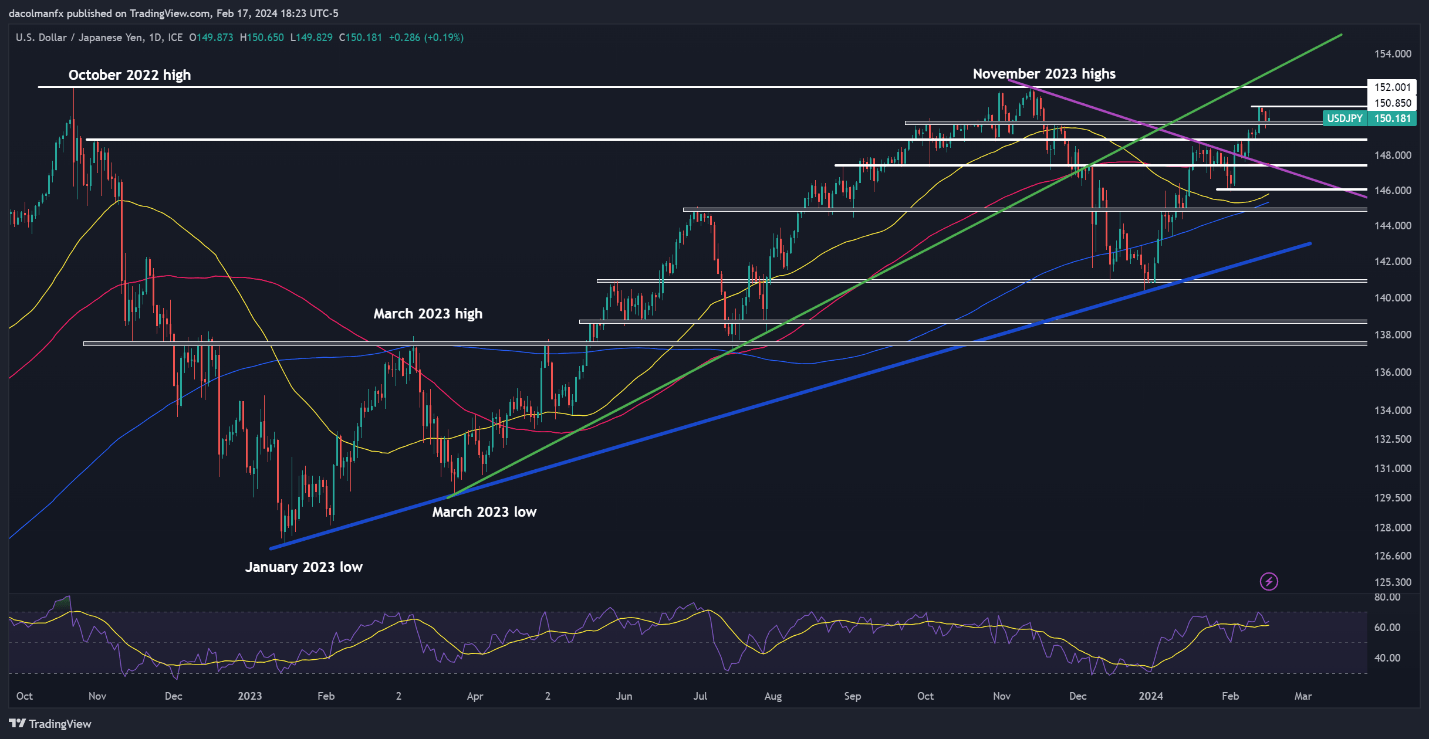
USD/JPY gained ground on Friday, consolidating its position above the 150.00 handle, yet unable to surpass the high achieved earlier in the week. Despite the pair’s upward trend, the exchange rate is nearing levels that could prompt Tokyo to increase verbal intervention or contemplate actions to bolster the yen. This may cap the U.S. dollar’s upside or trigger a reversal in the near term.

Discussing potential outcomes, if USD/JPY loses upward momentum and shifts downward, support is seen at 150.00, followed by 148.90. On further weakness, all eyes will be on 147.40. On the other hand, if USD/JPY defies expectations and continues its climb, resistance looms at 150.85. Further progression to the upside might bring last year’s peak near 152.00 into view.

USD/JPY TECHNICAL CHART

A screenshot of a computer screen  Description automatically generated

Delve into how crowd psychology may influence FX market dynamics. Request our sentiment analysis guide to grasp the role of retail positioning in predicting USD/CAD’s near-term direction.

USD/CAD FORECAST – TECHNICAL ANALYSIS

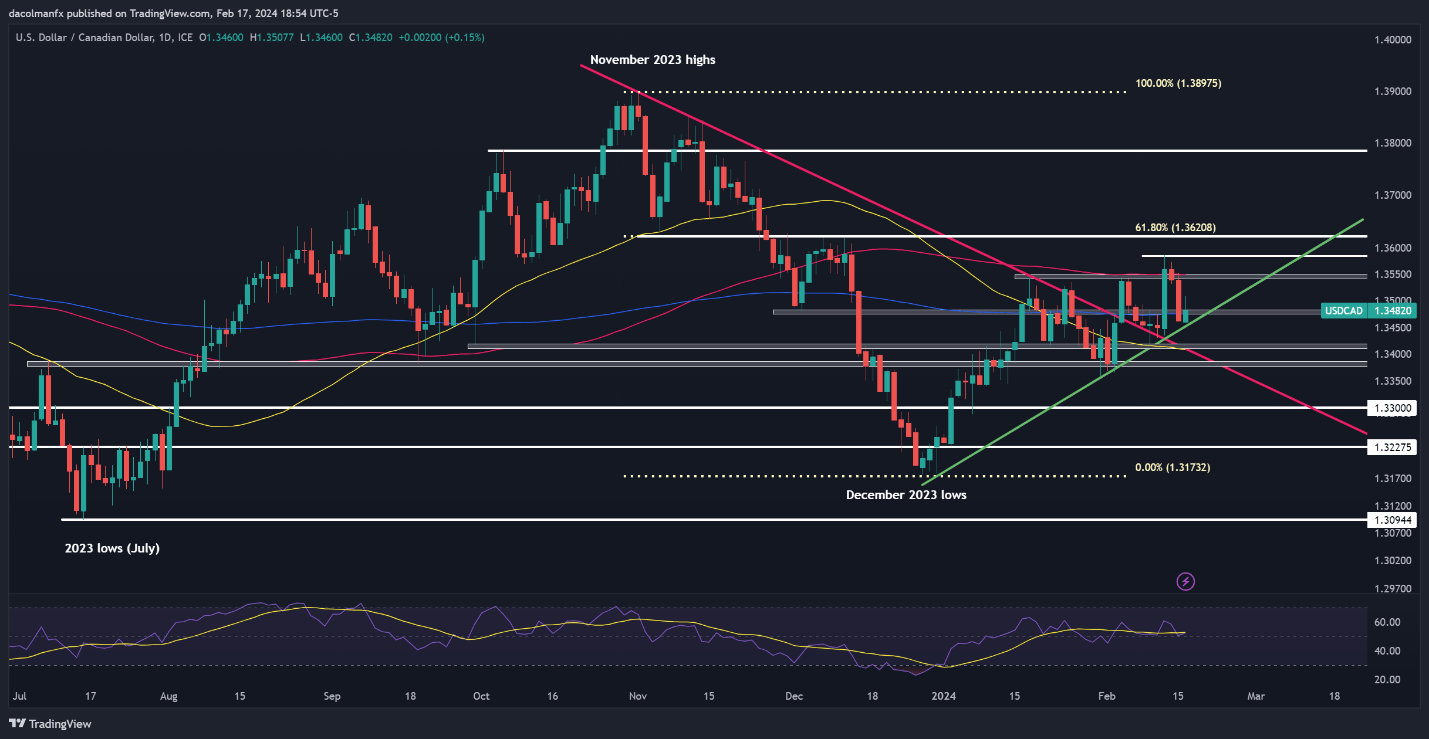
Following a rebound from trendline support, USD/CAD pushed higher on Friday, closing above its 200-day simple moving average – a positive signal for price action. Should the pair build upon its recent gains over the coming days, resistance can be spotted at 1.3545, followed by 1.3585. Beyond this ceiling, bulls will have their sights on 1.3620 – the 61.8% Fib retracement of the November/December slump.

On the flip side, if sellers return and spark a move lower, technical support stretches from 1.3480 to 1.3460. Breaching this technical floor will be a tough task for the bears, but in the event of a breakdown, a rapid descent towards 1.3415 could be around the corner. From here onwards, additional losses could bring 1.3380 into sharper focus.

USD/CAD TECHNICAL CHART

A screenshot of a computer screen  Description automatically generated


Gold (XAU/USD) Nudges Higher in Early Trade, Resistance Levels Near

Gold (XAU/USD) Nudges Higher in Early Trade, Resistance Levels Near

Gold (XAU/USD) Analysis and Chart

US equity and bond markets are closed for the day – US Presidents’ Day holiday – and this will weigh on market activity across a range of asset classes. Activity over the rest of the week should pick up with FOMC minutes, the release of the February PMIs, and chip-giant Nvidia’s earnings all worthy of attention. In addition, a handful of Fed speakers will give their latest thoughts on the economy, and maybe a steer on the future path of US interest rates.

For all market-moving economic data and events, see the DailyFX Economic Calendar.

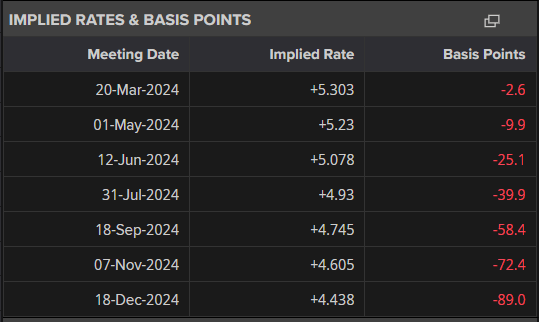
The precious metal is continuing last week’s move despite hotter-than-expected US CPI and PPI data. Market rate-cut expectations continue to be pared back with the first cut now seen at the June meeting with a total of 90 basis points of cuts priced in for this year. In late December, the market forecast the first cut at the March meeting and expected a total of 175 basis points of cuts.

image1.png

We noted last week that gold was heavily oversold using the CCI indicator – see the story at the top of this article – and this weakness is currently being reversed. A move higher will find initial resistance from the 20-dsma at $2,023/oz. and ta prior level of horizontal resistance, and the 50-dsma around $2,033/oz. Initial support at $2,000/oz. ahead of $1,987/oz.

Gold Daily Price Chart

Retail trader data shows 65.66% of traders are net-long with the ratio of traders long to short at 1.91 to 1. The number of traders net-long is 0.33% higher than yesterday and 3.79% lower than last week, while the number of traders net-short is unchanged than yesterday and 3.01% lower from last week