Range Trading

Range Trading

How many different types of market environments are there?

To be sure, we can line out a litany of different backdrops that traders might find. But, if we reduce price movements to their lowest common denominator, there’s really only two things that a market can be doing, right?

Either a market is trending or it’s not. If prices are making fresh higher-highs and higher-lows we have an uptrend. If they’re making lower-lows and lower-highs, we have a down-trend. If it’s doing neither, we don’t have any trend at all.

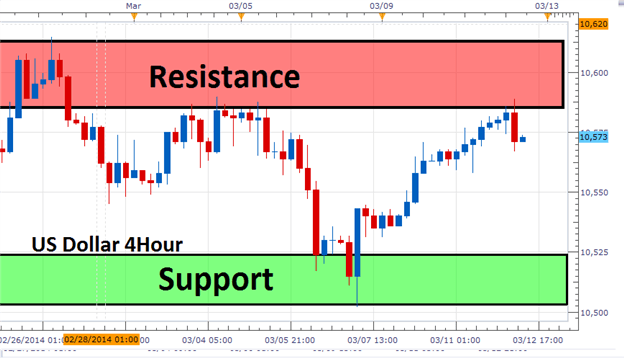
That trend-less state is often called a ‘range’ but that can be misleading: Ranges usually have symmetry attached to them, with some element of even distribution at or around support and resistance, thereby helping to keep prices bounded in this narrow channel on the trading chart.

For anyone who spends enough time analyzing charts will soon learn that perfect ranges rarely show up. This is the type of market environment that trading educators might need to spend 30 minutes or an hour to find a textbook range in order to illustrate their articles with what an even, perfect range might look like.

However, in practice this is misleading; because most of the trendless states that you’ll find in markets won’t have a lot of symmetry, and sometimes they’re just straight up messy. So first things first, let’s define a range.

What is a Range

A range is a market bound between support and resistance, displaying no discernible trend, which is then prone to mean reversion.

But identifying a range can be a subjective matter, as what might be a range to one trader may not appear as a range to another, and that’s before we even get into the matter of timeframes. Perhaps the market is ranging on the hourly but is that really a range if it’s just a pause point in a bigger-picture trend on the daily chart?

In our prior article on the Average Directional Index, or ADX, we looked at an indicator with the sole purpose of denoting trend strength. The benefit of such an indicator is that it’s not trying to do many things at once, it’s solely an indication of trend strength as denoted over the past x periods (with x being the input from the trader), commonly 14 periods.

 When making use of this technical indicator, ranges can then be defined as environments in which ADX reads below the value of 20. As illustrated on the daily chart below, EUR/USD has the ADX indicator applied, and each instance of the indicator moving below 20 has been marked by a blue box with a corresponding blue box added on the price chart over that period.

EUR/USD Daily Price Chart

Chart prepared by James Stanley; EUR/USD, July 2020 – March 2022

Why Trade Ranges?

In global markets where many investors have access to stocks, currencies and commodities, there’s not a great reason to trade a market environment that you’re not comfortable with.

With that said, many traders elect to focus on ranges while ignoring breakouts or even trends. One of the main reasons traders will seek out ranges is consistency. It’s a simple if/then statement, which can allow for simpler risk management. If the range breaks, the trader probably doesn’t want to hang around in that environment for much longer.

And if we want to extend the conversation to include mean-reversion, this could also include reversals which are traditionally a dangerous type of environment to navigate because, by default, the trader is looking for something ‘new’ to happen. However, the luxury of such an approach is the clear lines of risk management that can be set. If a trader is looking to trade mean reversion off of a support level, and the support level then breaks, the trader can attempt to get out of the trade quickly with the goal of loss mitigation, rather than just sitting around and hoping that the trade comes back above their entry point.

Top Continuation Patterns Every Trader Should Know

Top Continuation Patterns Every Trader Should Know

What are continuation patterns?

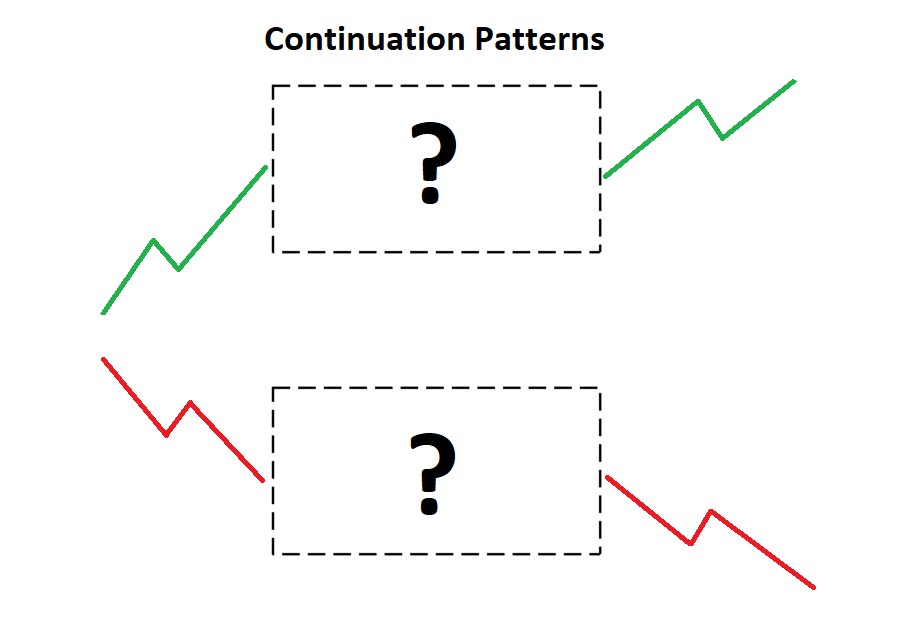
Continuation Patterns are recognizable chart patterns that signify a period of temporary consolidation before continuing in the direction of the original trend. Consolidation appears in the form of sideways price movement. The pattern completes itself upon a strong breakout of the consolidation zone, resulting in the continuation of the preceding trend. Continuation patterns usually play out over the short to intermediate term.

continuation chart patterns

Bullish continuation patterns

Bullish continuation patterns appear midway through an uptrend and are easily identifiable. The main bullish continuation patterns are introduced below.

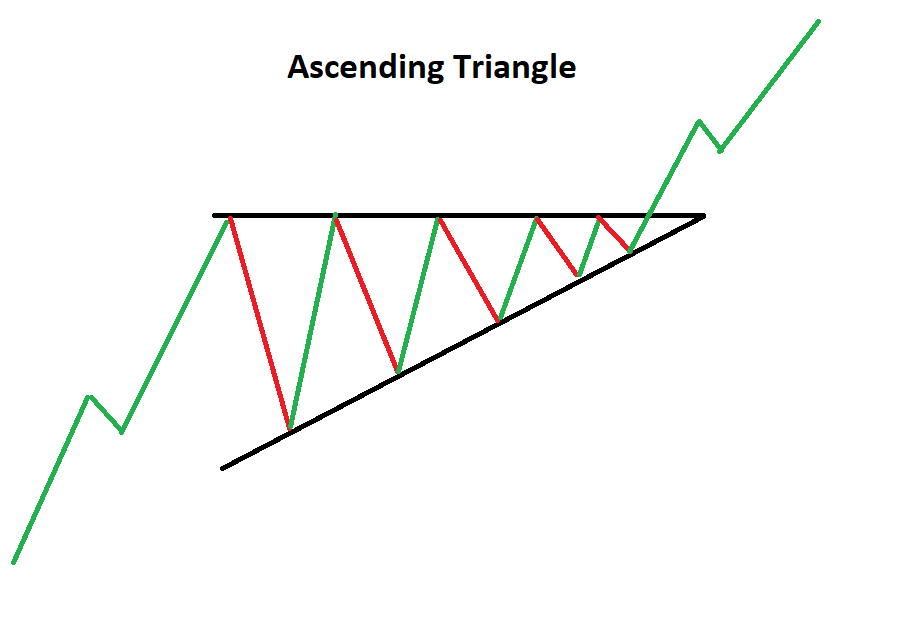
1. Ascending triangle

An ascending triangle pattern is a consolidation pattern that occurs mid-trend and usually signals a continuation of the existing trend. The pattern is formed by drawing two converging trendlines (flat upper trendline and rising lower trendline), as price temporarily moves in a sideways direction. Traders look for a subsequent breakout, in the direction of the preceding trend, as a cue to enter a trade.

Ascending triangle continuation pattern

2. Bullish Pennant

A bullish Pennant pattern is a continuation chart pattern that appears after a security experiences a large, sudden upward movement. It develops during a period of brief consolidation, before price continues to move in the direction of the trend with the same initial momentum.

The triangular pattern is called a Pennant, which is made up of numerous forex candlesticks and is not to be confused with the larger, symmetrical triangle pattern.

Bullish pennant continuation pattern

3. Bullish Flag

The bullish flag pattern is a great pattern for traders to master. Explosive moves are often associated with the bull flag as it provides a temporary respite to a sharp initial move. The bull flag and pennant pattern appear under the same conditions (sharp and sudden move in price) however the bull flag can offer more attractive entry levels.

The bull flagis characterized by a downward sloping channel denoted by two parallel trendlines against the preceding trend.

Bullish flag continuation candlestick pattern

4. Bullish Rectangle pattern

The rectangle pattern characterizes a pause in trend whereby price moves sideways between a parallel support and resistance zone. The pattern indicates a consolidation in price before continuing in the original direction of the existing trend. The added benefit of this pattern is that traders have the opportunity to trade within the range or trade the eventual breakout, or both.

Bullish rectangle pattern

Bearish continuation candlestick patterns

Bearish continuation patterns appear midway through a downtrend and are easily identifiable. The bearish versions of the similar patterns introduced above have the same impact but in the opposite direction. The main bearish continuation patterns are introduced below.

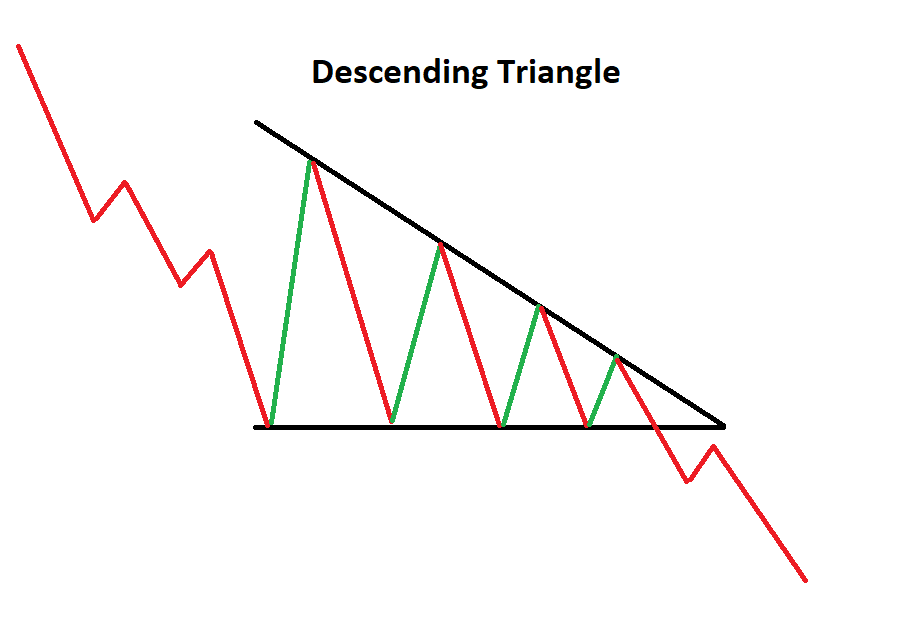
1. Descending Triangle

The descending triangle pattern is a consolidation pattern that occurs mid-trend and usually signals a continuation of the existing downtrend. The pattern is formed by drawing two converging trendlines (descending upper trendline and flat lower trendline), as price temporarily moves in a sideways direction. Traders look for a subsequent breakout, in the direction of the preceding trend, as a milestone to enter a trade.

Descending triangle continuation pattern

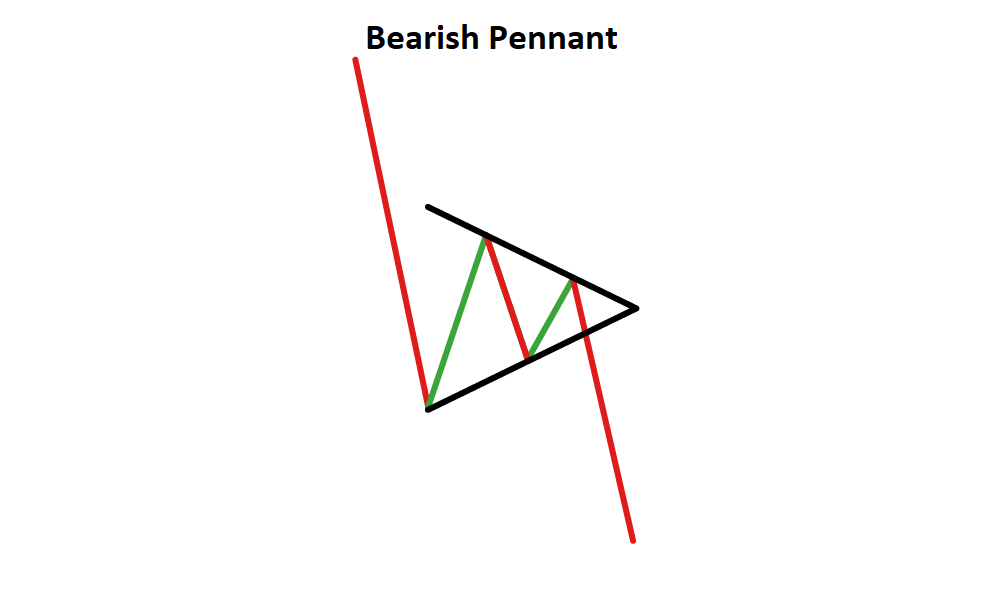
2. Bearish Pennant

The bearish pennant is a continuation chart pattern that appears after a security experiences a large, sudden drop. It develops during a period of brief consolidation, before price continues lower, in the direction of the prevailing trend.

bearish pennant continuation pattern

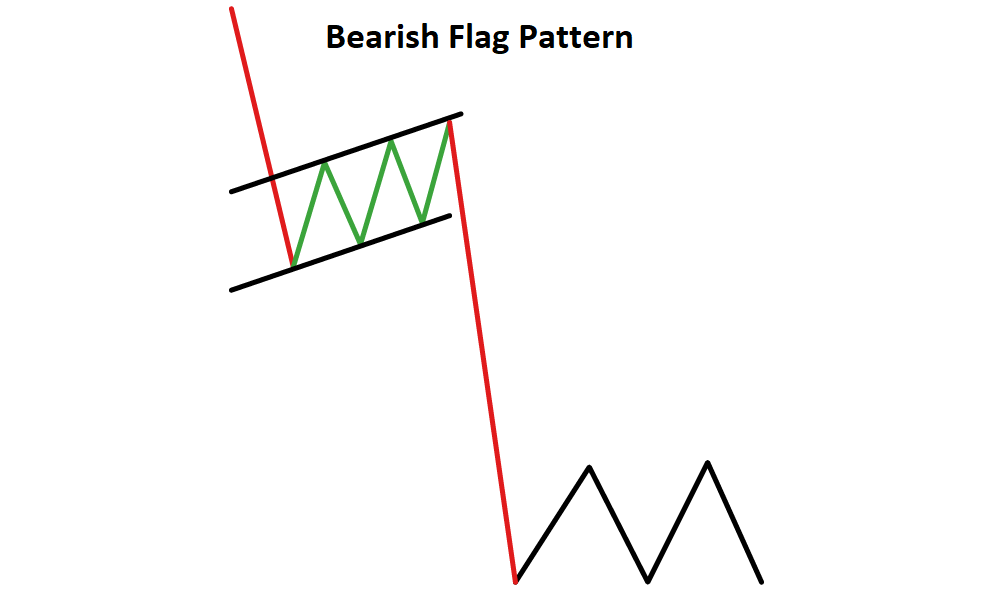
3. Bearish flag

Just like the bullish flag, the bearish flag is often associated with explosive moves before and after the appearance of the flag.

The bear flagis characterized by an upward sloping channel denoted by two parallel trendlines slanting against the preceding trend.The flag is not to be confused with the rectangle pattern. The flag is completed in a much shorter time period (one to three weeks) compared to the rectangle pattern and has a noticeable gradient.

bearish flag candlestick pattern

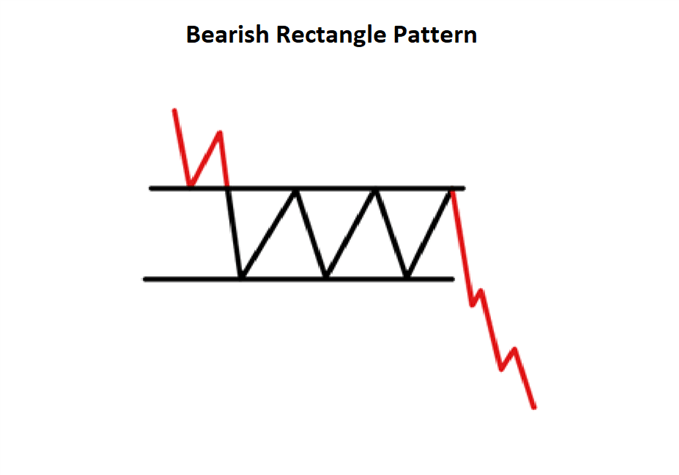
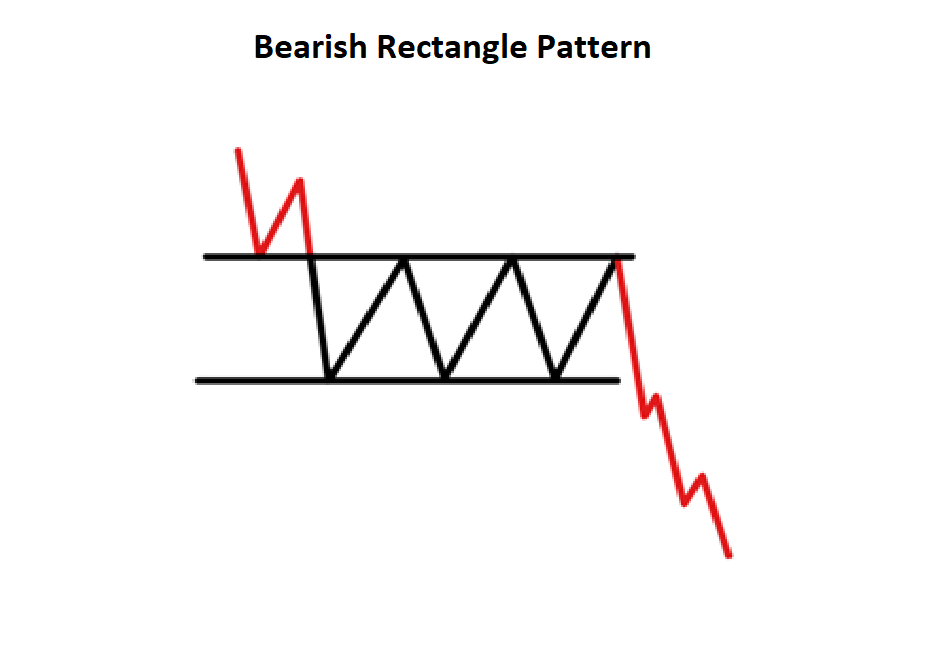
4.Bearish Rectangle

The bearish rectangle pattern characterizes a pause in trend whereby price moves sideways between a parallel support and resistance zone. The pattern indicates a consolidation in price before continuing in the original direction of the existing trend. Traders have the opportunity to trade within the range or trade the eventual breakout, or both.

Bearish rectangle pattern

Trading continuation patterns

Continuation patterns tend to be goodindicators of future price movement,provided traders adhere to the following tips:

  1. Identify the direction of the trend before price starts to consolidate.
  2. Make use of trendlines to identify which continuation pattern may be developing.
  3. After successfully identifying the continuation pattern, set appropriate stops and limits while adhering to a positive risk to reward ratio.
  4. Traders can wait for a strong breakout in the direction of the trend before entering. Furthermore, traders should consider placing a tight stop to protect from a false breakout and trail this stop if the market moves favorably. Consider this and other risk management strategies to employ.

Are continuation patterns the same for forex and stock trading?

Yes, continuation patterns are the same for forex and stock trading. While there are noticeable differences when comparing forex vs stocks, continuation patterns can be applied with the same conviction. It’s not about the market itself, but is more about what the pattern reveals about price action.

Euro Weekly Forecast: Central Bankers Delay the Rate Cutting Cycle

Euro Weekly Forecast: Central Bankers Delay the Rate Cutting Cycle

Central Bankers in No Rush to Cut Rates

The theme among global central bankers this week centered around delaying the start date of interest rate cuts. The slightly hawkish FOMC minutes kicked things off this week followed closely by comments from prominent Fed officials in favour of delaying the start date of interest rate cuts.

However, Europe is not in the enviable position the US finds itself in. The world’s largest economy has outperformed growth expectations, maintains a tight labour market, and the consumer appears healthy on the surface at least. Europe, on the other hand, has narrowly avoided a technical recession on multiple occasions, saved by the narrowest of margins as quarterly GDP growth oscillates around zero.

However, markets now price in a similar trajectory of future interest rate cuts for the two very different economies, projecting a little more than three 25 basis point cuts this year with futures markets pricing 85bps for the Fed and 88bps for the ECB in December.

Bundesbank head Joachim Nagel referred to the fact that the ECB will only get key price data in Q2, anchoring expectations of a possible cut around the mid-year mark. Earlier on Friday, The ECB’s Robert Holzmann reiterated that the ECB typically follows on from the Fed when it comes to the timing of rate adjustments, which further tapered rate cut bets. The ECB minutes of the January meeting revealed that the risk of cutting too soon still outweighed the risk cutting interest rates too late and subjecting the economy to unnecessary stress.

The euro is the currency pair adopted by European countries within the Euro Area and represents the second most liquid currency in the world. Learn the nuances around trading EUR/USD in our dedictated guide below:

EUR/USD Reveals Short-Term Resistance Amid Longer-Term Advance

The weekly EUR/USD chart shows a notable rejection of the prior weekly low of 1.0724 – a level that has supported prices multiples times in the past. The pair is also on track to post a weekly recovery after bearish price action showed signs of slowing down in the prior two weeks with very thin candle bodies.

EUR/USD Weekly Chart

image1.png

It is among this backdrop that daily price action provides an indication that shorter-term bullish momentum may be waning. The Thursday spike high tagged the 50-day simple moving average (SMA) before retreating and Friday provided a modest move, limited by the 200 SMA and the 1.0831 level.

With markets expecting similar rate cut paths for the two economies, the dollar’s superior interest rate differential may help recover recent losses against the euro especially if PCE data beats estimates for January.

EUR/USD Daily Chart

image2.png

EUR/GBP Back at Key Support Zone, Providing the Next Big Test

EUR/GBP has respected multiple technical levels since the start of this year as momentum and follow through have been lacking. Numerous tests of the zone of support around 0.8515 have resulted in an attempt to head higher but a lack of momentum has subjected the pair to sideways trading.

More recently, the 50 SMA and underside of the prior ascending trendline were enough to repel bulls, sending the pair back towards the support zone. In the event the euro comes under pressure this week, the swing low of 0.8500 may come into focus with a weekly close below that opening up the potential for a more sustained bearish reaction.

There are three main market conditions: trending, ranging and breakout. Master all three with out comprehensive guide below:

However, most major FX pairs have lacked the ability to trend, meaning continued sideways action is most likely, in the absence of external shocks or massive deviations in high importance data.

EUR/GBP Daily Chart

image3.png

EUR/JPY Bull Run Showing Signs of Fatigue Ahead of Crucial Japanese CPI Print

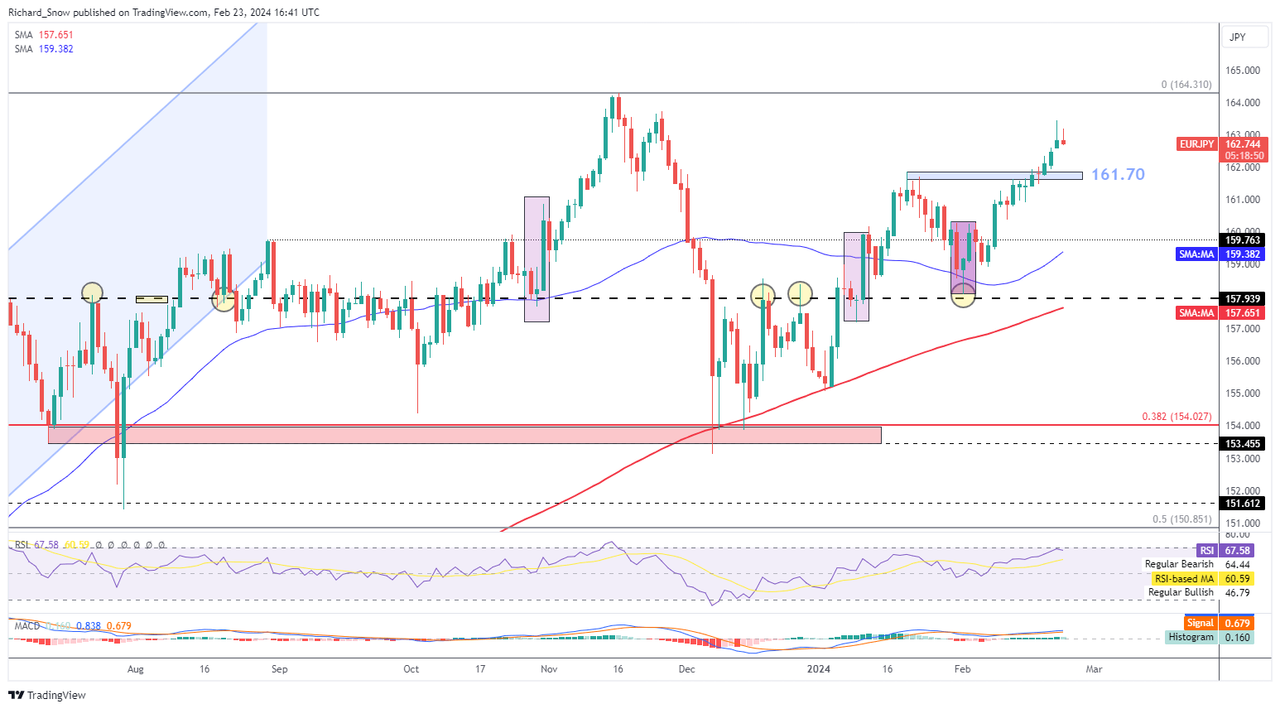
EUR/JPY has been on an impressive run, surpassing the prior zone of resistance (161.70) with relative ease, however, towards the end of the week price action revealed a slowdown in bullish momentum.

Thursday’s swing high pulled back, leaving an extended upper wick in full view. On Friday, the daily candle revealed a doji – suggesting a slowdown in prior momentum. The yen has depreciated against most majors, with most of the focus on USD/JPY and the 150 marker as the finance ministry has reiterated its displeasure with the sharp depreciation of the local currency.

Nevertheless, market participants have not heeded the jawboning of officials and continue to trade the yen around undesirable levels. While the trend remains to the upside, daily candles hint that prices may head lower at the start of next week which would be aided by a hotter than expected inflation print. Inflation in Japan has eased in recent prints, raising doubts about the much-anticipated rate hike from the Bank of Japan.

Hotter inflation may provide the catalyst for a pullback towards 161.70 but should inflation continue to ease, the pair may have eyes ion the prior swing high around 164.82.

EUR/JPY Daily Chart

image4.png

Major Risk Events in the Week Ahead

First up, Japanese inflation data could impact the yen even further should inflation follow the recent trend lower – raising doubts around one of the Bank of Japan’s two conditions for policy normalisation. Potentially bullish for EUR/JPY but this is fraught with complexity as the Japanese finance ministry could deploy the use of FX intervention at any time.

German unemployment and inflation data for Feb comes into view after the Bundesbank suggested that Germany may already be in recession.

A second look at US Q4 GDP has the potential to provide intra-day volatility but a major reaction is unlikely in the absence of a massive deviation from the first estimate. Then on Friday US PCE data provides another crucial piece of the inflation puzzle.

image5.png


Gold (XAU/USD) Price Struggles for Direction, Silver (XAG/USD) Looks Boxed In

Gold (XAU/USD) Price Struggles for Direction, Silver (XAG/USD) Looks Boxed In

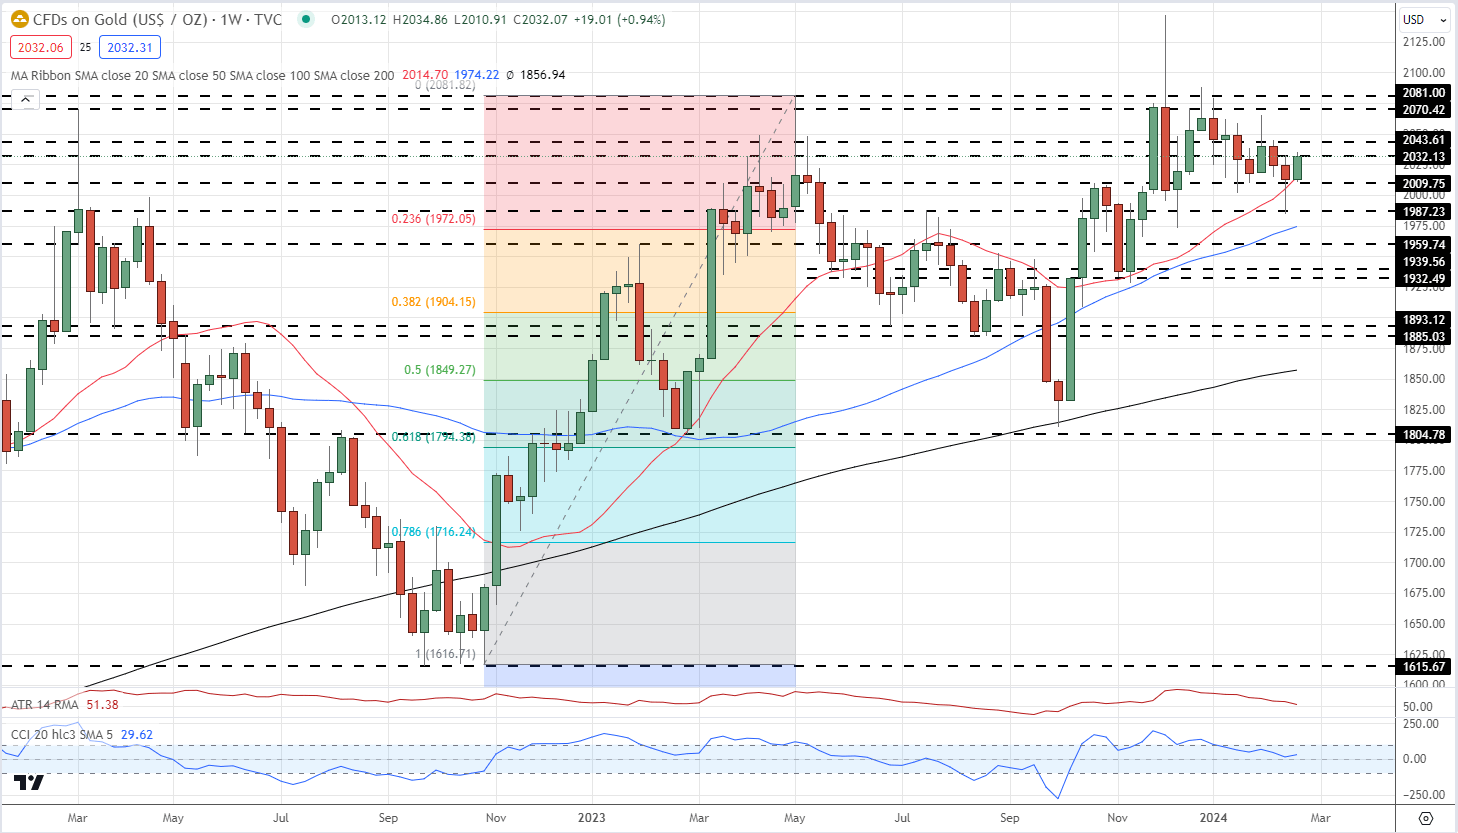
Gold Weekly Price Chart

image2.png

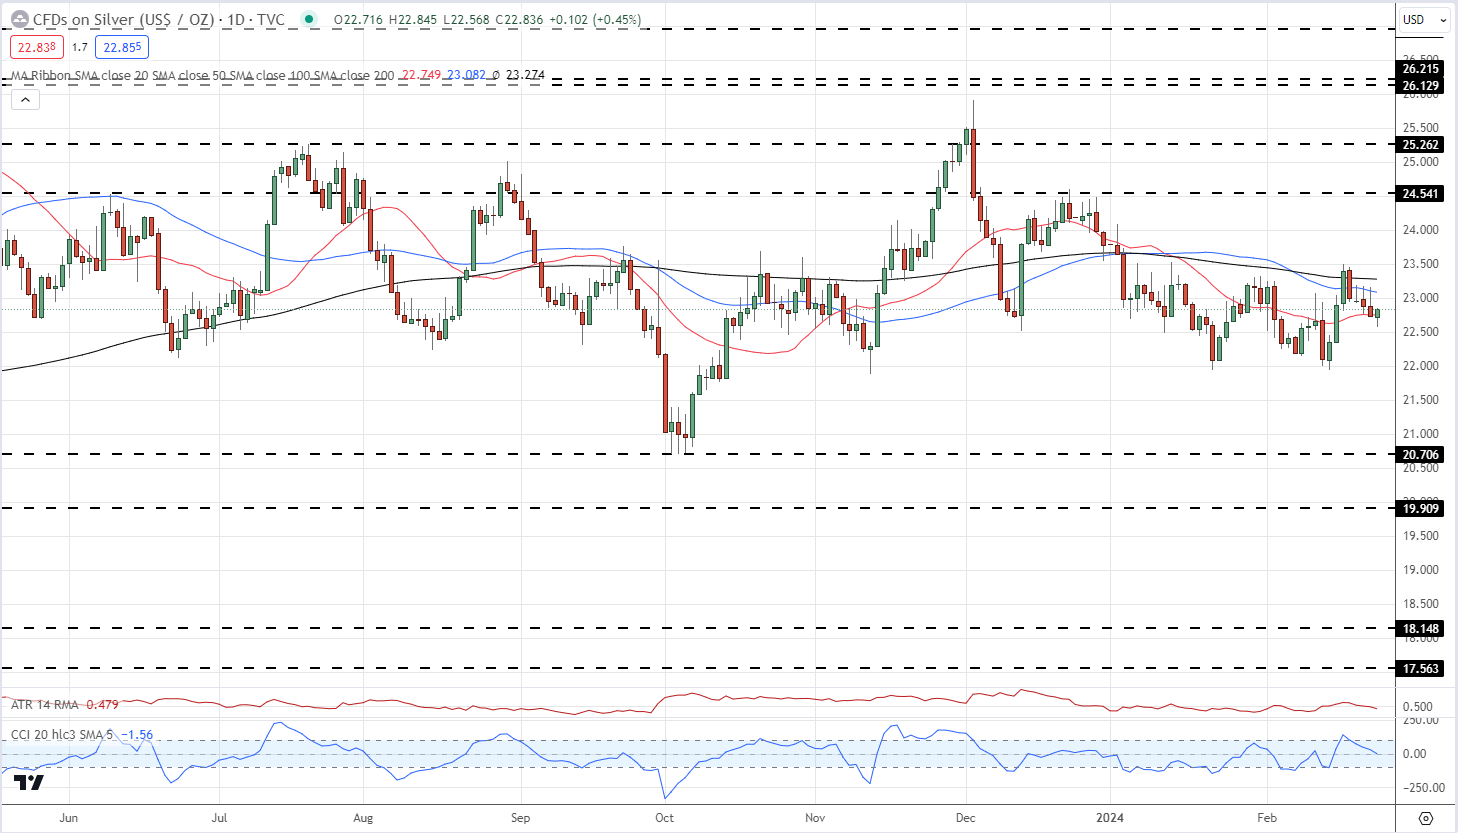
Retail trader data shows 61.86% of traders are net-long with the ratio of traders long to short at 1.62 to 1.The number of traders net-long is 2.27% higher than yesterday and 16.48% lower than last week, while the number of traders net-short is 8.12% lower than yesterday and 13.21% higher than last week.

We typically take a contrarian view to crowd sentiment, and the fact traders are net-long suggests Gold prices may continue to fall.

Silver Daily Price Chart

image3.png


US Dollar Forecast: US PCE to Guide Markets; EUR/USD, GBP/USD, USD/JPY Setups

US Dollar Forecast: US PCE to Guide Markets; EUR/USD, GBP/USD, USD/JPY Setups

UPCOMING US DATA

Sticky price pressures, coupled with robust job growth and reaccelerating wages, may prompt the FOMC to delay the start of its easing cycle until the second half of the year and to deliver fewer cuts than anticipated. This scenario could shift interest rate expectations towards a more hawkish direction compared to their present outlook.

Higher interest rates for longer may keep U.S. Treasury yields tilted upwards in the near term, establishing a fertile ground for the U.S. dollar to build upon its 2024 recovery. With the greenback displaying a constructive bias, the euro, pound and, to a lesser extent, the Japanese yen may encounter challenges transitioning into March.

Eager to gain clarity on the euro’s future trajectory? Access our quarterly trading forecast for expert insights. Secure your free copy now!

EUR/USD TECHNICAL ANALYSIS

EUR/USD rebounded this past week, but failed to decisively recapture its 200-day simple moving average at 1.0825. It’s imperative to closely track this indicator in the coming days, as a push above it may trigger a rally towards 1.0890. On further strength, attention will turn to 1.0950.

Alternatively, if the pair gets rejected downwards from its current position and heads lower, technical support fist appears at 1.0725, followed by 1.0700. Beyond this threshold, additional weakness could prompt a retracement towards 1.0650.

EUR/USD TECHNICAL ANALYSIS CHART

Curious to uncover the connection between FX retail positioning and GBP/USD’s price action dynamics? Check out our sentiment guide for key findings. Download now!

GBP/USD TECHNICAL ANALYSIS

GBP/USD advanced during the week but failed to take out its 50-day simple moving average at 1.2680. Surpassing this technical obstacle could be a tough task for bulls, though a breakout might usher in a move towards trendline resistance at 1.2725. Above this barrier, all eyes will be on 1.2830.

In the scenario of sellers reasserting control and kickstarting a pullback, the first potential support area arises around the 1.2600 handle. Further losses past this juncture could pave the way for a decline towards trendline support and the 200-day simple moving average, located at 1.2570.

GBP/USD TECHNICAL CHART

Wondering about the yen’s prospects – will it continue to weaken or mount a bullish comeback? Discover all the details in our quarterly forecast. Don’t miss out – request your complimentary guide today!

USD/JPY FORECAST – TECHNICAL ANALYSIS

USD/JPY made further progress to the upside this week, coming within striking distance from breaching resistance at 150.85. Traders need to monitor this technical barrier carefully, as a successful breakout could energize buying momentum, potentially fueling a rally towards last year’s highs near 152.00.

On the flip side, if sellers unexpectedly reclaim dominance and spark a bearish reversal, the first technical floor to watch lies at 149.70 and 148.90 subsequently. Sustained losses beyond these key support levels could trigger a retreat towards the 100-day simple moving average in the vicinity of 147.50.


Markets Week Ahead: USD, Euro and Gold Eye Inflation Data, Sterling Supported

Markets Week Ahead: USD, Euro and Gold Eye Inflation Data, Sterling Supported

Major Risk Events in the Week Ahead

First up, Japanese inflation data could impact the yen even further should price pressures follow the recent trend lower – raising doubts around one of the Bank of Japan’s two conditions for policy normalisation. Potentially bullish for EUR/JPY but this is fraught with complexity as the Japanese finance ministry could deploy the use of FX intervention at any time.

The Reserve Bank of New Zealand (RBNZ) is scheduled to provide an update on monetary policy where there is a 30% chance we could see another rate hike on Wednesday. Inflation has not come down as quickly as hoped and market estimations only envision a potential first rate cut in November.

Learn how to prepare and strategise ahead of major news and data releases with our comprehensive guide on the topic , below:

German unemployment and inflation data for Feb comes into view after the Bundesbank intimated that Germany may have already entered a recession.

US data is likely to be seen as the major focus of the week. A second look at US Q4 GDP has the potential to provide intra-day volatility but a major reaction is unlikely in the absence of a massive deviation from the first estimate. Then on Friday, US PCE data provides another crucial piece of the inflation puzzle and could influence rate cut bets and, by extension, the US dollar.

Chinese manufacturing PMI data is also due on Friday but it would appear that recent support measures are providing support for out of favour Chinese markets.

Stay up to date with the latest market news and analysis as well as developing themes driving markets at the moment:

How to Pick Stocks

How to Pick Stocks

Stocks are a key ingredient in the portfolio of millions of investors and traders. They can provide a long-term path towards passive income potentially hitting double-digit returns. But the stock market can also be confusing, and potentially costly or dangerous, with the process of picking the right stocks, at the right time, not always so clear. Read on and discover our guide on how to pick stocks for investors to move towards meeting their goals.

How to pick stocks

How to pick stocks: Step by Step

There are a variety of crucial factors to consider when approaching the question ‘How to pick stocks’. These considerations can determine the success of a stock portfolio and range from the financial health of the companies chosen, to liquidity and volatility of the stock in question, to wider fundamental events outside the company’s control. Investors should consider all of these influences to have the best chance of building a stock portfolio capable of meeting their goals. Here’s a step-by-step list below.

1. Establish a plan

Establishing a plan is key starting point when picking stocks. You’ll need to consider questions such as how many stocks to buy, what your likely plans are for the money down the line, and whether you’d prefer to trade stocks over the short term rather than invest for a longer-term approach. For example, long-term investors looking to buy and hold stocks for five years or more will obviously have a very different strategy to those looking for short positions in overbought market conditions like we saw frequently in the latter part of the 2010s.

If you’re in it for the short term, find out more on how to create a trading plan for technical analysis.

2. Assess your risk tolerance

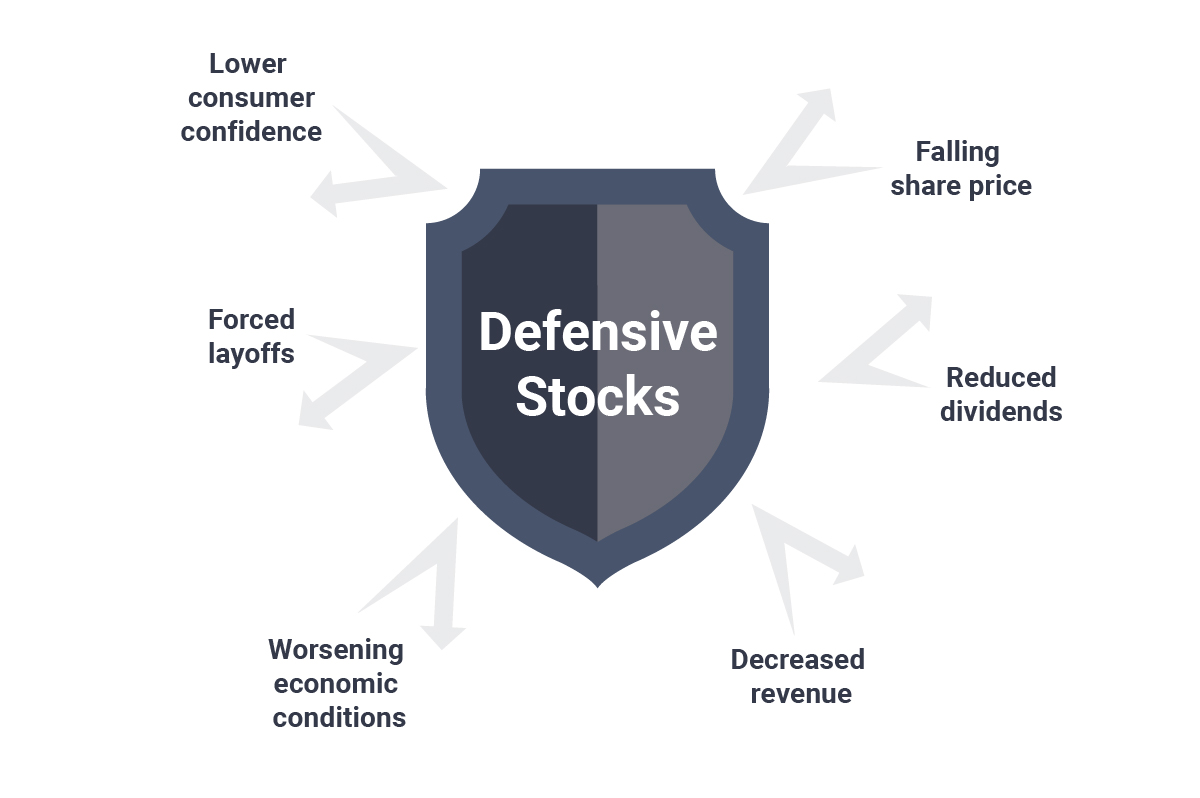
Your tolerance for risk will play a key role in determining the kind of stocks to pick. To this point, if an investor is looking for a more risk-averse portfolio, they may want to weigh more towards defensive stocks such as those in utilities or consumer staples. Alternatively, a higher-risk approach could see an investor choosing companies in emerging economies or immature sectors, or companies that depend on key market events going a certain way for their targets to be realized. For example, a pharma company awaiting FDA approval for a new drug will be subject to the risk of that approval not happening – an event potentially devastating to its share price.

Find out more on navigating risk management with our helpful guide.

3. Do your research

Attractive stocks can be found in a variety of circumstances, but an investor may get a head start on the crowd if they know a couple of sectors and the companies within them inside-and-out.

Here are some of the key things to consider about the companies behind the stocks being analyzed, as well as the market conditions in which they might be most attractive.

Financial condition

Understand the state of the company’s balance sheet. What are its assets, liabilities, and cash flow situations? Research revenue in recent periods.

Management

Who’s steering the ship and what’s their industry track record? Do they enjoy shareholder confidence?

Innovation

How does the company innovate to stay ahead of and respond to its competition? How have new products and services been received by customers and shareholders?

Dividends

Is the company paying a dividend, and if so, how often and will it be increased? Find out more about how to invest in dividend stocks.

Price and valuation

Is the company undervalued? To find out, calculate the price-to-earnings ratio, or P/E, by dividing the company’s stock price by its earnings per share. A P/E of around 15 may be considered ‘cheap’ – but that doesn’t necessarily mean that it’s worth buying or inexpensive by industry standards. Being cheap may just mean investors lack confidence in its growth prospects. Find out more about how to value a stock.

Liquidity

Does the stock have sufficient trading volume to allow traders to enter and exit the market as straightforwardly as possible? Read more on stock market liquidity for a detailed picture.

Volatility

How volatile has the price movement been for this stock, and what are the reasons for any extreme fluctuations? With volatility naturally comes increased risk, but also potential opportunity. Read more on stock market volatility to discover how to take advantage.

Explore our in-depth guide on researching stocks for more information.

4. Use technicals and other tools where appropriate

If you are trading stocks in the short term, for example as a day trader, swing trader or scalper, you may want to investigate technical analysis tools to try and gauge price action in order to help time entries and exits. These tools include the moving average, MACD and RSI, as well as volume and support and resistance levels.

Naturally, these tools rely on historical price activity to inform choices, so while they can be useful for projecting trends, it is advisable to combine a technical approach with understanding of the fundamental factors that can override patterns and, of course, risk management.

Read more on technical indicators and how they can assist your analysis.

5. Pick the stock and trade it actively…or just wait

When it comes to the procedural process of picking the stock for a long-term investment or short-term trading endeavor, the clearest method is often via a trading platform/online brokerage account, which can be set up with proof of ID and a choice of funding method. After that, while short-term speculators may be actively trading the stock, long-term passive investors will usually be waiting it out. For the latter, while there’ll be ups and downs along the way, the mission is to capitalize on growth over a period of many years.

The Best Performing Stocks – Jan 00 to Jan 20

Stock Growth in Stock Price Jan 00-Jan 20
Monster Beverage Corporation 73,300%
Netflix 34,400%
Apple 20,000%
Tractor Supply Company 17,000%
Amazon 11,400%

Most popular stocks

As mentioned above, the most popular stocks to trade by volume consistently show up as the likes of giant corporations Facebook, Amazon, Apple, Netflix and Alphabet, but different fundamental events can cause the stocks of various other companies to come out on top in shorter-term trading volume. The chart below shows the stocks with the highest global volume for the month at the end of March 2020.

Chart to show most popular stocks by average trading volume in March 2020

The leading stock by volume, Greece-based tanker vessel operator Top Ships Inc, grew in popularity as an asset sale saw an influx of funding which allowed the company to greatly reduce its debt. The stock was likely even buoyed by circumstances surrounding the coronavirus pandemic, with surging product demand in areas such as cleaning supplies and paper products leading to increased shipping requirements.

Another company seeing unusually high volume in March was cruise line operator Carnival Corp, much of which was to the short side as the company suspended dividend payments and stock repurchases as voyage suspensions continued amid the coronavirus outbreak.

Rounding out the top three is Ford, which saw a seven-year high in trading volume, again mostly to the short side, as coronavirus decimated production and market demand.

What lesson can stock pickers learn from these examples? When a huge fundamental crisis hits, stocks are affected in different ways. Research on different sectors may shine a light on the industries that could pick up steam when others are going in the other direction. So read up, keep your eyes open, and focus on the goals of the portfolio.

Euro (EUR) Price Latest – EUR/USD Testing 200-SDMA Resistance, EUR/GBP Slipping Into Support

Euro (EUR) Price Latest – EUR/USD Testing 200-SDMA Resistance, EUR/GBP Slipping Into Support

German GDP fell by 0.3% in Q4 2023 compared to the third-quarter, and by 0.4% on the same quarter a year ago, data released by the Federal Statistics Office (Destatis) today confirmed.

“The German economy ended 2023 in negative territory. In the final quarter, declining investment had a dampening effect on economic activity, while consumption increased slightly,” saidRuth Brand, President of the Federal Statistical Office.

In the first three quarters, GDP largely stagnated amidst a still challenging global economic environment. For the whole year of 2023, the most recent calculations have confirmed the year-on-year decline in economic performance of 0.3% (calendar adjusted: -0.1%).

German Q4 GDP Release – Destatis

image1.png

The latest German Ifo readings were also released today with the headline business climate number in line with market expectations at 85.5, and a fraction higher than January’s reading.

image2.png

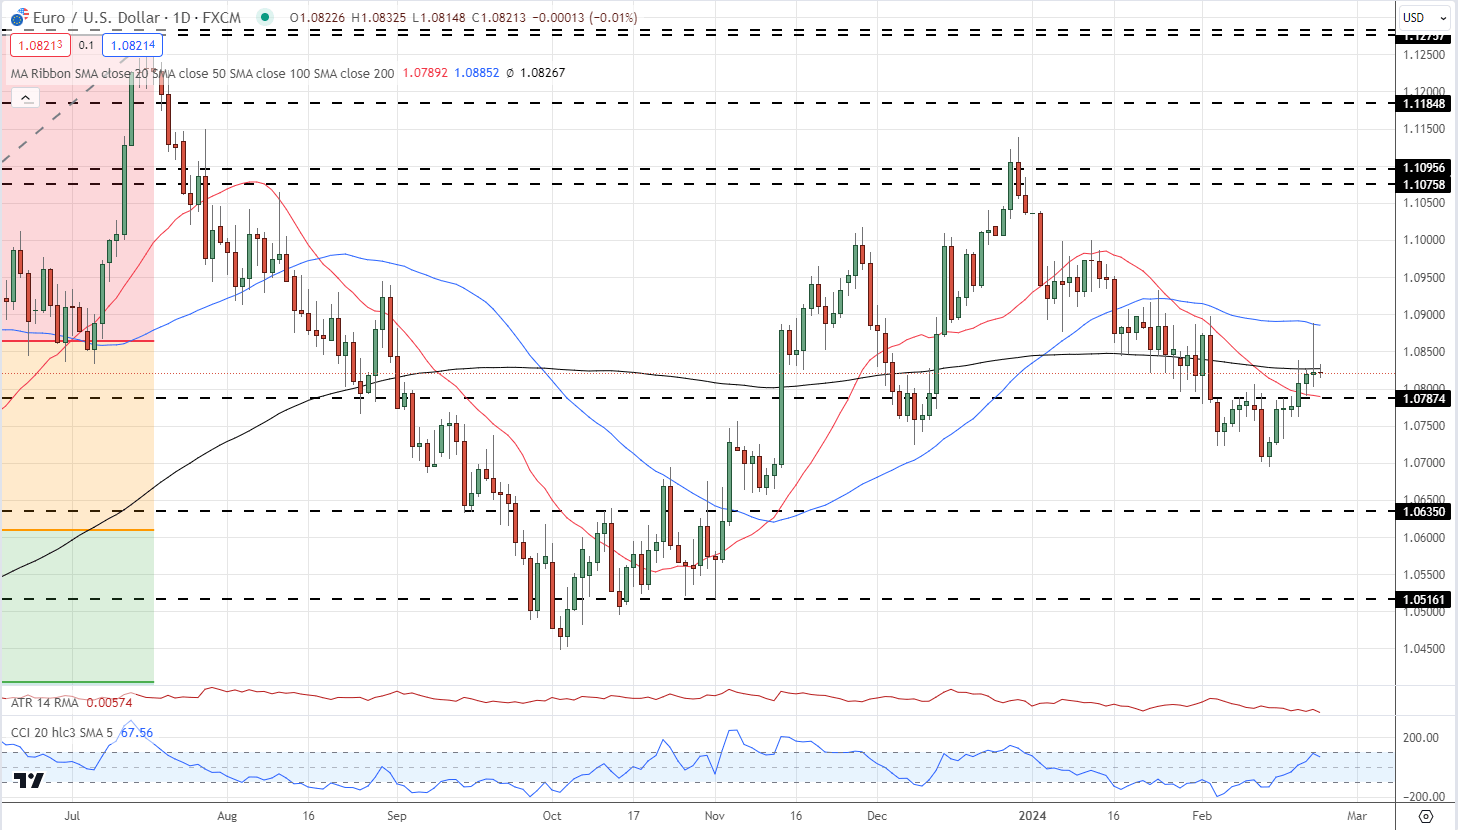
The Euro’s recent move higher against the US dollar has stalled today with further progress being kept in check by the 200-day simple moving average. While this technical indicator was broken yesterday, the pair closed below the longer-dated moving average. A confirmed break higher – a close and open above the 200-dsma – would see the 50-dsma and a cluster of recent highs on either side of 1.0900 come into focus. Support is seen at 1.0787 down to 1.0760.

EUR/USD Daily Chart

image3.png

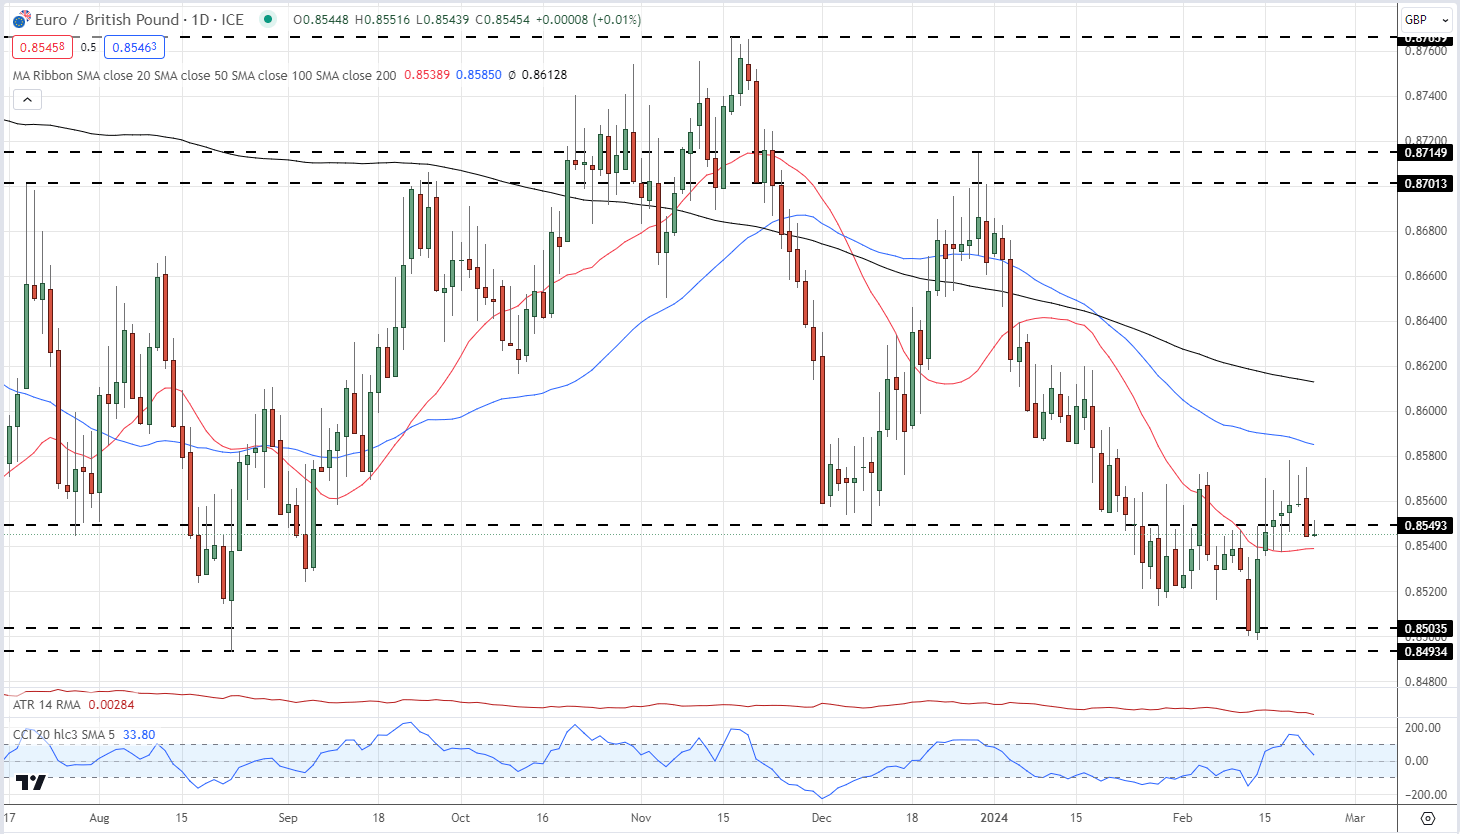
The recent EUR/GBP pullback from the 0.8500 area has stalled with the 0.8580 zone proving difficult to breach. A break below the 0.8530 area could see the pair retest prior support around 0.8500again in the coming weeks.

EUR/GBP Daily Chart

image4.png

IG retail trader data show 72.75% of traders are net-long with the ratio of traders long to short at 2.67 to 1.The number of traders net-long is 8.32% higher than yesterday and 6.59% higher than last week, while the number of traders net-short is 18.03% lower than yesterday and 11.50% lower than last week.

German PMI Data Slumps after Decent Run, Broader EU PMI Data Mixed

German PMI Data Slumps after Decent Run, Broader EU PMI Data Mixed

German PMI Contracts Sharply in February

German PMI data was always going to be under the microscope this week amid weak fundamentals and comments from the Bundesbank that Germany is likely already in a recession and the data supported that view.

Flash German manufacturing PMI data for February sank to 42.3 from 45.5 but the surprise came via the fall from the lofty 46.1 expectation. The manufacturing sector has attempted a recovery since the sub-40 low in July of 2023 but the latest data for February stops that in its tracks.

Customize and filter live economic data via our DailyFX economic calendar

In addition, forward-looking metrics like ‘new business’ and ‘new orders’ deteriorated further, with new export business also on the decline. Surveyed firms highlighted a general reluctance among customers to transact provided continued economic uncertainty and difficult financial conditions.

One bit of positive news is that the services sector saw a modest gain during the same time period and there is little evidence of cost pressures emanating from the Red Sea attacks that have forced shipping companies to reroute vessels away from the major corridor.

EU PMI Data Mixed

EU PMI data appears much better than Germany’s, with the composite reading edging forecasts despite a dip in the manufacturing print. Services witnessed a welcomed lift to hit the 50 mark – a level that typically separates contraction form expansion.

French data appeared to recover and fared much better than its German counterpart, posting improvements on all three measures with a notable rise in manufacturing from 43.1 to 46.8.

The euro’s reaction was mixed but mainly had a positive impact, seeing a move higher in EUR/USD and EUR/JPY but the Euro turned sharply lower against the pound ahead of UK PMI data at 09:30 GMT. Look out for the ECB minutes relating to the January meeting.

US Dollar Trims Losses After Fed Minutes Caution Against Premature Rate Cuts

US Dollar Trims Losses After Fed Minutes Caution Against Premature Rate Cuts

The U.S. dollar (DXY index) sustained small losses in late afternoon trading in New York on Wednesday despite the advance in U.S. Treasury yields following the release of the minutes of the Jan. 30-31 FOMC conclave.

According to the summarized record of the proceedings, policymakers felt it would be inappropriate to begin lowering interest rates until they had a stronger conviction that consumer prices would move sustainable toward the 2.0% target.

The fact that the central bank needs to see more evidence of disinflation before removing policy restriction suggests that the easing cycle is unlikely to begin soon and could even be delayed to the second half of the year.

If the Federal Reserve decides to postpone its interest adjustments, we could see U.S. bond yields nudge upwards in the near term, boosting the U.S. dollar in the process. This could result in the DXY index hitting fresh yearly highs moving into March.

With the greenback biased to the upside for the time being, currency pairs such as EUR/USD and GBP/USD may struggle to gain upward traction in the coming days and weeks. Meanwhile, pairs like USD/JPY and USD/CAD may find less resistance in their ascent.

Feeling discouraged by trading losses? Take control and improve your strategy with our guide, “Traits of Successful Traders.” Access invaluable insights to help you avoid common trading pitfalls and costly errors.