US CPI Preview: Inflation data crucial to confirm Fed rate cut prospects

US CPI Preview: Inflation data crucial to confirm Fed rate cut prospects

The Bureau of Labor Statistics (BLS) will publish the highly anticipated Consumer Price Index (CPI) inflation data from the United States (US) for July on Wednesday at 12:30 GMT.

The US Dollar (USD) braces for intense volatility, as any surprises from the US inflation report could significantly impact the market’s pricing of the Federal Reserve (Fed) interest rate cut expectations in September.

What to expect in the next CPI data report?

Inflation in the US, as measured by the CPI, is expected to increase at an annual rate of 2.9% in July, down slightly from the 3% rise reported in June. The core CPI inflation, which excludes volatile food and energy prices, is seen ticking down to 3.2% from 3.3% in the same period.

Meanwhile, the US CPI is set to rise 0.2% MoM in July after declining by 0.1% in June. Finally, the monthly core CPI inflation is forecast to print 0.2%.

The disappointing jobs report from the US, which showed that Nonfarm Payrolls rose 114,000 in July, revived expectations for the Federal Reserve to cut the policy rate multiple times this year starting in September. Following the July 30-31 policy meeting, Fed Chairman Jerome Powell refrained from confirming a rate cut in September but noted that there was a “real discussion” about lowering the policy rate at that meeting. Additionally, Powell acknowledged that they are attentive to risks on both sides of the dual mandate.

According to the CME FedWatch Tool, markets are currently pricing in a nearly 50% probability of a 50 basis points (bps) rate cut in September.

Previewing the July inflation data, “while gaining some momentum, we expect core CPI prices to remain largely under control in July after registering an unexpected contraction in June,” said TD Securities analysts in a weekly report and added:

“Headline inflation likely strengthened m/m as well as energy prices are expected to rebound post sharp declines in May/Jun. Our unrounded core CPI forecast at 0.14% m/m suggests larger risks toward a rounded 0.2% increase.”


AUD/USD: Bulls strive to test 0.6660 – UOB Group

AUD/USD: Bulls strive to test 0.6660 – UOB Group

Strong momentum is likely to lead to further Australian Dollar (AUD) strength; it remains to be seen if it can break above 0.6660, UOB Group FX analysts Quek Ser Leang and Lee Sue Ann note.

Closest resistance is at 0.6660

24-HOUR VIEW: “Yesterday, we expected AUD to trade in a sideways range of 0.6560/0.6600. Our expectation was incorrect. Instead of trading sideways, AUD soared, closing sharply higher by 0.74% (0.6634). While conditions are overbought, strong momentum is likely to lead to further AUD strength. However, it remains to be seen if it can break above 0.6660. Support is at 0.6615; a breach of 0.6600 would indicate that AUD is not strengthening further.”

1-3 WEEKS VIEW: “Two days ago (12 Aug, spot at 0.6570), we indicated that ‘there has been a slight increase in momentum, but not sufficiently enough to suggest the start of a sustained advance.’ We were of the view that that AUD ‘must break and remain above 0.6600 before further advance can be expected.’ We were also of the view that ‘the chance of AUD breaking clearly above 0.6600 will increase in the next few days provided that 0.6520 (‘strong support’ level) is not breached’ and that ‘if AUD breaks clearly above 0.6600, the next level to watch is 0.6660.’ Yesterday, AUD not only broke clearly above 0.6600, but it also soared further, reaching a high of 0.6638. Upward momentum has increased further, and as mentioned two days ago, the level to focus on is 0.6660. Looking ahead, the next resistance above 0.6660 is a significant level at 0.6700. On the downside, the ‘strong support’ level has moved higher to 0.6580 from 0.6520.”

Information on these pages contains forward-looking statements that involve risks and uncertainties. Markets and instruments profiled on this page are for informational purposes only and should not in any way come across as a recommendation to buy or sell in these assets. You should do your own thorough research before making any investment decisions. FXStreet does not in any way guarantee that this information is free from mistakes, errors, or material misstatements. It also does not guarantee that this information is of a timely nature. Investing in Open Markets involves a great deal of risk, including the loss of all or a portion of your investment, as well as emotional distress. All risks, losses and costs associated with investing, including total loss of principal, are your responsibility. The views and opinions expressed in this article are those of the authors and do not necessarily reflect the official policy or position of FXStreet nor its advertisers. The author will not be held responsible for information that is found at the end of links posted on this page.

If not otherwise explicitly mentioned in the body of the article, at the time of writing, the author has no position in any stock mentioned in this article and no business relationship with any company mentioned. The author has not received compensation for writing this article, other than from FXStreet.

FXStreet and the author do not provide personalized recommendations. The author makes no representations as to the accuracy, completeness, or suitability of this information. FXStreet and the author will not be liable for any errors, omissions or any losses, injuries or damages arising from this information and its display or use. Errors and omissions excepted.

The author and FXStreet are not registered investment advisors and nothing in this article is intended to be investment advice.


EUR/USD extends gains above 1.1000 after Eurozone data, US CPI awaited

EUR/USD extends gains above 1.1000 after Eurozone data, US CPI awaited

EUR/USD extends gains above 1.1000 in the European session on Wednesday. The pair shrugs off mixed Eurozone GDP, employment and industrial figures, as it draws support from broad US Dollar weakness ahead of the key US CPI inflation data.

The Relative Strength Index (RSI) indicator on the 4-hour chart climbed to 80 early Wednesday, reflecting overbought conditions. On the upside, 1.1060 (static level) could be seen as next resistance before 1.1100 (psychological level, static level).

In case EUR/USD stages a technical correction and flips 1.1000 back into resistance, supports align at 1.0960 (static level), 1.0940 (static level) and 1.0900 (psychological level, static level).

EUR/USD gathered bullish momentum after breaking out of its one-week-old range and reached its highest level since early January above 1.1000. The pair’s near-term technical outlook points to overbought conditions as market focus shifts to the US inflation data.

In the American session on Tuesday, the US Dollar (USD) came under renewed selling pressure and opened the door for a leg higher in EUR/USD. The improving risk mood, as reflected by rallying equity indexes in the US, and an extended decline in the US Treasury bond yields made it difficult for the USD to find demand.

In the second half of the day, the US Bureau of Labor Statistics will release the Consumer Price Index (CPI) data for July. On a yearly basis, the CPI is forecast to rise 2.9%, down from the 3% increase recorded in June, while the core CPI is seen rising 3.2% in the same period. On a monthly basis, the CPI and the core CPI are both expected to increase 0.2%.

In case the monthlyl core CPI, which excludes prices of volatile items and doesn’t get distorted by base effects, rises at a sronger pace than expected, the immediate reaction could trigger a USD recovery and weigh on EUR/USD. On the other hand, the pair could look to stretch higher if the monthly core CPI comes in below the market estimate.

UK Headline Inflation Rises by Less Than Expected, GBP/USD Now Eyes US CPI

UK Headline Inflation Rises by Less Than Expected, GBP/USD Now Eyes US CPI

UK headline inflation CPI) rose in July but at a slower rate than expected. CPI rose by 2.2% in the 12 months to July 2024, up from 2.0% in June 2024. On a monthly basis, CPI fell by 0.2% in July 2024, compared with a fall of 0.4% in July 2023. Core inflation fell from 3.5% to 3.3%, below expectations of 3.4%.

‘The largest upward contribution to the monthly change in both CPIH and CPI annual rates came from housing and household services where prices of gas and electricity fell by less than they did last year; the largest downward contribution came from restaurants and hotels, where prices of hotels fell this year having risen last year,’ according to the ONS. The closely followed CPI all services index rose by 5.2% in July compared to 5.7% in June and 7.4% in July 2023.

A white background with black lines  Description automatically generated

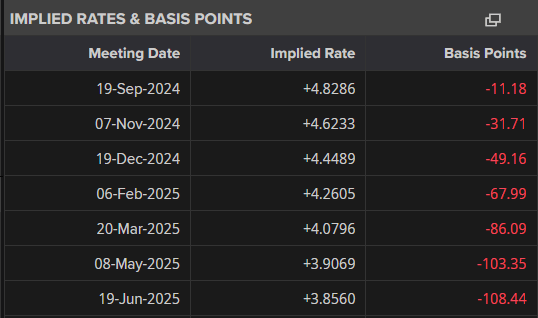
UK rate expectations currently show a 45% chance of a second 25 basis point interest rate cut at the September 19th BoE meeting with the central bank seen cutting a total of 50 basis points between now and the end of the year.

A black and white chart with numbers and a few white text  Description automatically generated with medium confidence

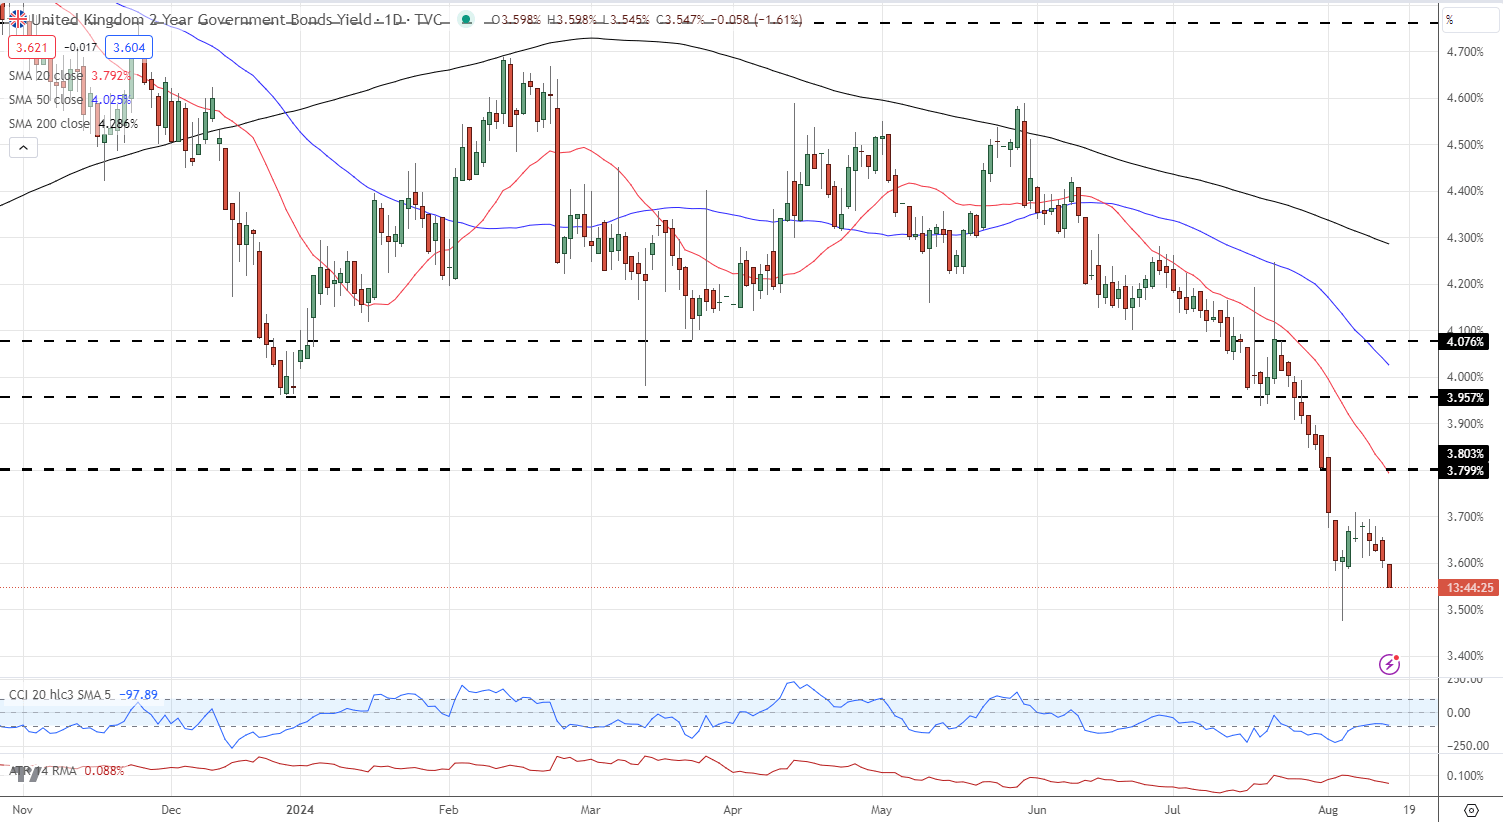
The yield on the rate-sensitive UK 2-year gilt fell after the ONS data and is now closing in on the August 5th low at 3.475%. Below here the 2-year gilt yield would be back at levels last seen in April last year.

UK 2-Year Gilt Yield

A graph of stock market  Description automatically generated

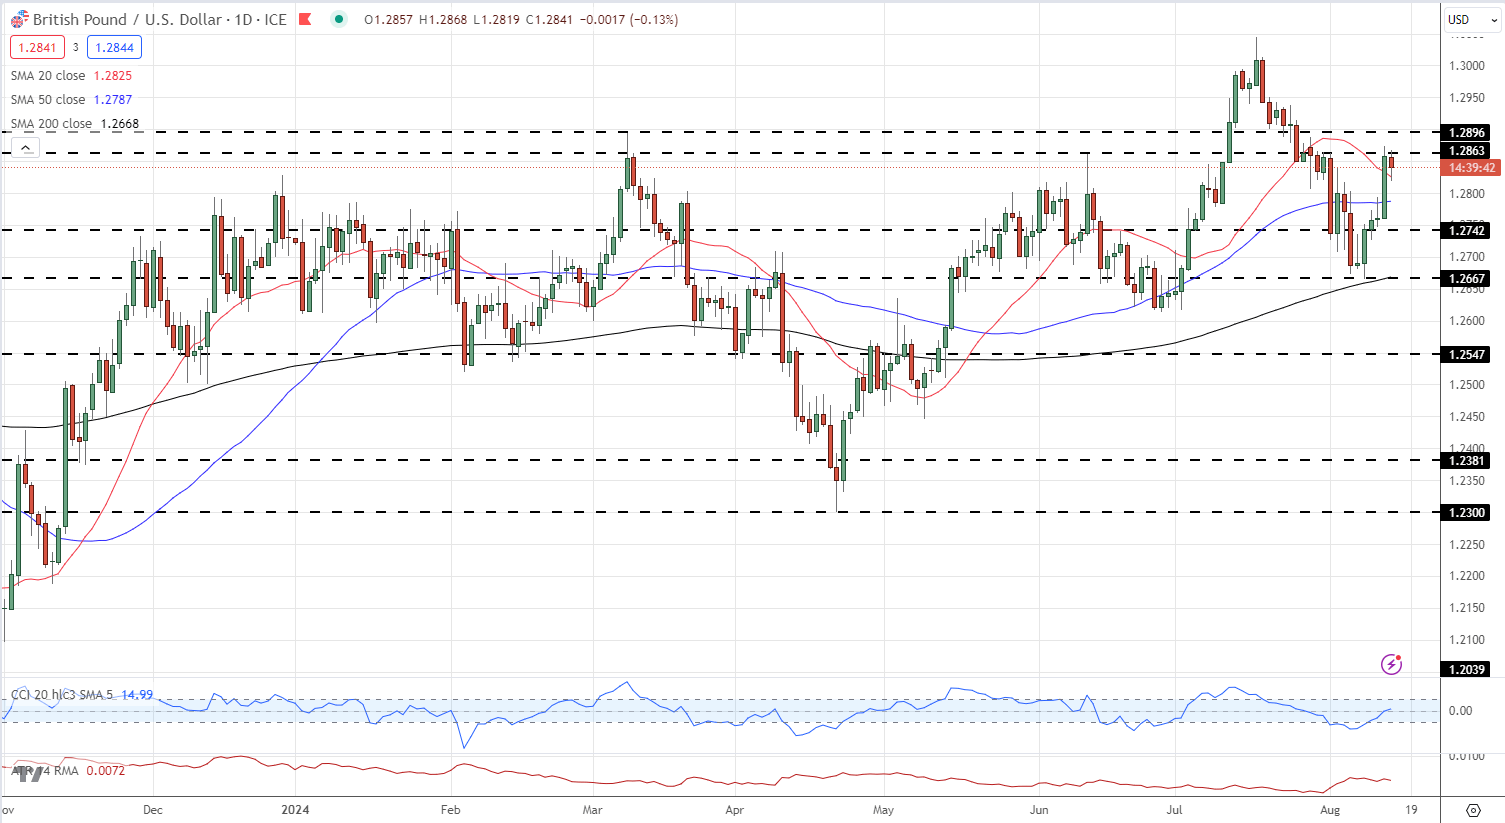
Cable (GBP/USD) is trading comfortably back above 1.2800 today, aided partly by yesterday’s bout of weakness in the US dollar. GBP/USD tested and rejected the 1.2863 to 1.2896 zone yesterday and today with the market waiting for the US inflation data at 13:30 UK today before deciding on the next move for the pair. Short-term support at 1.2800 followed by 1.2787 (50-dsma) with further upside limited at 1.2896.

GBP/USD Daily Price Chart

A graph of stock market  Description automatically generated

Retail trader data shows 42.40% of traders are net-long with the ratio of traders short to long at 1.36 to 1.The number of traders net-long is 15.32% lower than yesterday and 19.26% lower from last week, while the number of traders net-short is 19.79% higher than yesterday and 36.48% higher from last week.

We typically take a contrarian view to crowd sentiment, and the fact traders are net-short suggests GBP/USD prices may continue to rise. Traders are further net-short than yesterday and last week, and the combination of current sentiment and recent changes gives us a stronger GBP/USD-bullish contrarian trading bias.

Euro (EUR/USD) Latest – German Economic Outlook Slumps in August

Euro (EUR/USD) Latest – German Economic Outlook Slumps in August

The economic outlook for Germany is breaking down, according to the latest ZEW survey, showing ‘the strongest decline of the economic expectations over the past two years.’ According to today’s report,

‘It is likely that economic expectations are still affected by high uncertainty, which is driven by ambiguous monetary policy, disappointing business data from the US economy and growing concerns over an escalation of the conflict in the Middle East. Most recently, this uncertainty expressed itself in turmoil on international stock markets,’ comments ZEW President Professor Achim Wambach, PhD on the survey results.

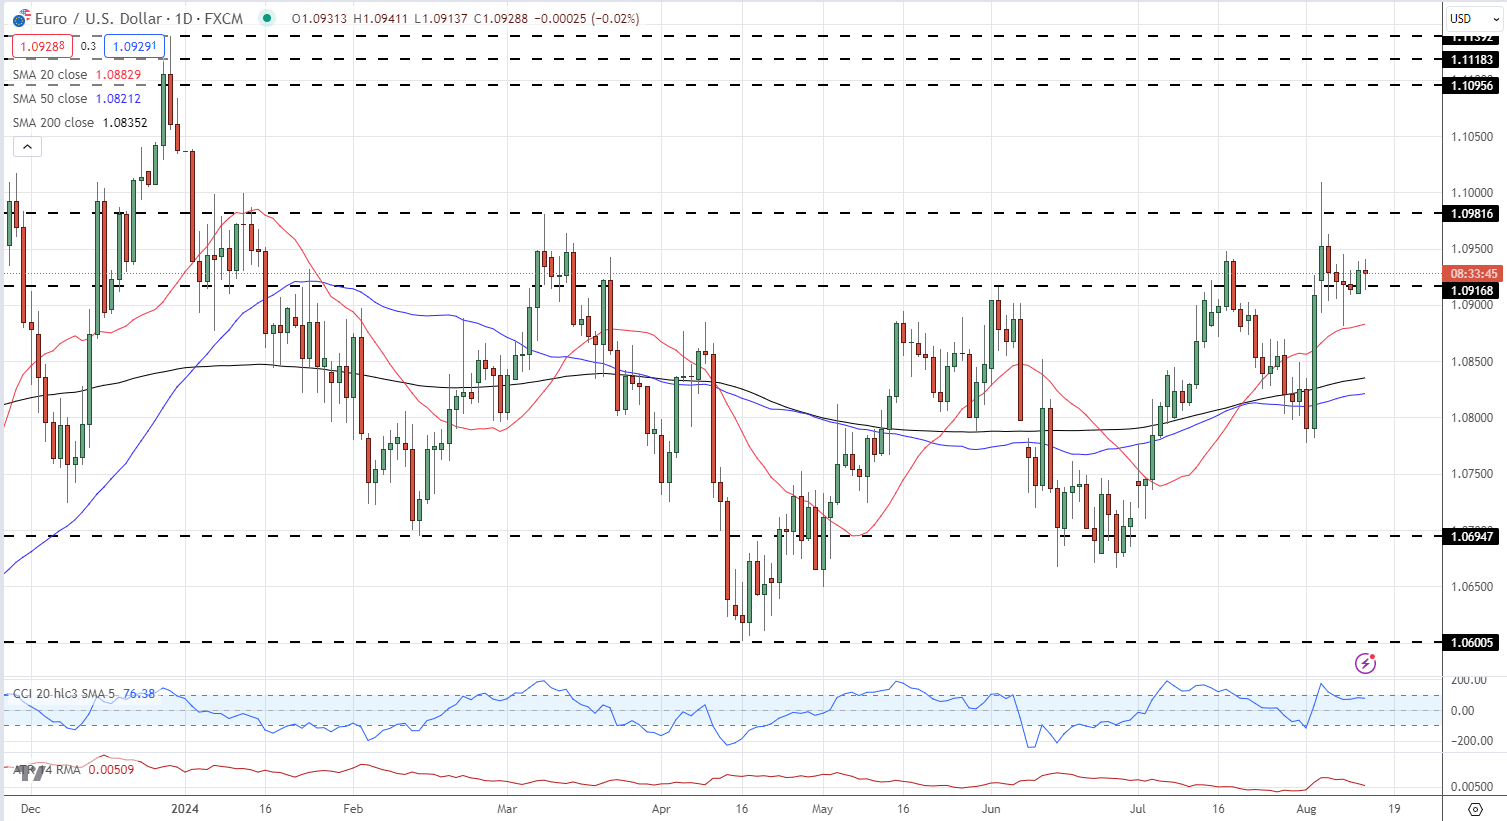
EUR/USD moved marginally lower against the US dollar but remains in a tight, short-term range. Initial support is seen off last Thursday’s low at 1.0881 and the 50-day sma at 1.0883, while initial resistance at 1.0950.

EUR/USD Daily Price Chart

A graph with lines and points  Description automatically generated with medium confidence

Retail trader data shows 37.51% of EUR/USD traders are net-long with the ratio of traders short to long at 1.67 to 1.The number of traders net-long is 2.42% higher than yesterday and 14.11% higher from last week, while the number of traders net-short is 0.42% lower than yesterday and 2.32% higher from last week.

We typically take a contrarian view to crowd sentiment, and the fact traders are net-short suggests EUR/USD prices may continue to rise. Yet traders are less net-short than yesterday and compared with last week. Recent changes in sentiment warn that the current EUR/USD price trend may soon reverse lower despite the fact traders remain net-short.

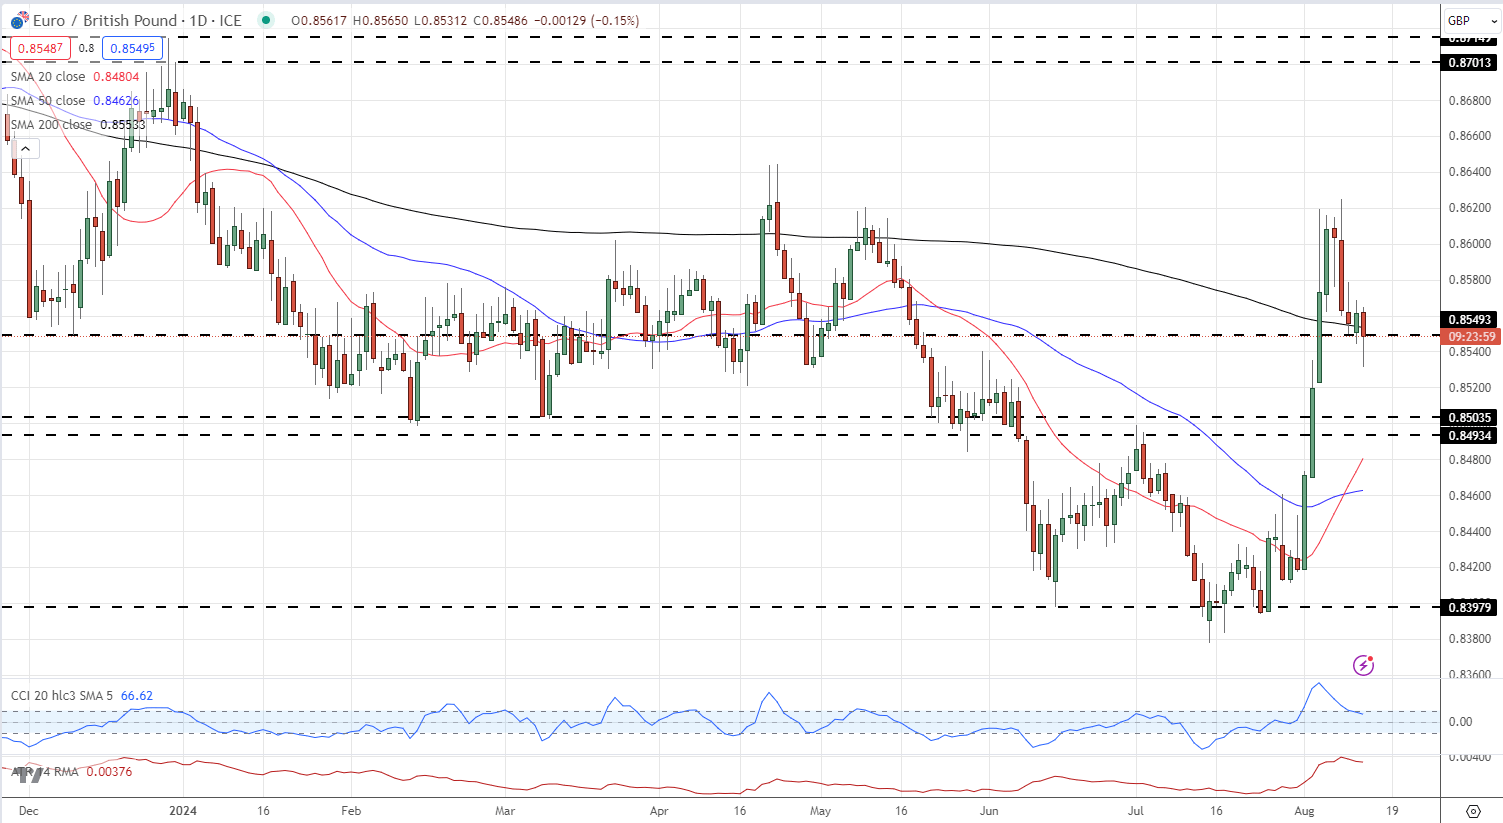
EUR/GBP fell to a fresh one-week low on a combination of Euro weakness and Sterling strength. Earlier today data showed UK unemployment falling unexpectedly – from 4.4% to 4.2% – dialing back UK rate cut expectations.

UK Unemployment Rate Falls Unexpectedly, Major Concerns Reappear

After making a four-month last week, EUR/GBP has faded lower and is now trading on either side of an old area of importance at 0.8550. Below here 0.8500 comes into focus. Short-term resistance is seen at 0.8580 and 0.8600.

EUR/GBP Daily Chart

A graph with different colored lines  Description automatically generated


Employment: The Key Driver of Economic Growth and Prosperity

Employment: The Key Driver of Economic Growth and Prosperity

Economic Impact of Unemployment

For the US, the Federal Reserve Bank (“The Fed”) relies on employment data when assessing potential adjustments to monetary policy. For example, if US unemployment rate is high, the Central Bank will look to boost the economy with expansionary monetary policy, which often entails reducing interest rates, which can make investing in growth that much more attractive given that rates (opportunity cost) are lower.

The knock on effect of expansionary monetary policy on economic output is demonstrated in the diagram below:

Economic cycle with expansionary monetary policy

Employment to Inflation

Employment to Inflation

On the other end of the spectrum, strong employment and low rates of unemployment do not necessarily spell for tighter monetary policy or higher rates. There is another factor of concern in that equation, and that’s when inflation begins to enter into the mix.

As the unemployment rate drops, businesses will have a more difficult time finding employees. This should lead to competition for those workers, and this will often show in the form of higher wages, which is considered as inflation.

Inflation is usually the bigger motivator for Central Bankers to hike rates and tighten policy, as this gives them reason for looking to protect the financial system from capital erosion via negative real rates and/or runaway inflation.

In the US, this is often followed through the Non-farm Payrolls report in terms of ‘Average Hourly Earnings (AHE).’

Employment Reports: Non-Farm Payrolls

The Non-Farm Payroll (NFP) report (released by the Bureau of Labor Statistics on the first Friday of every month at 08:30 EST) is one of America’s most influential economic announcements as it is seen as a direct representation of US economic growth. NFP is widely followed due to its early release, highlighting data for the most recently completed month and it’s often one of the first barometers that market participants have for that period. However, the unincorporated self-employed, unpaid volunteers or employees of family, farm workers and domestic workers are all excluded from NFP; and given the early nature of the report, it’s often subject to revisions in later months.

The NFP report comprises data from the Current Employment Statistics (CES) program from the U.S which surveys approximately 141,000 businesses and government agencies. This represents approximately 486,000 individual work sites, with the objective of providing detailed industry data on employment, hours, and earnings of workers on nonfarm payrolls, which accounts for 80% of the US workforce. Workers from the manufacturing, construction and goods sectors are included in the NFP report. The release of NFP, the US unemployment rate and Average Hourly Earnings (AHE) at the beginning of the month makes this data even more significant since it sets the tone for markets under the watchful eye of the Federal Reserve.

EUR/USD stays in tight range with US inflation in focus

EUR/USD stays in tight range with US inflation in focus

EUR/USD edges slightly lower but holds the key support level of 1.0900 in Tuesday’s European session. The major currency pair trades broadly sideways as investors appear to be sidelined ahead of the United States (US) Producer Price Index (PPI) data, which will be published at 12:30 GMT.

The producer inflation data will indicate how much the prices of goods and services were changed by owners at factory gates. Generally, prices of final goods are influenced by input prices and consumer demand.

Economists expect that the monthly headline PPI barely rose last month. The core PPI, which excludes volatile food and energy prices, is expected to grow at a slower pace of 0.2% compared with the 0.4% increase seen in June. Annual headline and core PPI are estimated to have decelerated by three-tenths to 2.3% and 2.7%, respectively.

US PPI data is expected to have a limited impact on the US Dollar (USD) – unless the data diverge significantly from expectations – as the major trigger will be the Consumer Price Index (CPI) data for July, which will be published on Wednesday. The inflation data will significantly influence market speculation about the size and timing of interest rate cuts by the Federal Reserve (Fed) for the entire year.

Daily digest market movers: EUR/USD moves sideways ahead of US PPI data

  • EUR/USD exhibits a subdued performance as the US Dollar edges higher as investors focus on the US CPI inflation data for July. The US Dollar Index (DXY), which tracks the Greenback’s value against six major currencies, remains steady above 103.00.
  • Annual headline and core inflation is expected to have decelerated by one-tenth to 2.9% and 3.2%, respectively, with monthly figures growing by 0.2%. The inflation data will indicate whether the Fed will adopt a cautious policy-easing approach or will choose to reduce interest rates more aggressively.
  • According to the CME FedWatch tool, 30-day Federal Funds Futures pricing data shows that traders see a 47.5% chance that interest rates will be reduced by 50 basis points (bps) in September. The likelihood of a 50 bp rate reduction has weakened significantly from the 68% recorded a week ago.
  • Meanwhile, the Euro (EUR) is being guided by market speculation for European Central Bank (ECB) rate cuts amid an absence of top-tier Eurozone economic data. Still, the German and Eurozone ZEW survey data for August will be watched by investors, which will be published at 09:00 GMT.
  • Economists are mixed about the ECB’s monetary policy outlook, namely whether the central bank will cut interest rates aggressively or use a calibrated approach.
  • The Eurozone economy grew faster than expected in the second quarter, but its largest country, Germany, is facing a vulnerable demand from domestic and overseas markets. The German GDP contracted by 0.1% in the second quarter of this year.
  • Last week, Finnish ECB policymaker Olli Rehn said that “rate cuts would help the eurozone economy recover, in particular the fragile industrial growth and subdued investments,” Reuters reported.

Technical Analysis: EUR/USD holds key 200-day EMA

EUR/USD trades close to near the upper boundary of the Channel formation on the daily time frame. A breakout of the aforementioned chart pattern would result in wider ticks on the upside and heavy volume. The 200-day Exponential Moving Average (EMA) near 1.0800 has acted as major support for the Euro bulls.

The 14-day Relative Strength Index (RSI) returns inside the 40.00-60.00 range, remaining close to its upper boundary. If the RSI sustains above 60.00, a bullish momentum will trigger.

More upside would appear if the major currency pair breaks above the August 5 high of 1.1009. This would drive the asset towards August 10, 2023, high at 1.1065, followed by the round-level resistance of 1.1100.

In an alternate scenario, a downside move below August 1 low at 1.0777 would drag the asset toward February low near 1.0700. A breakdown below the latter would expose the asset to June 14 low at 1.0667.

Forex Today: Gold closes in on record-high, eyes on US producer inflation data

Forex Today: Gold closes in on record-high, eyes on US producer inflation data

While major currency pairs spent the first day of the week fluctuating in tight ranges, Gold gathered bullish momentum and climbed above $2,470. The trading action turns subdued early Tuesday as investors await the July Producer Price Index (PPI) data from the US. During the European session, Germany’s ZEW Institute will release August Economic Sentiment data for Germany and the Euro area.

US Dollar PRICE Last 7 days

The table below shows the percentage change of US Dollar (USD) against listed major currencies last 7 days. US Dollar was the strongest against the Japanese Yen.

USD EUR GBP JPY CAD AUD NZD CHF
USD 0.21% -0.19% 2.56% -0.68% -1.55% -1.56% 1.81%
EUR -0.21% -0.38% 2.34% -0.90% -1.78% -1.84% 1.61%
GBP 0.19% 0.38% 2.74% -0.50% -1.39% -1.45% 1.94%
JPY -2.56% -2.34% -2.74% -3.18% -4.00% -4.08% -0.61%
CAD 0.68% 0.90% 0.50% 3.18% -0.88% -0.94% 2.46%
AUD 1.55% 1.78% 1.39% 4.00% 0.88% -0.05% 3.39%
NZD 1.56% 1.84% 1.45% 4.08% 0.94% 0.05% 3.49%
CHF -1.81% -1.61% -1.94% 0.61% -2.46% -3.39% -3.49%

The heat map shows percentage changes of major currencies against each other. The base currency is picked from the left column, while the quote currency is picked from the top row. For example, if you pick the US Dollar from the left column and move along the horizontal line to the Japanese Yen, the percentage change displayed in the box will represent USD (base)/JPY (quote).

The US Dollar Index (DXY) closed virtually unchanged on Monday as investors refrained from taking large positions. Wall Street’s main indexes ended the day near the previous week’s closing levels and the 10-year US Treasury bond yield extended its downward correction, losing nearly 1% on the day. In the European morning on Tuesday, the DXY holds steady slightly above 103.00 and US stock index futures trade marginally higher. According to The Times of Israel, Israel Defense Forces expect an attack by Iran by Thursday.

The UK’s Office for National Statistics (ONS) reported on Tuesday that the ILO Unemployment Rate declined to 4.2% in the three months to June from 4.4%. This reading came in below the market expectation of 4.5%. Other details of the UK jobs report showed that the wage inflation, as measured by the change in the Average Earnings Excluding Bonus, edged lower to 5.4% from 5.7% in the same period, surpassing analysts’ estimate of 4.6% by a wide margin. GBP/USD gained traction after these data and was last seen trading in positive territory slightly above 1.2800. The ONS will release July inflation data in the early European session on Wednesday.

EUR/USD registered modest gains on Monday and snapped a four-day losing streak. The pair stays relatively quiet below 1.0950 in the European morning on Tuesday.

Crude oil prices rose sharply on Monday, boosted by the ongoing conflict in the Middle East and reports suggesting that Saudi Aramco is looking to lower its oil output from September. The barrel of West Texas Intermediate (WTI) rose over 3% on Monday and reached its highest level since mid-July above $80. Early Tuesday, WTI trades in a tight range at around $79.50.

Gold benefited from retreating US Treasury bond yields and gained more than 1.5% on Monday. After rising toward $2,480 during the Asian trading hours on Tuesday, XAU/USD staged a technical correction and was last seen trading near $2,460.

USD/JPY posted marginal gains on Monday and continued to stretch higher toward 148.00 in the Asian session on Tuesday.

Japanese Yen struggles as US Dollar remains steady ahead of PPI

Japanese Yen struggles as US Dollar remains steady ahead of PPI

The Japanese Yen (JPY) extends its losses against the US Dollar (USD) on Tuesday. The safe-haven flows might limit the downside for the Yen, which could be attributed to rising geopolitical tensions in the Middle East.

Japan’s parliament is scheduled to hold a special session on August 23 to discuss the Bank of Japan’s (BoJ) decision to raise interest rates last month. The session, organized by the lower house financial affairs committee, is expected to invite BoJ Governor Kazuo Ueda to attend, according to government sources cited by Reuters.

The USD/JPY pair receives support as the pressure on the US Dollar eases due to decreased expectations for a 50 basis point interest rate cut by the US Federal Reserve (Fed) in September. According to CME’s FedWatch Tool, the probability of 50 basis points (bps) cut in September has dropped to 50%, down from 85% last week. However, the rate markets continue to price in a 100% chance of at least a 25 bps cut at the upcoming meeting.

Investors will likely focus on US Producer Price Index (PPI) data set to be released on Tuesday and Consumer Price Index (CPI) figures on Wednesday. Traders are looking for confirmation that price growth remains stable in the United States.

Daily Digest Market Movers: Japanese Yen declines as odds of a 50 bps Fed rate cut diminish

  • On Sunday, Federal Reserve Governor Michelle Bowman stated that she continues to see upside risks for inflation and ongoing strength in the labor market. Bowman suggested that the Federal Reserve may not be prepared to cut rates at its next meeting in September, according to Bloomberg.
  • As per a Bloomberg report last week, JP Morgan Asset Management (JPAM) believes the Bank of Japan is unlikely to raise interest rates in the near term. According to JPAM, the BoJ may only consider further rate hikes if the Federal Reserve cuts rates and the US economy stabilizes. They anticipate that any additional tightening by the BoJ is more likely to occur in 2025, provided the global economic environment remains stable.
  • The Bank of Japan’s Summary of Opinions from the Monetary Policy Meeting on July 30 and 31 indicated that several members believe economic activity and prices are evolving as expected by the BoJ. They are aiming for a neutral rate of “at least around 1%” as a medium-term target.
  • Last week, BoJ Deputy Governor Shinichi Uchida also noted that BoJ’s interest rate strategy will adapt if market volatility alters economic forecasts, risk assessments, or projections. Given recent market volatility, he emphasized the need for careful monitoring of the economic and price impacts of their policies, stating, “We must maintain the current degree of monetary easing for the time being.”
  • The minutes from the Bank of Japan’s June meeting indicated that some members voiced concerns about rising import prices due to the recent decline in the JPY, which could present an upside risk to inflation. One member highlighted that cost-push inflation might exacerbate underlying inflation if it leads to increased inflation expectations and wage hikes.

Technical Analysis: USD/JPY tests 147.50; next barrier at nine-day EMA

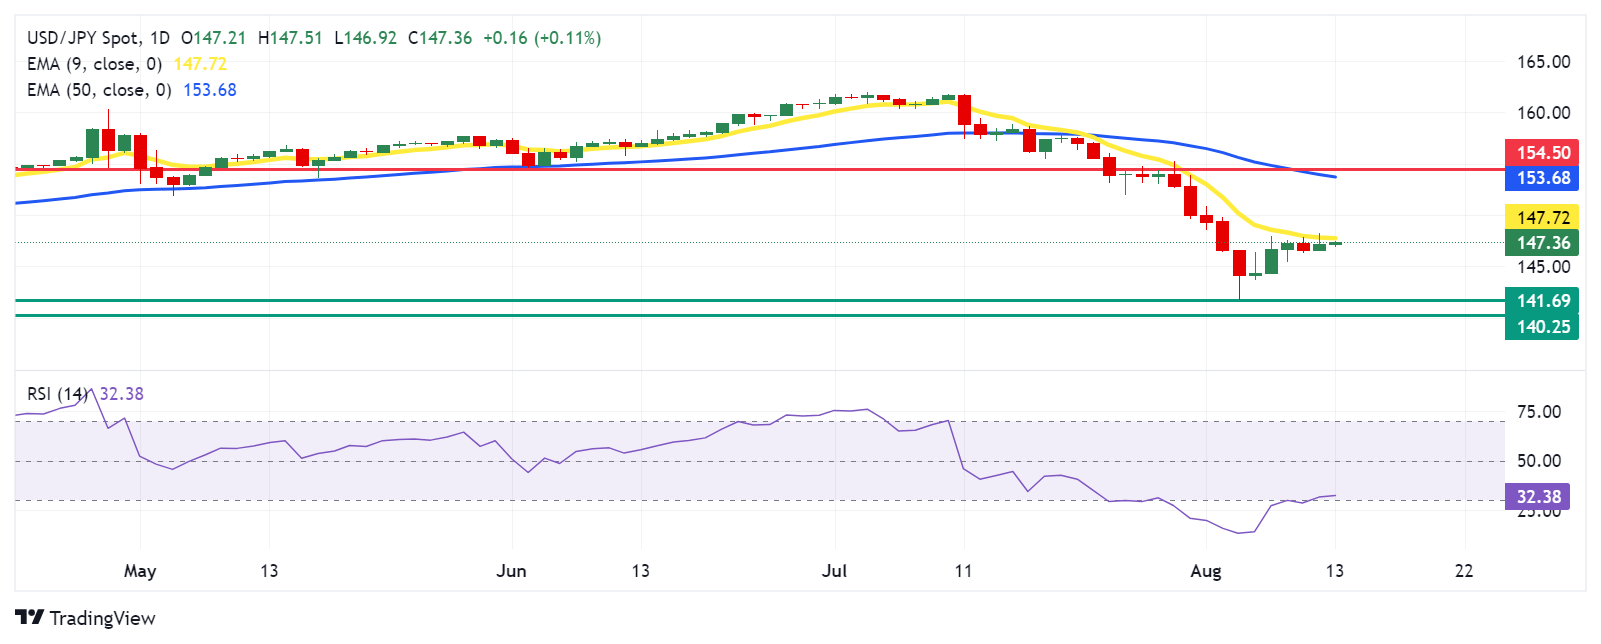
USD/JPY trades around 147.40 on Tuesday. The daily chart analysis shows that the pair remains below the nine-day Exponential Moving Average (EMA), suggesting a bearish trend in the short term. Moreover, the 14-day Relative Strength Index (RSI) has breached above the 30 level, suggesting a potential for a correction. If the RSI moves toward the 50 level, it could signal a potential improvement in the pair’s momentum.

For support levels, the USD/JPY pair may test a seven-month low at 141.69, recorded on August 5, followed by the throwback support at 140.25.

On the upside, the USD/JPY pair could test the immediate barrier at the nine-day EMA around the 147.72 level. A breakout above this level could diminish bearish momentum and allow the pair to approach the 5-day EMA at 153.68, followed by the “throwback support turned resistance” at 154.50.

USD/JPY: Daily Chart

EUR/JPY clings to gains near daily peak, above mid-161.00s amid weaker JPY

EUR/JPY clings to gains near daily peak, above mid-161.00s amid weaker JPY

The EUR/JPY cross attracts some dip-buying following the previous day’s modest pullback from over a one-week top and sticks to its intraday gains through the early European session on Tuesday. Spot prices currently trade just above the mid-161.00s, up nearly 0.50% for the day, and draw support from the offered tone surrounding the Japanese Yen (JPY).

Against the backdrop of the recent dovish remarks by Bank of Japan (BoJ) Deputy Governor Shinichi Uchida, a positive tone around the equity markets is seen undermining demand for the safe-haven JPY. In fact, Uchida said last week that the central bank won’t hike rates when markets are unstable. Furthermore, a former BoJ board member Makoto Sakurai predicted a rate hike only by March 2025 citing the recent market turmoil and the low likelihood of a rapid economic recovery.

That said, the BoJ’s summary of opinions from the July policy meeting released last week indicated that some members see room for further rate hikes and policy normalization. Moreover, the risk of a further escalation of geopolitical tensions in the Middle East, along with the protracted Russia-Ukraine war, should keep a lid on the market optimism and help limit JPY losses. This, along with the lack of any buying around the shared currency, should contribute to capping gains for the EUR/JPY cross.

Hence, it will be prudent to wait for strong follow-through buying before positioning for an extension of the pair’s recent strong recovery move from the 141.70-141.65 region, or the lowest level since early January touched last week. Traders now look to the flash Eurozone Q2 GDP print on Wednesday for a fresh impetus ahead of the prelim Japanese Q2 GDP report on Thursday. Apart from this, geopolitical developments should produce short-term opportunities around the EUR/JPY cross.