Gold, Silver Technicals: XAU/USD Tests All-Time High, Silver Bulls Reemerge

Gold, Silver Technicals: XAU/USD Tests All-Time High, Silver Bulls Reemerge

Gold Attempts to Reach New High but Faces an Immediate Test

Gold prices have recovered from last week’s significant volatility spike as the gold volatility index (GVZ) has come down to levels seen before the panicked move. It must also be said that continued geopolitical uncertainty pertaining to a wider conflict in the Middle East remains a concern, helping to keep gold supported, especially ahead of the weekend.

Additionally, the Fed is said to be gearing up for the rate cutting cycle which is expected to get underway next month after a string of softer US data points suggesting the economy may be more vulnerable than initially thought.

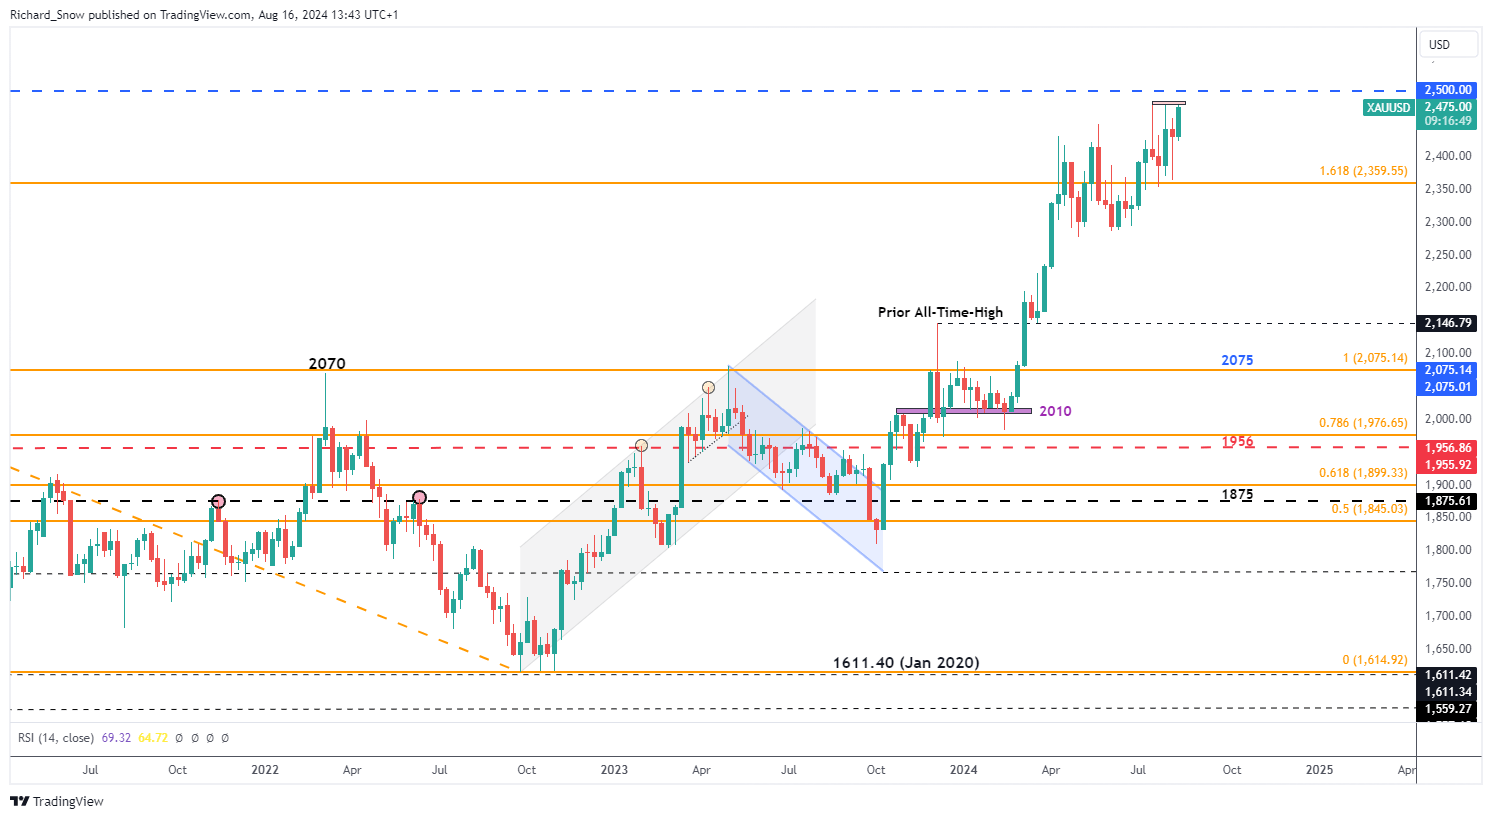
Gold continues to trade above the 1.618 Fibonacci extension of the 2020-2022 major decline, headed towards the next key level of resistance of $2,500. The precious metal has received a bullish boost on Friday, after bouncing off the prior high of $2,450 – testing the more recent level of resistance at 2,484 where prior advances have failed.

Gold Weekly Chart

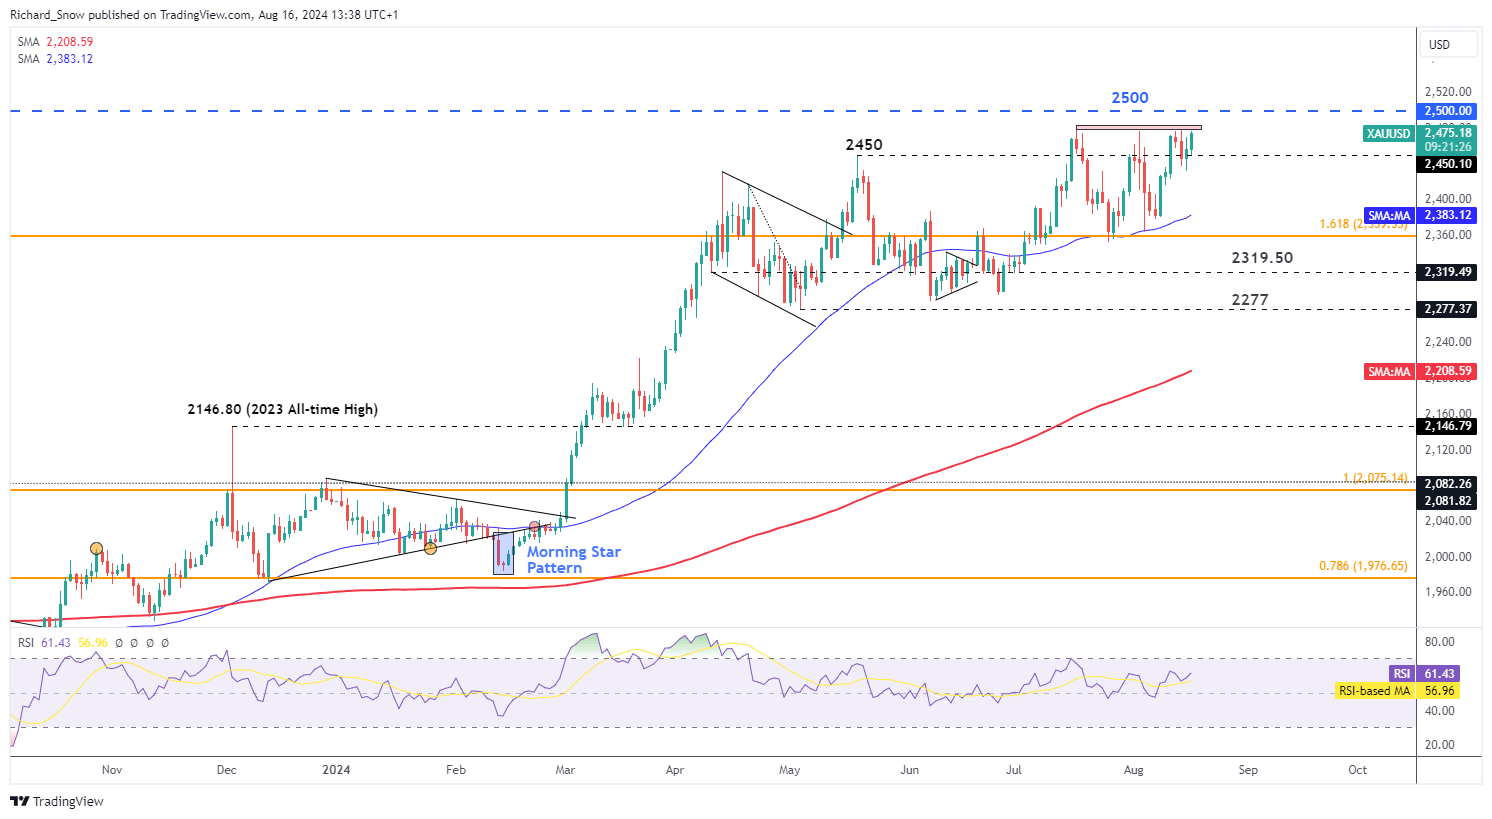
The daily gold chart helps provide a more granular view of gold’s ascent which has oscillated broadly since the middle of July, using the blue 50-day simple moving average as dynamic support.

The RSI has lifted slightly, appearing set for overbought territory, however, the precious metal has managed to avoid overheating in 2024 apart from a brief moment in July. Resistance lies at the psychological level of $2,500 and very near-term support emerges at $2,450, followed by the 50 SMA at $2,382.

Gold Daily Chart

A graph of stock market  Description automatically generated with medium confidence

Silver Finds Temporary Support at Key Fibonacci Level as Bulls Attempt to Drag Prices Higher

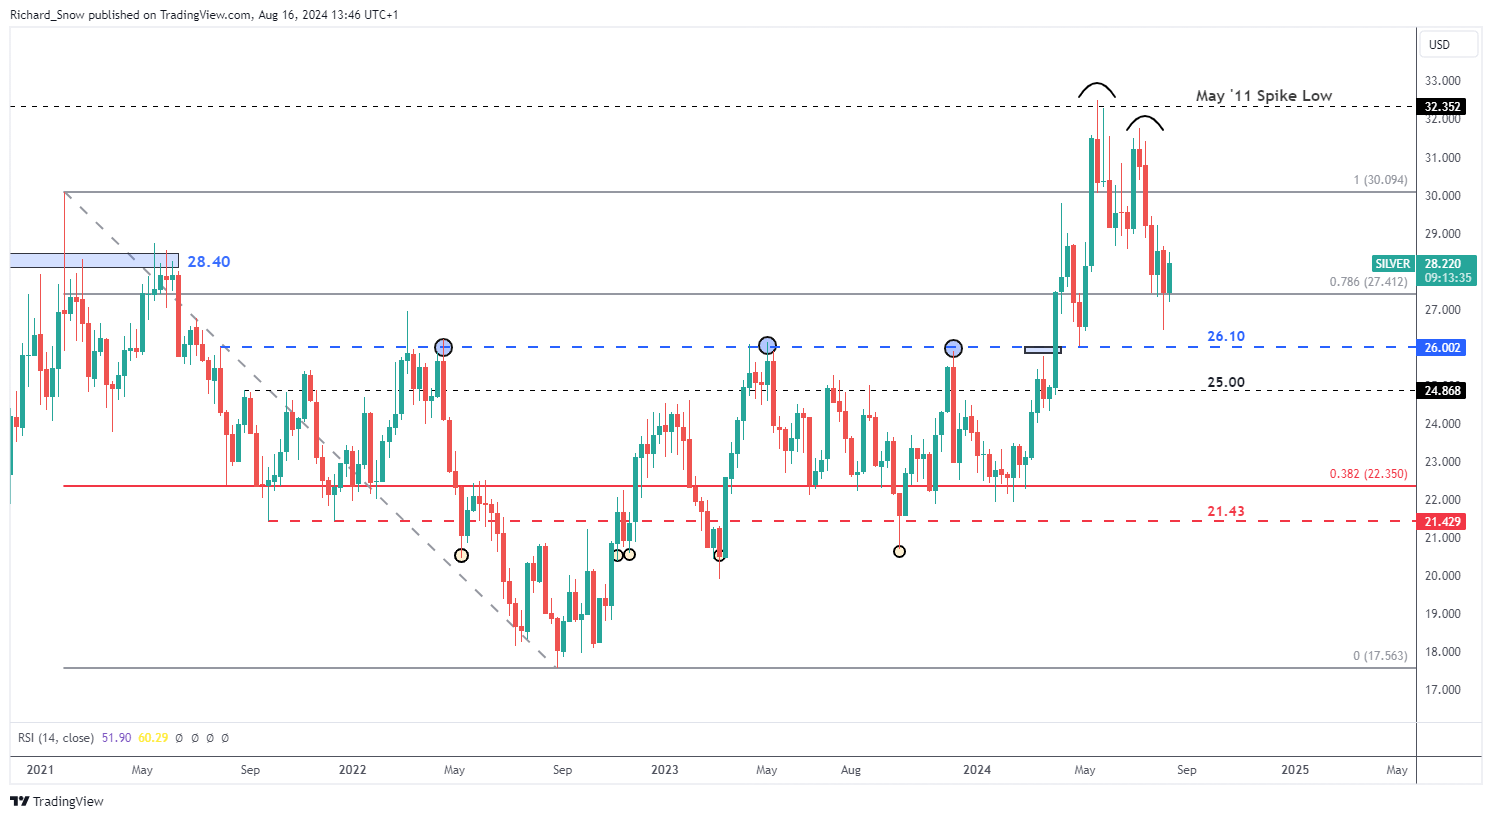
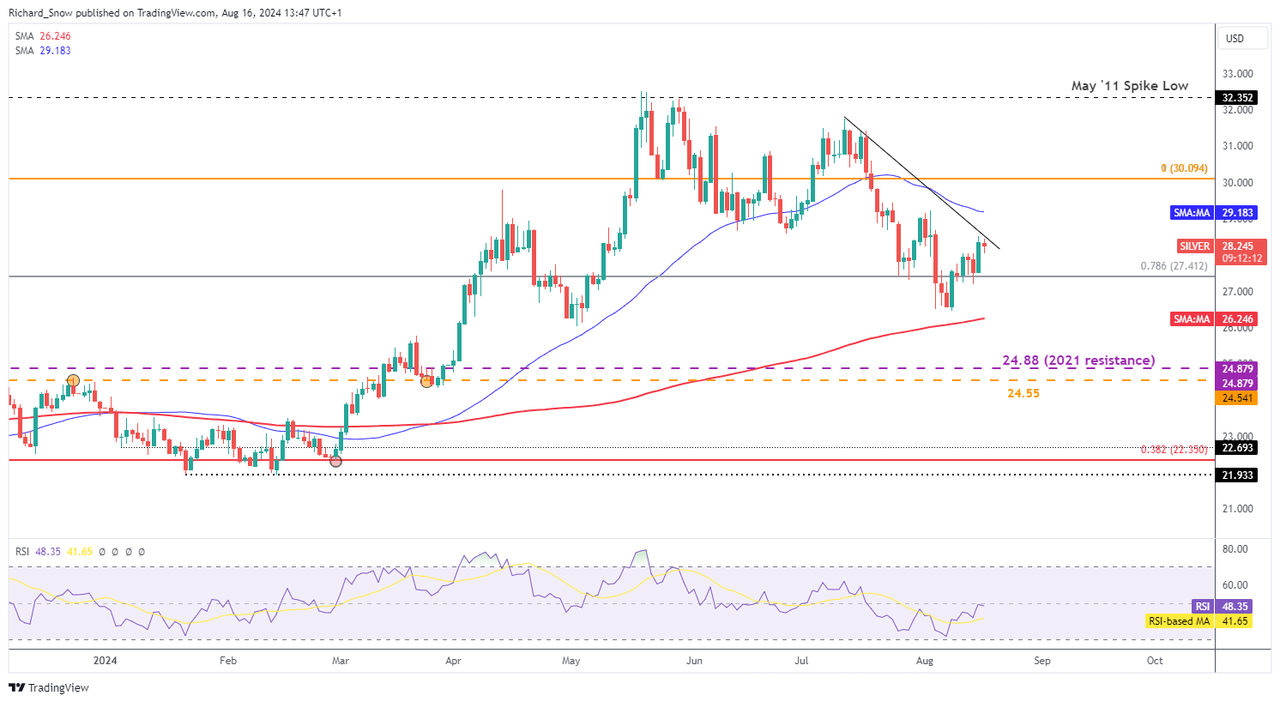
Silver has traded conversely to gold, managing to selloff since the latter days in May. XAG/USD topped out above $32, attempting another advance which ultimately fell short near $31.75 and has come off a sizeable amount since then. The metal now attempts to find support at the prior Fibonacci level of $27,40. The Fibonacci retracement relates to the 2021-2022 decline.

Silver Weekly Chart

A screenshot of a graph  Description automatically generated

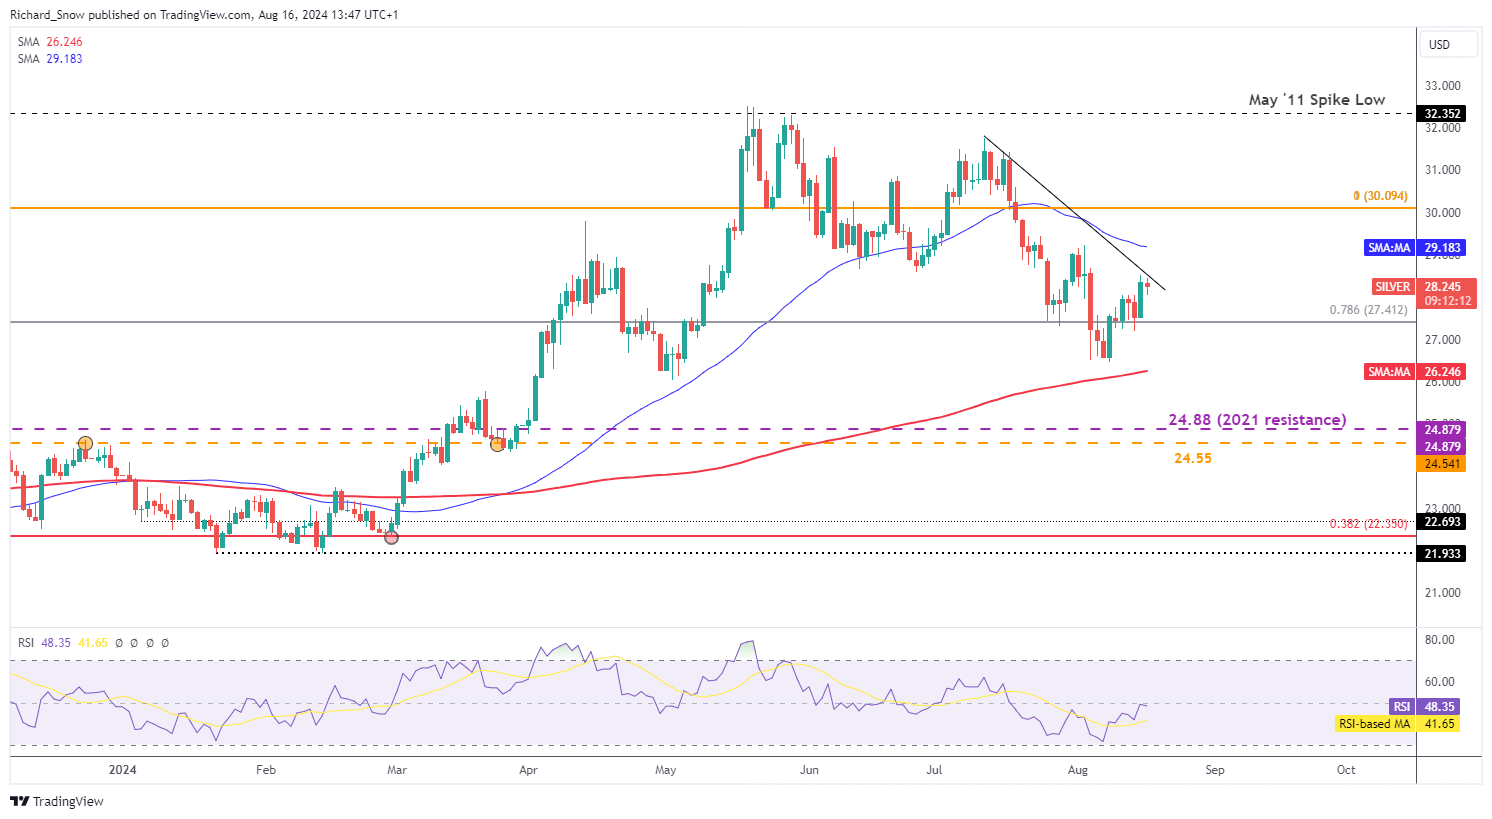
The daily silver chart reveals a shorter-term test of trendline resistance. Silver’s recent upward lift was inspired by a bounce off the 200-day SMA and subsequent momentum which has lifted the commodity above the 78.6% Fib level.

A condition for a reassessment of the broader bearish move would require a break above the trendline followed by an immediate test (as support) and subsequent bullish follow through. Until then, the bearish trend move appears constructive and the RSI continues along the midline – revealing neither overbought nor oversold signals.

Silver Daily Chart

A graph of stock market  Description automatically generated


EUR/USD clings to modest daily gains, stays below 1.1000

EUR/USD clings to modest daily gains, stays below 1.1000

EUR/USD trades modestly higher on the day but remains slightly below 1.1000. The improving risk mood makes it difficult for the US Dollar to build on Thursday’s gains and helps the pair hold its ground ahead of the weekend.

The Relative Strength Index (RSI) indicator on the 4-hour chart started to rise toward 60 after falling to 50 on Thursday, reflecting sellers’ hesitancy. On the upside, 1.1000 (psychological level, static level) aligns as immediate resistance ahead of 1.1050-1.1060 (static level) and 1.1100 (psychological level, static level).

Supports could be seen at 1.0960 (static level), 1.0940 (static level) and 1.0900 (psychological level, static level).

EUR/USD regains its traction and rises toward 1.1000 in the European session on Friday after snapping a three-day winning streak on Thursday.

The upbeat macroeconomic data releases from the US provided a boost to the US Dollar (USD) and caused EUR/USD to turn south. The US Department of Labor reported that the weekly Initial Jobless Claims declined by 7,000 to 227,000 in the week ending August 9. Other data from the US showed that Retail Sales rose 1% on a monthly basis in July, beating the market expectation for an increase of 0.3%.

Early Friday, the improving risk mood makes it difficult for the USD to build on Thursday’s gains and helps EUR/USD stretch higher.

The US economic docket will feature Housing Starts and Building Permits data for July. Additionally, the University of Michigan will release the preliminary Consumer Sentiment Index data for August. The market reaction to these data is likely to remain short-lived.

Meanwhile, US stock index futures are up between 0.2% and 0.3% in the European session. In case Wall Street’s main indexes open in positive territory and continue to push higher ahead of the weekend, the USD could stay on the back foot and open the door for another leg higher in the pair.


EUR/USD and USD/JPY – Latest Sentiment Analysis

EUR/USD and USD/JPY – Latest Sentiment Analysis

The analysis suggests that while there’s been some recent shift towards long positions, the overall sentiment remains predominantly short. This contrarian approach implies that the EUR/USD might continue to strengthen, despite the majority of traders betting against it. However, the mixed signals from different timeframes (daily vs weekly changes) lead to an overall mixed trading bias.

USD/JPY Sentiment Analysis

Current positioning:

  • 42.64% of traders are net-long
  • The ratio of short to long traders is 1.35 to 1

Changes in positioning:

  • Net-long traders: Down 14.49% from yesterday, down 11.96% from last week
  • Net-short traders: Up 10.17% from yesterday, up 10.94% from last week

Interpretation:

  • The analysis takes a contrarian view to crowd sentiment
  • The net-short position suggests USD/JPY prices may continue to rise

Overall outlook:

  • Traders are further net-short compared to both yesterday and last week

This data shows a significant shift towards short positions in USD/JPY over both daily and weekly timeframes. The percentage of net-long traders has decreased, while net-short traders have increased. Using the contrarian approach, this growing bearish sentiment among retail traders is interpreted as a bullish signal for USD/JPY. The analysis suggests that despite more traders betting against the currency pair, its price may actually continue to rise.

The consistent movement towards short positions across both timeframes (daily and weekly) provides a clearer signal compared to the previous EUR/USD data, which showed mixed trends.


Turning a Market Theme into a Trade Idea

Turning a Market Theme into a Trade Idea

-Turning Themes into Trading Ideas

One of the beauties of trading any major market is that there is rarely a shortage of stories or themes. These themes are important because they breed trading opportunities and when a theme moves through the market like pulse through the world, there can quickly be a panic to exit out of the week currency and find refuge in a strong currency which breeds opportunity. These themes, where a weak currency falls and a strong currency emerges can be coupled with technical analysis to spot trading opportunities.

Themes in the FX Market

Defining a theme is easy. What’s less simple is finding an entry point for a trend when the theme is clear, which we’ll discuss today. The first month of 2015 isn’t over and big moves have already happened as clear themes have emerged as aggressive central bank action along with USD strength, which has been bolstered by the current assumption that the Federal Reserve will likely be the only central bank hiking interest rates this year. Another key theme playing out is the currencies that are related to the energy market like that Canadian Dollar.

How Themes Develops

In its simplest terms, a theme develops when a pre-conceived notion is disturbed. Some say that markets are a price discovery machine with traders buying or selling hoping others will discover that they bought low relative to common belief or sold high based on realized over-valuation. However the disruption happens, when a widely held currency becomes despised and a candidate for a large loss, traders often sell that currency aggressively which brings wonderful opportunity.

Learn Forex: A Theme of Impending EUR QE & Risk-Off Was a Recipe for EURJPY Drop

Presented by FXCM’s Marketscope Charts

The clearest form of disruption that has taken place over the last few months is monetary policy divergence. Monetary Policy Divergence happens when you have a central bank with an easy monetary policy that often weakens a currency, like we’ve seen with the JPY since 2012 and another with a tight monetary policy that often strengthens a currency like is assumed with the Federal Reserve with assumption of a 2015 rate hike making the USD the strongest currency out of the gate to start the new year.

Another popular theme is risk-on / risk-off. This can be almost too simple to be helpful but the concept is helpful and can be applied when the best currencies to trade from the current cycle are made clear. Typically, risk-off causes institutional traders to get scared and they run away from risk in the form of selling risky assets and buying the safe stuff. The seemingly safest plays to run away from risk and into apparent safety is government debt which help traders know that at the very least, there money is safe even if it’s not bringing the returns they wish or even costing them money to park money.

Turning Themes into Trading Ideas

Presented by FXCM’s Marketscope Charts

The easiest first step is to find out what currencies are effected by the new theme. With the drop in oil, we’ve seen CAD weaken tremendously as you can see in the chart above. This chart combines two impressive themes, the strong USD due to central bank perceived action and the CAD that has had monetary policy divergence with a dovish central bank and the impact of Oil weakening the CAD.

To find the trade entry, you can simply look for break of support in a downtrend or resistance in a downtrend. This allows you to join the trend when it accelerates. Naturally, you can place a stop at the move recent pivot or swing in order to manage risk.

Why Do Trends in Markets Form?

Why Do Trends in Markets Form?

Why do trends in markets form?

Technical analysis is often a misunderstood discipline, and even misrepresented by some of its biggest proponents. Technical analysis doesn’t so much drive the market (although there is an element of technically-driven trading occurring), but is a way to analyze market participants’ collective perception of the underlying fundamental drivers and catalysts, or fundamental theme when one develops. You can think of the primary tool of technical analysis, a chart, as a footprint made collectively by all those participating in the market.

Understanding the range

To understand why trends form on a chart, we start with a frequent precursor to a trend. It typically begins with a dull, rangebound market. A rangebound market often shows up when known drivers are properly priced-in to the backdrop. This allows for sideways price movements where no new highs or new lows are coming into play. In a choppy market there is an equilibrium between buyers and sellers in the absence of an underlying driver or theme. The market is effectively in limbo. It is usually marked by low volatility, and outside of specific strategies designed to take advantage of low volatility, this type of market leaves much to be desired in terms of opportunity.

From range to breakout

In a breakout market there is a gear switch towards a fundamental theme where market participants are forced into action as risks make a shift in one direction or the other from dull market conditions. The shift can come from a large catalyst or a buildup of pressure over time. You can think of a rangebound market going into a breakout market as a pile of sand that has had its final grain dropped on it before it collapses.

A trending market is the breakout maturing a theme, which strengthens and becomes sustainable. The strength of the theme draws further participation into the market and becomes self-reinforcing. A good trend won’t be derailed by small fundamental events and data releases. These are only short-lived bumps in the road with market participants’ attention quickly turning back towards the broader underlying theme.

In the beginning of a trend, the theme isn’t visible to many, typically only to the most astute market participants. But as the trend matures, it becomes apparent to an increasingly less sophisticated crowd of traders until the trend eventually reaches a point of exhaustion and changes course. For a more in-depth look at this process, check out Market Cycles | Phases, Stages, and Common Characteristics.

USD/JPY from 2017 to 2022 is a good example of a market that went from dormant for a long period of time to a breakout/trending market. USD/JPY volatility dried up and trading was choppy from around the beginning of 2017 until early 2021. In early 2021 USD/JPY started to break out and trend higher before posting a sharp rally in 2022 when U.S. inflation and interest rates took off sharply.

USD/JPY 2017 to 2021 Choppy Range Turning into a Powerful Trend

USD/JPY Charts

Trends can also form suddenly when markets quickly reverse. These are a result of market participants having to adjust their positioning due to the perception of a rapidly changing backdrop. Stock markets for instance can swiftly go from a bear market to a bull market after panic selling dries up.

S&P 500 Bear Market Swiftly Turning into Bull Market

S&P 500 Chart by TradingView

Generally speaking, trends can offer excellent opportunities for traders if approached with the proper strategy. They occur on every time frame, so there is always a trend emerging. There are many considerations to take into account when trading trending markets. We cover them in depth in the Trend Trading Guide. Check out the banner below find out more about how to become a better trend trader.

UK Growth Continues to Show Signs of Recovery Despite Stagnant June Print

UK Growth Continues to Show Signs of Recovery Despite Stagnant June Print

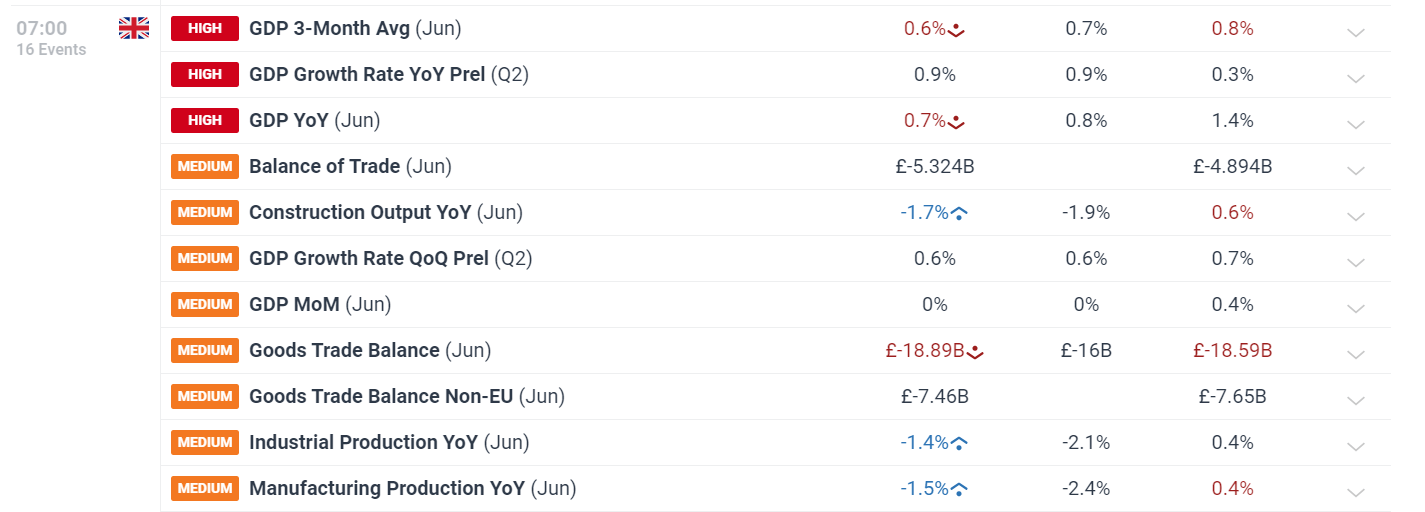
UK GDP for the Second Quarter as Expected – June Reveals Stagnant Growth

The first look at economic growth in the UK for Q2 printed as expected at 0.6%, quarter on quarter. UK growth has struggled throughout the rate hiking cycle but has shown more recent signs of recovery in the lead up to this month’s Bank of England (BoE) meeting where the monetary policy committee voted to lower interest rates for the first time since March 2022.

A screenshot of a computer  Description automatically generated

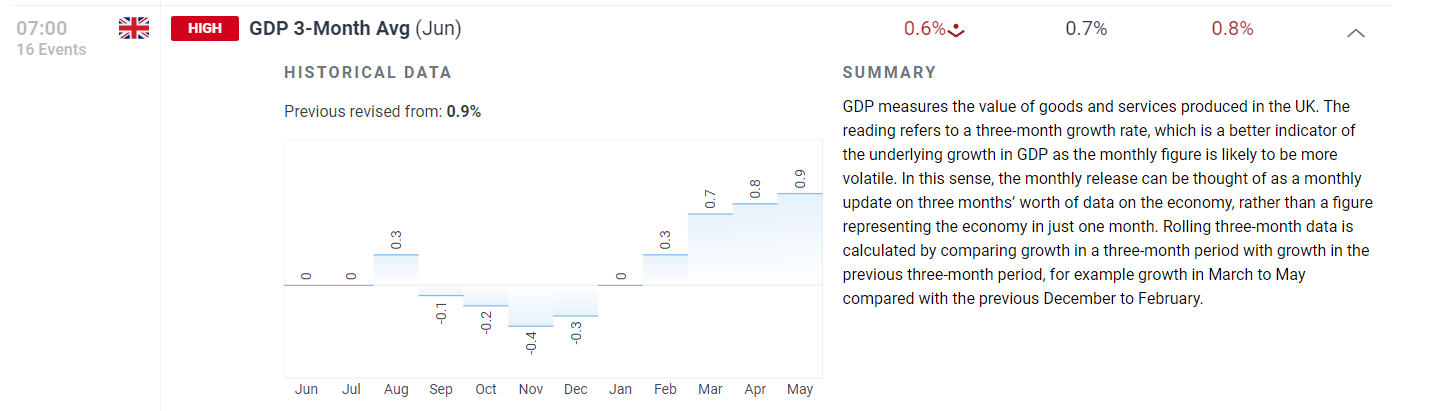
A stronger showing in Q1 (0.7%) is followed by a similar 0.6% expansion in Q2 according to the preliminary estimate. GDP data is subject to numerous revisions as more data becomes available, meaning the number may change but for now, the economy is showing signs of promise. A better gauge of growth trends, the 3-month average ending in June, proves growth has lifted off stagnant, and even negative, levels. It isn’t all good news as June was a month of stagnant growth (0%) when compared to May as declines in the services sector were offset by strong manufacturing output.

UK GDP 3-Month Average

A graph with text and numbers  Description automatically generated with medium confidence

Sterling’s Pullback Reaches a Point of Reflection

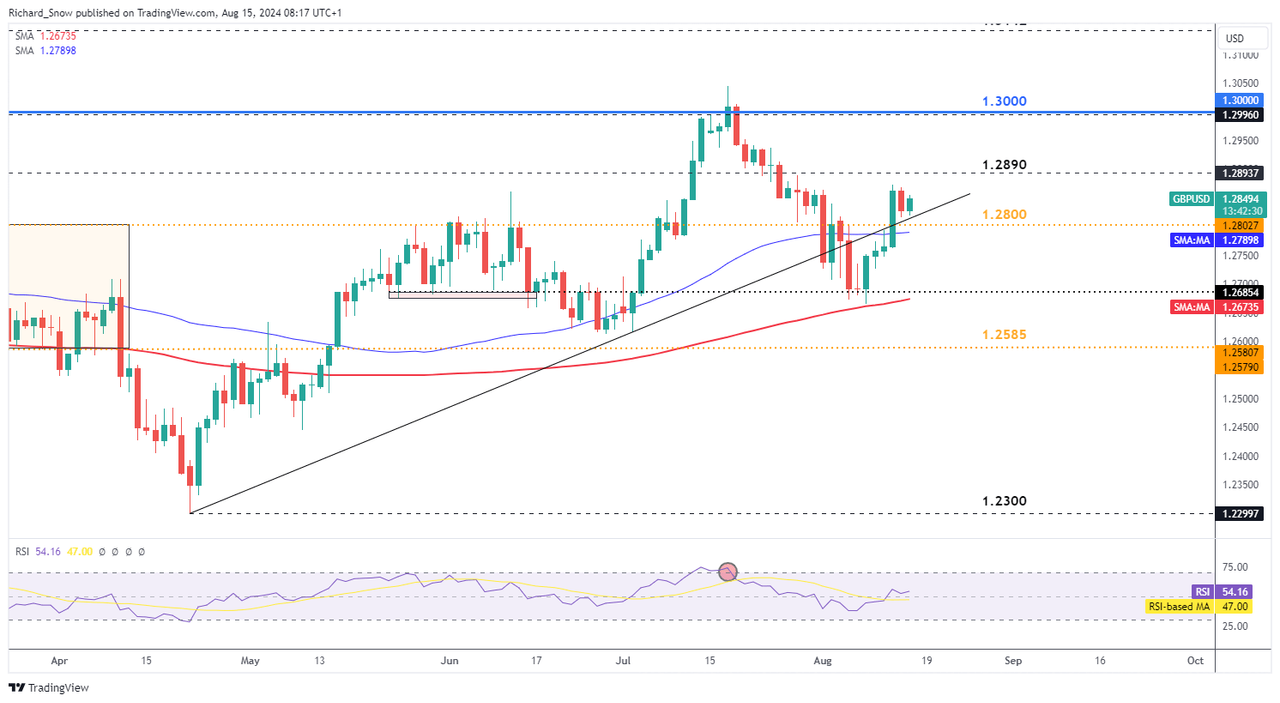
GBP/USD has partially recovered after the major selloff in July, with bulls looking for a bounce off trendline support in search of another leg higher. Yesterday’s UK inflation data told a mixed story as inflation in July rose by less than expected. The fact that we’d see a higher print has been well-telegraphed by the bank of England after forecasts revealed inflation would remain above the 2% target for a long time after hitting the significant marker. However, inflation is not expected to spiral out of control but potential surprises to the upside may help keep sterling buoyed – especially at a time when the prospect of a potential 50 basis point cut from the Fed remains a real possibility. Front loading the cutting cycle could weigh heavily on the dollar, to the benefit of GBP/USD.

GBP/USD has risen after bouncing off the 200-day simple moving average (SMA) around the former level of support at 1.2685 (May and June 2024). Since then the pair has burst through trendline support, former resistance. Bulls will be looking for the pair to respect the test of support with 1.3000 in sight. Support is clustered around the zone comprising of 1.2800, trendline support, and the 50 SMA.

GBP/USD Daily Chart

A screenshot of a graph  Description automatically generated

US CPI Steadies Around Estimates – USD and Treasuries Rise

US CPI Steadies Around Estimates – USD and Treasuries Rise

US CPI Prints Mostly in Line with Expectations, Yearly CPI Better than Anticipated

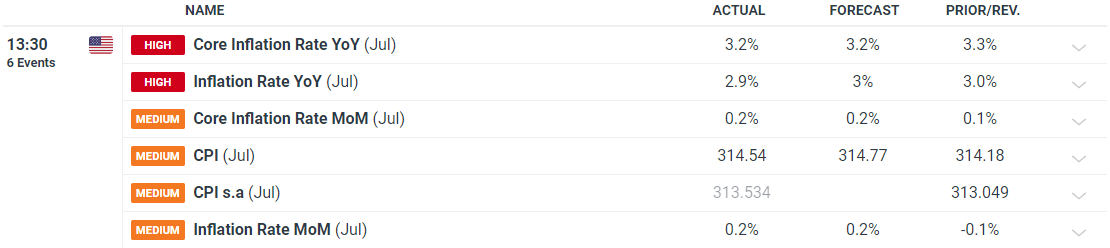
US inflation remains in huge focus as the Fed gears up to cut interest rates in September. Most measures of inflation met expectations but the yearly measure of headline CPI dipped to 2.9% against the expectation of remaining unchanged at 3%.

A white paper with black lines  Description automatically generated

Market probabilities eased a tad after the meeting as concerns of a potential recession take hold. Softer survey data tends to act as a forward-looking gauge of the economy which has added to concerns that lower economic activity is behind the recent advances in inflation. The Fed’s GDPNow forecast foresees Q3 GDP growth of 2.9% (annual rate) placing the US economy more or less in line with Q2 growth – which suggests the economy is stable. Recent market calm and some Fed reassurance means the market is now split on weather the Fed will cut by 25 basis points or 50.

Implied Market Probabilities

A screen shot of a computer  Description automatically generated

Immediate Market Reaction

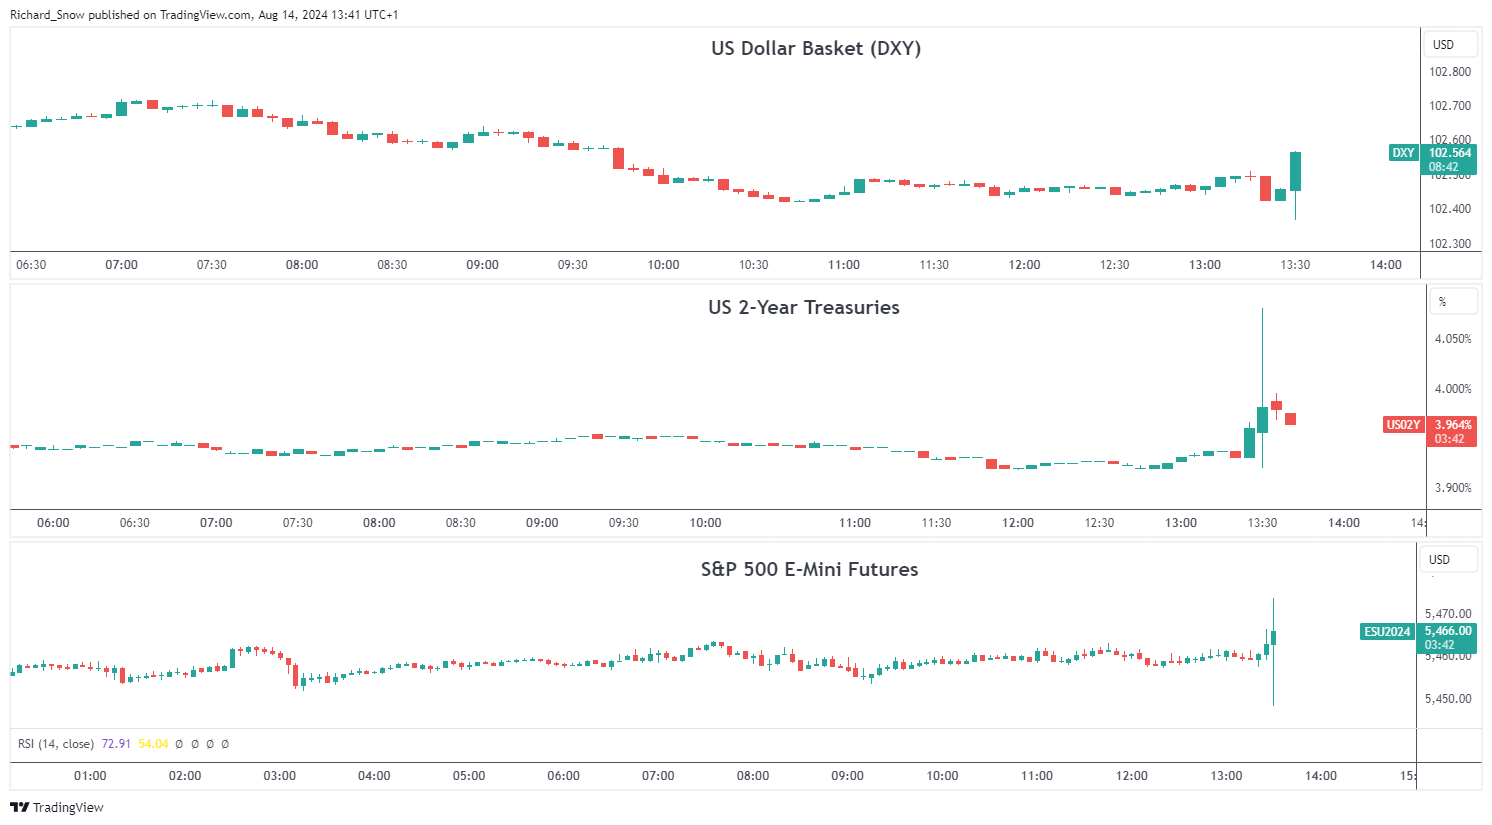
The dollar and US Treasuries have not moved too sharply in all honestly which is to be expected given how closely inflation data matched estimates. It may seem counter-intuitive that the dollar and yields rose after positive (lower) inflation numbers but the market is slowly unwinding heavily bearish market sentiment after last week’s massively volatile Monday move. Softer incoming data could strengthen the argument that the Fed has kept policy too restrictive for too long and lead to further dollar depreciation. The longer-term outlook for the US dollar remains bearish ahead of he Feds rate cutting cycle.

US equity indices have already mounted a bullish response to the short-lived selloff inspired by a shift out of risky assets to satisfy the carry trade unwind after the Bank of Japan surprised markets with a larger than expected hike the last time the central bank met at the end of July. The S&P 500 has already filled in last Monday’s gap lower as market conditions appear to stabilise for the time being.

Multi-asset Reaction (DXY, US 2-year Treasury Yields and S&P 500 E-Mini Futures)

A screenshot of a graph  Description automatically generated


What is the VIX? A Guide to the S&P 500 Volatility Index

What is the VIX? A Guide to the S&P 500 Volatility Index

What is the VIX in the stock market?

The VIX was created by the Chicago Board Options Exchange (CBOE) in 1990 to act as a benchmark for measuring expectations about future stock market volatility. It’s a real-time index which reflects market participants’ expectations of volatility over the next 30 days.

At the most basic level the VIX index is constructed using weekly and traditional SPX index options and their levels of implied volatility. One can think of implied volatility as expected volatility derived from market participants’ activity in the options market. Understanding why the VIX behaves inversely to the S&P 500 is important because the volatility index acts as a measure of market sentiment, hence the reason it is called a “fear barometer”.

What is the relationship between vix and S&P 500 (SPX)?

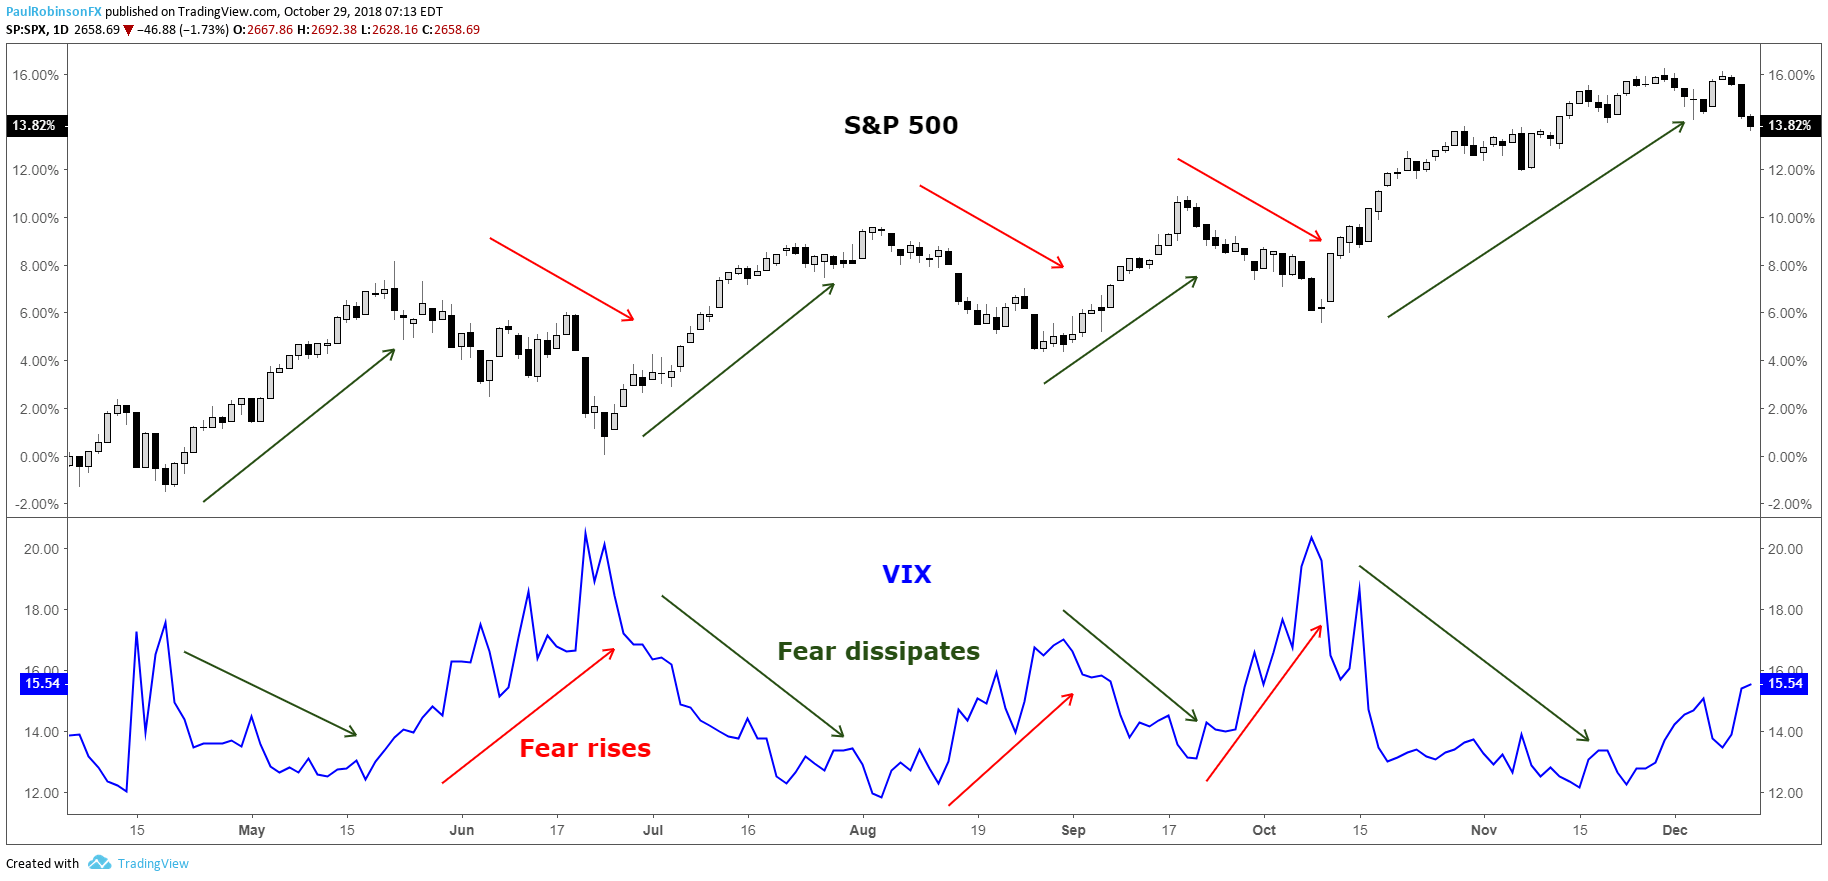
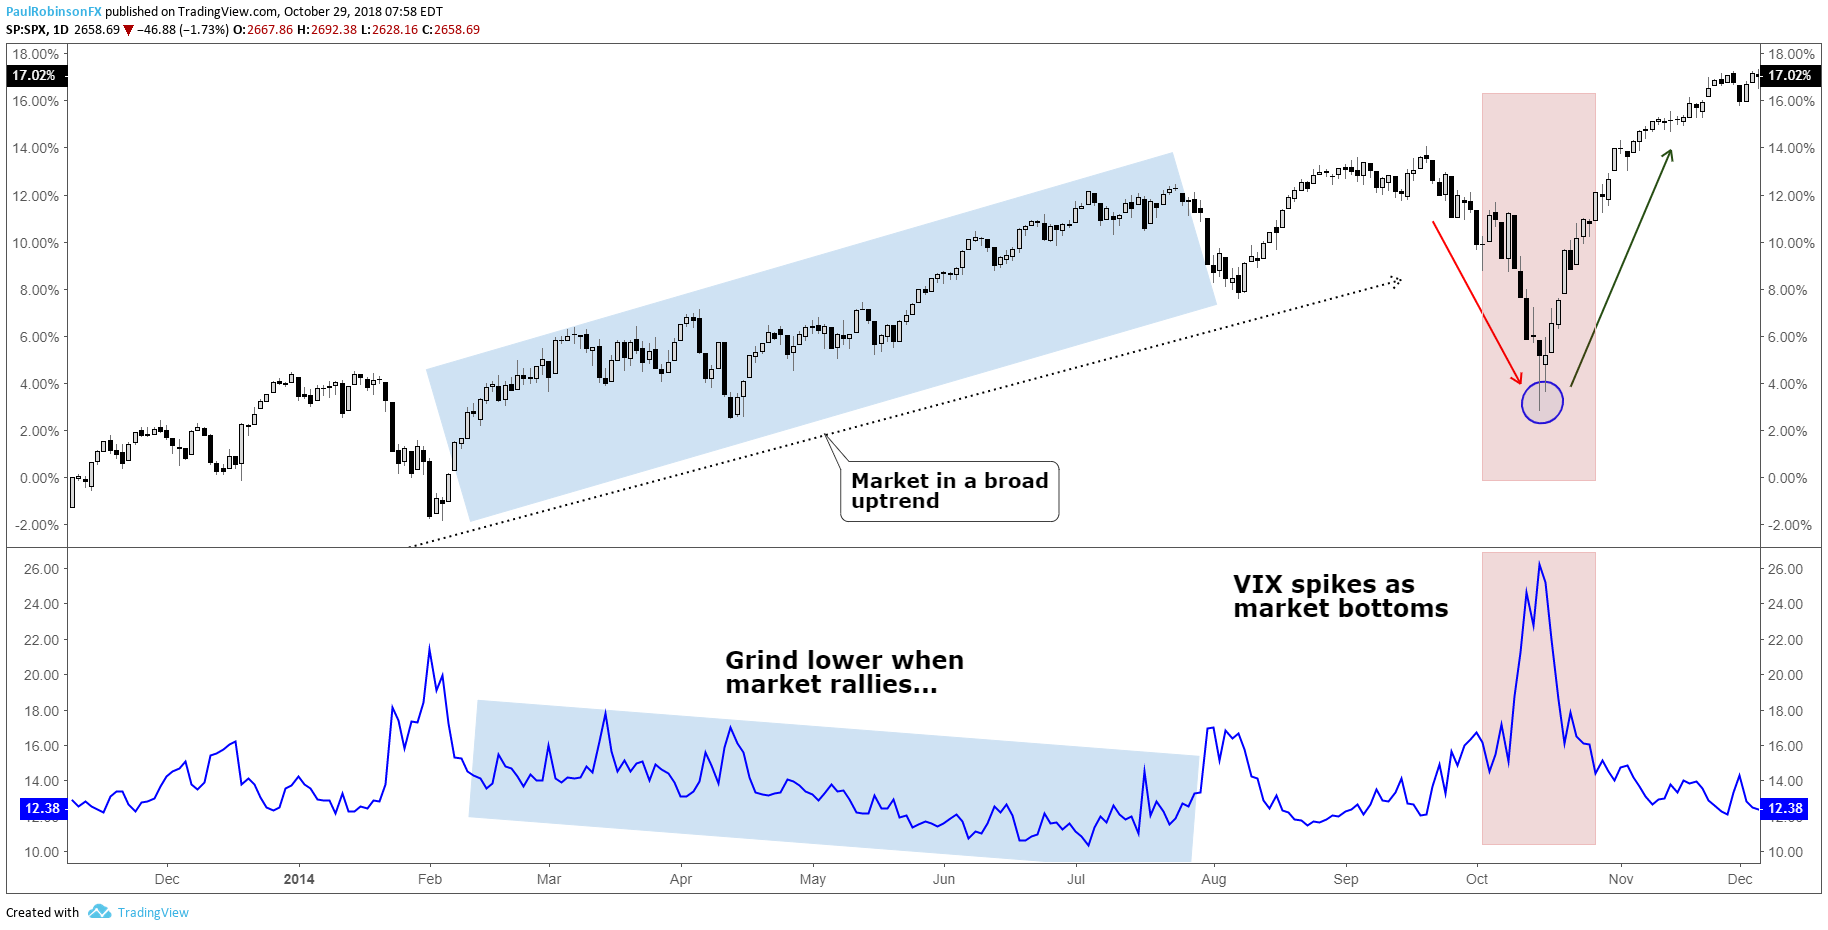
The S&P 500 VIX has a propensity to rise in bearish stock market environments and fall or remain steady during bullish environments. This happens because of the long-term bullish bias of the stock market and the fact that the VIX is calculated using implied volatility.

Implied volatility goes up when there is strong demand for options, and this typically happens during declines in the price of the S&P 500 as market participants (who are collectively bullish) are quick to buy protection (put options) for their portfolios.

When the S&P 500 rallies we see demand for protection dissipate and as a result a decline in the VIX. This process in recent years has become exasperated, in all likelihood, because the VIX has gone from just a market gauge of volatility to a tradable asset class through product offerings on various futures, equities, and options exchanges.
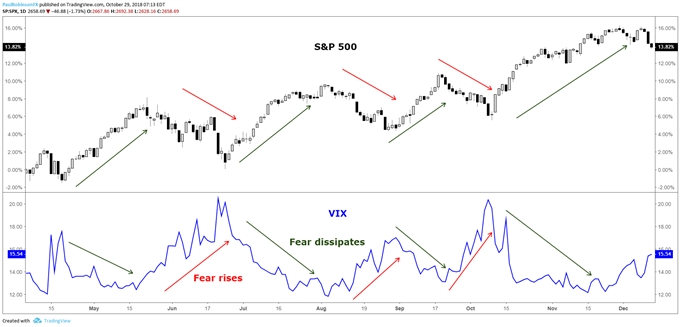
VIX rises when the S&P 500 falls

S&P 500 VIX correlation

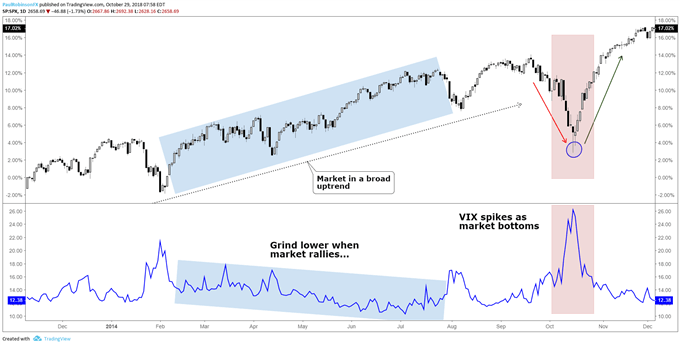
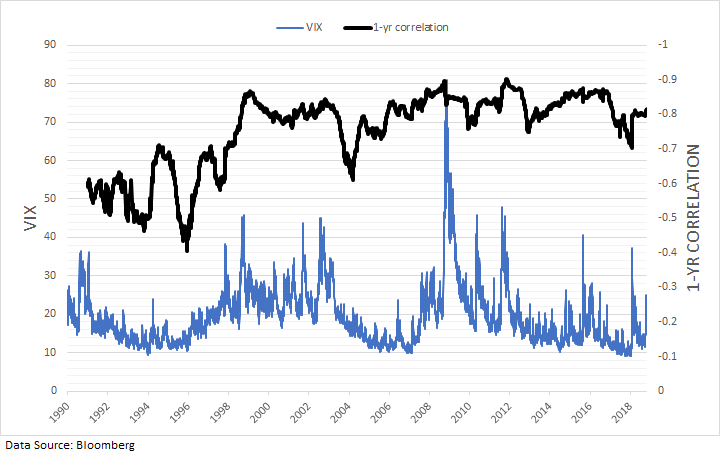
The S&P 500 VIX correlation is simply how the S&P 500 and the VIX move relative to one another. From the chart above it’s easy to see the strongly negative correlation between the stock market and the VIX. Stock market slumps lead to spikes in the index. Dating back the beginning of the VIX in 1990, the correlation between daily changes in the S&P 500 and VIX is -77%. Over the past 10 years the inverse correlation has become even stronger at -81%, while prior to October 2008 it was -74%.

The tighter relationship could very well be attributed to the various products introduced over the past 10-15 years which allow market participants to trade the VIX. As said earlier, this would also make sense as to why we are also seeing larger spikes in the VIX when the market weakens, as trading of the VIX itself is causing exaggerated moves in implied volatility.

The relationship between the S&P 500 and the VIX has largely been consistent and reliable over the years, though. The rolling 1-year correlation between daily changes has on average been around -83% over the past 10 years, staying within a relatively tight range of -70% to -90%.

S&P 500 VIX chart: One-year rolling correlation
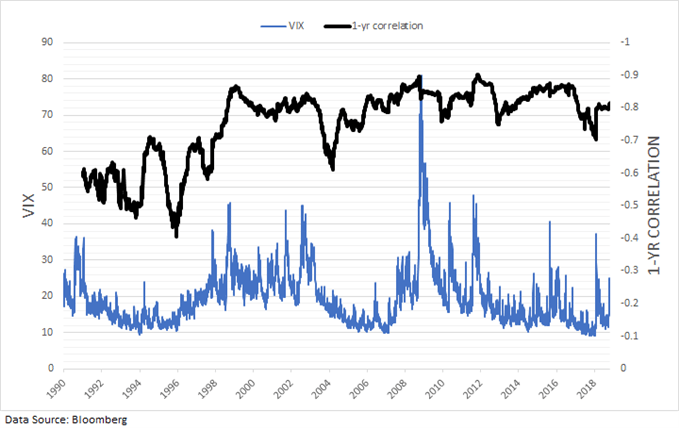
VIX has a strong inverse correlation to the S&P 500 over the long-term

Using VIX to predict S&P 500 Volatility

The S&P500 VIX can be used to identify market turns, more specifically bottoms. Because the stock market tends to rise in a gradual fashion the VIX too will decline in a gradual to sideways fashion. This can lead to very low levels which warn of complacency as investors feel no need for protection, but these periods can last long enough that using the VIX as a sell signal can be rendered largely ineffective.

However, because the S&P 500 is long-biased by nature, when there are declines investors buy protection (put options) quickly, driving up the VIX. Often there is an overreaction by market participants when the market declines, hence the reason why the VIX is called a “fear barometer”.

The spike-like behavior which the VIX exhibits during times of market stress can be a timely signal for determining when selling has become overdone and the market is due to bounce or even bottom for a longer-term move higher. This strategy is typically best employed when the VIX ‘signal’ arrives within the context of a generally bullish trend in the S&P 500.

S&P500 VIX chart: Spikes can be used to indicate trading bottoms
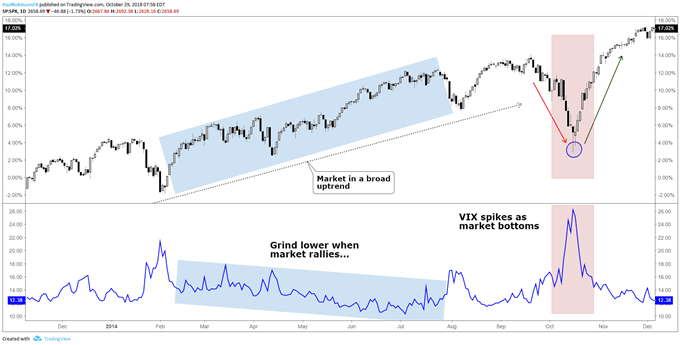
VIX moves lower to sideways in bullish markets, spikes during sell-offs

Circling back around to the complacency factor seen when the VIX is at very low levels, there is a nuance to this which can help identify when the stock market may be nearing a turning point to the downside, but they don’t happen frequently. When the VIX and S&P 500 both rise together over a period of time it can indicate growing instability in the trend which sets the market up for a sell-off.

Using S&P 500 volatility for risk management

When trading the S&P 500 there should be an inverse relationship between trading size and market volatility, or the VIX. One common mistake traders make is that they will simply trade a fixed lot size regardless of the distance their stop-loss is away from the entry price. This means the at-risk amount of capital will be highly variable (likely due to levels of volatility) and thus lead to inconsistent results. Additionally, a trader is putting themselves at greater risk when they should be doing the opposite.

A prudent approach to risk management is to determine how much of your capital you are willing to risk per trade and then adjust the trading size accordingly. For example, if you are willing to risk 1% on an S&P 500 trade and have a 10-point stop-loss, and have another trade where you are willing to risk 1%, but with a 5-point stop-loss, for both trades to equal 1% in risk the second trade would need to be twice as large as the first trade given the distance to the stop-loss. This provides a dynamic approach to position-sizing when trading the S&P 500 for more consistent results.

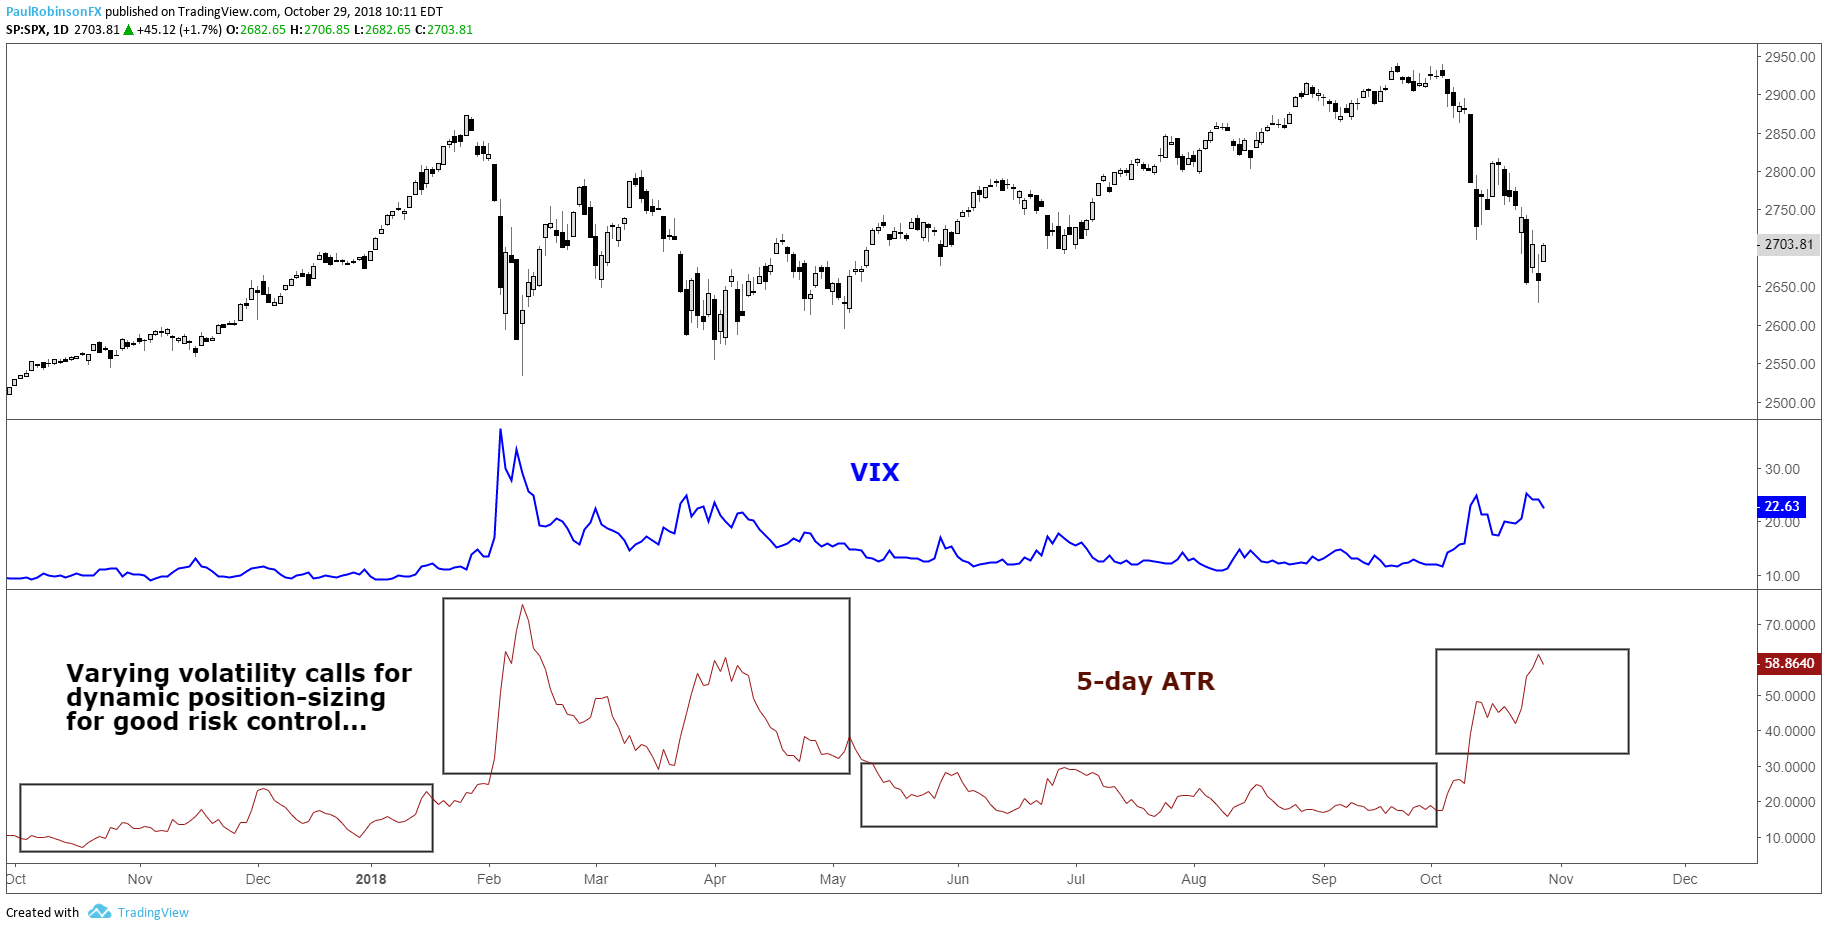
On average, the distance to your stop-loss will largely depend on the level of the VIX. Another way to measure volatility is with ATR (Average True Range). From the chart below, you can see that ATR and VIX look very similar, despite ATR using historical data and the VIX calculation relying on an options pricing model. When the VIX spiked so did the trading ranges of the S&P 500, which means a trader using a dynamic position-sizing strategy would adjust their trading size down to account for the new level of volatility. Simply put, if you are risking specific amounts of capital like in the example above, versus trading fixed lots, then you will be adjusting dynamically with S&P 500 volatility. For more on the topic of risk management, check out this article and video on sound risk management techniques.

S&P 500 VIX & ATR (Changing volatility requires changes to trading size)
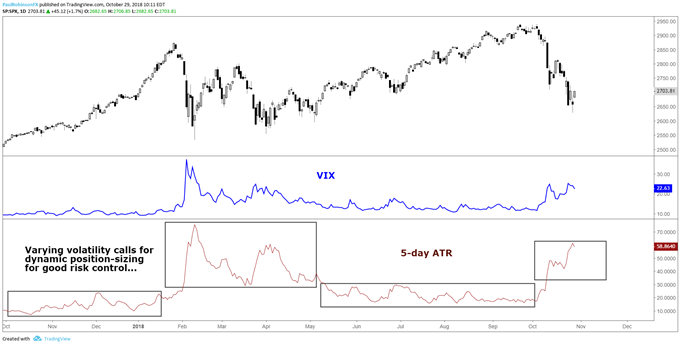
As volatility changes (ATR/VIX) so should position sizes

S&P 500 and VIX Key takeaways

To summarize, understanding stock market volatility and the CBOE Volatility Index (VIX) is important for trading equity indices. There are benefits to understanding the nature of volatility from both an analytical and risk management standpoint. Like all things, getting a feel for the relationship between the VIX and the S&P 500 will take a little experience to get a handle on, but well worth the time.

 

EUR/USD Forecast: Euro breaks out of range ahead of US inflation data

EUR/USD Forecast: Euro breaks out of range ahead of US inflation data

EUR/USD gathered bullish momentum after breaking out of its one-week-old range and reached its highest level since early January above 1.1000. The pair’s near-term technical outlook points to overbought conditions as market focus shifts to the US inflation data.

Euro PRICE This week

The table below shows the percentage change of Euro (EUR) against listed major currencies this week. Euro was the strongest against the Japanese Yen.

USD EUR GBP JPY CAD AUD NZD CHF
USD -0.96% -0.62% 0.31% -0.21% -0.86% -0.16% -0.31%
EUR 0.96% 0.36% 1.25% 0.75% -0.03% 0.80% 0.67%
GBP 0.62% -0.36% 1.15% 0.39% -0.39% 0.43% 0.31%
JPY -0.31% -1.25% -1.15% -0.49% -1.23% -0.46% -0.63%
CAD 0.21% -0.75% -0.39% 0.49% -0.71% 0.05% -0.07%
AUD 0.86% 0.03% 0.39% 1.23% 0.71% 0.82% 0.70%
NZD 0.16% -0.80% -0.43% 0.46% -0.05% -0.82% -0.12%
CHF 0.31% -0.67% -0.31% 0.63% 0.07% -0.70% 0.12%

The heat map shows percentage changes of major currencies against each other. The base currency is picked from the left column, while the quote currency is picked from the top row. For example, if you pick the Euro from the left column and move along the horizontal line to the US Dollar, the percentage change displayed in the box will represent EUR (base)/USD (quote).

In the American session on Tuesday, the US Dollar (USD) came under renewed selling pressure and opened the door for a leg higher in EUR/USD. The improving risk mood, as reflected by rallying equity indexes in the US, and an extended decline in the US Treasury bond yields made it difficult for the USD to find demand.

In the second half of the day, the US Bureau of Labor Statistics will release the Consumer Price Index (CPI) data for July. On a yearly basis, the CPI is forecast to rise 2.9%, down from the 3% increase recorded in June, while the core CPI is seen rising 3.2% in the same period. On a monthly basis, the CPI and the core CPI are both expected to increase 0.2%.

In case the monthlyl core CPI, which excludes prices of volatile items and doesn’t get distorted by base effects, rises at a sronger pace than expected, the immediate reaction could trigger a USD recovery and weigh on EUR/USD. On the other hand, the pair could look to stretch higher if the monthly core CPI comes in below the market estimate.

EUR/USD Technical Analysis

The Relative Strength Index (RSI) indicator on the 4-hour chart climbed to 80 early Wednesday, reflecting overbought conditions. On the upside, 1.1060 (static level) could be seen as next resistance before 1.1100 (psychological level, static level).

In case EUR/USD stages a technical correction and flips 1.1000 back into resistance, supports align at 1.0960 (static level), 1.0940 (static level) and 1.0900 (psychological level, static level).

Mexican Peso appreciates against counterparts hit by weak data

Mexican Peso appreciates against counterparts hit by weak data

The Mexican Peso (MXN) is trading between a third and half of a percent higher in its key trading pairs on Wednesday, as firmer risk appetite supports emerging market FX.

Investor spirits lifted after lower US factory-gate inflation led to a rally in US stocks on Tuesday. Across the pond in the UK, inflation data on Wednesday morning reveals that prices grew less than expected. This is weighing on the Pound Sterling (GBP), with GBP/MXN down 0.50% at the time of publication.

At the time of writing, one US Dollar (USD) buys 18.92 Mexican Pesos, EUR/MXN trades at 20.86, and GBP/MXN at 24.31.

Mexican Peso trades higher as key counterparts fall on data

The Mexican Peso trades higher in its most traded pairs on Wednesday, supported by an overall risk-on mood in financial markets. Tuesday’s US Producer Price Index (PPI) data showed factory-gate prices easing overall, solidifying expectations of the Federal Reserve (Fed) entering a new era of rate-cutting in September. With US borrowing costs expected to fall, US stock indices rallied, helping risk-sensitive emerging market FX like the Peso.

The Mexican Peso is performing particularly well against the Pound on Wednesday as GBP weakens following the release of mostly lower-than-expected UK inflation data. The data increases the probability of the Bank of England (BoE) cutting interest rates, which is negative for GBP since that will likely lower foreign capital inflows. The UK Consumer Price Index (CPI) fell 0.2% in July on month after gaining 0.1% in June. It came out at 2.2% year-over-year, undershooting expectations of 2.3% but higher than the 2.0% registered in June.

UK PPI was mixed, and the Retail Price Index was lower month-over-month (0.1% versus 0.2% previously) but higher YoY at 3.6% versus the 2.9% previously.

EUR/MXN shrugged off Eurozone data which showed preliminary Gross Domestic Product (GDP) data for Q2 meeting expectations, Employment Change (Q2) likewise in line with forecasts and Industrial Production undershooting expectations in June.

During the US session the US Bureau of Labor Statistics will release US CPI for July, which could impact USD/MXN and other key Peso pairs.

Banxico to adopt gradual approach to cutting interest rates – Capital Economics

The Banxico has cut its main policy interest rate twice in 2024, once by 0.25% in March and by 0.25% in August, bringing the Banxico policy rate down to 10.75%.

The August cut came as a surprise as headline inflation remained elevated at 5.57%, but according to the Banxico Governor, Victoria Rodriguez Ceja, the decision was based on the expectation that headline inflation would come down eventually. Core prices in Mexico are much lower at 4.05% in July, its eighteenth straight month of declines.

“We expect these effects of the shocks that we observe in non-core inflation to be transitory, so we are still expecting headline inflation to return to its target at the same time, at the end of 2025,” said Rodriguez Ceja in an interview with El Financiero.

Economists at Capital Economics, however, argue that inflation in Mexico will fall only gradually because of stubbornly high dwelling inflation. This is due to a combination of lack of housing stock supply and continued rising household income.

“Housing inflation has become an increasingly important driver of core services inflation in Mexico – a key concern of the central bank, Banxico. And we think that robust household income growth and a lack of supply of dwellings will keep housing and, by extension, headline inflation higher than most expect in the next couple of years. This supports our view that Banxico’s easing cycle will be very gradual and that interest rates will stay high by past standards,” says Kimberley Sperrfechter, Emerging Markets Economist at Capital Economics.

A more gradual approach to cutting interest rates would probably keep them higher in Mexico compared to counterparts. This would support the Mexican Peso, since it will favor foreign capital inflows into the currency, given it offers higher interest rate returns to investors.

Technical Analysis: USD/MXN unfolds weak correction higher

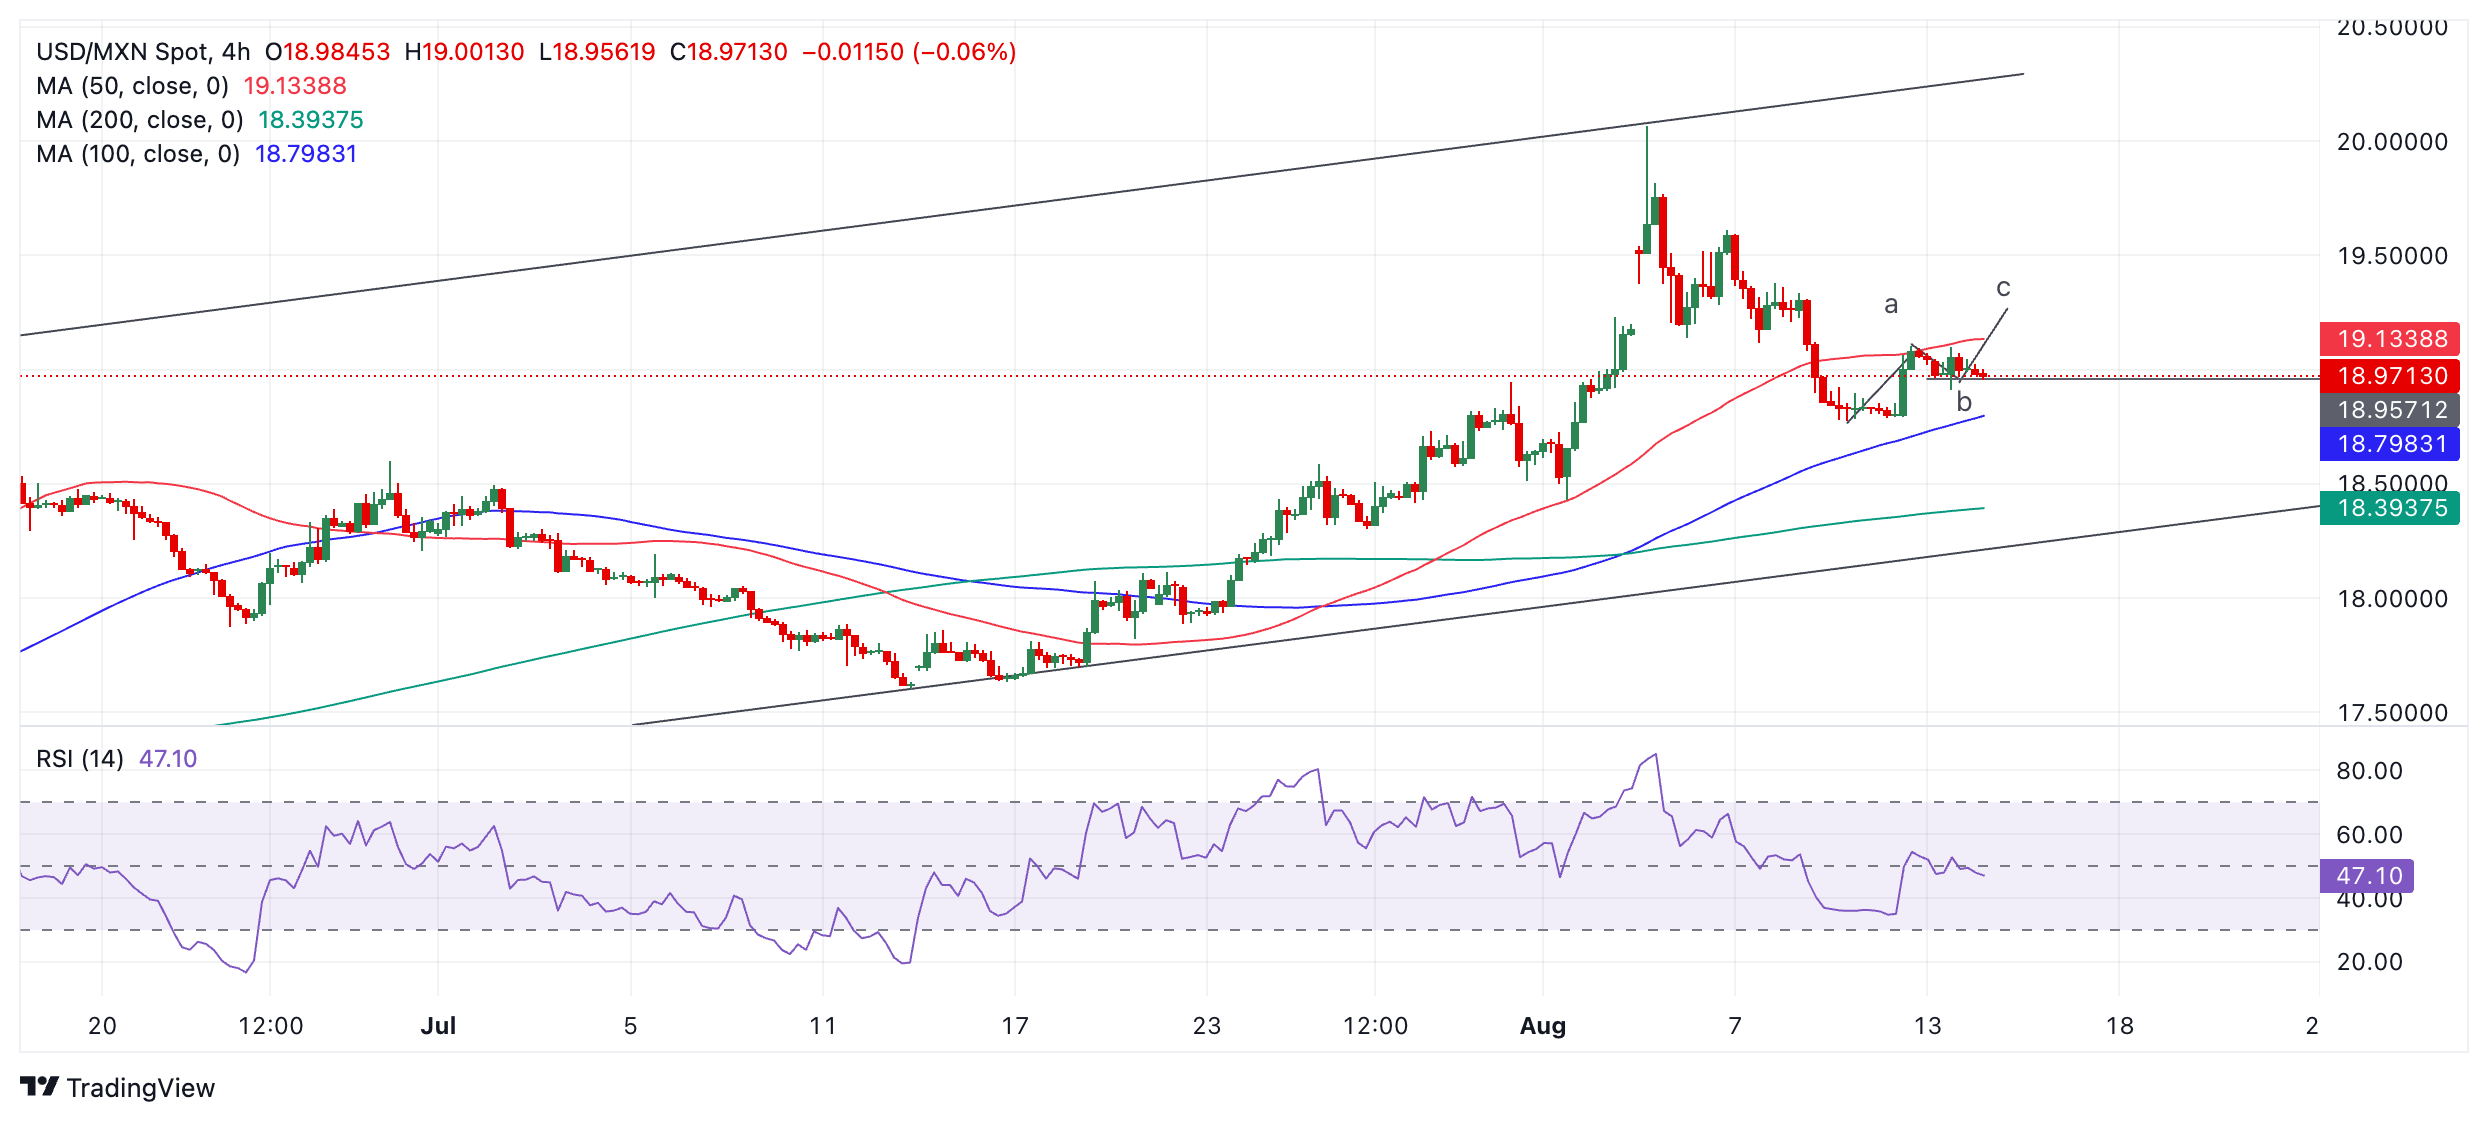
USD/MXN is broadly rising in a channel. Since the August 5 peak of 20.07 it has been unfolding a down wave within the rising channel. That down leg bottomed at 18.77 on August 9. Since then the pair has been correcting higher.

USD/MXN 4-hour Chart

The pullback from the August 9 lows looks corrective in nature and therefore unlikely to endure. It has failed, so far, to stretch a final, third, “c” leg higher to complete an ABC correction that might have been forming. Further, the decline from the top of the channel looks unfinished.

In the event of a resumption of the down leg it will probably reach the lower channel line at around 18.30. A break back below 18.97 (lows of wave “b”) would provide added confirmation of such a resumption, as would a break below the 18.77, the swing low from August 9.

Such a break lower would probably first target 18.35 and the 200-period Simple Moving Average (SMA). In addition, the lower channel line will likely provide solid support at roughly 18.30.