Are you about to take your first steps in trading but haven’t chosen a strategy yet? Do you want to learn about different types of Forex trading systems for beginners and professionals? This review will look at different types of systems to base your own trading strategy on. Each block discusses the essence of the strategy with an example, entry / exit points and the risk level.
The article covers the following subjects:
What is Trading Strategy in Forex
A trading strategy on the Forex market is an algorithm that allows you to achieve your goal as quickly as possible with an optimal level of risk. The goal is usually to obtain a certain percentage of profit.
The trading system answers the following questions:
- What is the goal and how quickly should it be achieved? Based on this, the type of strategy is selected in accordance with the timing, frequency of signals and the risk level.
- What are the main trading assets? What is their volatility level?
- Which timeframe is selected for analysis, and which one is used for trading?
- What tools are used to search for a signal? Is fundamental, technical or graphical analysis used? Which instruments give the main signal, which ones provide an additional one?
- What combination of signals constitutes a сue to place a market or pending order, and to exit the Forex market?
- What are the risk management rules? How is the volume of the first trade calculated, as well as the volume of subsequent trades in case of profit or loss? How are the stop loss and take profit level calculated? What is the maximum allowable total loss?
- What is the algorithm in case of unforeseen situations?
Having a trading plan allows you to quickly respond to any changes. The absence of a strategy equals chaotic actions and wasted time.
How Trading Strategies actually work
How Forex trading strategies work:
- You have a strategy, which means you know which actions need to be taken in each case in order to maximize profit or minimize potential loss.
- When you have a plan, you understand the end goal. You break it down into several stages and check the efficiency of the strategy at each stage. If you notice that the plan is not working out, rebuild the trading system.
- A systematic approach gives you confidence in your actions. If you have a working strategy, you can turn it into an automatic trading system by ordering a trading advisor.
Having a trading strategy also has an emotional aspect. When you have a plan, you clearly follow it without succumbing to emotions. For example, the price went the other way after you opened the trade, but your plan provides for an acceptable loss. So you don’t have to close the trade in a panic. No waiting until the last minute in the hope that the price will turn around – you will just calmly follow your strategy.
Basic Forex Trading Strategies for Beginners
Forex trading strategies for beginners are trading systems that have the following characteristics:
- Few indicators. The chart should not be oversaturated so it’s not confusing to the trader.
- Large timeframes. Timeframes from H1 are easier to navigate as you have more time for analysis.
- Minimal risk. Rare signals with relatively small profits, but a high percentage of triggering.
- Accurate interpretation of signals.
All the profitable strategies described below are basic versions. They need to be finalized and indicator parameters need to be adjusted for a specific asset and timeframe.
Positional Trading
Positional trading is a long-term strategy. It is based on the wave theory, according to which the market develops in a cyclical fashion: any growth is followed by a recession. A trader makes a long-term position, taking as much profit as possible from a single wave of price growth or decline, while ignoring local countertrend corrections. The position is closed when the price reverses or goes flat.
Strategy description
Cryptocurrencies and stock assets are best suited for position trading. Currency pairs move in a narrow corridor, while cryptocurrencies and stock assets do not have a growth ceiling and have protracted trends. Timeframes: from H4 and above.
Risk level
Medium. The main risk is stop out. On long timeframes, the cost of a pip is much higher than on minute intervals. Therefore, even a small correction can cost you. The trader must have sufficient margin to sustain the drawdown.
Reward ratio
Profitability of long-term investment – 15-50% per annum.
Length of trade
Long term trading. Trades are kept in the market from several days to several weeks or months.
Entry/exit point
The two best scenarios for entering the market are opening a trade at the moment the market exits a flat or on a fundamental driver. For example, after the release of quarterly or annual reports. Good indicators for determining the trend are the Alligator, ADX, moving averages. Exit the market according to the situation.
Example
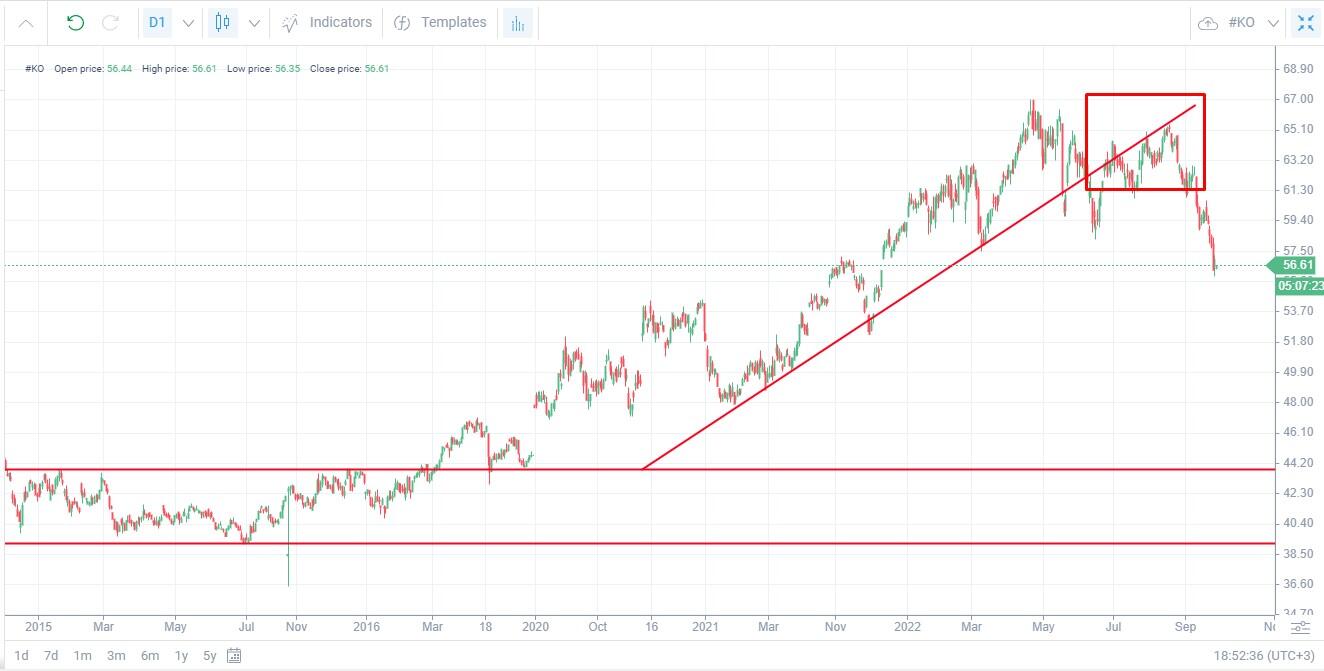
Long-term positional trading in shares. Before opening a trade, you need to analyze statistics for individual industries. Explosive growth is recorded in biotech companies, but there is a big risk of falling prices. Technology stocks are doing well, but they have deep drawdowns during general market decline. Retail and consumer stocks are the best option for positional trading.
The screenshot above shows the long-term trend in the price of Coca-Cola shares. After exiting the flat corridor, the share price went up. The duration of local corrections is 1 month. The trade is closed at the moment of consolidation near the trend line and at the moment when it turns from support into resistance. Profitability in 9 months – 12 USD per share or 23% per annum.
Pros and cons
The advantage of positional trading is that in the long term, strong movements are longer and more stable. Market makers do not have enough capital to manipulate the market. After catching a trend at the exit from a flat or on a fundamental factor, you can keep a position in the market with little or no monitoring. On the daily interval, it is enough to check the chart for 5-7 minutes every few hours. Disadvantages: rare signals, lower returns compared to intraday swing systems.
Trend Breakdown Strategy
Breakdown trading is a simple Forex strategy, in which the main signal is a breakdown of a trendline. A bullish trendline is drawn using the lows, while a bearish trendline is drawn using the highs. A breakdown confirmed by patterns and news is a sign of a change in the main direction of price movement.
Strategy description
The strategy is based on the idea of wave market development. Any long-term trend ends with a consolidation or a change in direction. If the price breaks the trend line and bounces back from it after a slight consolidation, there is a trend reversal. This is a medium-term strategy, the best timeframe is H1-H4.
Risk level
Below medium. There is a risk of a false breakout, so it is important to track additional signals.
Reward ratio
Depends on the duration of the trend. On the hourly interval, the yield in 1-2 days can be 100-150 points. Protracted trends can generate an income of 300-400 points.
Length of trade
Signals are relatively rare – on an hourly interval, a signal can appear once in 1-2 weeks. The length of trade is from 12-15 hours to several days, so you need to take into account the fact that single and triple swaps will be charged.
Entry/exit point
The next candle in the new trend direction after the candle that breaks the trend. The presence of consolidation near the trend line indicates that a temporary equilibrium has been established on the Fx market. For example, in an uptrend, buyers are not ready to buy the asset that has risen in price. The majority see that the trend has stopped and start selling the asset at the high, so the price begins to fall. Confirmation signals: formation of reversal patterns, breakdown of key resistance/support levels.
Example
The objective is to build a trend line and wait for its breakdown after getting confirmation from other instruments. Here it is important to distinguish a false corrective breakout from a change in the trend direction.
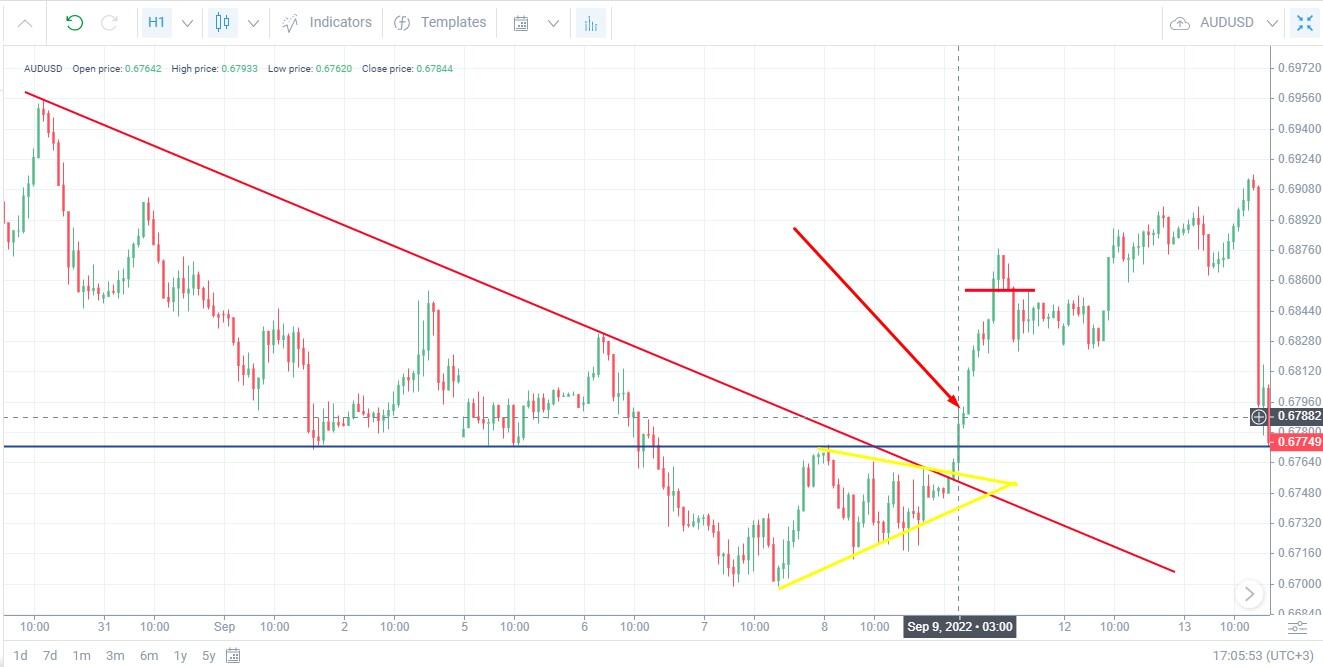
A strong downtrend is visible on the hourly interval of the AUD/USD pair, which allows us to draw a trend line. The line is drawn based on the high extremes in order to reduce the likelihood of a false breakout (if a breakout occurs, the trend line moves). The screenshot shows that the line is built using the first and fourth highs.
At the end of a trend, volatility increases and the price goes into a temporary correction. We can see the formation of the triangle pattern, the initial range decreases. The sides of the triangle are only occasionally broken down by shadows, which indicates the weakness of sellers – this is a preliminary signal. A relatively clear horizontal resistance level is also present.
The price breaks the upper side of the triangle, then the trend line. As soon as the price breaks through the resistance level (triple confirmation), we open a trade on the next candle. We close the trade after the appearance of two reversal candles in a row (forming the Three Black Crows pattern). Profit with minimal risk is 70 points.
Pros and cons
Suitable for beginner traders who have basic pattern trading skills and know how to build trend lines correctly. Its advantage is that there is time for analysis on long timeframes, a late entry after a trend breakout is not a mistake. The disadvantage is that the new trend may turn out to be a deep correction, so it is advisable to check the chart at least once an hour.
Swing Trading
Swing trading is a Forex trading strategy that involves earning on rollbacks. It is based on the idea that local corrections can be applied to maximize profits. This method of trading is focused on the use of rollback moments (corrective movements) that occur during the formation of a trend.
Strategy description
One of the trading options for this system is to open a trade at the end of the correction and close it at the start of a new correction. The optimal timeframe is from H1-H4. On short intervals, the trend is less stable, so it is less often used in swing trading.
Risk level
Medium. If a strong trend is found, the risk of loss is relatively small, you need to close positions in time at the beginning of a rollback. But the trend is not always stable, the signal construed as the resumption of the trend may turn out to be false, and the correction will continue.
Reward ratio
Depending on the type of swing trading strategy and time frame. On the hourly interval, when trading along the trend, the profitability per trade is 80-100 points.
Length of trade
Swing trading can be used both in intraday strategies and in long-term ones, depending on the chosen timeframe. On the H1 interval, you can catch corrective movements with a depth of 5-7 candles and earn intraday. On intervals from H4, swing trading turns into a long-term trading strategy with trade length of several days.
Entry/exit point
There is an uptrend in the markets, in which downward corrections appear. A trader can use them in the following ways:
- Open a trade at the end of the correction in the direction of the trend. For example, you missed the beginning of the trend and you need to find an entry point at the best price.
- Open a trade at the bottom of the correction in the direction of the trend, close at the extremum. Wait for the next correction, open a trade again at the bottom of the correction.
- Increase the volume of the position at the end of each correction.
- Alternate reversing the trade in the direction of the trend and in the direction of correction.
Closing the trade: 50% at the level of the beginning of the correction (return to the last extremum), the remaining 50% – by trailing stop.
Indicators: trend tools with confirming oscillators to find the trend. Reversal patterns, resistance and support levels, Fibonacci levels.
Example
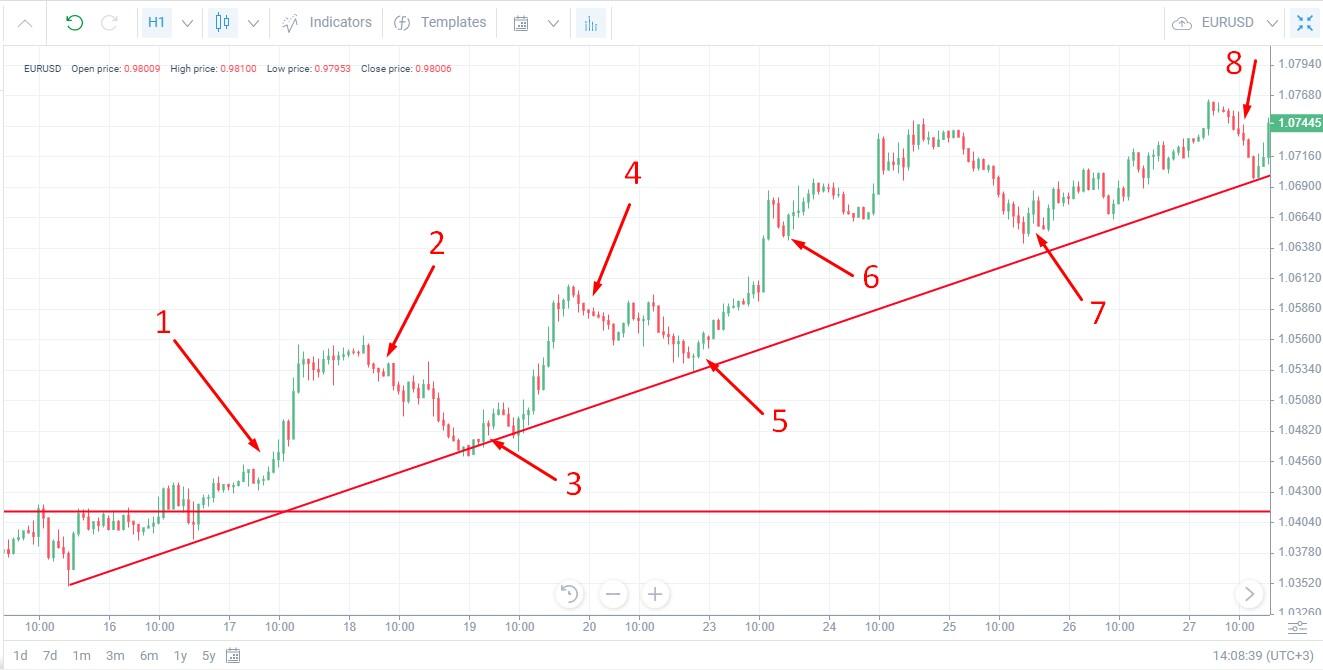
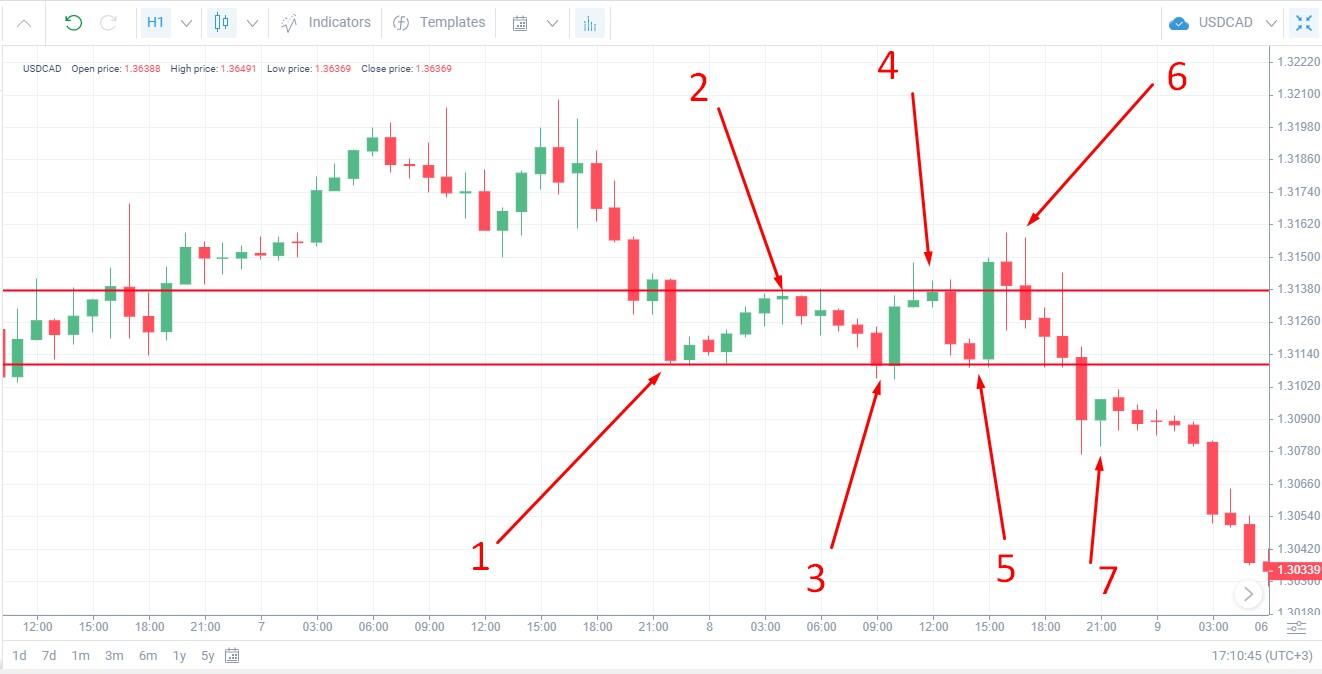
The objective is to find a trend on an hourly interval. In the chart below, there is a horizontal resistance level after a downtrend.
1 – After the breakdown of the resistance and a rebound from it, a series of growing candles appears. This is the beginning of a trend, open a long position.
2 – The first strong reversal – three candles down in a row – close the trade.
3 – The price reverses up, allowing you to draw a trend line. Open a long position.
4 – Three candles down – close the trade.
5 – Rebound from the trend line and a few candles up – open a long position.
6 – Three candles down – close the trade. Despite the fact that there was no correction, it is better not to take risks – wait for the next rollback.
7 – The price does not reach the trend line, but there is a reversal pattern – you can risk opening a trade (weak signal).
8 – Three candles down – close the trade.
The profitability of each trade is 80-100 points, but you need to take swap into account.
Pros and cons
Forex strategy advantages:
- More profitability. Unlike the trend strategy, a trader earns more in swing trading. For example, a trend trader earns 100 pips upon closing a trade. A swing trader makes 50 pips on the trend and closes the trade at the start of the correction. The price rolls back 15 pips, the swing trader opens the trade again. Their income is 50 + 65 = 115 points.
- Less risk. A position trader waits out the correction and protects the trade with a stop order. If the stop loss is triggered, the loss is equal to the depth of correction. A swing trader closes the trade at the start of the correction. And if the rollback turns into a new trend, the swing trader loses nothing.
The disadvantage of the strategy is that you need to constantly monitor the chart and be able to find the beginning and end of the correction well. Corrections are not always ideal in form and can turn into a flat.
Trend Trading
Trend trading involves opening a trade at the beginning of a trend movement and closing it at the reversal. The trader’s objective is to find the beginning of the trend and avoid mistaking the correction for a reversal and closing the position too soon.
Strategy description
One of the best strategies for trading on the Forex market is to open a position when the price exits a flat or during a trend reversal. Timeframe – from H1. The strategy is well suited for both intraday trading on the foreign exchange market and positional trading on the stock markets.
Risk level
Below medium. The main risk is the late opening of the position. Novice traders can miss the start of the trend and enter the market when it has mostly exhausted itself. If you regularly monitor the chart, set stop loss and take profit, the risk is minimal.
Reward ratio
Depends on the chosen timeframe and risk appetite. On the hourly interval, you can find a trend longer than 24-48 hours. With a daily asset volatility of 80-100 points, you can find a trend with a length of 50 points or more.
Length of trade
Depending on the timeframe. On the interval H4 and above, the strategy turns becomes a medium-term one. Monitor the chart regularly in order to search for a trend reversal.
Entry/exit point
Entry:
- Trend with signs of its upcoming ending: the candlesticks become smaller, there is a transition to a flat. The appearance of a reversal pattern and the breakdown of the trend line in the opposite direction is a signal to open a trade.
- The moment of the price exiting the flat is signalled by the breakdown of its borders and the appearance of candlesticks with consistently growing bodies.
- Get signals from trend indicators and oscillators: Alligator, moving averages, Momentum.
Exit the market in parts. After the price moves in the predicted direction, move stop loss to the breakeven level. Close 50% of the trade when the price passes the predetermined number of points. For example, you are 99% sure that the price will definitely not reverse before it moves by 20 pips – this will be the first target. Insure the remaining 50% of the trade by a 10-15 pips trailing stop, depending on the depth of the average correction.
Example
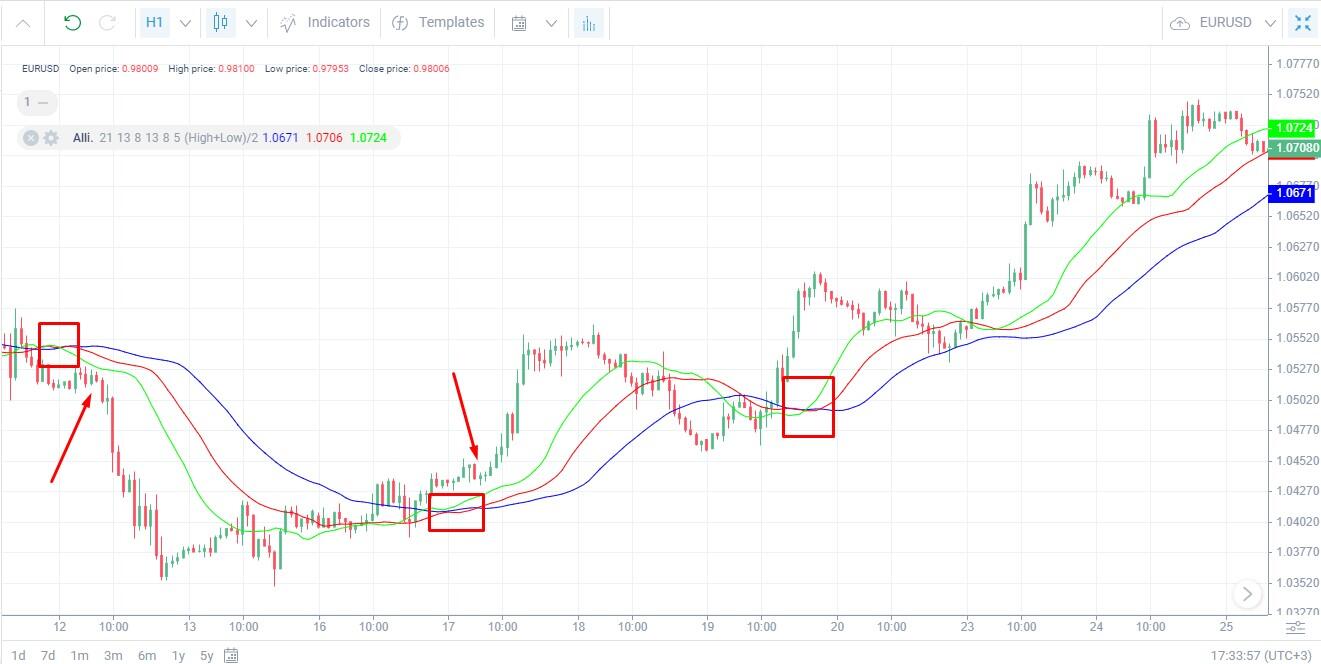
We open a position based on the signals of the Alligator indicator.
The signal is the divergence of moving averages. In two cases, the signals turned out to be correct, however in the third case, the signal shows the beginning of a long upward movement, but the entry point has not been determined, since the divergence of the moving averages begins on a rollback. Therefore, it is better to filter the indicator signals with additional tools.
Pros and cons
The advantage is that it’s a good strategy for beginners. On long timeframes, the trend is relatively stable, the investor has time to assess the situation, there is no need to constantly monitor the chart. After 50% of the trade has been closed, you don’t have to monitor the chart anymore. It is also possible to earn on individual small trend movements, as shown in the example above. The disadvantage is relatively rare signals. On the Forex market, strong trends appear infrequently, especially on large intervals.
Range Trading
Range trading includes flat trading and channel trading strategies on the Forex market. They are based on the following idea: mostly the price moves in a fixed corridor with a median, which can be represented by a moving average. The price tends to its average value. The further the price moves away from its average value, the more likely it is to reverse.
Strategy description
This strategy has two trading options:
- Breakdown trading: the channel is built based on the points where the price reverses most often. If the border is broken down, a trade should be opened in the direction of the breakdown.
- Channel trading: the channel is built based on extremums – the points that the price reached and did not break through. A trade should be opened when the price reverses at the border to the middle of the channel.
Risk level
Medium. There is risk of a false breakdown of the channel, as well as the risk of the price continuing to move towards the breakdown of the channel after a trade has been opened.
Reward ratio
Depending on the timeframe. Within a day, the price can give 1-2 signals of 20-30 points each.
Length of trade
The strategy works on intervals from M30 for intraday, medium and long-term strategies. It is not suitable for scalping, since the price has a high impulse movement on minute intervals, which violates the logic of averaging.
Entry/exit point
Options:
- High risk. Open a trade after the price exits the channel. Breakdown indicates a strong inertial movement. Close the trade at the slightest signal of a reversal.
- Moderate risk. Open a trade after the border of the channel has been broken and the price reverses towards its middle. Close when the price reaches the median line of the channel.
Main technical tools:
- Levels, trend lines that define the boundaries of inclined or horizontal channels.
- Channel patterns: rectangle, rails, flag, etc.
- Channel indicators: Bollinger Bands, Envelopes, Keltner Channel, Darvas Box.
- Reversal indicators: Pivot points, heat map.
- Overbought and oversold oscillators: Stochastic, MACD, RSI, CCI.
Example
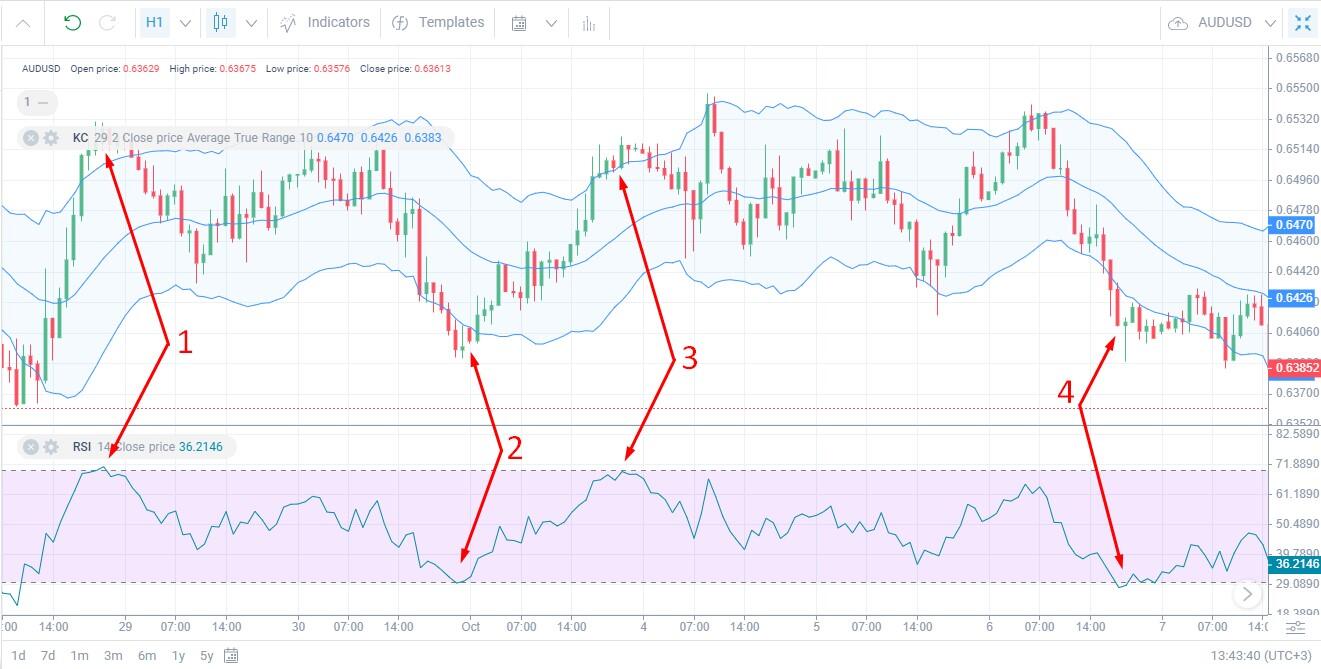
The main indicator is the Keltner Channel with an expansion multiplier of 2. This multiplier value expands the channel, allowing you to find points that the price reaches relatively rarely, and therefore a reversal to them is most likely. The confirming tool is the RSI oscillator.
The signal is the price going beyond the channel and reversing. At this or the next candle, the RSI should touch the 70 or 30 level. If it doesn’t, don’t open the position. Close 50% of the position volume upon the price reaching the middle line of the channel. The other 50% should be insured by a trailing stop 10-15 points long (for the H1 timeframe).
- 1 – three strong candles from the middle of the channel indicate a strong impulse movement. Then the movement ends, and a reversal occurs. The RSI touches the 70 mark. Profitability is about 40 points.
- 2 – the price leaves the channel, reverses and returns to it. There are no reversal patterns, so the signal can be described as weak, but it is confirmed by the RSI. Profitability is about 30 points.
- 3 – the situation is similar to the previous one. Profitability is about 15 points.
- 4 – the situation is similar to the previous ones, but the signal turned out to be false.
Pay attention to reversal patterns outside the channels. If there are none, the signal is weak.
By changing the multiplier of the indicator, you can change the entering mechanics. For example, with a multiplier of “1”, you can open trades on the breakdown of the channel.
Pros and cons
This is a clear Forex trading strategy suitable for beginner traders. Disadvantage: it takes a long time to adjust the settings of the channel indicators that determine the channel width.
Day Trading
Day trading means opening and closing a position within a trading session to save on swap. You can carry the position overnight if you are confident in the strong trend and the ability to regularly monitor the chart.
Strategy description
Day trading is a strategy defined by the duration of the position in the market. For example, intraday trading includes scalping, swing trading, and trend strategies. The suitable timeframes are М5-Н1.
Risk level
Depends on the type of intraday trading chosen. Scalping has high risk, swing trading has medium risk, and trend strategies have below medium risk.
Reward ratio
In scalping, profitability per day can reach 100 points or more. The profitability of a trend trading strategy with an asset volatility of 70-100 points is 30-50 points.
Length of trade
Day trading refers to short-term strategies with the option of transitioning to medium term.
Entry/exit point
There are no clear rules. Scalping can use oscillators and patterns. Entry/exit points are at price reversal. In trend trading, use trend indicators that show the exit from a flat or a change in trend, as well as levels. Entry/exit points are breakdowns of key levels, signals from moving averages, etc.
Example
One of the options for intraday trading is to look for a strong signal for a trend reversal or exit from a flat, confirmed by graphic or fundamental analysis. You earn on the movement of 5-8 candles.
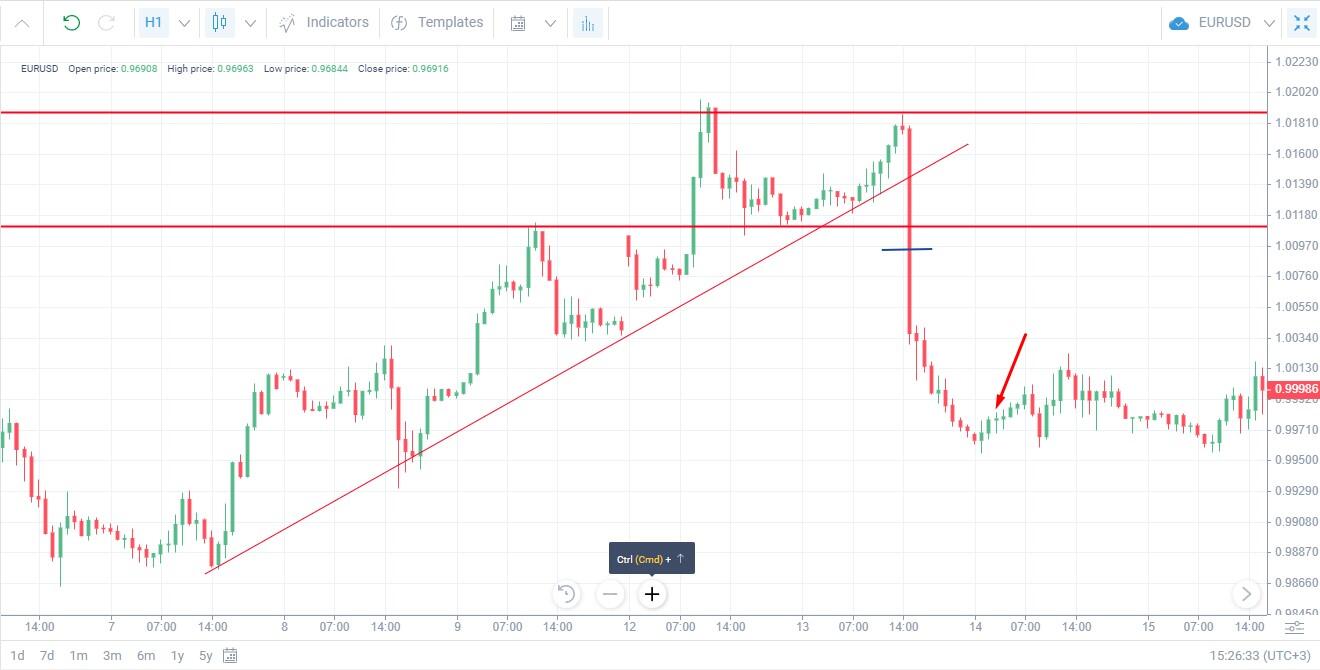
On the hourly interval of the EUR/USD currency pair, we can see a long uptrend, which should end sooner or later. We draw a trend line according to its corrections. At the top of the trend, a horizontal corridor with two tops forms. At 14:00, a small red candle appears, which means that the price cannot break through the resistance level. There is a balance of buyers and sellers, showing that the buyers are exhausted.
At 15.00 there is a strong candle down. It breaks the uptrend trend line – this is a preliminary signal. Then the price breaks the support level – this is a signal to open a short position. The big downward candlestick is also confirmed by a fundamental factor – the statistics on inflation in the US for August was announced, which coincided with the forecasts and remained at a high level (more than 8%). This means that the Fed will soon raise the discount rate, thus strengthening the USD.
We close the trade either before the time for the swap to be charged, or after the appearance of two consecutive reversal candles after the downtrend slows down. Profit with minimal risk with this Forex strategy was about 25 points.
Pros and cons
The advantage is that it’s suitable for any trading style from scalping to trading with the trend, against the trend or based on fundamental analysis. Also it saves on swap. The disadvantage is the constant need for monitoring the chart.
Retracement Trading
This strategy is a variant of swing trading, but it is built on a unique group of indicators – Fibonacci tools. There are corrections in any trend, and their depth often corresponds to the Golden Section ratios. There are correction levels that are more and less significant, and a breakdown of distant correction levels means a change in the direction of the trend. Also, Fibo correction levels are used to set stop loss and take profit.
Strategy description
After the start of the first correction, a Fibonacci grid is built beginning at the extremum and ending at the beginning of the trend. The level of 23.6% is the first, weak level. 38.2% is the level of the most likely end of the correction. If the price reverses in the direction of the trend, a trade with a take profit at the “0” point should be opened. If the price draws a new extremum, “0” is moved to its level.
Risk level
Medium. The level building method is mathematical, so there is always a chance that the price will reverse between the levels or will not reach the take profit.
Reward ratio
Depends on the timeframe. The distance between correction levels on the H1 timeframe can be 15-35 points.
Length of trade
The strategy is suitable for intraday medium and long-term trading.
Entry/exit point
The entry point is a price rebound from the correction level in the direction of the trend. Take profit should be set at the next level in the trend or point “0”. Stop loss is the next level in the direction of correction. Additional indicators are patterns and oscillators that confirm the reversal.
Example
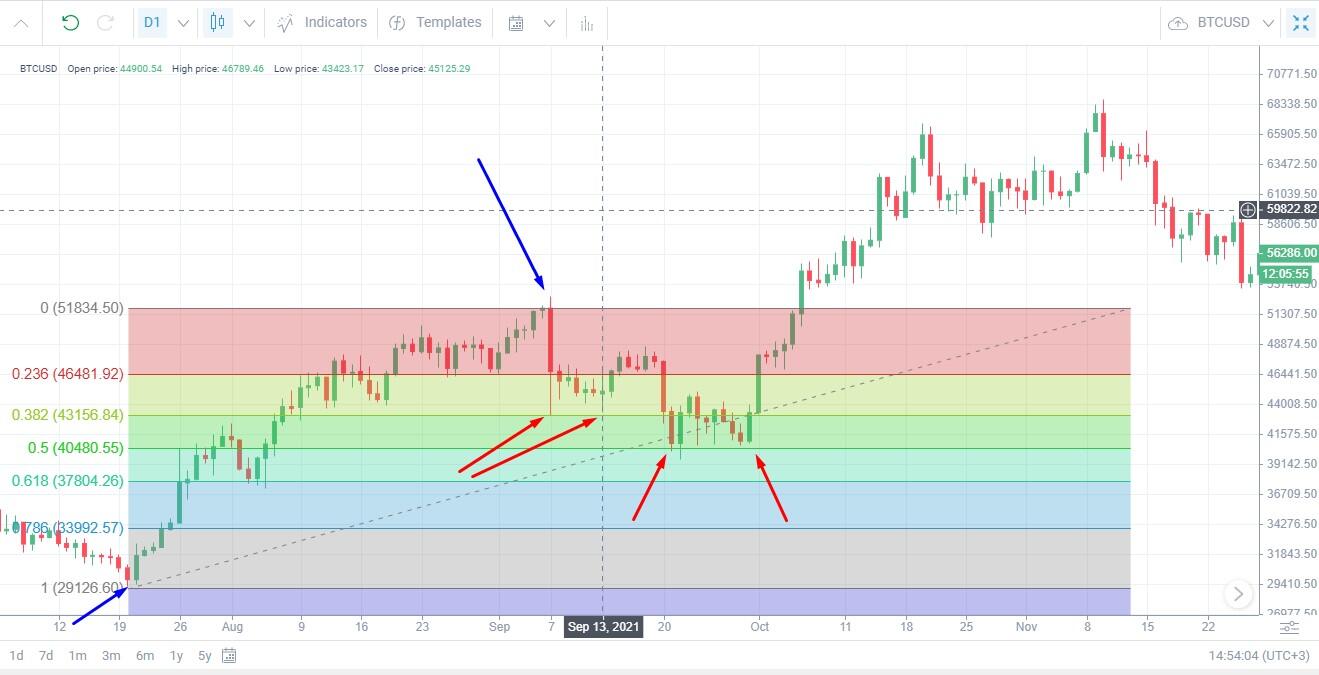
After the first correction, a Fibo grid is built (blue lines are the extremums for its building).
Correction is determined by the number of candles going against the trend. In the first case, there is no correction, since the level of 0.38 was only tested by a shadow, and subsequent movements near the level 0.23 consist of small candles. In the second situation, there is clear touching of the 0.5 level and an ascending Engulfing pattern – you can open a long position. The fact of the second touching of the level 0.5 is the confirmation of the signal. At level 0, we close 50% of the trade, and insure the remaining 50% with a trailing stop with the length equal to the distance between 0.23 and 0.
As the trend grows, we stretch the Fibo grid.
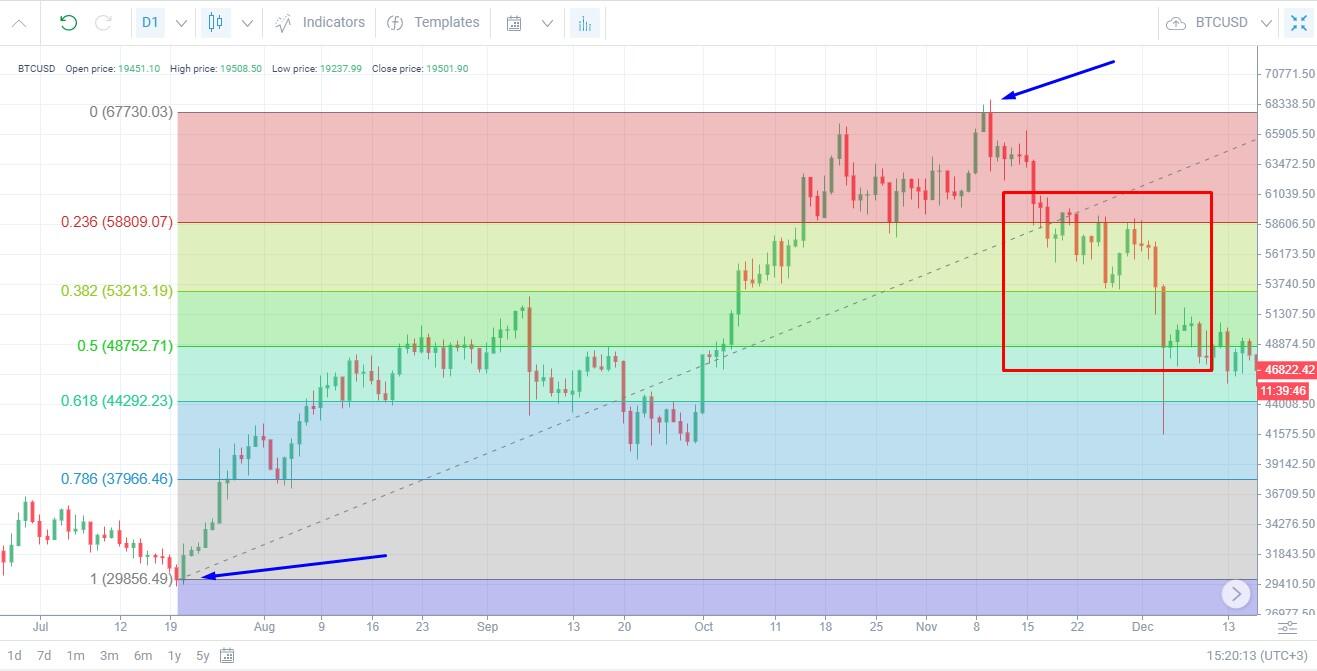
Note that the price moves between the 0.23 and 0.38 levels for some time. Then it goes to the level of 0.5, from which it rebounds upwards. Trades can be opened at any rebound from the levels of 0.23 and 0.38.
Pros and cons
The maths of this strategy is supported by opposite psychology. Most traders are sure that Fibo levels work, so they are guided by them when placing pending orders. Orders work, so the Fibo method also works. Therefore, the advantage is the understandable logic of the tool. The disadvantage is that you need to develop intuition in order to learn how to intuit the most powerful levels.
The Bladerunner Trade
This strategy is built on the basis of the moving average, which suggests the moment of the beginning of a trend movement. The system is great for beginners, as it provides a clear interpretation of the signals. The best timeframes are M30-H1. Strategy tools: EMA (20), levels, and breakout patterns.
Strategy description
The concept of the strategy is based on 4 main events:
- The exit from the consolidation zone is signalled by the breakdown of the border of the side channel by the price.
- Breakdown pattern. For example, 3 candles in the direction of the breakdown.
- Breakdown of the moving average. After the breakdown of the consolidation zone, the candle should close above/below the moving average. The rest of the candles should also close above/below the EMA (20).
- Testing. The price returns to the moving average, touches it, rebounds and goes in the direction of the trend.
The moment of EMA testing confirms the beginning of a strong trend.
Risk level
Relatively low. The strategy uses a combination of several instruments that confirm the exit from the flat and the beginning of the trend. Signals are rare but effective.
Reward ratio
From 30-50 points and above – the trade closes by trailing stop.
Length of trade
The objective is to make the most out of the trend. On M30-H1 timeframes, with relatively rare but accurate signals, you can close a trade intraday and save on swap.
Entry/exit point
Open a trade after the price has tested the moving average and a movement has started in the direction of the trend. Closing is at the discretion of the trader.
Example
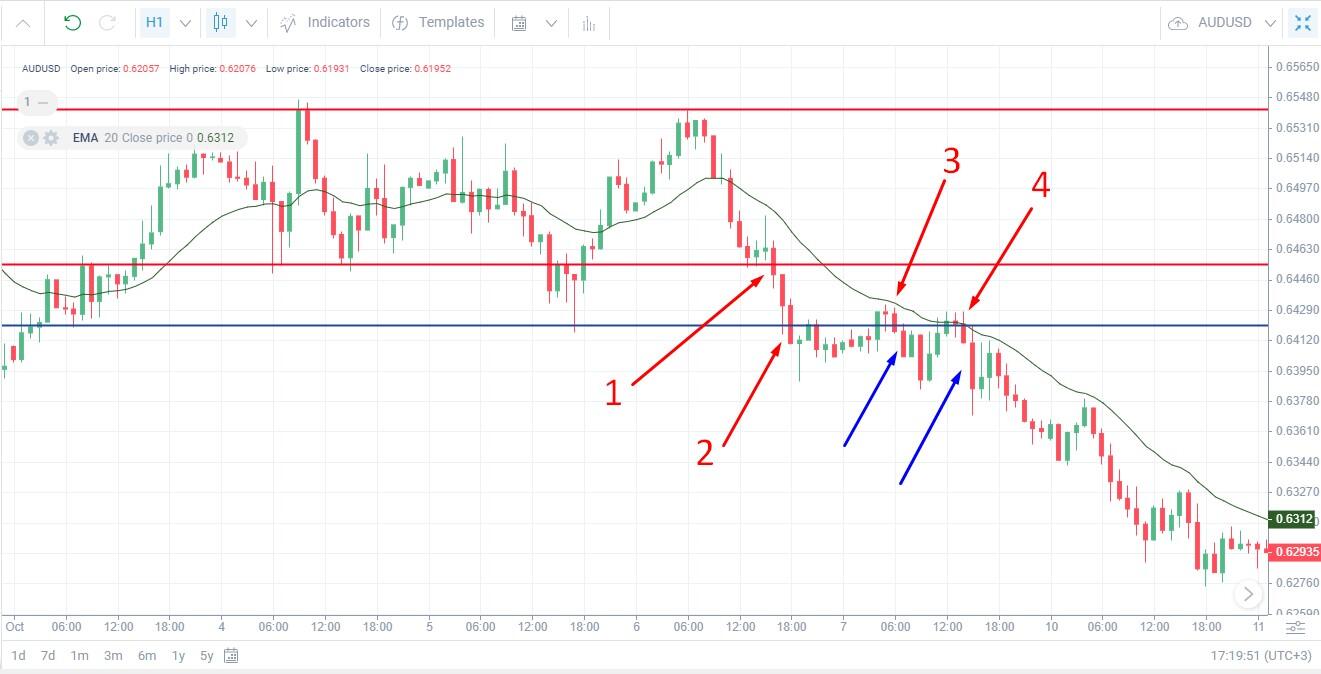
The price is in a sideways movement with a clear resistance level but blurred support levels. The first (red) support level has a false breakout – there is no testing of the EMA, the price breaks through it upward.
At the next breakdown, the first three conditions of the system are met:
- The price is below the EMA.
- There is an exit outside the horizontal corridor at point 1.
- There is a formed trend pattern at point 2 – three consecutive descending candles with a consistently increasing body.
At point 3, the price almost touched the EMA – this is the 4th, confirming signal. We can open a short position at the first blue arrow. Point 4 is the final confirmation that the price is now confidently touching the EMA, the touch point coincides with the traced support level, which has now turned into resistance. The second blue arrow points to a candle, after which you can open a short trade with confidence.
Options for closing the position:
- On the H1 interval, we close 50% of the trade after making a profit of 30-50 points, and insure the rest with a trailing stop of 15-20 points.
- When the next side corridor appears.
- When the price line crosses the EMA from the bottom up.
Pros and cons
The advantage of the strategy is in the clear logic of the signal. The breakdown of the consolidation zone with a trend pattern confirmed by the moving average is a strong signal. On the other hand, the Forex market is never unambiguous. Therefore, relying only on the EMA (20) without experimenting with other periods and without adding other indicators is dangerous. Therefore, I recommend using the idea of this strategy but adjusting it for the selected asset and timeframe.
The Pop ‘n’ Stop Trade
This is a classic tactic for opening trades at the end of a sideways movement with the appearance of a clear uptrend or downtrend. The price moves in a narrow sideways corridor for some time, after which it breaks through the resistance or support level, thus indicating the beginning of a trend.
Strategy description
A flat means the market is in a state of uncertainty. It can appear in a trend movement as a temporary respite with consequent continuation of the trend, for example, before the weekend or news release. Alternatively, it means that the trend has run out of steam and the other side will now take revenge. A breakout of the channel borders means the beginning of a trend, which is where a position should be opened. The strategy is suitable for beginners provided conservative risk management on timeframes from H1.
Risk level
Medium for the following reasons:
- The breakdown of the flat channel may be false. To confirm the signal, you can use the attempt of the price to return to the channel (breakout of the channel border, return to it and a rebound from it in the direction of the breakdown), trend indicators and oscillators.
- A flat corridor rarely has parallel boundaries and clear extrema for drawing. An error in choosing an extremum for drawing resistance/support levels can result in opening the trade too early or too late.
Reward ratio
With a strong trend, you can earn more than 50-70 points. But it is better to close a part of the trade after reaching a profit of 20-25 points.
Length of trade
From several hours to several days. The trend movement lasts at least 8-10 candles. You can close the trade early before the swap is charged, or try to squeeze the most out of the trend by insuring the trade with a trailing stop.
Entry/exit point
Preliminary chart: there is a sideways movement and significant resistance/support levels can be drawn. Shallow breakdowns of levels by shadows are allowed. Preliminary signal: the price breaks down the level and closes beyond it. The body of the candle is relatively large. The second candle continues the breakout and has the same body as the breakout candle. Open a position on the third candle.
To reduce risk, you can wait for a local correction and a price reversal in the direction of the trend (late entry). You can increase risk and open a trade on the next candle after the breakout (second candle). Early entry, but more profit. Closing the trade: 50% – after 30-40 points for the hourly timeframe, the other 50% should be insured with a trailing stop 15-20 points long or a little more than the depth of the average trend correction.
Example
First we need to find a flat section.
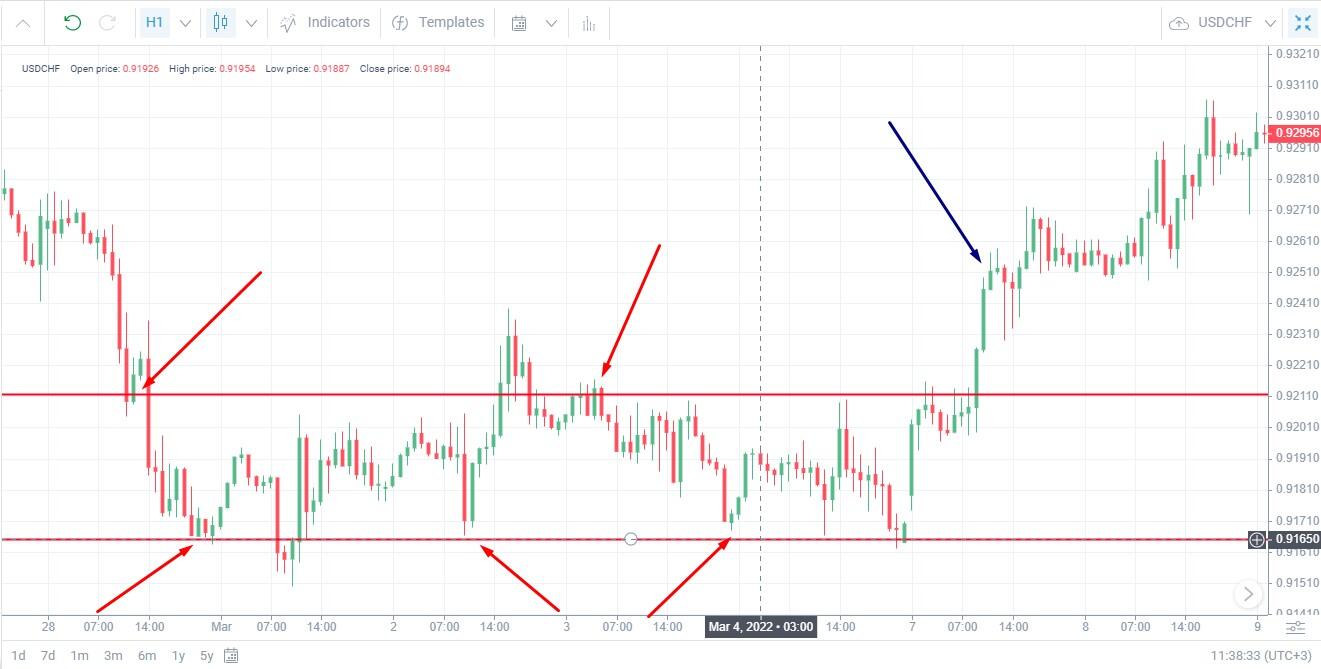
After a relatively small downward movement, the price turned into a sideways movement with high volatility. The support level can be drawn using the three points indicated by the arrows. The resistance level is less pronounced, but the chart shows that it is drawn correctly – after the levels were drawn, the price tested both boundaries of the channel several more times.
Signal for trend movement:
- The price touches the resistance, bounces off it, moves along it for a while. Sideways candles have small bodies, which indicates small trading volumes and a temporary lull.
- Price breaks through resistance. The breakdown candle has a large body and closes almost completely outside the level. Here you can open a trade. But the example of a false breakdown in the middle of a flat section shows that even two growing candles in a row do not guarantee a trend.
- The third candle after the breakdown is an upward one. The price is above the EMA (9), which is a confirming signal. You can open a long position.
Please note that after the position was opened, two red candles with long downward shadows appeared. If the stop loss is short, the trade could close early with a loss.
Pros and cons
The advantage is the clear logic of the strategy and behavior of traders. The disadvantage is false breakouts and a trend reversal almost immediately after it starts. Building levels is quite complicated. This is clear in the local breakouts in the chart above.
Advanced Forex Trading Strategies for Pros
This section discusses Forex strategies for traders who are familiar with the basics of technical and fundamental analysis and also looking for options to grow their profit. These systems have a few common characteristics:
- Increased risk level. However, more frequent signals allow you to increase the average monthly profitability of the strategy.
- More complex combinations of instruments that require attention and quick response.
- Less unambiguous interpretations of signals, providing flexibility to the trading system. Entering the market based on less clear signals is at the discretion of the trader, but this approach allows you to open trade “ahead of the curve” and increase profits.
Before launching a trading system, be sure to run it through a strategy tester.
News Trading
This group of trading systems is based on fundamental analysis. The release of statistical data can dramatically affect the opinion of investors. For example, the publication of positive financial statements that fully meet the expectations of traders leads to an increase in the value of the company’s shares.
Strategy description
The main tool is the economic calendar that contains the schedule of releases of financial statements. If the statistics turn out to be better than the forecast, the price of the asset rises, and if they are worse than expected, it falls, even if the statistics are positive. A few minutes before the news release, pending orders are placed in both directions. The trade is closed after the end of the movement at the first signal for a reversal.
Risk level
The strategy is considered high-risk for several reasons:
- It is not always possible to accurately predict the reaction of the majority. Before choosing the direction of movement, the price may pass several candles in both directions, triggering stop losses or false pending orders.
- Due to high volatility, the spread increases sharply and slippage occurs. The reason is the change in the ratio of buy or sell orders.
- The trader must have access to information in real time. Many portals publish statistics with a delay of 10-15 minutes.
Novice traders are advised to stop trading 30 minutes before the release of news and not resume it for 30 minutes after the release of statistics.
Reward ratio
Depending on the depth of movement and its duration. On average, the yield can be 30-50-80 points in 1-4 hours.
Length of trade
News related to economic statistics has a short-term impact on the market. Increased volatility is observed in the first few hours – this is 3-5 candles on the H1 interval. Occasionally, news can set a long-term downtrend. Example: a negative forecast for global GDP during the pandemic led to a long-term drop in the US stock indices.
Entry/exit point
The main tool is any online source of reliable information. Indicators play a secondary role, as the news can easily reverse the price against the trend.
Example
Let’s look at Non-Farm Payrolls. The US Employment Report is published every first Friday of the month. If the actual figure is very different from the forecast, the USD/EUR rate goes up or down.
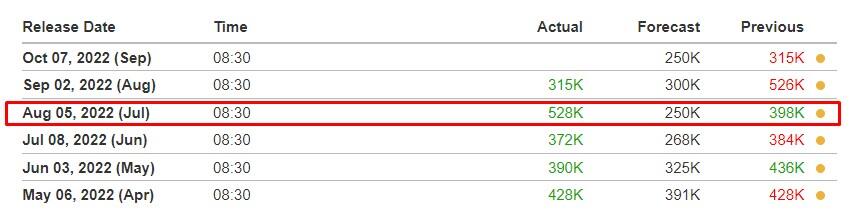
1. First let’s analyze the economic calendar:
According to the report on July 8, the increase in the number of jobs amounted to 372K, after which this figure was revised upward to 398K. Analysts predicted a decline in growth rates from 398K to 250K. But the actual figure turned out to be 528K. This means that the pessimistic forecast of analysts did not come true – the US economy showed growth.
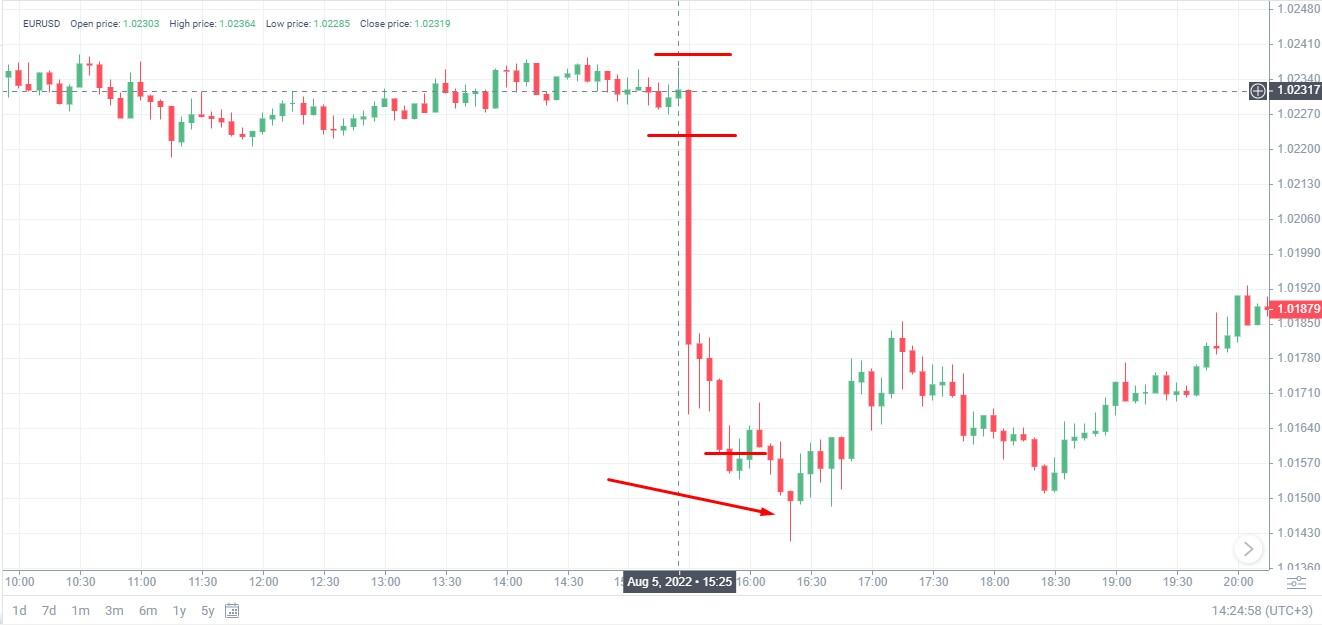
2. 5 minutes before the publication of the report on August 5 (at 15.25 Moscow time), we set pending buy/sell stop orders on the M5 timeframe at a distance of 5-7 points in 4-digit quotes. Based on the fact that if there is a strong discrepancy between the forecast and the actual figure, one of the pending orders will work.
Positive statistics immediately leads to a strengthening of the dollar, which means a fall in the EUR/USD rate – a Sell Stop order is triggered. We close the trade when the first reversal candle appears or when a reversal pattern appears (in this case, a pin bar). Profit – about 70 points in 40 minutes.
Pros and cons
Advantage – you don’t have to use technical analysis, which can be complicated for beginners. The disadvantage is that you need to be aware of the news all the time and understand which news can have the strongest impact.
Scalp Trading (Scalping)
Scalping is a high-frequency trading strategy that involves opening trades with a profitability of several points. Assets with high volatility and liquidity are best suited for scalping. The trader’s objective is to make the most of the short-term price movement, closing or reversing the position at the first signal. Therefore, the best account type for scalping is ECN, where spreads are close to zero and there is no slippage due to high liquidity.
Strategy description
The most popular timeframes for scalping are M5-M15, less often M1. Trades are kept in the market for 15-30 minutes, rarely up to several hours. If there is a clear trend, scalping can smoothly turn into intraday trading. During the day, scalpers open several dozen trades, simultaneously monitoring the charts of several assets that have a clear direct or inverse correlation.
Risk level
High. The main risk of loss is due to the complexity of forecasting. There are no stable trends on short-term intervals. The price can reverse at any moment under the pressure of market makers who collect stop orders of ordinary traders. On short intervals, high-frequency trading (HFT) robots are often used, which brings chaos into the trend with the volumes of placed and deleted orders.
Reward ratio
On average, profitability per trade is 3-5 points, taking into account the spread. The scalper’s income can be more than 100 points of net profit, taking into account losing trades.
Length of trade
Scalping is a type of short-term trading.
Entry/exit point
The type of indicators used depends on the scalping strategy. For example, for a rebound from key levels one would use a trend line or a resistance/support line. The second option is trading within the channel. Here the main indicator is a channel indicator. The trade is opened at the moment when the price starts to turn outside the channel towards the median value (middle of the channel). The trade is closed after making a profit of several points or when a reversal signal appears.
Example
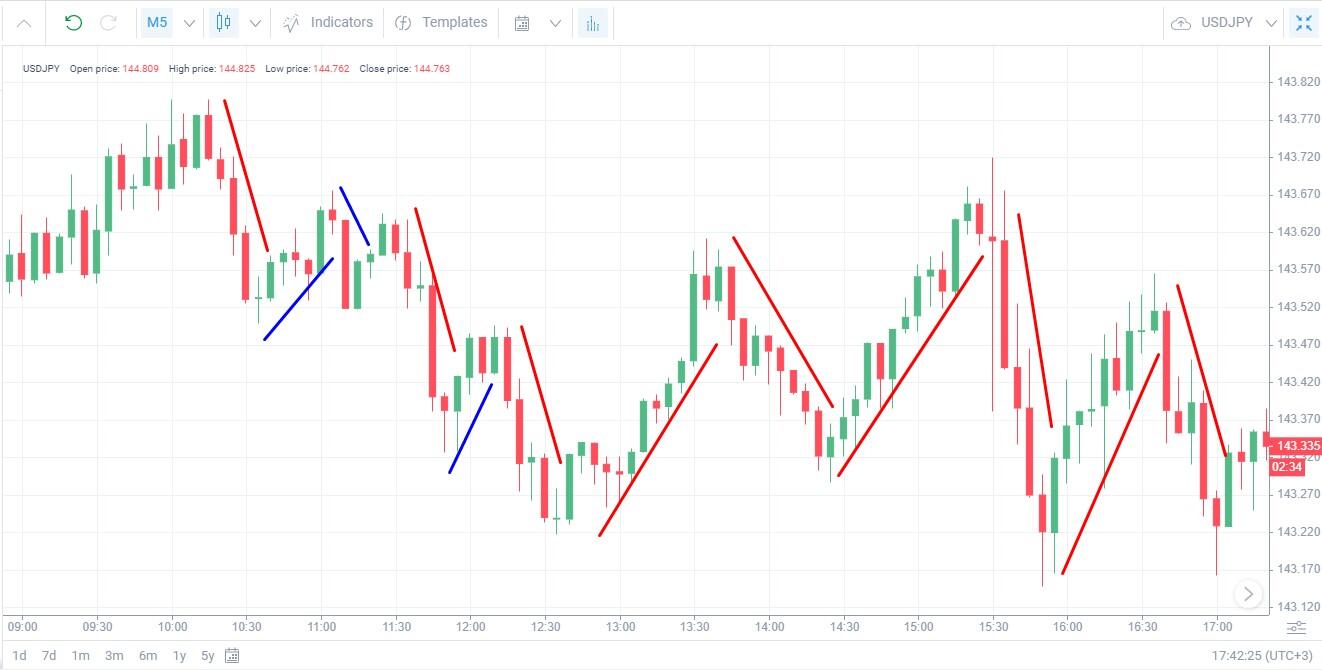
Scalping works best during moments of fundamental volatility or in areas of consolidation. In a trend movement, scalping turns into swing trading. Therefore, the scalper’s objective is to find the moment when the range of the price movement increases sharply.
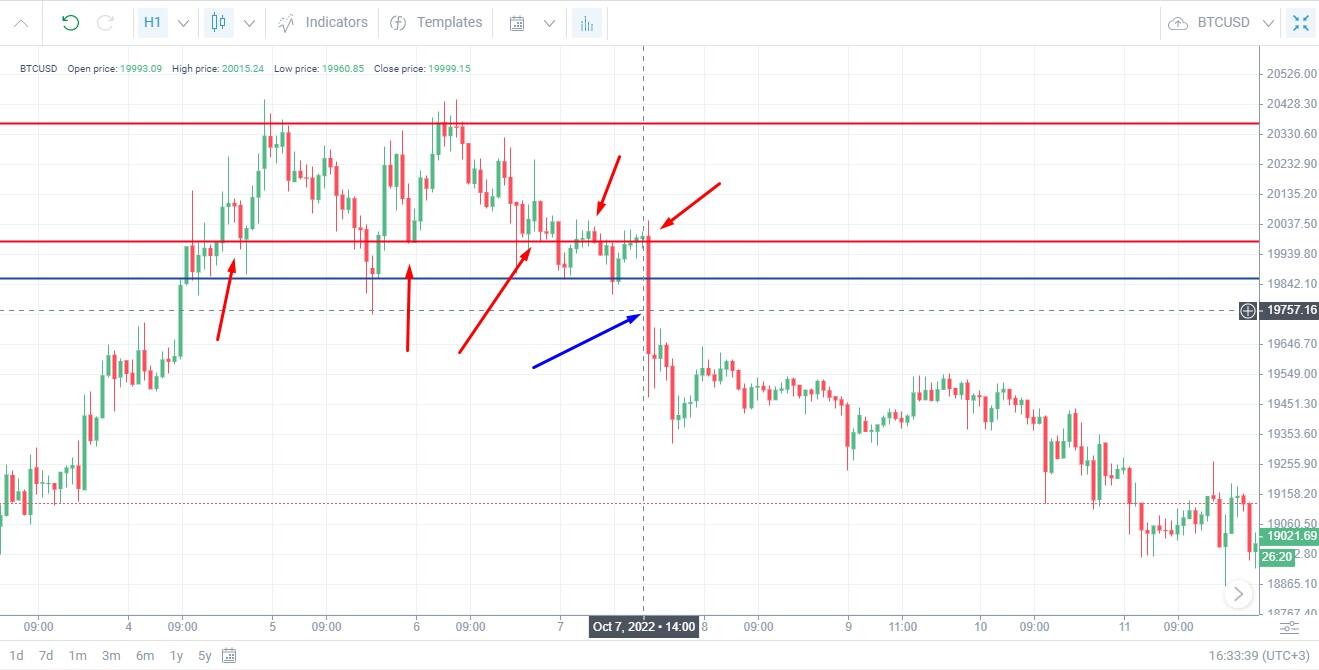
The screenshot shows that there are nine fairly strong short-term movements (red lines) and three false unprofitable ones (blue lines) in the 7-hour time frame. Profitable movements have engulfing and pin bar patterns. Assuming the scalper takes advantage of 50% of a given movement minus the spread, each trade would yield 7-10 points.
Pros and cons
The advantage of the strategy is that it allows earning on any assets, any timeframes and in any situation, including a flat. Scalping can always be turned into any other type of strategy. The disadvantage is a high load on the eyes and nervous system. The spread plays a major role, as it takes most of the profit. Therefore, a trader should try to open as many profitable trades as possible, monitoring the market every minute.
Carry trading
Carry trade is a system for generating income on the difference in the rates of Central banks. Each broker has a swap – a commission that is charged or deducted if the trade is not closed within the trading day. If the swap is positive in the direction in which the position was opened, every day the trader will receive a small income.
Strategy description
It involves opening long-term trades on timeframes from H4 and higher for currency pairs exclusively in the direction of price movement with a positive swap. The strategy is often used as a supplement to long-term trend systems.
Risk level
Low. The strategy has two main risks – the price will go in the opposite direction to the forecast or the Central Bank of one of the countries will change the discount rate. In the first case, it is enough to move the stop loss to the breakeven level + spread. The trade will close at zero, but you will earn on the swap. In the second case, the risk is reduced to zero by constantly monitoring discount rates.
Reward ratio
It depends on the amount of the swap and on the length of trade in the market. With a minimum position size of 0.01 lots without leverage in 4-digit quotes, the yield will be about 35-50 USD in 1 year.
Length of trade
Carry trade is a long-term strategy. The longer the trade is held in the market, the larger the income. Swap is calculated daily.
Entry/exit point
The main signal is a positive swap. Any trend indicators will suffice as a tool. They are only needed to determine the direction of the trend and its strength. After moving the stop loss to the breakeven level, you don’t need to monitor the indicators.
Example
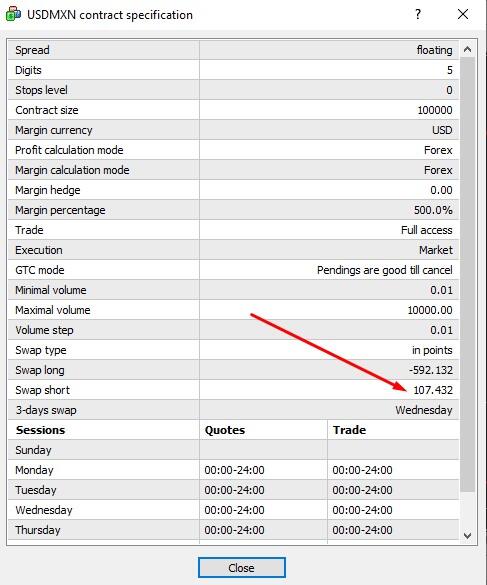
1. Let’s find a currency pair with a positive swap. It is better to start the search with the exotic pair – they have protracted trends with slippage. Cross rates often have positive swaps. You can find swap information in the specification.
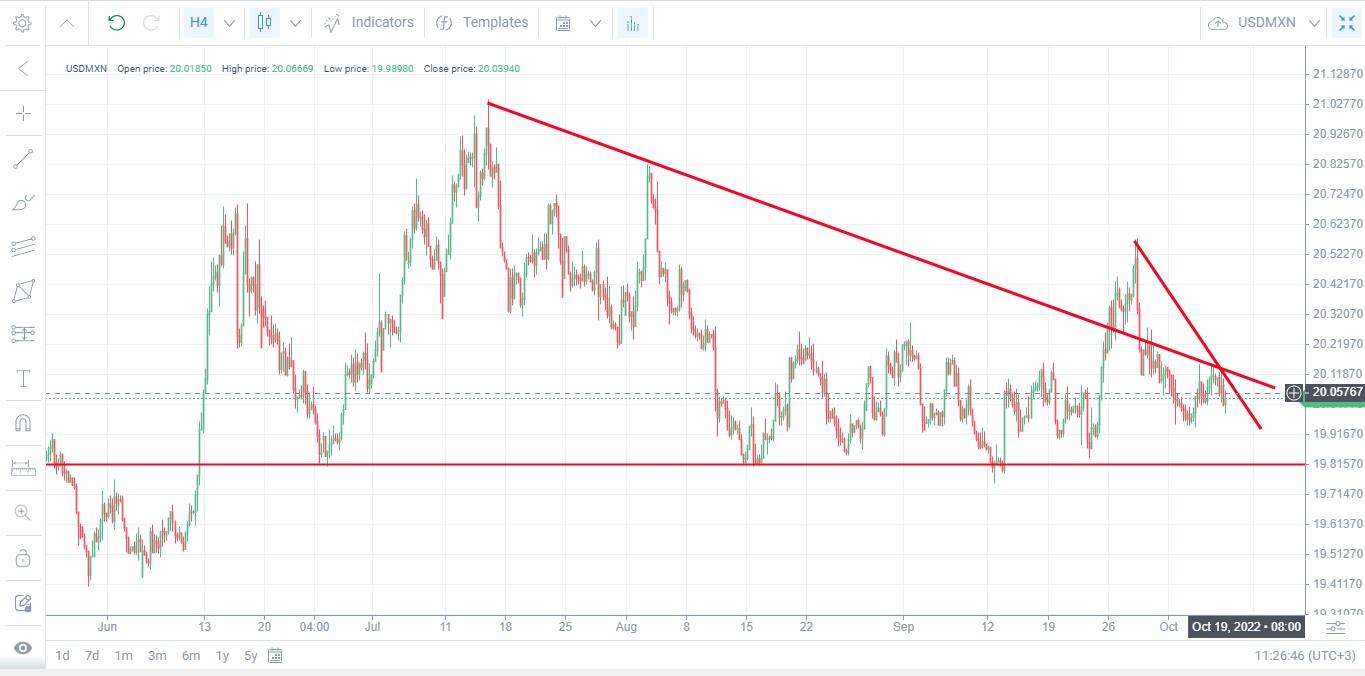
2. Now we need to analyze the long-term trend. If there are prerequisites for a descending movement, we open a short position.
Pros and cons
The strategy only works if there is a strong trend movement, otherwise the trade will close by stop loss before the trading session ends and the swap is charged.
Advantage: almost complete absence of risk and additional earnings on the trend movement, provided that the stop order moves with the price.
Disadvantages: the number of assets that have a positive swap and a long-term trend movement is very small. The second disadvantage is that the amount of swap charged is so small that in order to get tangible earnings, the deposit must be several thousand US dollars, even with leverage. Otherwise, it makes no sense to freeze your money when there are more profitable financial instruments.
Grid Trading
Grid strategy involves placing pending orders above and below the current price in the expectation that with any movement, one of the orders will work. Trend strategy: an order to buy is placed above the price, an order to sell – below the price. Countertrend strategy: a sell order is placed above the price, a buy order is placed below the price.
Strategy description
A grid of orders placed at fixed levels is used in markets with high volatility. It works in a flat market with a large range of price movement.
Risk level
High. The trader is required not only to correctly predict the required distance of pending orders, but also the further price movement. In a volatile market, the price may trigger a short pending order and move in the other direction. On the other hand, the price may not reach a long pending order. Expert Advisors solve this issue by setting a grid of pending orders, several on both sides. To compensate for the loss, the Martingale coefficient is used to increase the lot.
Reward ratio
When placing a grid of orders on a short timeframe, you only get a few points of profit. Therefore, this trading option is automated. When trading based on the fundamental analysis of the market, the profitability can be 30-50 points. With profitable trend strategies, where false breakouts are filtered using pending orders, profitability can be 100 points or more.
Length of trade
Depends on the profit targets and the speed of working with orders. Grid trading can be used in scalping with automated placing and removing of pending orders. Comfortable timeframes are М30-Н1.
Entry/exit point
- The price is moving in a flat and there is a chance of a false breakdown. Pending orders (buy stop/sell stop) are placed respectively above and below the possible breakdown. If the upward breakdown is not false, a buy stop is triggered – a long position is opened.
- The price is moving in a flat and will definitely touch the level from which it will rebound to the middle of the flat corridor. At the levels of a probable reversal, buy limit/stop limit orders are placed.
Tools: reversal patterns, pivot levels, ATR volatility indicator, etc.
Example
The trader needs to predict the direction of price movement after a breakdown and place a relevant pending order.
The chart shows that the price has been moving in a horizontal corridor for some time. There is a clear resistance level but no clear support level. In half the cases the price touches the lower red line and bounces up from it. It even moves near it for some time. But in the other 50% of cases, there are false breakouts with touching of another support level – the blue line. A pending Sell Stop order is set below the blue line. If the next breakdown of the red support level turns out to be false, the price will not reach the order, turning around at the blue level. A break of the blue level will mean the beginning of a strong downtrend.
Pros and cons
Advantage: no matter which direction the price goes, a pending order will work. Disadvantage: the price may turn around after triggering the order.
Bounce Strategy
This is the general name of the group of strategies that involve opening trades at the moment of the price rebounding from the key curves or lines. They have much in common with channel strategies, which have a similar principle of opening trades. The strategy can be used for any assets; the preferred timeframes are from M15 and higher.
Strategy description
Bounce trading options:
- Rebound from the trend line. The trend line is built through the first three points. Then a trade is opened at the moment of a rebound from the trend line.
- Rebound from the moving average. The reference line is the moving average until the price breaks through it. This example was discussed above in the Bladerunner Forex Strategy.
- Rebound from Fibonacci levels. Trades are opened on H1-H4 timeframes upon rebounds from Fibo levels.
- Reflection from round key levels.
The flat corridor is not used in bounce trading.
Risk level
Medium. The trend movement consists of short-term corrections. The easiest way to implement the strategy is to draw trend lines based on their extrema. Trading on Fibo levels and moving averages is more difficult, since a breakdown can occur at any time.
Reward ratio
Depends on the timeframe, the width of the trend channel, and the strength of the trend. On average, one trade can take up 5-7 candles or more.
Length of trade
On the M15 timeframe, a trade is held in the market for an average of 2-3 hours. On a daily timeframe – for a week or more.
Entry/exit point
One of the strategy options is trading on rebounds from the trend corridor. The trade is opened on the next candle after the bounce or in the middle of the first candle if it has a much larger body compared to the previous ones. If the price breaks through a little, the trade is opened upon return to the channel. Close the trade at the other border of the channel. Please note that channel indicators cannot be used here, since their channels follow the price. A commonly used tool is the rectangle pattern. Alternatively, you can draw lines through the three points manually.
Example
The objective is to find a trend that can be limited by three point lines. Long timeframes are better suited for this. The price does not always reach the opposite border of the corridor, so you need to look for opportunities to close the trade early.
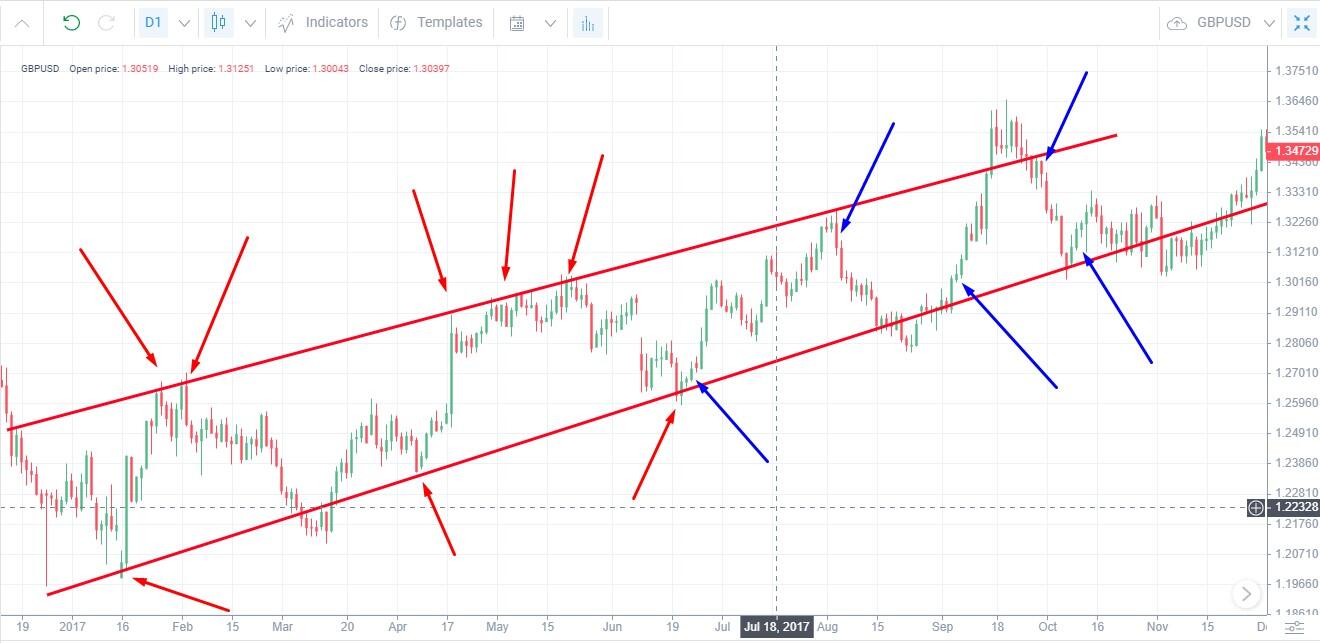
We build support and resistance lines on the daily timeframe during an uptrend using the points indicated by the red arrows. We open trades on rebounds (blue arrows). Closing is at the discretion of the trader. Since the chart is daily, you can do with 3-5 candles. For example, in the last trade, the price reached only the middle of the corridor.
Pros and cons
The idea of bounce trading is quite logical; channel strategies and swing trading are built on it. But it is important to catch the trend and draw the lines from which the price will rebound more than three times. This is the hardest part. For beginners, the strategy may seem complicated, since it does not have clear instructions. You need to select the tools for determining pivot points and decide on the exit point.
Running out of steam strategy
This is a special case of trading on a trend reversal, when there is no clear formation of the pattern head/shoulders, double bottom, or double top.
Strategy description
“Bulls / bears are running out of steam” – this is how traders describe a situation when, after an upward or downward movement, the price rests on some kind of ceiling or floor. This is the price above which buyers refuse to buy an asset, or the price below which sellers would not go short. The price tests the level several times, after which it changes direction.
Signal formation:
- You can only draw one horizontal level: a resistance line above which the bulls cannot go up, or a support line below which the exhausted sellers cannot go down. You can only draw the second level – there is no formed side channel.
- The price tests the level three times on a long section.
- There are no obvious reversal patterns.
Open a trade after the third rebound. Close according to the situation.
Risk level
High. The third retest may be followed by a fourth one. A breakdown or a false breakdown of the level is possible. In both cases, the trade will close by stop loss.
Reward ratio
Depends on the strength of the trend. Profitability can be from 20-30 points.
Length of trade
This is a long term strategy. To eliminate price noise and the influence of market makers, you need a timeframe from H1. Signal formation can take several days. An open trade is held in the market for more than 1 day.
Entry/exit point
Open a trade after the third touching of the level on the next candle after the reversal.
Example
In theory, one can draw the upper resistance level. But the price repeatedly tries to get to it. Support levels are not pronounced – each of the drawn levels can be one. But the downward trend still began, marking a slight upward correction. The entry moment is ambiguous. Two long candles down after a resistance bounce seem to be a good moment, but it is better to wait for the moment of correction and open a trade after it ends.
Pros and cons
This principle is hardly a separate strategy, but in some sources it is given special attention. The strategy shows that a trend change can take a long time. And the price can draw any chaotic shapes without a clear flat before changing direction. Its advantage is that the trend comes sooner or later and the signal is strong. The disadvantage is that you need a large deposit to withstand the next return to a key level if the trade is already open.
To interpret the strength of the movement momentum, you can use the Currency Strength Indicator oscillator.
Breakout Strategy
Breakout strategy involves opening a trade in the event of a breakout of a key level. This is a symbiosis of trend and channel strategies. The trend often encounters levels at which the orders of sellers and buyers are in equilibrium. The price moves along the level for some time and then a reversal (a new trend or correction) or a breakdown of the level is possible. Opening a trade after a breakout is referred to as the Breakout Strategy.
Strategy description
The idea of the strategy is based on the fact that a breakout of the level where the price has consolidated means that the trend has not yet exhausted itself. If you missed the opportunity to open a trade at the beginning of the trend and suspect that it may end at any moment, a breakout is the moment to jump in.
Risk level
Medium. Breakouts may be false. On the other hand, if it is confirmed by fundamental factors, i.e. the price continues to move after the news, the risk is lower.
Reward ratio
On the hourly interval, you can earn 30-50 points, with some luck even 70-100 points.
Length of trade
Depends on the strength of the trend. On average, you can manage to cover 4-6 candles.
Entry/exit point
The trend has a pronounced movement. Then there is a temporary pause and a flat occurs. The price periodically tries to break through in both directions and returns to the sideways corridor. A breakout in the direction of the trend with a confirming pattern is a signal to open a trade on the next candle after the breakout. Close the trade based on actual the situation. Closing signals: reversal patterns, trailing stop, etc.
Example
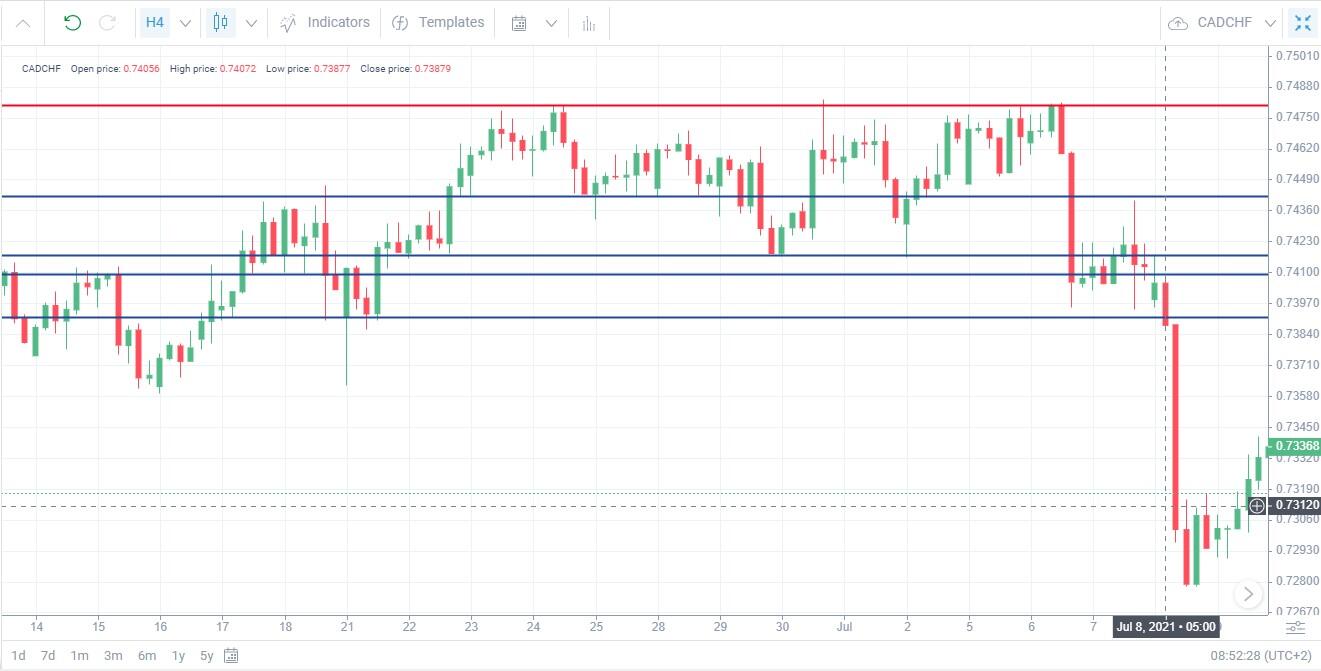
- 1 – after the start of the downward movement the price drew the first reversal point. Although the downward movement was short, it can be described as a trend movement, since the length of the candles is much longer than the previous ones.
- 2 – the end of the correction.
- 3 – the price again rests on the same level – you can draw a support line.
- 4 – correction ends, a resistance line is formed.
- 5 – confirmation of the support as a strong level. The candlesticks have almost no downward shadows. This suggests that buyers are in no hurry to buy the asset, and at the end of the hour the price will remain at its lowest value.
- 6 – a false breakout of the resistance line and a strong series of downward candles with a breakdown of support.
- 7 – open a short position.
Close the trade after the appearance of two consecutive upward candles or by trailing stop.
Pros and cons
The advantage of the strategy is that the signal confirms the further price movement. Disadvantage: such strong trends are rare, and there are many false signals on the M15-M30 intervals due to the instability of the movement.
Overbought and Oversold Trading Strategy
This trading strategy is based on the fact that a trend cannot last forever. Sooner or later, the price climbs so high that buyers refuse to buy the asset, or falls so low that sellers refuse to sell the asset at a loss, hoping for growth. Or buyers finally see a favorable price and agree to buy the asset.
When there are no buyers, sellers appear, and their volumes reverse the price down. At the pivot point, the asset is overbought. But a reversal rarely occurs instantly and clearly. Buyers begin to buy the depreciating asset again, and the price goes up to the overbought level. This is how the supply zone is formed. It’s vice versa for the oversold zone – this is how the demand zone is formed.
Strategy description
The trader’s objective is to correctly identify the demand and / or supply zones and place pending orders in them, filtering out false breakouts of the zone borders. Then wait in the zones for a price reversal and the formation of a reversal trend.
Risk level
Above medium. For example, in theory, a downward reversal should occur anyway. But the reversal may again be followed by an increase in the volume of buyers. This kind of back-and-forth can go on for a long time. But as soon as the buyers realize that the sellers are not yet ready to sell the asset en masse, which means they are counting on continued growth, the price will continue to grow. Such rallies are especially evident on the cryptocurrency market.
Reward ratio
Depending on the timeframe. On the hourly interval, you can catch a trend that will give you at least 30-50 points per day.
Length of trade
Depending on the timeframe. The strategy is suitable for intraday trading with the possibility of holding a trade for up to several days. However, the zones are best viewed on timeframes from H4 and higher.
Entry/exit point
Define overbought and oversold zones in the chart. As soon as reversal patterns and other reversal signals appear in them, open a trade in the direction of the reversal. The strongest signal is a retest of the far line of the zone. Close the trade at the end of the trend as soon as the price reaches the opposite zone.
Example
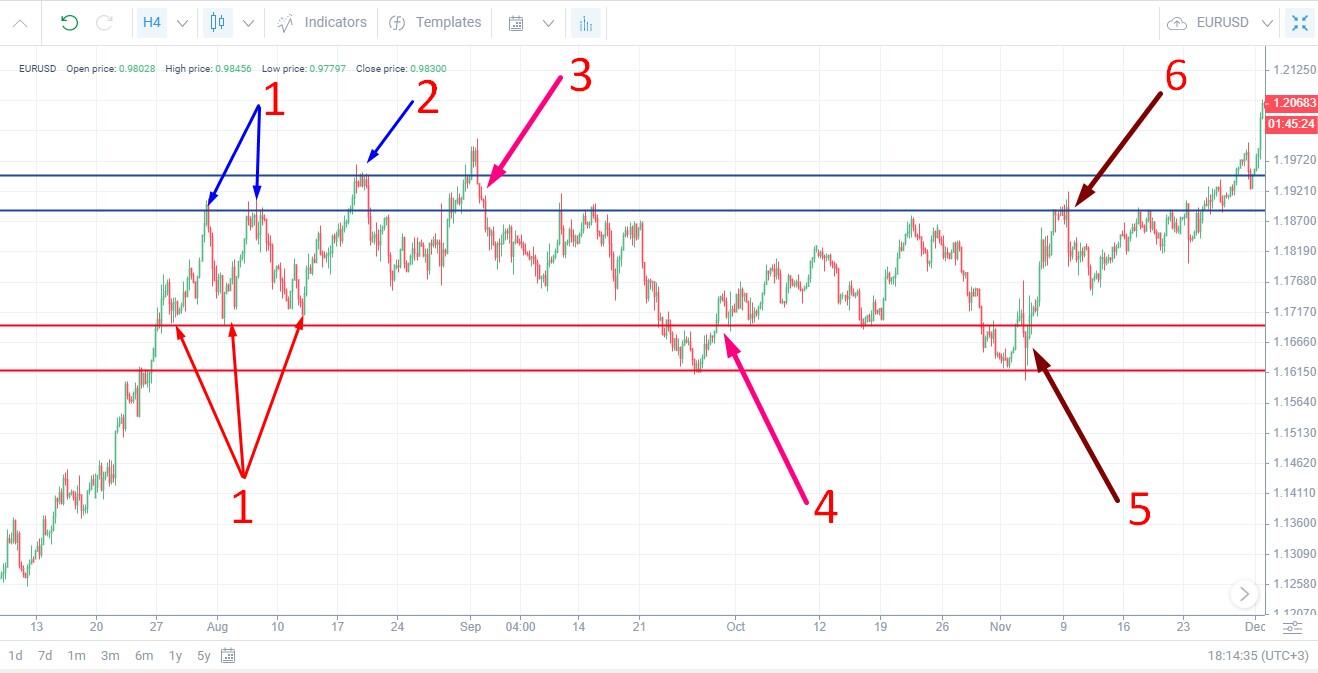
Long-term Forex strategy for the H4 timeframe.
On the H4 timeframe, there was an uptrend, which with high volatility began to turn into a flat.
- We can build a support level (red horizontal) and a resistance level (blue horizontal) through points “1”. These are the near levels of the future zones of demand (lower zone) and supply (upper zone).
- Another reversal forms at point “2”. From the point of view of the level theory, it is a “false breakdown” – it breaks through the previous resistance but does not continue the trend. It builds a far resistance level. The distance between the blue lines is the supply zone.
- On the next upward movement, the far resistance line is broken. The return to the zone is a retest of the far resistance level, showing that buyers cannot set an uptrend even on the second attempt. We open a short position at point “3”.
- The price breaks through the support level and reverses up. At point “4” we close the short position. Then we draw a far support level at the pivot point. The distance between the red lines forms the demand zone.
- At point “5”, the price enters the demand zone again, retests the far support level and goes up – we open a long position.
- At point “6”, when the price touches the near resistance level, we close the position.
This example shows how, on a long-term interval, you can consistently pull out signals from the formed supply and demand zones in compliance with the level retest rule.
Pros and cons
The strategy does not have a clear framework for the interpretation of signals. Each trader determines the boundaries of the zones and sets limits on false breakouts at their own discretion. Despite the clear logic, there is no unambiguity in this strategy that provides for a high risk. Oscillators do not help to determine the ranges of overbought and oversold zones in this case. And the zone itself may turn out to be a consolidation zone, beyond which the trend will continue.
Daily Fibonacci Pivot Trade Strategy
This is a Fibonacci levels strategy with the additional confirming Pivot Points indicator. One can also trade on corrections or trend continuation between Fibo levels. But the confirmation is the signals of both indicators coinciding.
Strategy description
In a trending market, Fibonacci levels are built at the beginning of the first correction. The preliminary signal is the price bouncing off the Fibo level in the direction of the trend. At the same time, the level coincides with S1/S2/S3 or R1/R2/R3.
Risk level
High. This Forex strategy needs to be carefully adjusted for a specific asset and timeframe. Without long testing, there is a high risk of getting a lot of false signals.
Reward ratio
On the H4 timeframe, the distance between the levels is about 40 points.
Length of trade
This is a long-term strategy, the trade is kept in the market from several days to several weeks.
Entry/exit point
During the correction, the price touches the Fibo level, which coincides with the Pivot levels. Then it reverses. Open a position in the middle of the pivot candle. The nearest target is the next trend level.
Example
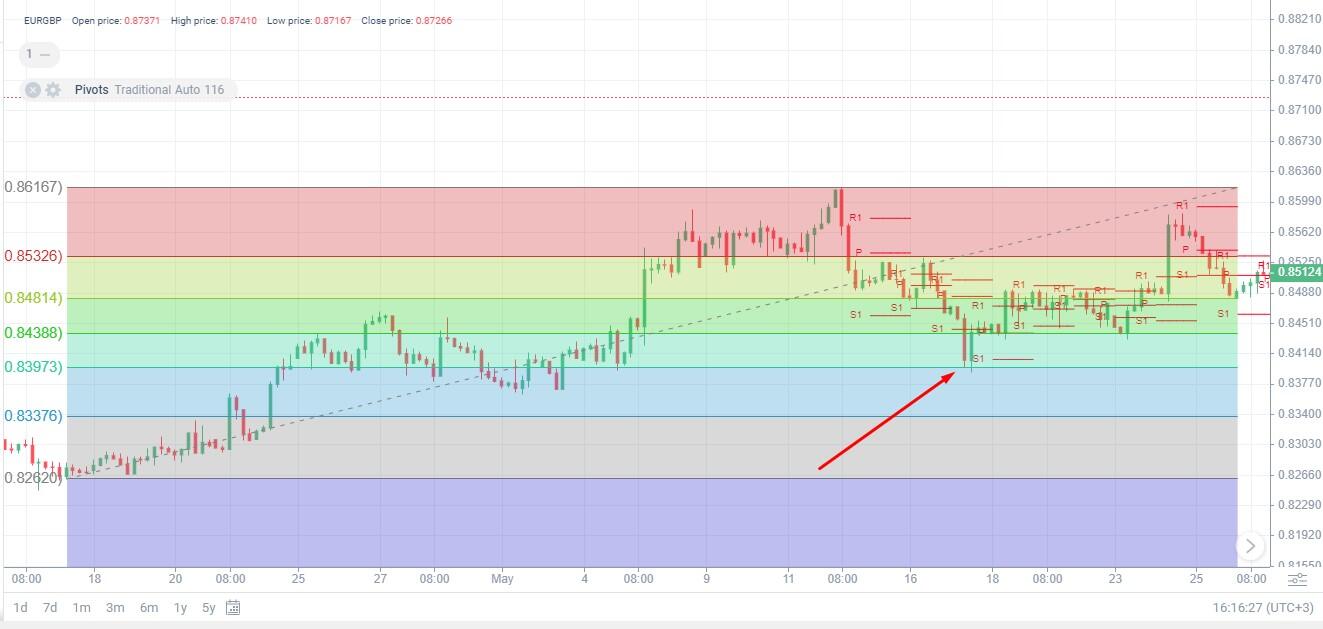
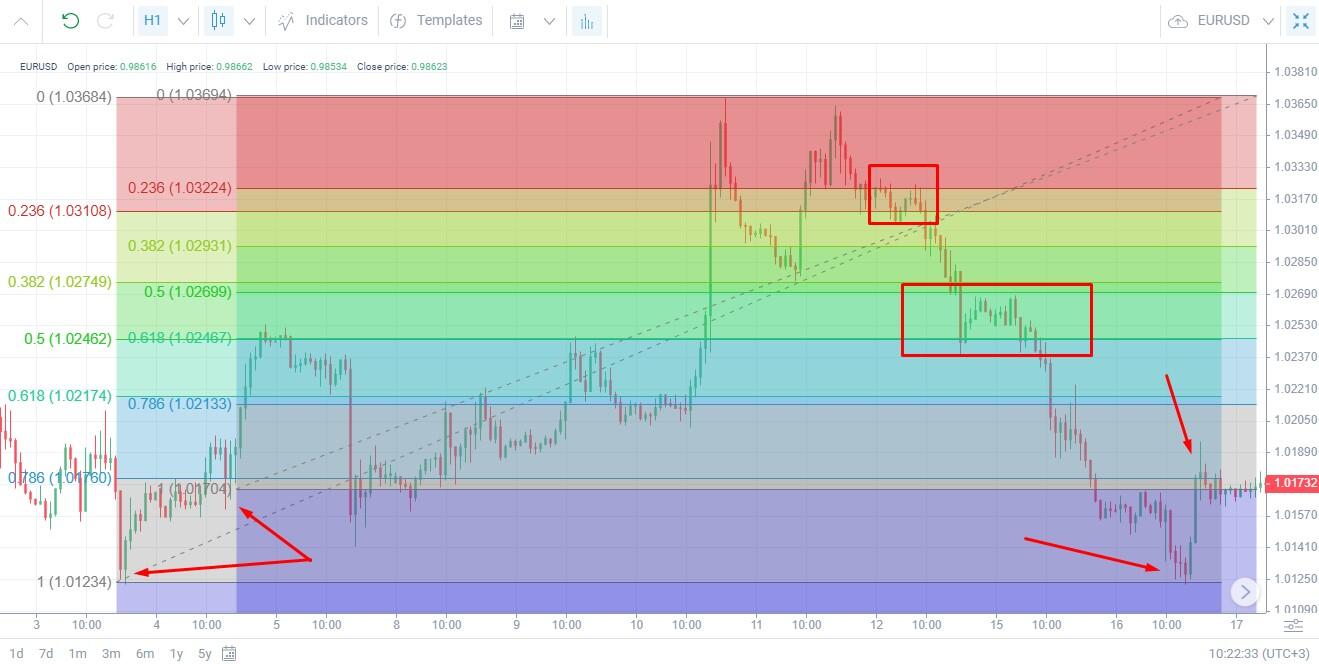
In the chart, it looks like this. Even with the S1/R1 levels left, the chart is oversaturated with lines, although one entry point on the correction is still visible. A piece of advice: it is difficult to perfect this strategy on the history of quotes. Use a demo account and set the lowest value of the “Number of reverse values” in the indicator settings – 2. In this case, the indicator will take into account 6 candles for the H4 interval, and 24 candles for the H1 interval. And it will calculate two level values.
Pros and cons
The Fibonacci levels are a good tool once you get used to it. But the combination with Pivot points turns a relatively easy Forex strategy into a complex professional system. Pivot points have different formulas: Camarilla, Fibonacci, Woody, etc. Which formula should be applied at what point is the real question. You can play with the parameters for a long time on the history of quotes, but this does not guarantee the result on a real account.
Overlapping Fibonacci Trade Strategy
The strategy is built on two Fibonacci grids built in the same trend. The first grid is built through the beginning of the trend and its extremum. As new extrema appear, the grid stretches. The second grid is built through the extremum of the first correction and the extremum of the trend. Both grids have different start points and the same end point.
Strategy description
When the levels of both Fibonacci grids match, it’s considered a strong horizontal line. When the price rebounds from it, open a trade with the target level at “the next trend level or extremum level” (level 0).
Risk level
High. Attempts to build grids so that the levels finally match will often lead to wishful thinking.
Reward ratio
Depends on the timeframe. On the H4 timeframe, the distance between the levels is about 40 points. On the hourly interval, you can earn 15-20 points on a short movement.
Length of trade
Depending on the timeframe. If the trade is closed at the next Fibo level, the strategy for the H1 interval will be intraday.
Entry/exit point
Enter when the price rebounds from the correction at the double Fibo level in the direction of the trend. A double level breakout and a return to the trend are allowed. The position should be opened at the moment of the breakout of the double level along the trend. Exit at the next Fibo level along the trend.
Example
Two grids superimposed on each other are not very convenient from a visual point of view: there are too many lines and selected zones in the chart. And if you add other indicators, you get chaos. However, you can still find some patterns. For example, the matching level of 0.5 and 0.618 really turned out to be strong. Also, in some areas, movements between the levels of different grids are visible. They are small, you can’t earn much from them. But they can be used for trading on lower timeframes, as they will allow you to find earlier entry points.
Pros and cons
The idea of confirming a signal with a similar indicator with different settings is considered one of the most effective methods. There are strategies based on several stochastic indicators, moving averages, etc. But in this case, it will work only when you learn to intuitively determine the start and end points of the trend. If the first Fibo grid is built at the beginning of the trend and its extremum, no problem. But which correction point should be used for the second grid then? What if there are two corrections, do you build two Fibo grids? Only you can answer these questions when you gain experience and develop your intuition. Building grids at random will give you false signals.
Summing up the trading strategies
In this block, you will find a summary table with ranking from 1 to 19 for all the above strategies based on the chosen criteria. 1 is the simplest strategy recommended for beginners, while 19 is the most complex professional trading system. The ranking is subjective. If you have a different opinion, you want to share your experience and your strategy, or you have questions about these systems, please join the discussion in the comments.
Strategy: Positional trading
Risk level: Medium
Reward ratio: 15-50% per annum
Length of trade: Several weeks
Entry points: Start of a long-term trend
Exit points: Trend reversal, transition to a flat. Exit by trailing stop
Pros: Steady trend on a long timeframe. No need to constantly monitor the chart
Cons: Rare signals. Relatively low returns
Total ranking: 9
Strategy: Trend Breakdown strategy
Risk level: Below medium
Reward ratio: 100-150 pips in several days
Length of trade: 12-15 hours to several days
Entry points: Next candle after the trendline is broken at reversal
Exit points: Reversal patterns, trend movement decay
Pros: Clear signal logic. The trader has time for analysis. Late entry allowed
Cons: You need to watch the chart to avoid losing on a deep correction
Total ranking: 1
Strategy: Swing trading
Risk level: Medium
Reward ratio: Trend trading on the hourly intervalyields 80-100 points
Length of trade: Several hours to several days
Entry points: Price reversal in the direction of the trend after the end of the correction
Exit points: 50% when the price reaches the level of the beginning of the correction. The remaining 50% – by trailing stop
Pros: Clear signal logic. Relatively high profitability from skipping correction areas
Cons: Constant chart monitoring. There is a risk that the correction will turn out to be a new trend
Total ranking: 6
Strategy: Trend trading
Risk level: Below medium
Reward ratio: 40-50 points for intraday trading
Length of trade: Intraday trading with the option of transitioning to medium-term trading
Entry points: The end of the trend, its reversal, or exit from the flat confirmed by patterns and trend indicators
Exit points: After reaching the target profit, a part of the position is closed, the rest is insured by trailing stop. Exit by levels, reversal patterns
Pros: The trader has time to evaluate the chart; stable trends on hourly or higher intervals
Cons: Relatively rare signals
Total ranking: 4
Strategy: Range trading
Risk level: Medium
Reward ratio: 20-30 pips on the hourly timeframe
Length of trade: Intraday
Entry points: Price reversal outside the channel in case of a breakdown towards its middle or at the moment of price rebound without breakdown
Exit points: 50% at the middle of the channel, 50% – by trailing or when the price touches the opposite border of the channel
Pros: Relatively accurate signals with clear interpretation
Cons: It is hard to select the proper settings of indicators that determine the channel width
Total ranking: 12
Strategy: Day trading
Risk level: High for scalping, below medium for a trend strategy
Reward ratio: 70-100 points for a trend strategy with a high asset volatility
Length of trade: Intraday trading with an average length of trade of 8-12 hours
Entry points: Moments of a trend reversal or exit from a flat identified by reversal patterns, trend indicators, oscillators
Exit points: At the end of the trend: reaching key levels, 30 minutes before the release of the news, the appearance of reversal patterns
Pros: Saving on swap. Different types of strategies can be applied
Cons: Constant chart monitoring
Total ranking: 5
Strategy: Retracement trading
Risk level: Medium
Reward ratio: 15-35 points per hour
Length of trade: Intraday, medium and long-term trading
Entry points: End of correction, reversal in the direction of the trend with a rebound from the Fibo level
Exit points: Conservative version of the long-term strategy – 100% of the trade is closed upon reaching the closest Fibo level along the trend. Aggressive version – 50% of the trade is closed at 0, 50% is insured by trailing stop
Pros: The system is backed by the psychology of the majority
Cons: Requires intuition to spot strong levels
Total ranking: 14
Strategy: The Bladerunner trade
Risk level: Below medium
Reward ratio: From 30-50 pips
Length of trade: Intraday
Entry points: Matching of the key level and the point where the price tests the moving average
Exit points: By reversal pattern, by trailing stop
Pros: Clear logic of signals
Cons: Rare signals
Total ranking: 2
Strategy: The Pop ‘n’ Stop trade
Risk level: Medium
Reward ratio: Conservative option – 25-30 points, aggressive – 50 points and more
Length of trade: Several hours to several days
Entry points: Price exiting from a flat (breakout of the corridor border), beginning of a trend
Exit points: Reversal patterns, smaller bodies of candles, transition to a flat
Pros: Clear logic of signals
Cons: Risk of false breakouts
Total ranking: 7
Strategy: News trading
Risk level: High
Reward ratio: 30-50 points
Length of trade: Several hours
Entry points: News release. You can use pending orders
Exit points: Trend decay
Pros: Quick earnings on a sharp surge in volatility
Cons: High probability of exiting by stop loss due to volatility, risk of predicting the direction of movement wrong
Total ranking: 13
Strategy: Scalping
Risk level: High
Reward ratio: 50-100 points – depends on the number of trades
Length of trade: Short-term
Entry points: Any approaches to finding signals to enter the market
Exit points: Any approaches to finding signals to exit the market
Pros: The strategy is suitable for any asset and any market condition, including flats
Cons: Emotional stress of opening dozens of trades a day
Total ranking: 16
Strategy: Carry trading
Risk level: Below medium
Reward ratio: Depends on leverage, position size and swap size
Length of trade: Long-term
Entry points: Positive swap coinciding with long-term price movement
Exit points: By trailing stop or before the discount rate changes
Pros: No risk if you correctly forecast the direction of price movement and move the stop order to the breakeven level in time
Cons: Limited number of assets with positive swap. Large deposit and leveraged trading required
Total ranking: 3
Strategy: Grid trading
Risk level: High
Reward ratio: 30-50 points
Length of trade: Mostly intraday
Entry points: By pending order
Exit points: By trailing stop
Pros: The order will work regardless of the direction the price goes
Cons: Difficult to calculate the length of pending orders
Total ranking: 15
Strategy: Bounce strategy
Risk level: Medium
Reward ratio: 5-7 candles
Length of trade: Several hours with M15 interval
Entry points: On the next candle after the rebound from the channel border
Exit points: Upon reaching the opposite channel border
Pros: Several signals can appear in one movement
Cons: No clear guidelines for identifying signals
Total ranking: 8
Strategy: Running out of steam
Risk level: High
Reward ratio: from 20-30 points
Length of trade: Intraday, long-term
Entry points: At the moment of rebound from the resistance level for a short position, from a support level for a long position
Exit points: Depending on the situation
Pros: In case of a change in the direction of the trend, you can catch a strong movement
Cons: No clear guidelines for interpreting entry signals
Total ranking: 17
Strategy: Breakout strategy
Risk level: Medium
Reward ratio: 50-70 points
Length of trade: Several hours to several days
Entry points: Trend continuation after a small horizontal movement
Exit points: Reversal patterns
Pros: High probability of trend continuation in case of a breakout
Cons: Risk of false breakout, rare signals
Total ranking: 10
Strategy: Overbought and oversold
Risk level: Above medium
Reward ratio: 30-50 points per hour
Length of trade: Several hours to several days
Entry points: By reversal patterns in supply and demand zones
Exit points: End of the trend, price reaching the opposite zone
Pros: Clear logic of the strategy, but identifying the boundaries of the zones is at the discretion of the trader
Cons: No clear interpretation of signals
Total ranking: 11
Strategy: Daily Fibonacci Pivot Trade
Risk level: High
Reward ratio: Around 40 points for the H4 interval
Length of trade: Long-term
Entry points: The end of the correction coincides with one of the Fibo levels and Pivot reversal level
Exit points: First Fibo level in the direction of the trend
Pros: Double signal confirmation
Cons: Difficult signal interpretation
Total ranking: 18
Strategy: Overlapping Fibonacci Trade
Risk level: High
Reward ratio: Around 40 points for the H4 interval
Length of trade: Long-term
Entry points: End of correction coinciding with both Fibo levels of two different grids
Exit points: First Fibo level in the direction of the trend or level 0, which is the same for both grids
Pros: Double confirmation of signals
Cons: Rare signals. Hard to identify the points on which the second Fibo grid is built
Total ranking: 19
A simple strategy does not mean a profitable one. Just as a complex professional trading system does not guarantee profitability. The number of indicators isn’t the deciding factor either: trying to double confirm a signal not so much increases the chance of success as it reduces their frequency. A successful strategy is one that you understand well, that suits your goals and brings satisfaction and comfort instead of fatigue.
How to find such a Forex trading strategy:
- Try different trading systems on a demo account and find what you like best. With LiteFinance, you can use a demo account without registration.
- Don’t chase profitability. Initially, your goal should be gaining experience.
- Experiment. Introduce your own elements into the strategy, customize it, etc. Change timeframes, try the system on different assets, set different risk levels. Try to work with different indicators.
Believe in yourself, don’t be afraid to try something new and you will succeed. Good luck!













 Chat now!