Oil Prices Forecast: Middle East Strife, China Demand Woes Impact Crude

Oil Prices Forecast: Middle East Strife, China Demand Woes Impact Crude

Global Oil Market in Flux Amid Geopolitical and Economic Changes

The global crude oil market is currently experiencing significant fluctuations, influenced by geopolitical events and changing demand patterns, especially in China. These factors are creating a complex environment for oil prices and trade.

Trading Derivatives carries a high level of risk to your capital and you should only trade with money you can afford to lose. Trading Derivatives may not be suitable for all investors, so please ensure that you fully understand the risks involved, and seek independent advice if necessary. A Product Disclosure Statement (PDS) can be obtained either from this website or on request from our offices and should be considered before entering into a transaction with us. Raw Spread accounts offer spreads from 0.0 pips with a commission charge of USD $3.50 per 100k traded. Standard account offer spreads from 1 pips with no additional commission charges. Spreads on CFD indices start at 0.4 points. The information on this site is not directed at residents in any country or jurisdiction where such distribution or use would be contrary to local law or regulation.


Market Response to Geopolitical Tensions

The oil market has reacted sharply to escalating tensions in the Middle East, particularly following the U.S. and British strikes against Houthi military targets in Yemen. These actions, in retaliation to threats against crucial Red Sea shipping routes and Iran’s seizure of an oil tanker, resulted in a surge of over 2% in oil prices. This reflects the market’s acute sensitivity to geopolitical unrest.

China’s Slowing Oil Demand Growth

Recent analyses show a deceleration in China’s oil demand growth to about 4% in the first half of 2024, mainly due to the country’s property market challenges. Nevertheless, import levels are expected to remain supported by sectors like aviation and petrochemicals. The International Energy Agency forecasts a 13.3% increase in China’s naphtha demand, crucial for producing advanced chemical products for industries such as solar panels and electric vehicles.

Supply and Demand Variations

From a supply perspective, an unexpected rise in U.S. crude inventories marks a divergence from prior stockpile projections, suggesting a shift in the oil market’s landscape. The demand outlook is further complicated by Europe’s economic struggles, potentially leading to reduced oil consumption in the euro zone.

Short-Term Forecast

Given these developments, the short-term forecast for the crude oil market leans towards a bearish sentiment. While geopolitical events have temporarily elevated prices, the market is contending with the impact of China’s reduced demand growth, alongside uncertain global supply conditions and economic factors in key regions.

Technical Analysis

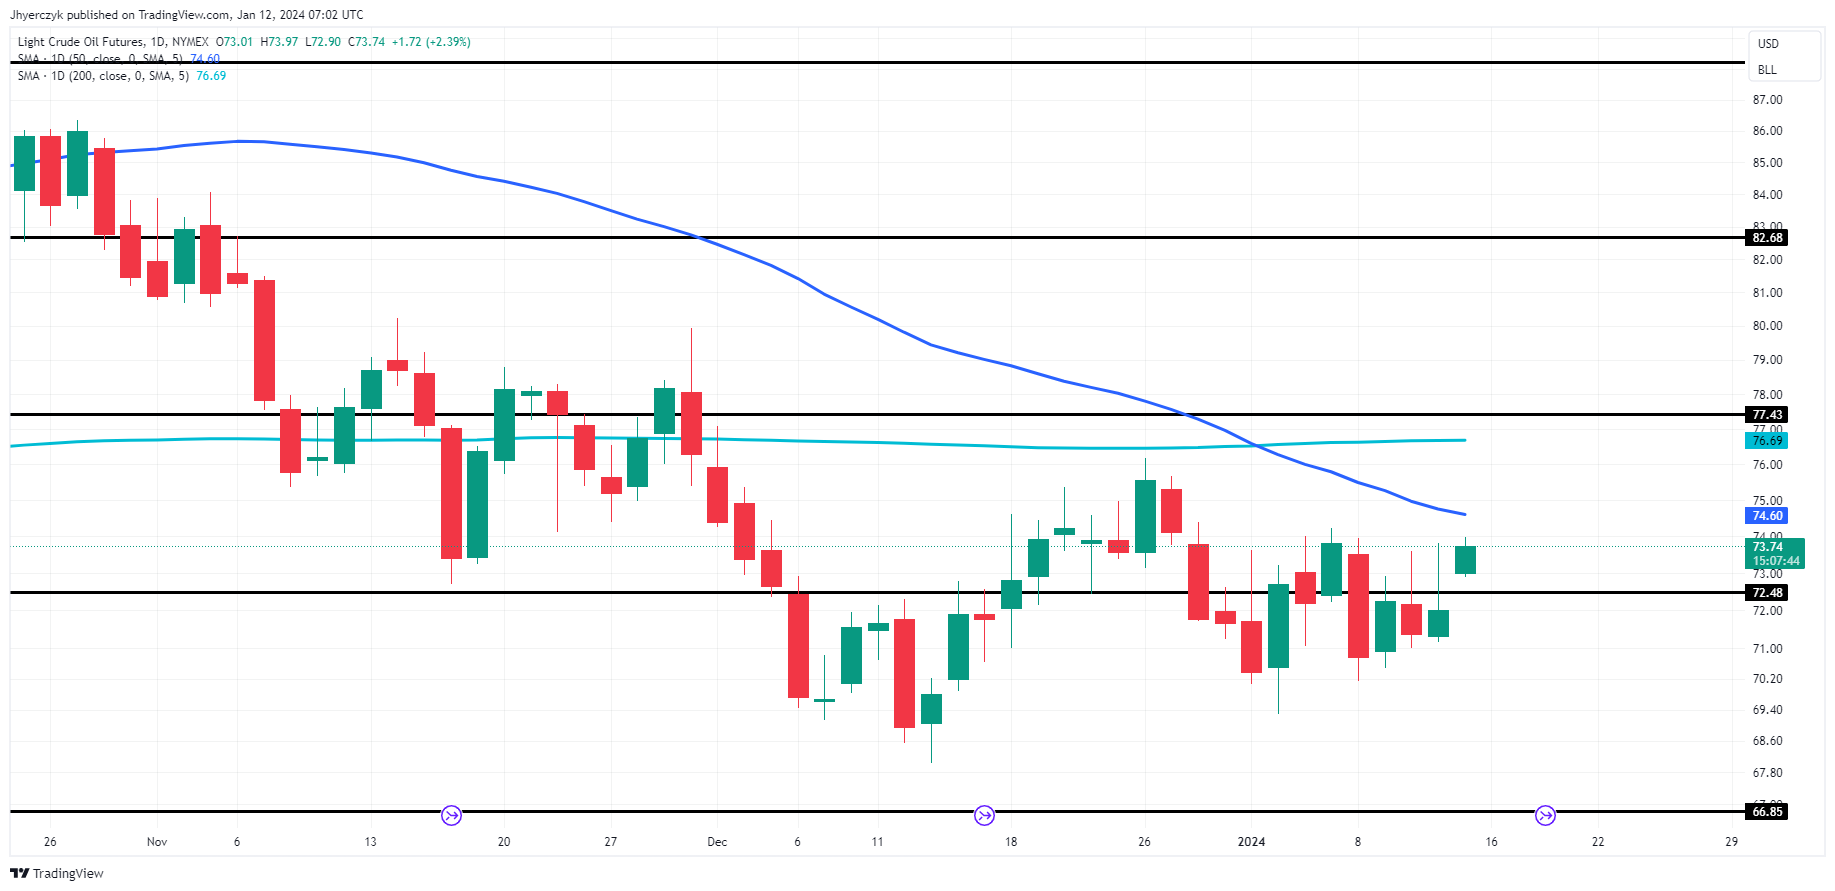
Daily Light Crude Oil FuturesThe current daily price of Light Crude Oil Futures at 73.74, being below both the 200-day (76.69) and 50-day (74.60) moving averages, suggests bearish sentiment in the market. This positioning indicates that the market is currently in a downtrend.

The price hovers above the minor support level at 72.48, implying that this level might act as a near-term floor. Should the price break below 72.48, the next key level to watch is the main support at 66.85.

On the upside, the minor resistance at 77.43 and the main resistance at 82.68 stand as critical barriers to any bullish reversal. The recent increase from the previous close of 72.02 shows some positive momentum, but the overall trend remains bearish unless it crosses above moving average resistance.

EUR/USD and GBP/USD Price Forecast: Modest Gains on Strong UK GDP, With Focus on Upcoming US PPI

EUR/USD and GBP/USD Price Forecast: Modest Gains on Strong UK GDP, With Focus on Upcoming US PPI

EUR and GBP Slightly Up as DXY Stalls; Mixed Economic Signals Ahead

Yesterday, the EUR/USD pair closed slightly up at 1.09736, showing a modest increase of 0.01% and GBP/USD also witnessed an uptick, closing at 1.27628, marking a rise of 0.16%. In parallel, the US Dollar Index (DXY) edged up by a minimal 0.01%, closing at 101.965.

In the Eurozone, the ECB Economic Bulletin was released alongside Italian Industrial Production data, which reported a more significant contraction than expected at -1.5%.

Trading Derivatives carries a high level of risk to your capital and you should only trade with money you can afford to lose. Trading Derivatives may not be suitable for all investors, so please ensure that you fully understand the risks involved, and seek independent advice if necessary. A Product Disclosure Statement (PDS) can be obtained either from this website or on request from our offices and should be considered before entering into a transaction with us. Raw Spread accounts offer spreads from 0.0 pips with a commission charge of USD $3.50 per 100k traded. Standard account offer spreads from 1 pips with no additional commission charges. Spreads on CFD indices start at 0.4 points. The information on this site is not directed at residents in any country or jurisdiction where such distribution or use would be contrary to local law or regulation.

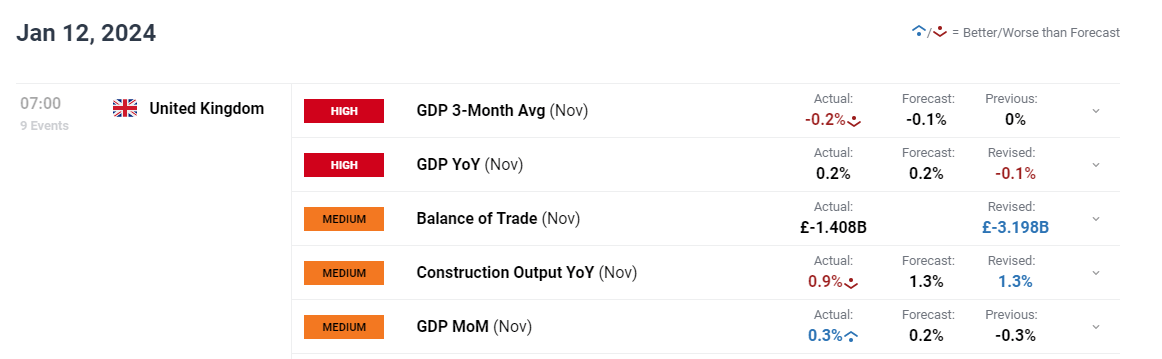
In the UK, key economic indicators like Housing Equity Withdrawal and GDP showed mixed trends. Notably, GDP outperformed expectations slightly, posting a 0.3% increase. The US economic data, featuring Core CPI and unemployment claims, indicated a stable inflation rate and a tight labor market.

Events Ahead

Looking ahead, the Eurozone awaits French Consumer Spending and Final CPI data, expected to show modest movements. The US calendar is marked by Core PPI and PPI data releases, which are anticipated to provide further insights into inflation trends and might influence the dollar’s movement.

No significant events are scheduled for the UK for rest of the day, leaving GBP/USD movements likely influenced by broader market sentiments.

US Dollar Index (DXY)

Dollar Index
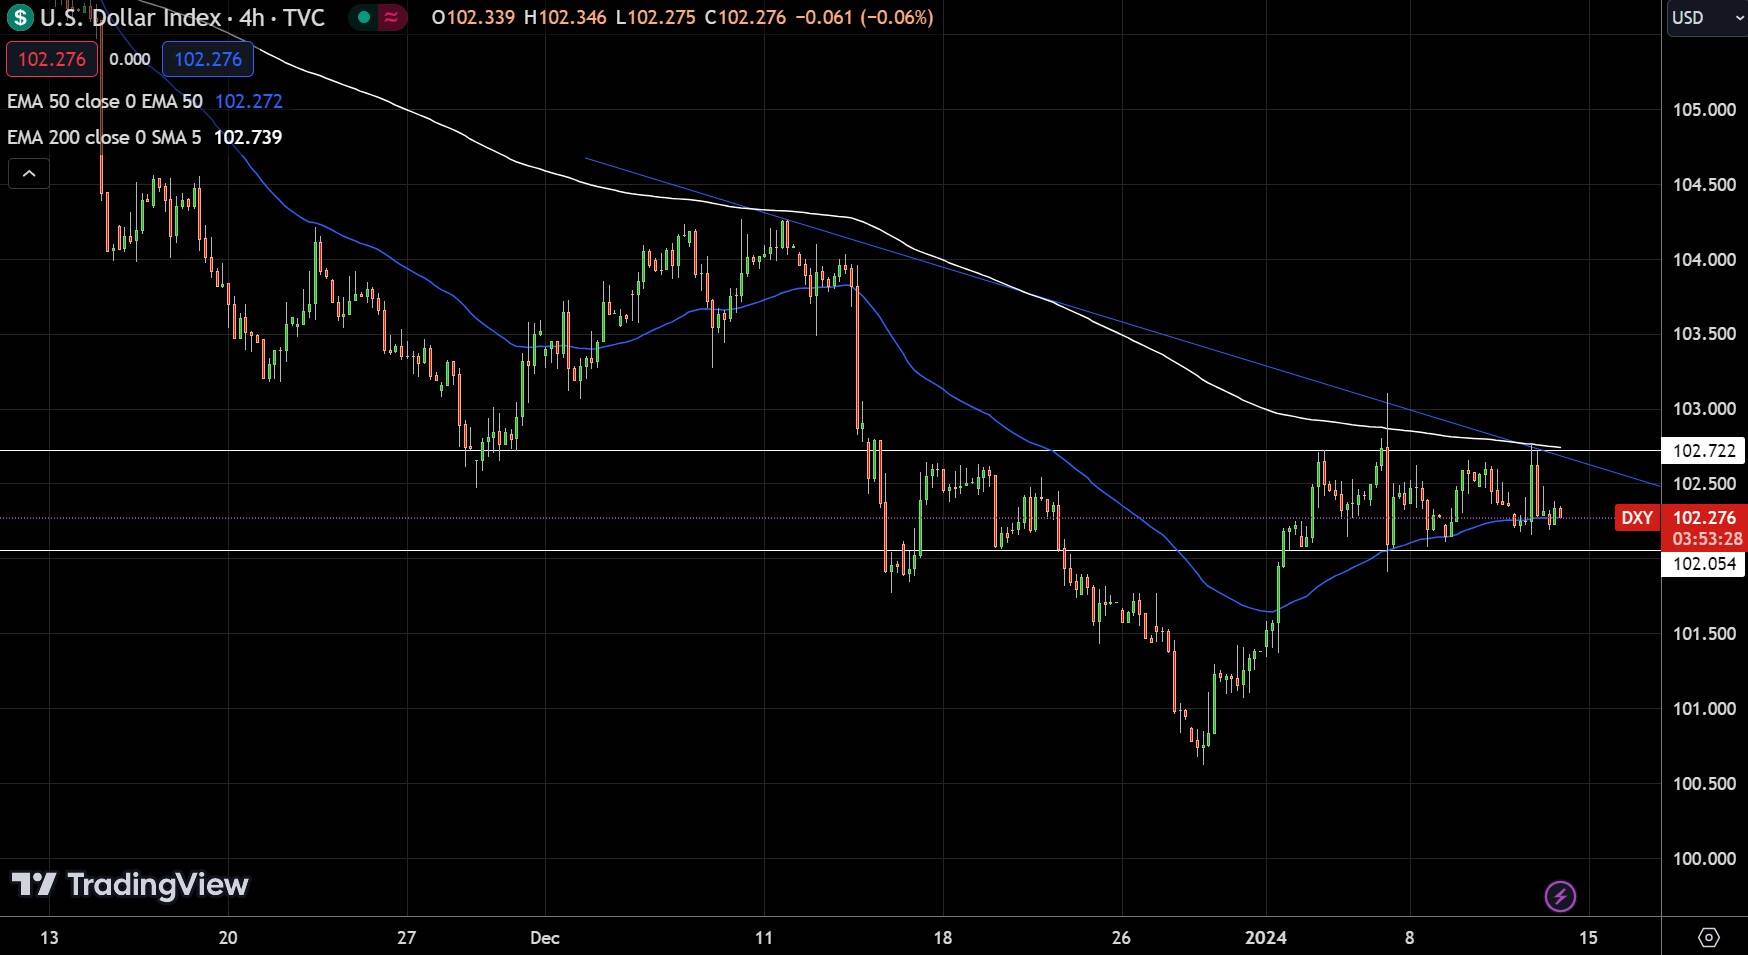
Dollar IndexThe Dollar Index is currently exhibiting a consolidation pattern, trading around the 102.276 level, as indicated by the flatlining near the 50 EMA (102.272). The 200 SMA (102.739) suggests a resistance point above. The Index’s recent performance shows a struggle to find direction, maintaining a close range without significant momentum. The convergence of the 50 and 200 EMA may suggest a potential bearish crossover, hinting at possible upcoming downward pressure.

EUR/USD Technical Forecast

EUR/USD Price Chart - Source: Tradingview
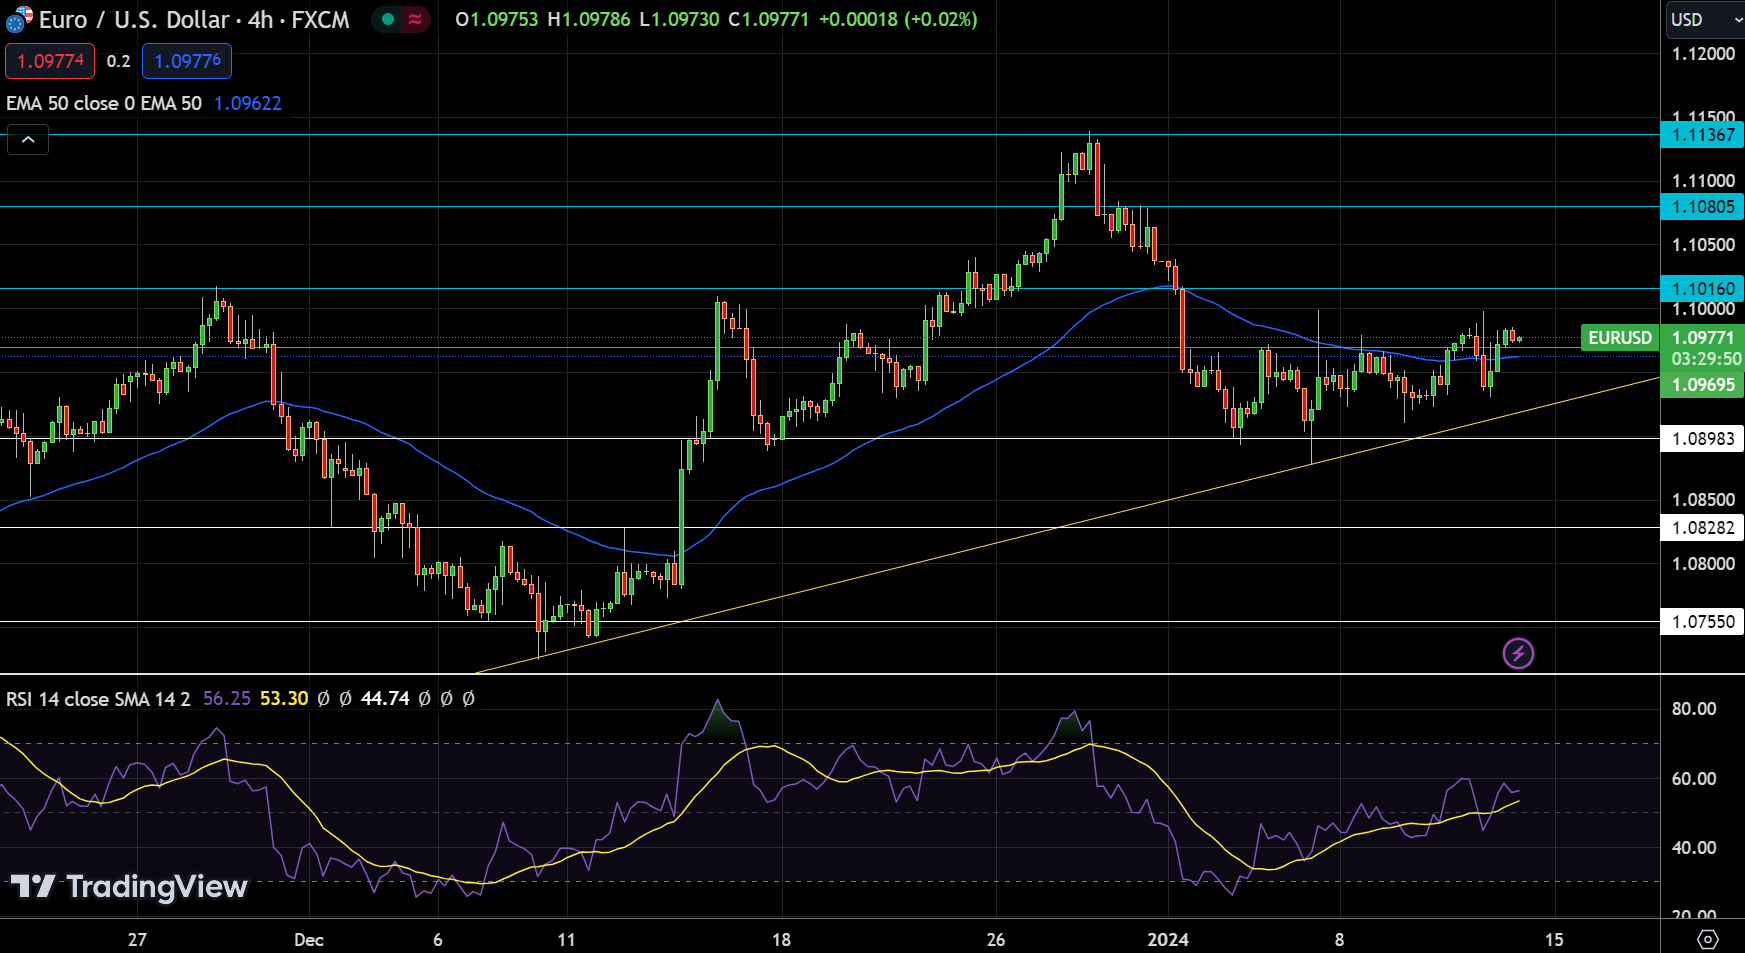
EUR/USD Price Chart – Source: TradingviewThe EUR/USD pair on Friday recorded a modest increase, trading at 1.09771, up by 0.04%. The pair’s pivot point stands at $1.0970, with immediate resistance levels at $1.1016, $1.1081, and $1.1137. Support is stronger at lower thresholds, specifically at $1.0898, $1.0828, and $1.0755.

The Relative Strength Index (RSI) is at 56, indicating a slightly bullish market sentiment. This is corroborated by the pair trading just above the 50-Day Exponential Moving Average (EMA) of $1.0968, suggesting a short-term upward trend.

An observed upward trendline, combined with the 50 EMA, supports a buying trend above the 1.0950 mark. Consequently, the EUR/USD outlook appears bullish above $1.0950, with potential to test higher resistance levels in the short term.

GBP/USD Technical Forecast

GBP/USD Price Chart - Source: Tradingview
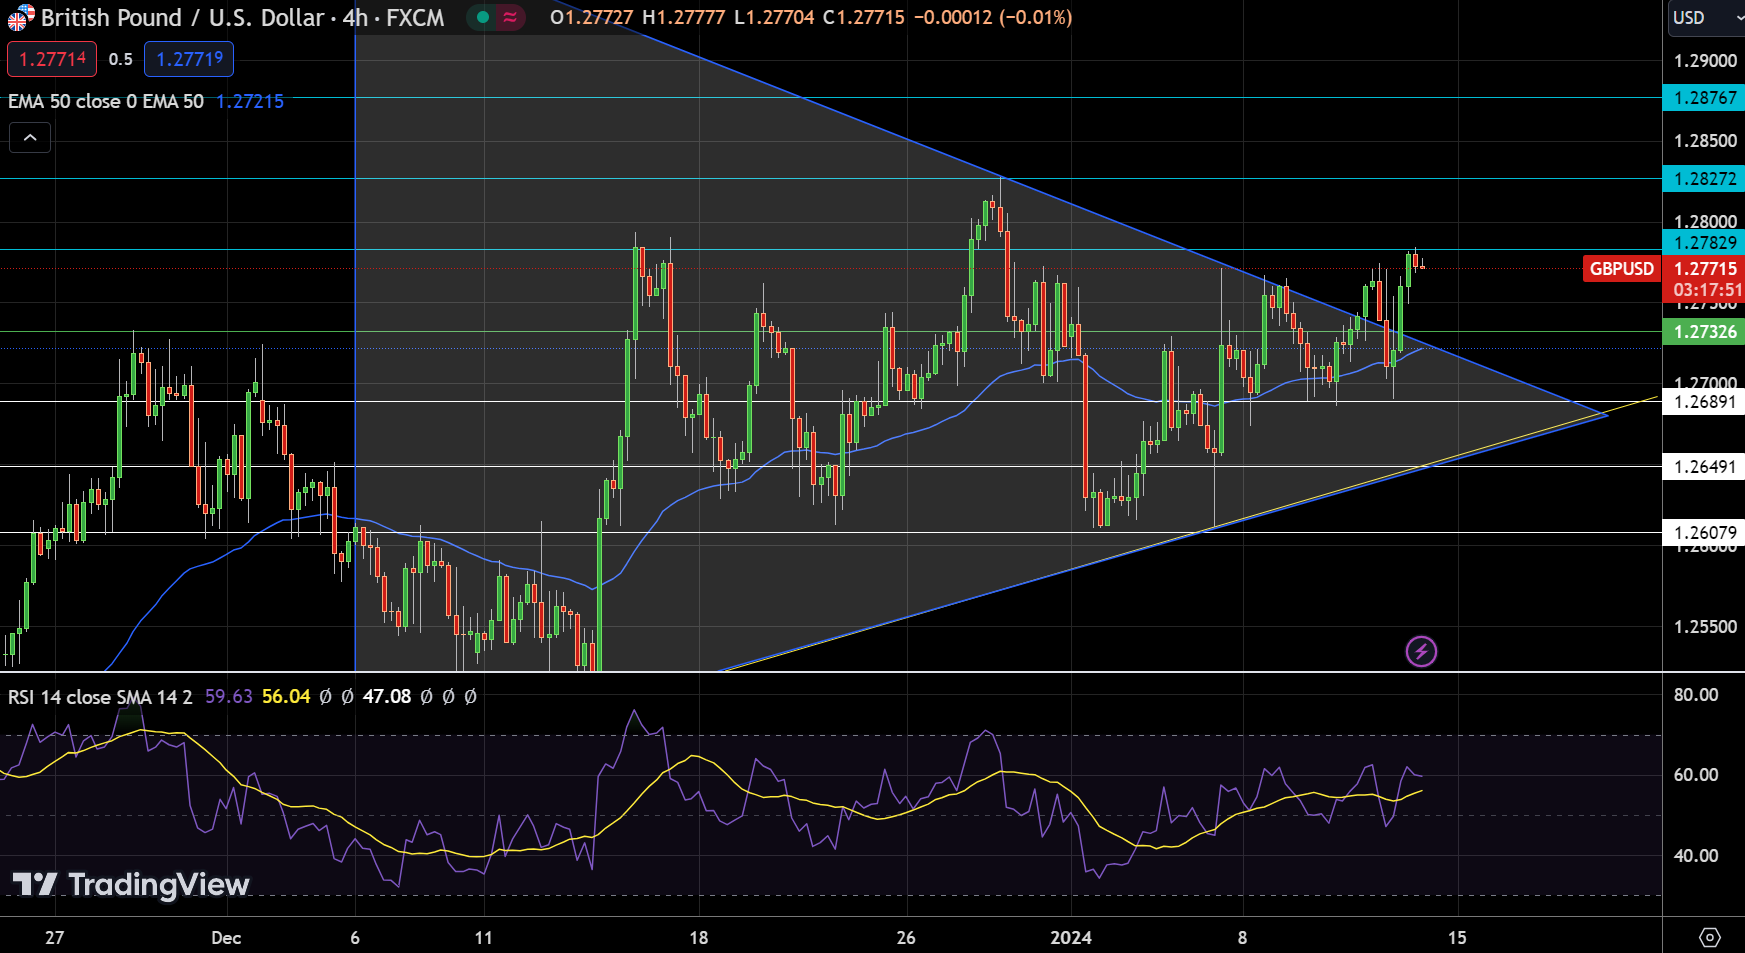
GBP/USD Price Chart – Source: TradingviewOn January 12, the GBP/USD pair exhibited a slight uptick, trading at 1.27715, marking an increase of 0.09%. The pair’s pivot point is currently at $1.2733, with a series of resistance levels set at $1.2783, $1.2827, and $1.2877.

Conversely, support levels are identified at $1.2689, $1.2649, and $1.2608. The Relative Strength Index (RSI) stands at 59, suggesting a moderately bullish market sentiment.

This bullishness is further supported by the currency pair trading above its 50-Day Exponential Moving Average (EMA) of $1.2755. Recent chart patterns indicate that the Sterling has breached a symmetrical triangle pattern around the 1.27326 mark, reinforcing a bullish stance above this level.

Therefore, the short-term outlook for GBP/USD is bullish above $1.2730, with the potential to test higher resistance points in the coming sessions.

XRP Price Targets $0.70 as Rare Trading Signal Emerges

XRP Price Targets $0.70 as Rare Trading Signal Emerges

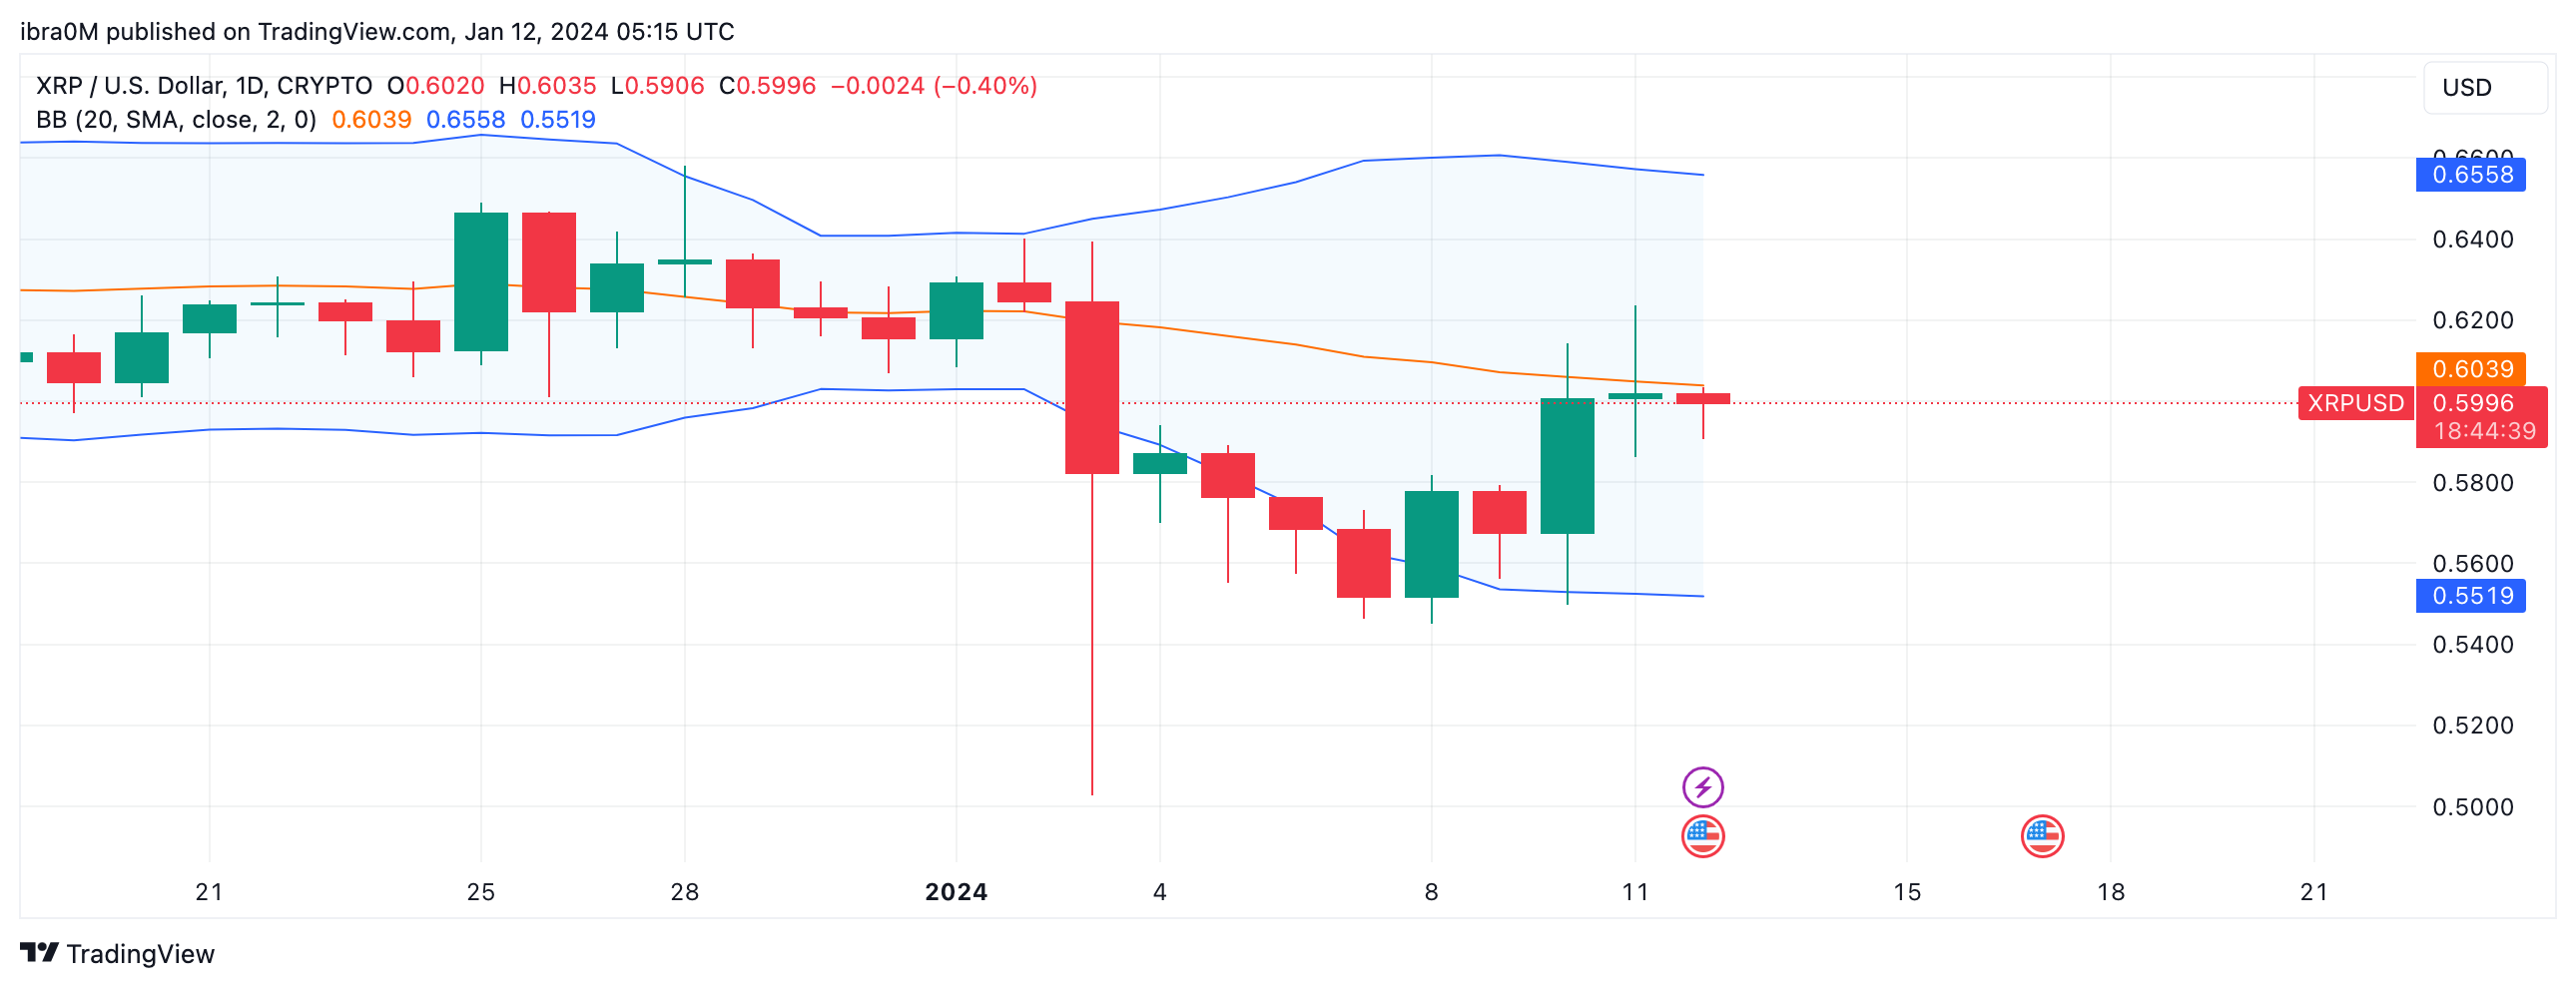
Ripple (XRP) price is trading at $0.60 in the morning trading hours GMT on Friday, Jan 12, marking a sharp 3% retracement from the weekly top of $0.62 recorded on Jan 11. On-chain analysis examines how a shift in trading disposition among current XRP holders could impact XRP price action in the days ahead.

Can XRP bulls capitalize on weakening selling pressure to push for a $0.70 retest?

Trading Derivatives carries a high level of risk to your capital and you should only trade with money you can afford to lose. Trading Derivatives may not be suitable for all investors, so please ensure that you fully understand the risks involved, and seek independent advice if necessary. A Product Disclosure Statement (PDS) can be obtained either from this website or on request from our offices and should be considered before entering into a transaction with us. Raw Spread accounts offer spreads from 0.0 pips with a commission charge of USD $3.50 per 100k traded. Standard account offer spreads from 1 pips with no additional commission charges. Spreads on CFD indices start at 0.4 points. The information on this site is not directed at residents in any country or jurisdiction where such distribution or use would be contrary to local law or regulation.

XRP Selling Pressure Has Weakened Since the Turn of the Year

XRP price has closed above the $0.60 for two consecutive trading days as the bulls look to erase losses from the Jan 3 liquidations. However, while the sixth-largest cryptocurrency has struggled to attract a steady demand, on-chain data trends reveal that the selling pressure has waned among current holders.

Santiment’s Mean Coin Age metric tracks the number of days recently-traded tokens had stayed in their previous addresses. This serves as a proxy for measuring the degree selling pressure among existing holders.

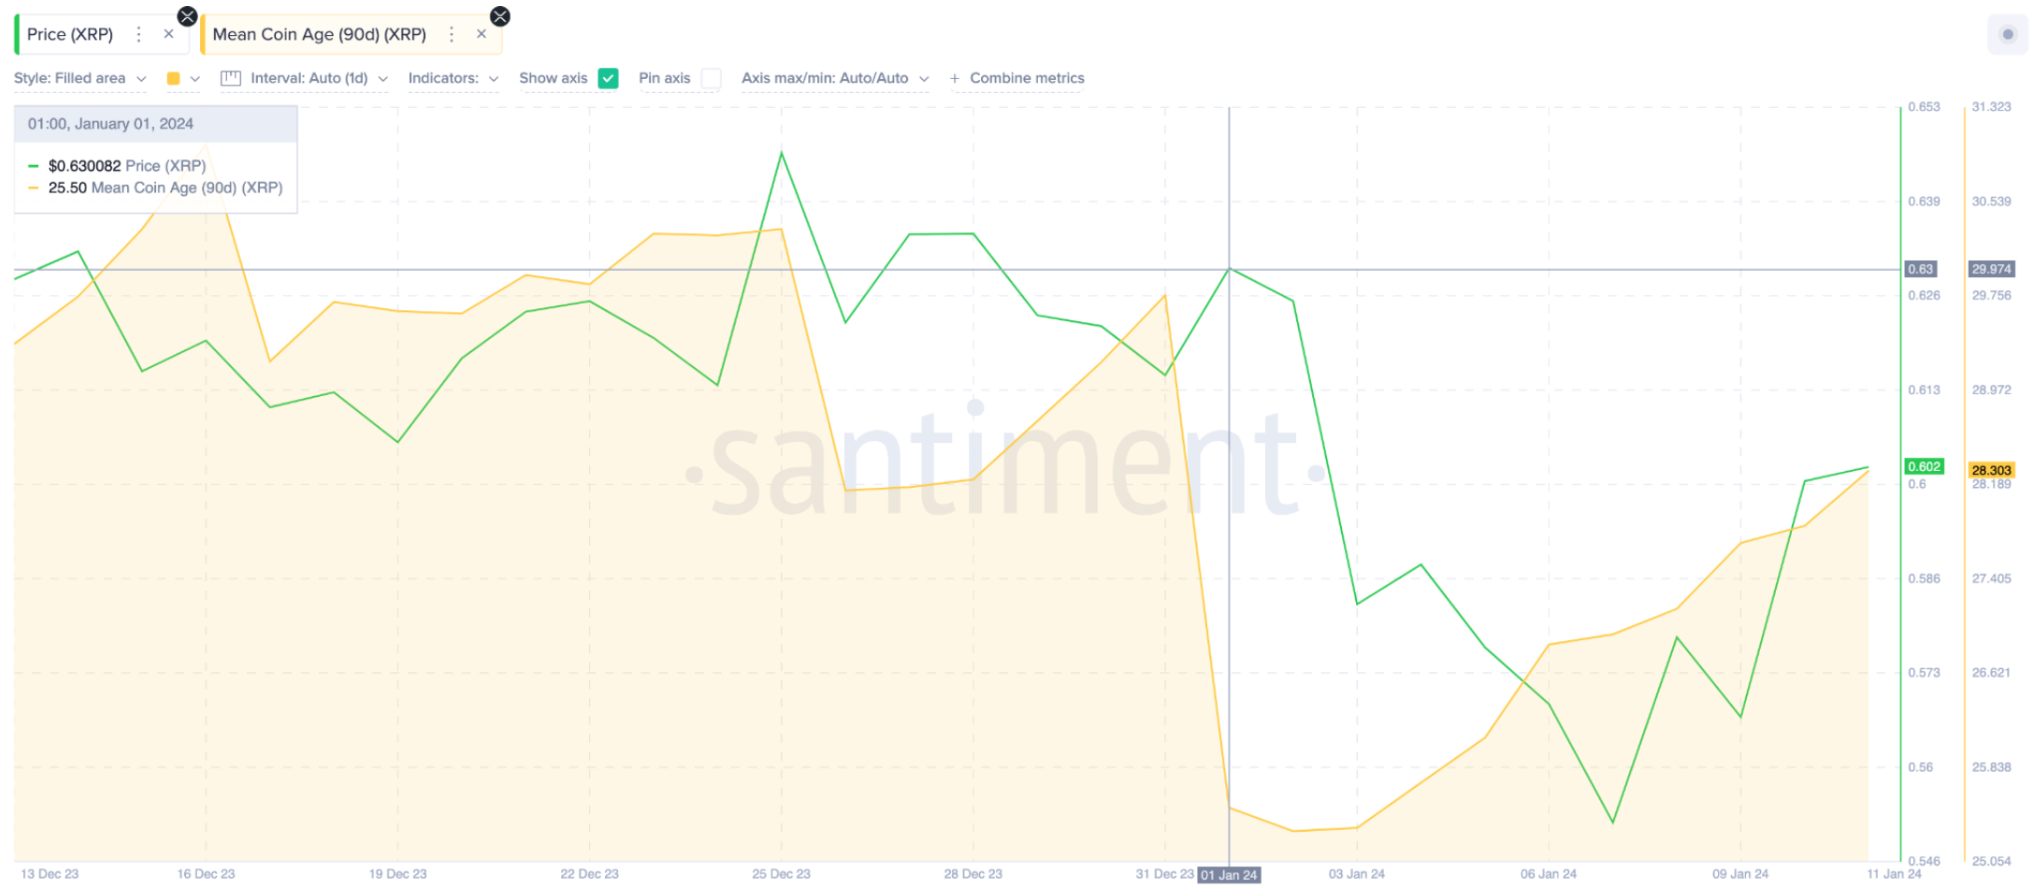
The chart below shows that XRP Mean Coin Age has recorded a noticeable 12% increase from 25.50 to 28.30 between Jan 1 and Jan 11.

Ripple (XRP) Mean Coin Age vs. Price | Santiment

Ripple (XRP) Mean Coin Age vs. Price | SantimentRising values of Mean Coin Age, as observed, is a signal that existing investors are holding their coin longer. As the portion of long-term holders increases during a price consolidation, it leads to a decline in selling pressure.

In effect, this rise in the Mean Coin Age makes a compelling case for XRP price to enter a breakout when the market demand improves.

XRP Price Forecast: The $0.70 Target Remains in Focus

Based on the vital on-chain signal analyzed above, there has been a significant drop in selling pressure across the XRP ecosystem since the start of 2024. With increased market demand, this puts XRP price in prime position for a potential upswing toward $0.70.

In the daily timeframe, Bollinger Band technical indicators also confirm this bullish outlook. It currently shows that with XRP currently trading at $0.60, it has sustained its momentum above the middle-band (SMA). This alignment suggests the bulls are still in firm control.

However, for the bulls to validate the $0.70 XRP price prediction, they must first scale the initial resistance sell-wall around the upper Bolllinger band at $0.66. If the bears selling pressure continues to weaken, XRP price could smash that resistance and head toward $0.70 as predicted.

XRP Price Forecast, Jan 2024 | Source: TradingView
Conversely, the XRP bears could invalidate this bullish stance if the force a downswing below $0.50 territory. But as seen above, the bulls will likely mount a support buy-wall at the lower Bollinger Band of $0.55 and avert significant losses.
Pound Sterling Latest: UK GDP Rose in November but Remains Lacklustre

Pound Sterling Latest: UK GDP Rose in November but Remains Lacklustre

UK GDP Shows Signs of Potential via Latest November Data

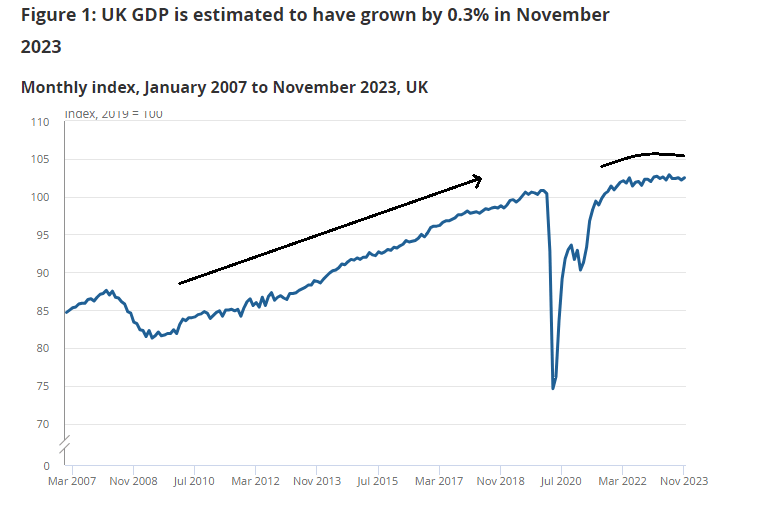
UK GDP rose more than expected in November 2023, mainly boosted by the services sector and marginal improvements in production output. However, the main concern is around how the economy fared over the final quarter of the year and whether seasonally higher spending over the festive season was enough to see the UK avoid a technical recession. Q3 GDP contracted by a meagre 0.1% while Q2 came in flat.

image1.png

The longer-term picture reveals massive challenges to growth – something the Chancellor of the Exchequer Jeremy Hunt sought to address in his Autumn Statement last year. The UK economy has struggled to grow at its pre-Covid pace, with growth petering out in 2022 and 2023 it would appear.

image2.png

Pound Sterling Little Changed but Holds Recent Gains Heading into the Weekend

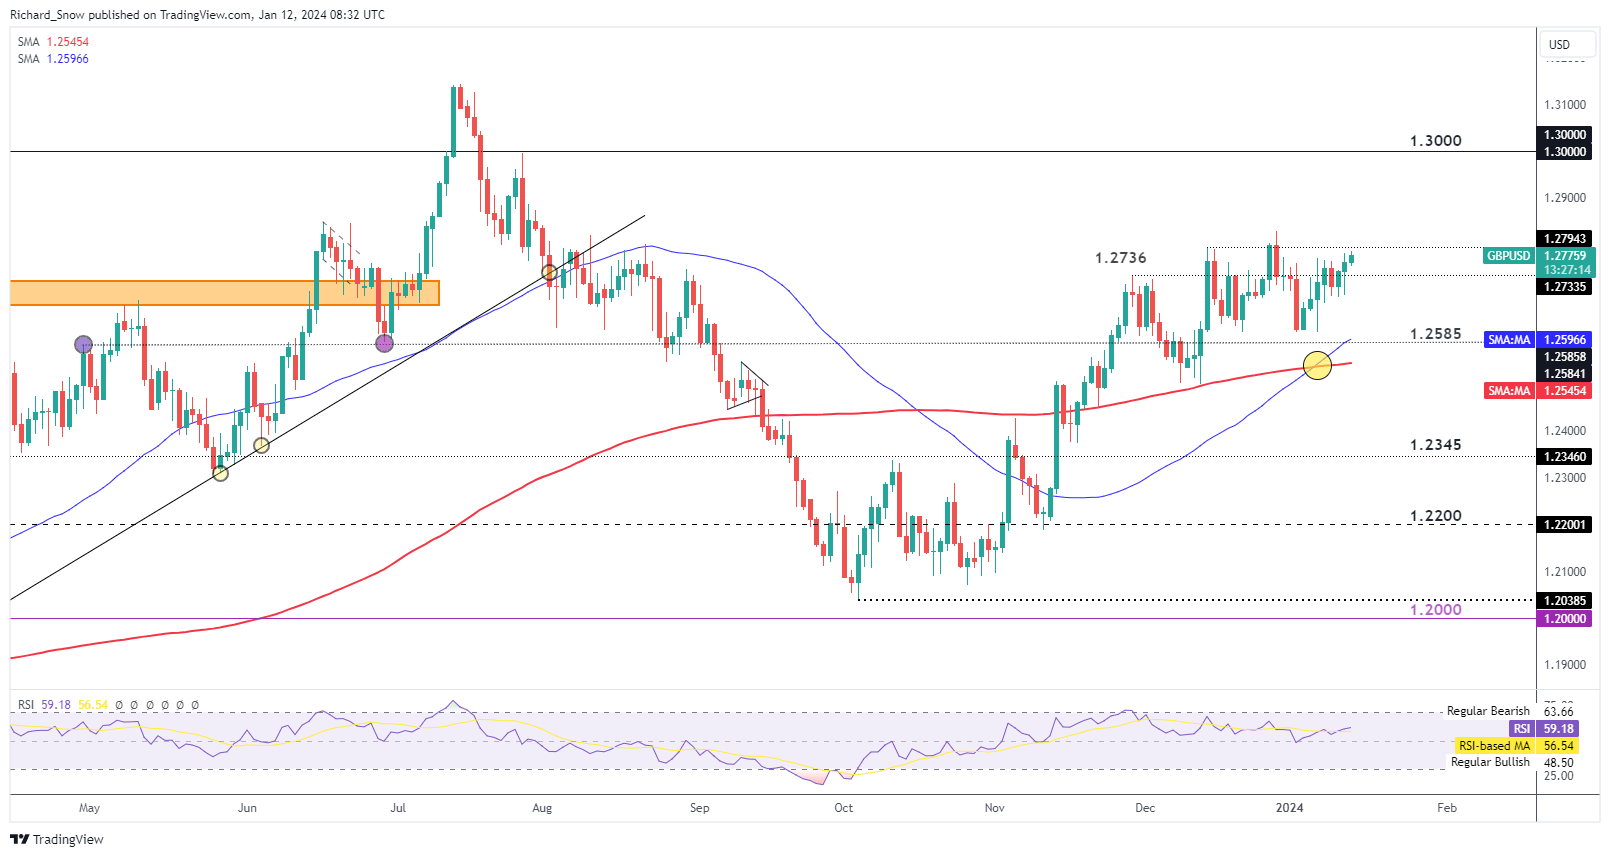
The pound was little changed against the US dollar but rose slightly on the back of the data. GBP/USD has climbed higher this week but still appears to be lacking the necessary momentum that would see the pair retest the late December swing high.

However, the golden cross and near-term direction suggests it may simply be a question of time. Constrained USD upside has helped cable grind higher – something that was evident after the higher US inflation print yesterday that failed to result in a sustained move higher for the greenback. Next week it’s the UK’s turn to release inflation data for December alongside jobs data for October (Employment change) and November (Unemployment rate).

GBP/USD Daily Chart

image3.png

Source: TradingView, prepared by Richard Snow

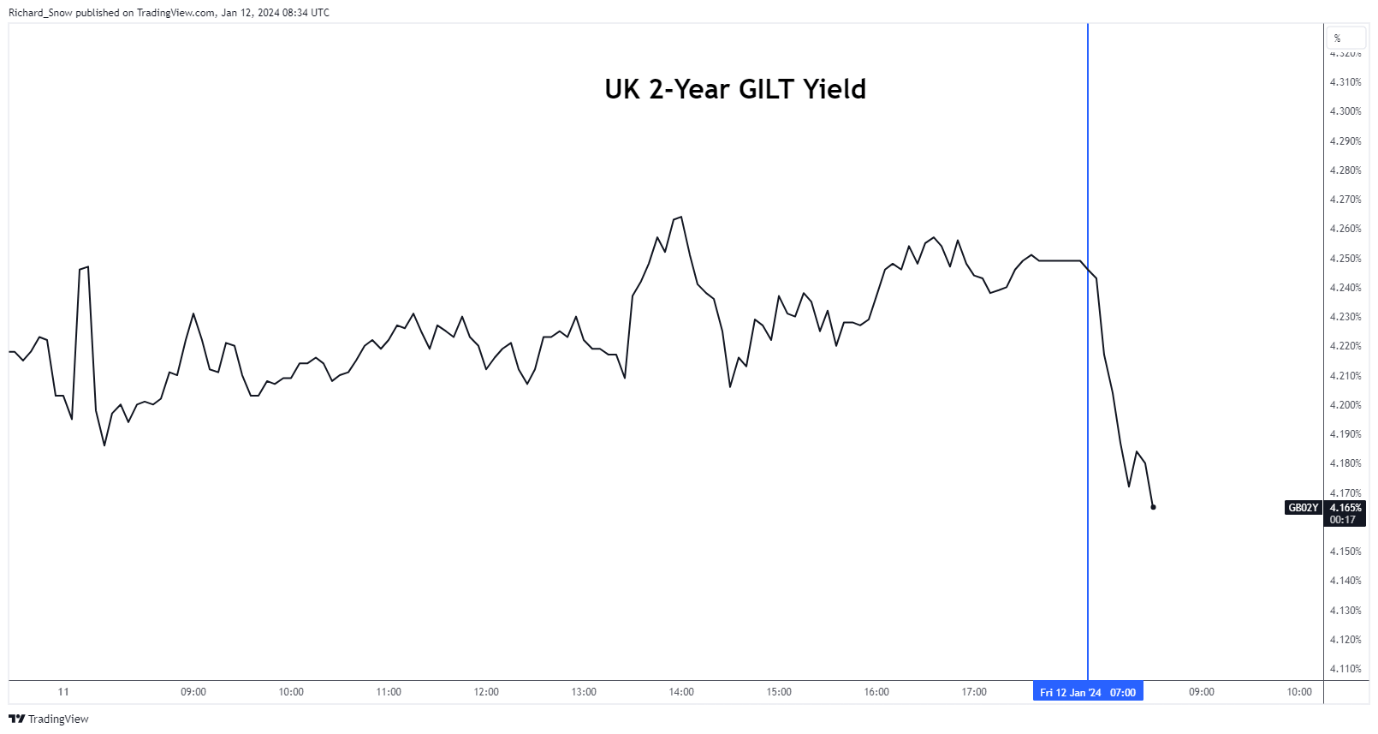
UK Gilt yields dropped after the data release as bond market participants played down the significance of the month on month beat. UK interest rate expectations had initially held off on large rate cuts in 2024 but has more recently approached that aggressive estimates seen in the US and EU.

UK 2-Year GILT Yield (5-Min Chart)

image4.png

Source: TradingView, prepared by Richard Snow

In other news the UK and the US conducted a joint strike against Houthi military targets in response to attacks on ships in the red sea, elevating the possibility of a geopolitical relevance in sterling but for now that appears contained.

Price Action Support and Resistance

Price Action Support and Resistance

Price Action Support and Resistance

As we look at throughout our education section there’s a plethora of ways to find support and resistance levels. Fibonacci is a popular tool and psychological levels are a significant point of interest. But, if markets don’t acknowledge that support or resistance – what is its point? There isn’t one, right? The only utility for support and resistance is the ability to highlight something that may happen, while allowing the trader to adopt an objective framework for their own activity within a market.

Price action swings can confirm support or resistance levels. Or – they can set the levels themselves if there’s been a significant amount of reaction at a particular price. If you’re watching the .8000 level on AUD/USD, and you see that price runs up to this value, and then finds sellers, you can then walk away knowing that not only is .8000 a level of possible resistance because it’s a psychological level -but that traders and market participants agree and have voiced that opinion with their capital. And as prices drop, more sellers can jump onto that bandwagon, and buyers, on the other side, are getting less and less bullish as price falls, thereby allowing for a further slide.

But, that level of .8000 would not have been resistance if market behaviors hadn’t changed when it came into play. It’d have been a mere speed bump on the way to higher prices as bulls pushed through.

We looked at this concept in our article on price action wicks, highlighting how intra-candle reactions can show the trader a considerable amount of information. It can highlight important levels on longer-term timeframes while removing some of the noise that’s ever-present on shorter-time frames. But, it’s the reactions as shown by wicks that highlight support and resistance levels that traders can use in their approaches.

How to Find Support and Resistance via Price Action

While price action presents a somewhat objective framework for traders to work with, identifying workable zones of support and resistance requires a bit of subjectivity.

The key is to find the areas or price levels in a market where behaviors have changed in the past, thereby highlighting the potential for change in the future. That’s not to say that support will always hold or that resistance will always bring sellers into the picture – but it does highlight areas where traders can look to impart strategy.

There’s a few different types of support and resistance that can be gleamed from price action, as well, which we’ll look at below.

The Touch and Go Long Wick

This is a popular one in fast markets. If some form of capitulation can show, it’ll often stick out in the form of a long wick. The wick of course highlights intra-candle reversals and if this is also matched with an engulf, that can be a powerful indication for near-term momentum. But, for purposes of support and resistance merely the top or bottom of the wick is needed.

In our AUD/USD example above, there was a long wick highlighting that reversal off of the .8000 level. But, even before that there was another as support, highlighting a reversal off of the .5500 level. While support technically did not penetrate the .5500 level, the fact that buyers stepped in 9 pips early shows that there was some defense going on at that price, with buyers ready to step-in before the level even came into play. This would also show that buyers were somewhat aggressive here, looking to buy even before the big figure was tested through.

In both cases identified below, strong continuation followed.

AUD/USD Weekly Chart: Long Wick Reactions – Support and Resistance
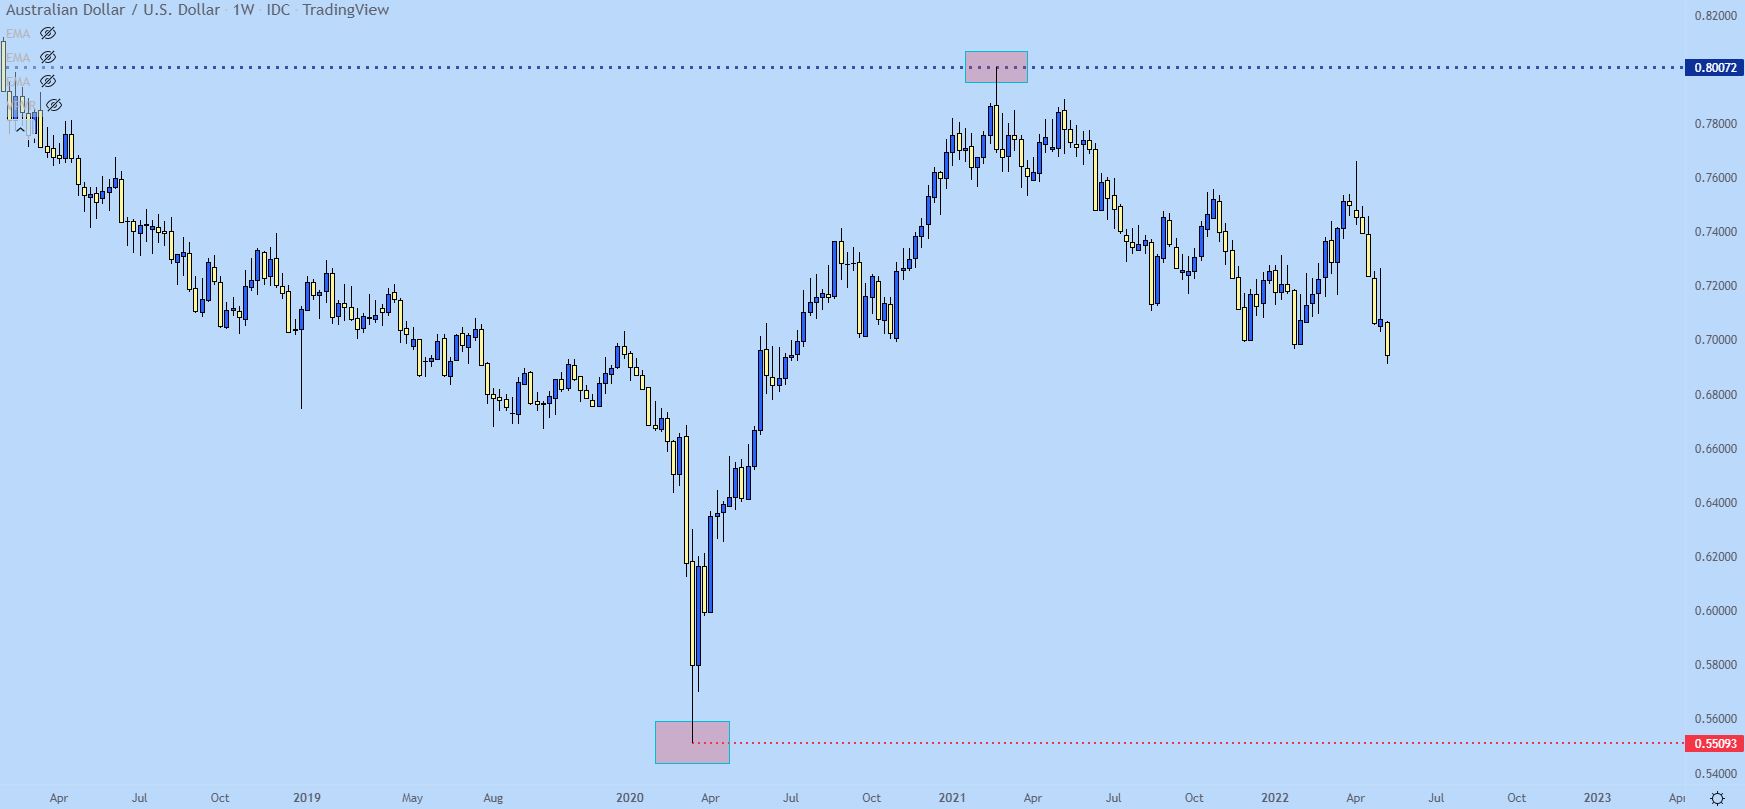
Chart prepared by James Stanley; AUD/USD Weekly chart, April 2019 – April 2022

So the above example shows two strong cases of what I’m referring to but, there’s another long wick on the chart that I haven’t touched on yet, and I don’t want this article to be just cherry picked examples of when things worked out well. So let’s dig a bit deeper…

On the left side of the above chart is a long wick highlighting a reaction, and I’ve added a purple box to this area on the below chart.

AUD/USD Weekly Price Chart
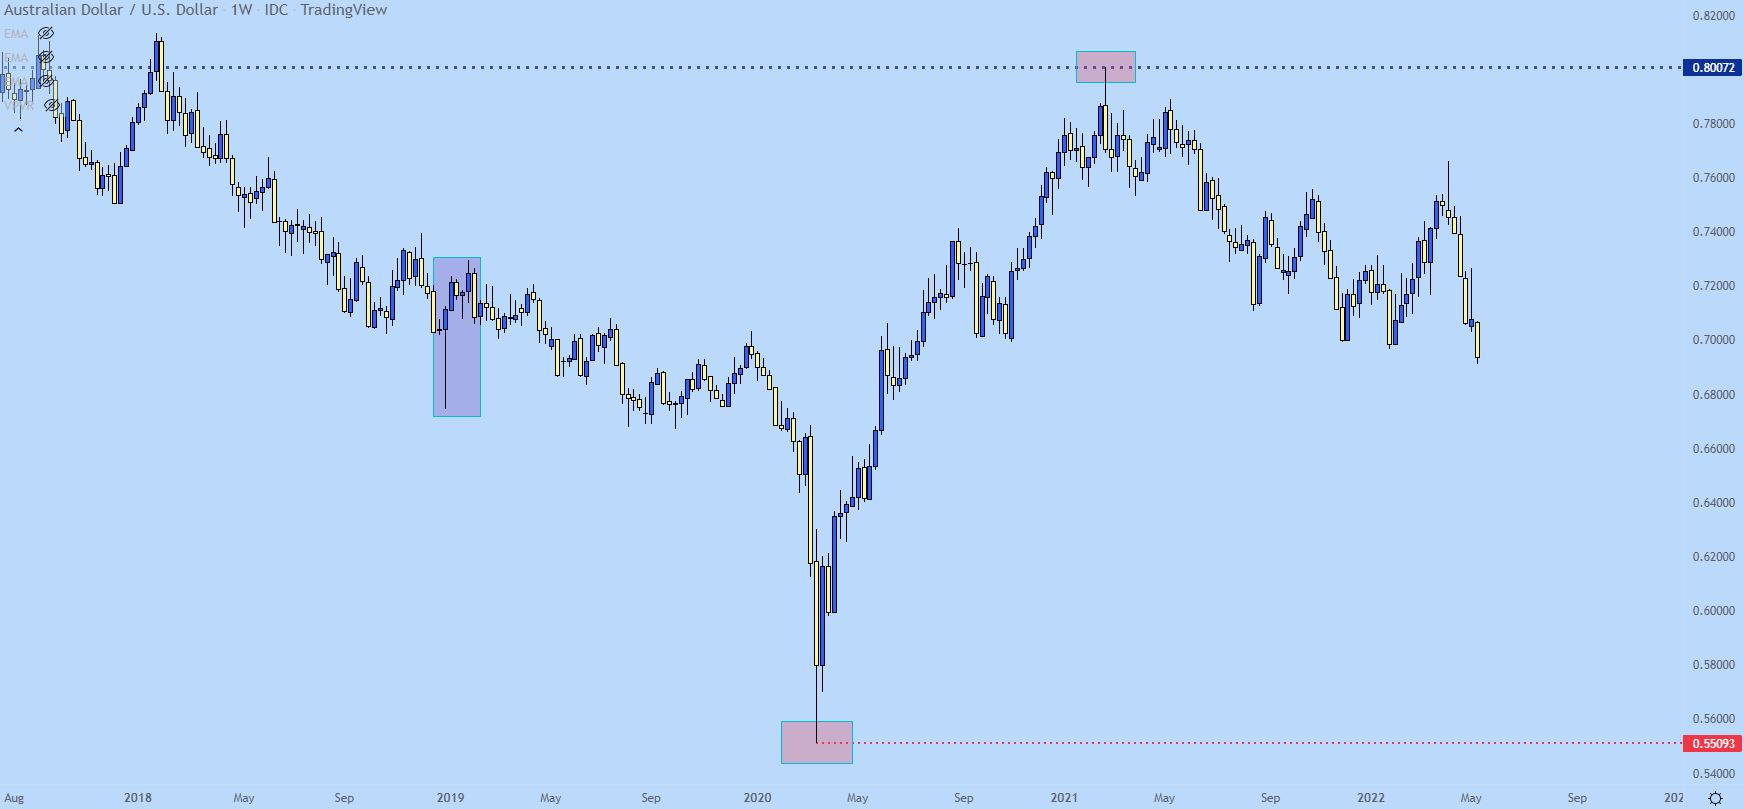
Chart prepared by James Stanley; AUD/USD Weekly chart, Aug 2017 – April 2022

Below I get a bit closer with that item and we’re essentially looking at a low point of the wick at .6743 that was followed by a strong reaction, as that weekly candle closed above the .7000 psychological level.

So, another way of thinking of that candle was that during the week, something bad happened, causing sellers to push prices below the major psychological level until, eventually, capitulation showed at around.6750. That was followed by buyers jumping in and responding to that sell-off, eventually erasing the entirety of the bearish move and then some.

Sounds pretty bullish, right? Well, for the next few weeks, buyers continued to push, eventually setting a fresh high just inside of the .7300 handle (.7295 to be specific). This highlights how long wicks can highlight reversals that could then continue for a bit. But, that’s not why we’re looking at this example. Instead, focus on the point of support as produced by the long wick at .6743.

That price comes back later in the year and for almost three full months – helps to set the low in the pair. I’ve added a dark red box around this area as that support played out.

AUD/USD Weekly Price Chart (Oct 2016 – July 2021)
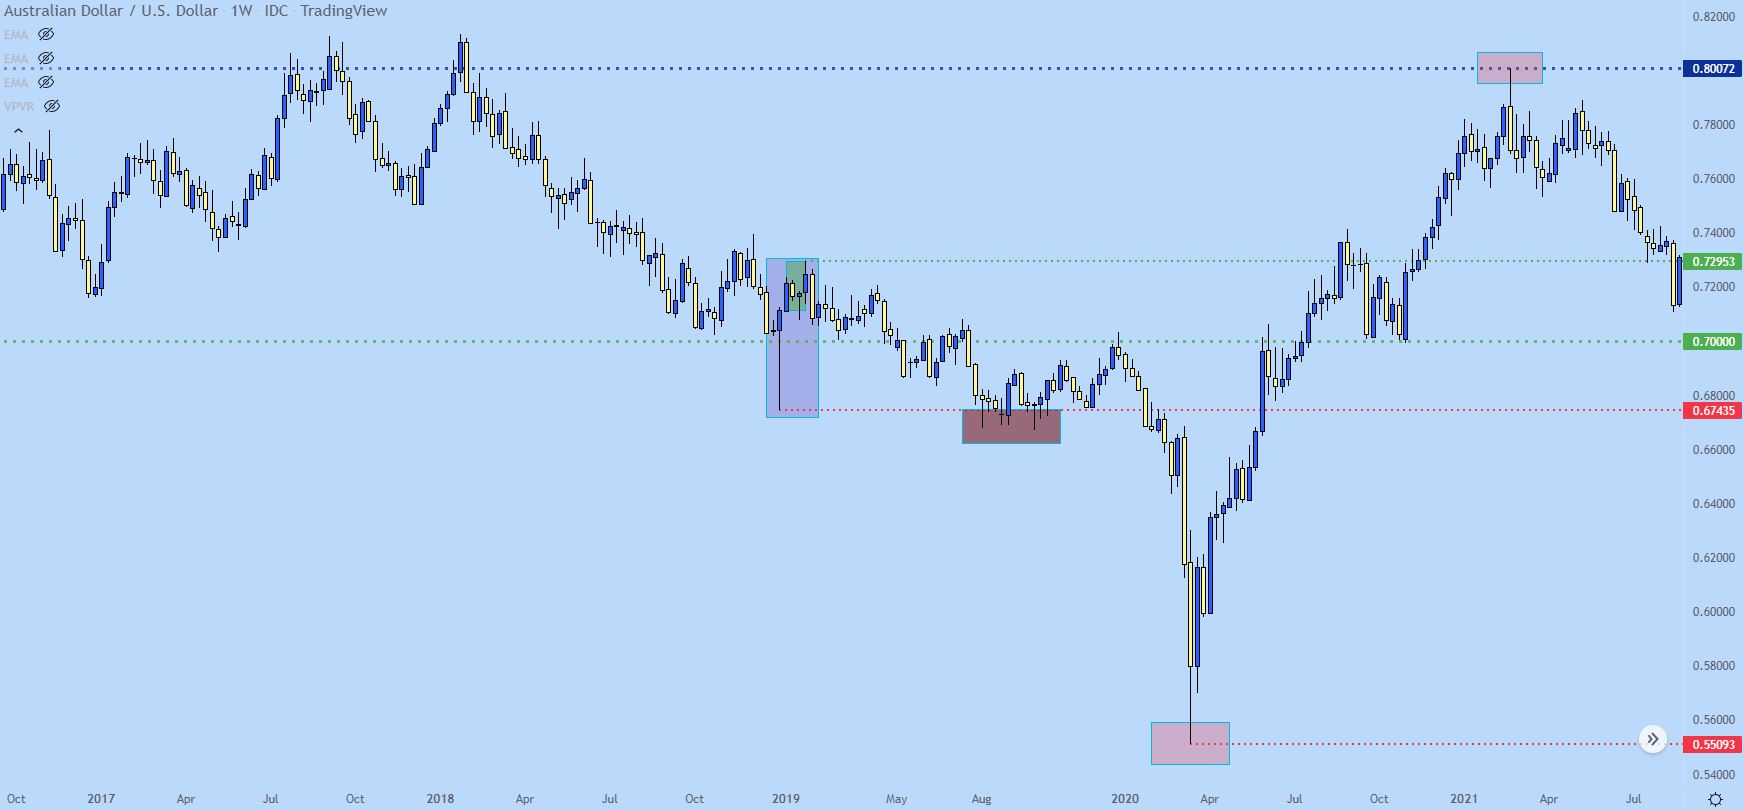
Chart prepared by James Stanley; AUD/USD Weekly chart, Oct 2016 – July 2021

So, in that above example, support as produced by the long wick helped to hold the lows after coming into play in August of 2019. And, to be sure, this is intel that can help traders, spotting support as sellers are pushing more and more, as indicated by the lower highs that showed up between the initial test at .6743 and the latter collection of wicks on the weekly that held the low at that same spot.

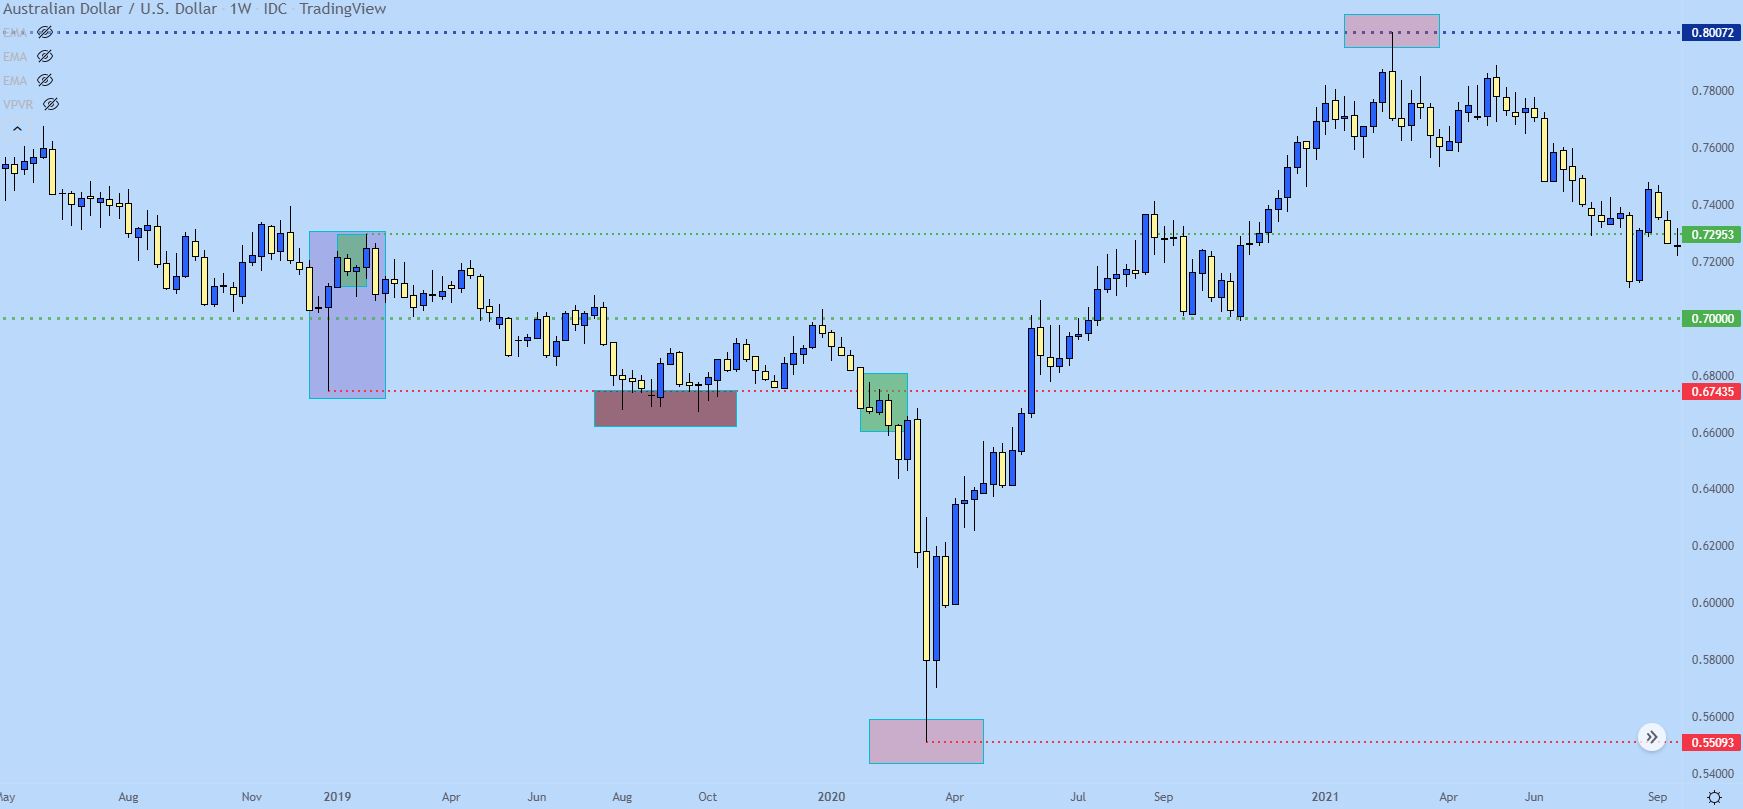
But the more exciting setup off of this zone didn’t show up until February of 2020. I’ve added a green box around this area on the chart and during this three-week-period, you can see where prices gyrated around resistance at that prior support level. That led to a breakdown with another fresh low, that was followed by a brutal move of more than 1,000 pips. And the reason, given the timing, was covid, as that was getting priced-in to markets. But, as you can see from the technical backdrop the ground was set for a breakdown and covid just ended up being the reason.

Focus on the green box in the below chart, highlighting the importance of that prior long wick in a) setting support and then b) setting resistance as the breakdown took hold.

AUD/USD Weekly Price Chart
The Grouping or Collection of Wicks in Tight Proximity

This gets a bit more subjective but can be particularly important on longer-term charts.

When you see multiple wicks reacting around the same vicinity, you have an inflection. This is a pretty clear sign that there’s a line in the sand that’s bringing buyers or sellers into a market. Will that hold? You’ll never know, all that you’ll know is that’s the price that’s bringing buyers/sellers into the market and that, in and of itself, can be usable to the trader.

Since we’ve talked about AUD/USD quite a bit already, let’s keep the focus there.

After AUD/USD hit the big figure of .8000 in February of 2021, buyers were ready for a break. Price action had pulled back and support set-in around the same .7557 level that was in-play as support before the test at .8000. I’ve added a green box around this zone, but I’ve also added a red box, illustrating some very slight penetration of this level on the weekly chart that was met by reversal, as indicated by the underside wick on that candle. Over the next six weeks, prices rallied by more than 300 pips off of the lows as that support held, and it was a simple reference point from a prior swing on the weekly chart.

AUD/USD Weekly Price Chart
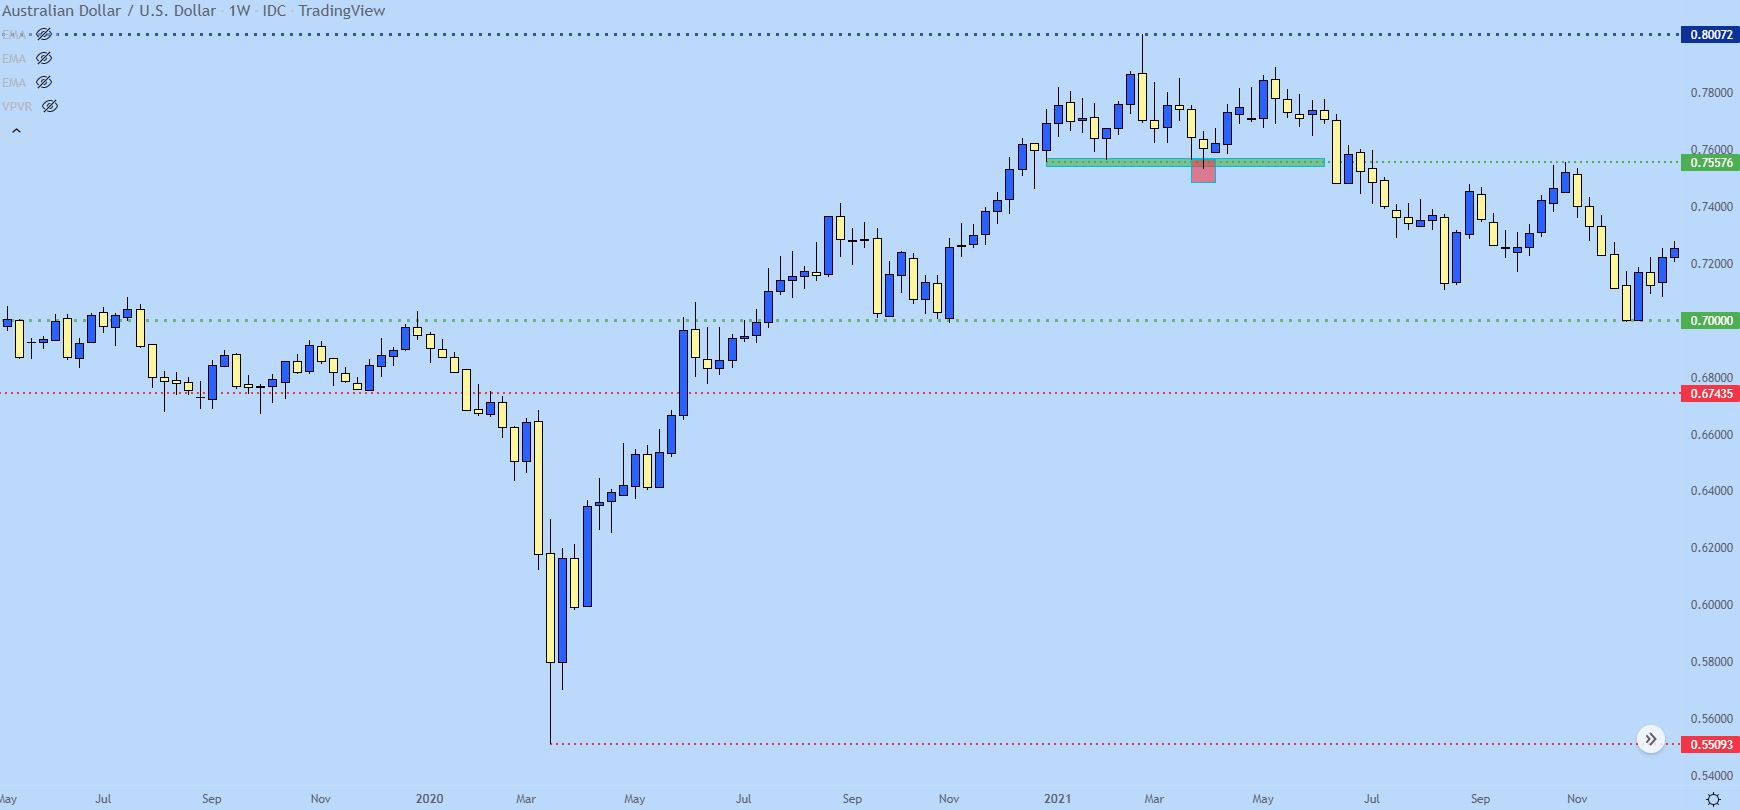
Chart prepared by James Stanley; AUD/USD Weekly chart, May 2019 – April 2021

Below I take an even closer view and I’ve added two purple boxes around the weekly lows that were in-play ahead of the .8000 test, after which price returned for support (which is in red).

AUD/USD Weekly Chart
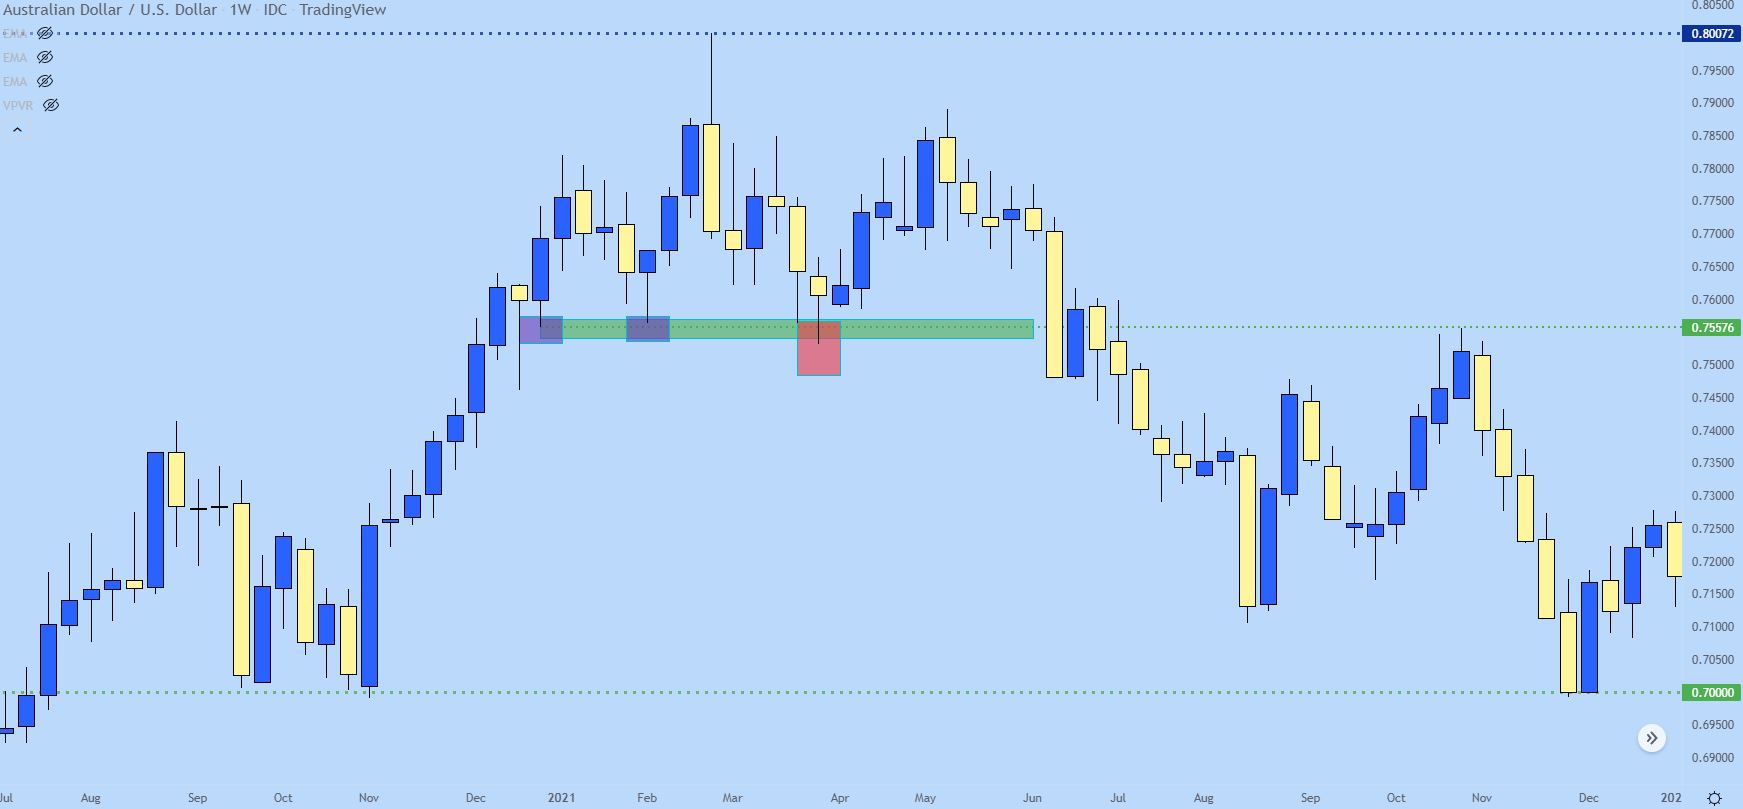
Chart prepared by James Stanley; AUD/USD Weekly chart, July 2020 – Dec. 2021

As you can see, that support test after the rejection at .8000 had helped to hold the lows, and price bounced and held above this level for the next couple of months. But, by the month of June, bears had enough, and prices quickly plunged below that area of support.

And there’s a couple of take-aways from this iteration: After the initial breakdown, prices still continued to probe that level for resistance, as indicated by the weekly wick highlighted in purple on the below chart.

But, perhaps more importantly, that same price came into catch the high later in the year, and this is highlighted in orange. That resistance inflection led to a steep fall, with prices dropping all the way down to the .7000 figure.

AUD/USD Weekly Price Chart
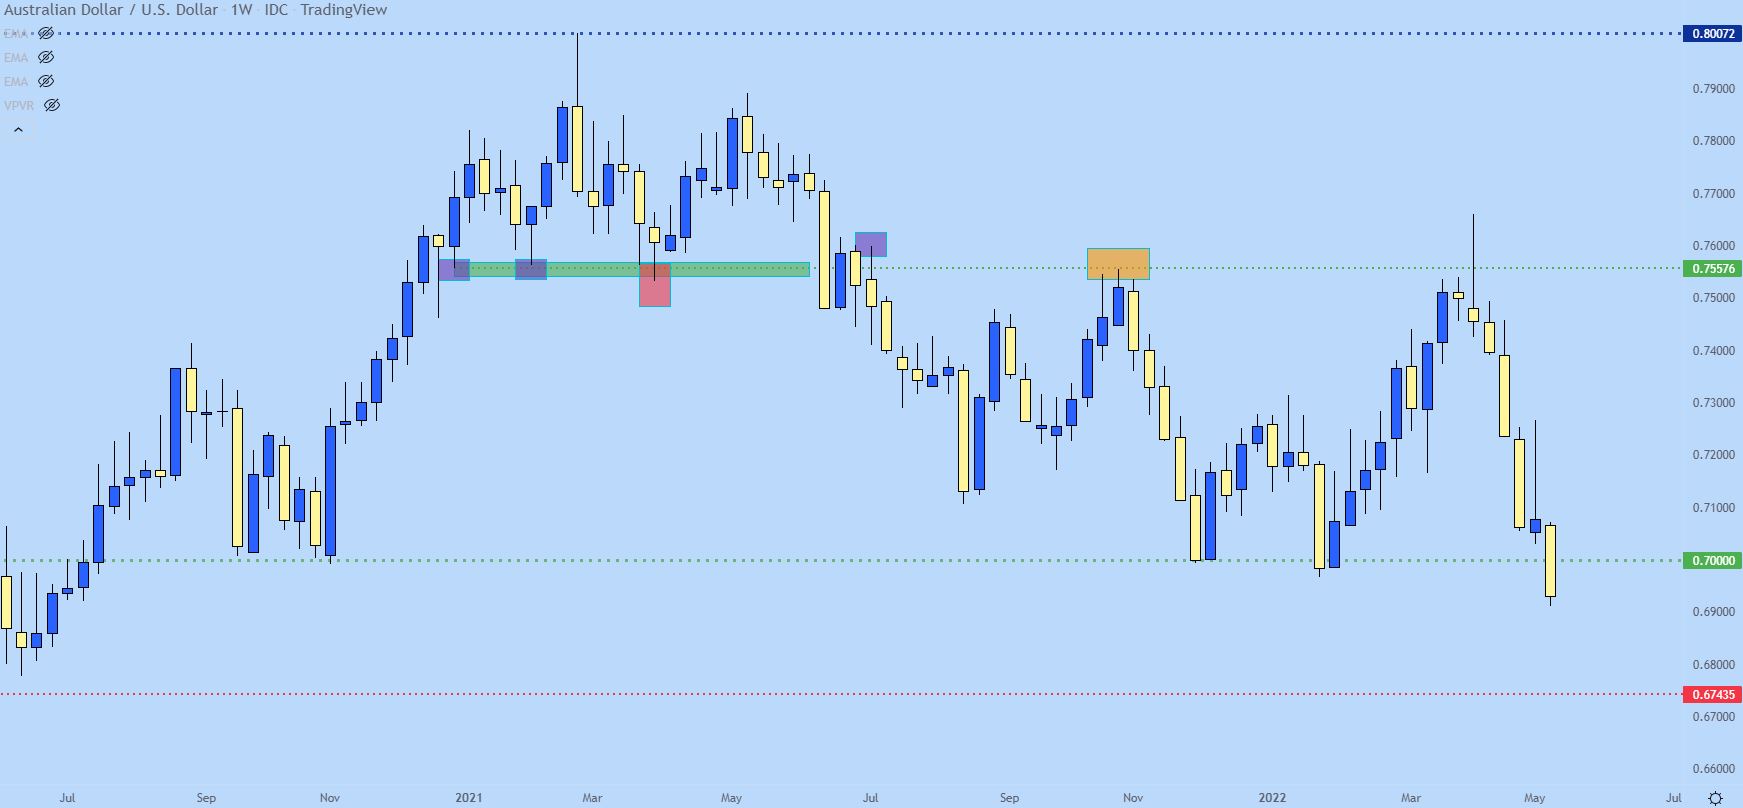
Chart prepared by James Stanley; AUD/USD Weekly chart, July 2020 – May 2022

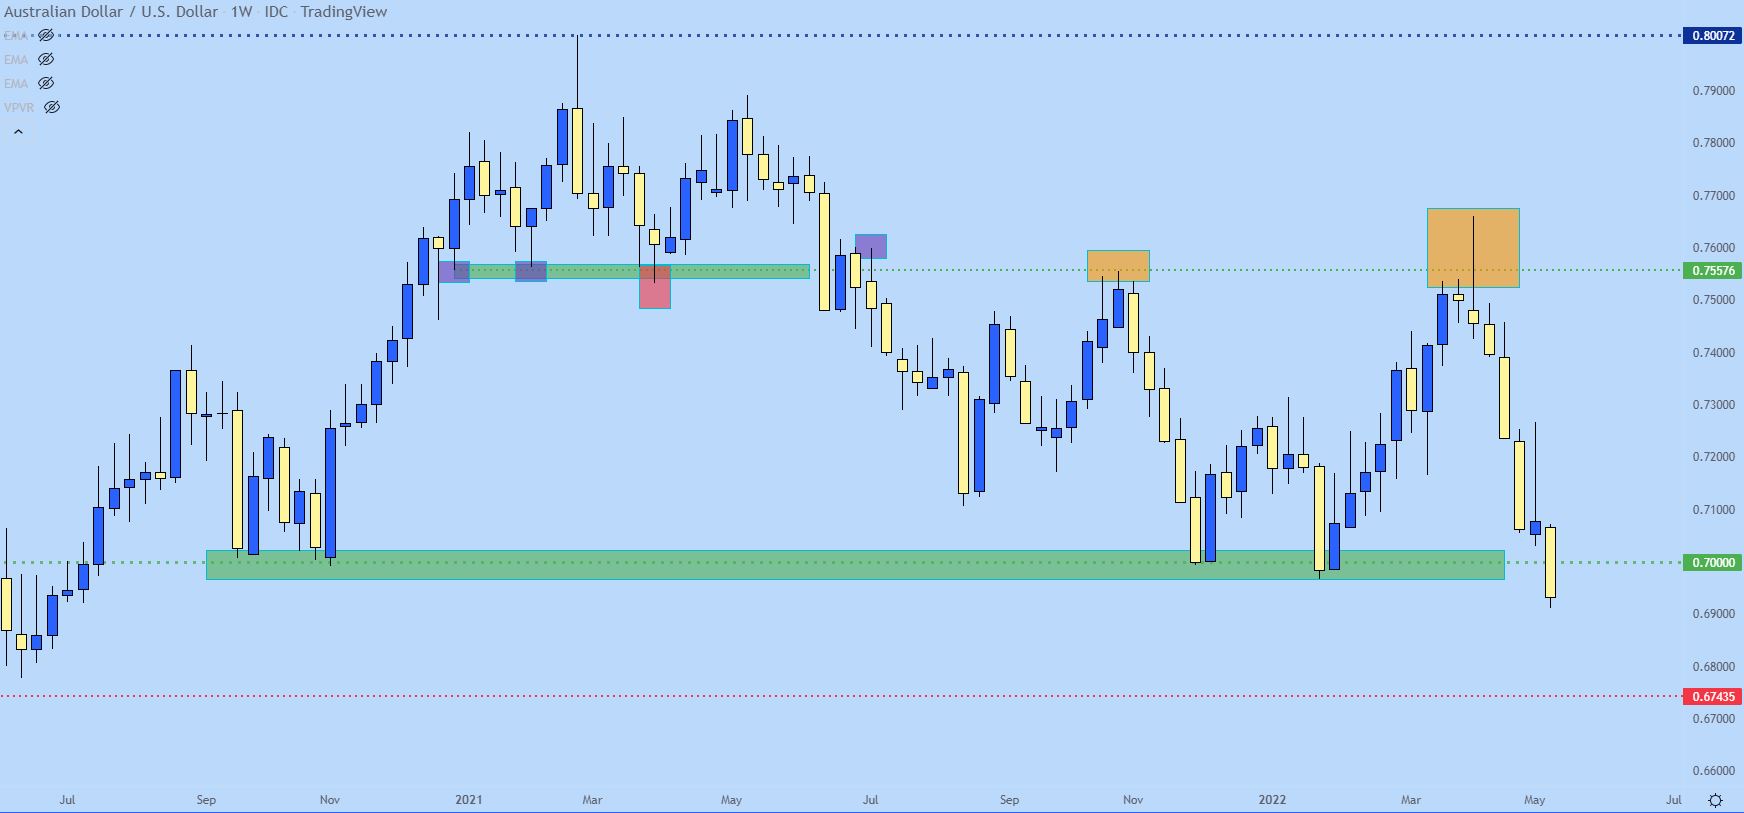
The .7000 big figure came in as important, helping to hold the lows after that bearish run and even coming back into the equation a couple of months later. This showed a collection of reactions at a similar spot and while this may not have taken the form of long wicks, the tight proximity with which this support had priced-in allowed for traders to see it very clearly.

The corresponding bounce from that support ran into the same resistance level that caught the high previously – and this was even matched with a long wick – indicating an aggressive intra-bar reversal. After which sellers came back into the matter and finally took out that .7000 psychological level.

But the entire structure for this setup was taken from the weekly chart of AUD/USD, using only simple price action indications.

AUD/USD Weekly Price Chart
 

Simple Moving Average (SMA) vs Exponential Moving Average (EMA)

Simple Moving Average (SMA) vs Exponential Moving Average (EMA)

When considering the technical analysis tools to use in their charts, traders will frequently come by simple moving averages, or SMAs, and exponential moving averages, or EMAs. Both of these instruments can help market practitioners make sense of price and inform their entry and exit decisions. But how do these two indicators stack up against each other? In this piece, we’ll give the SMA vs EMA lowdown.

Simple vs Exponential Moving Average: An Overview

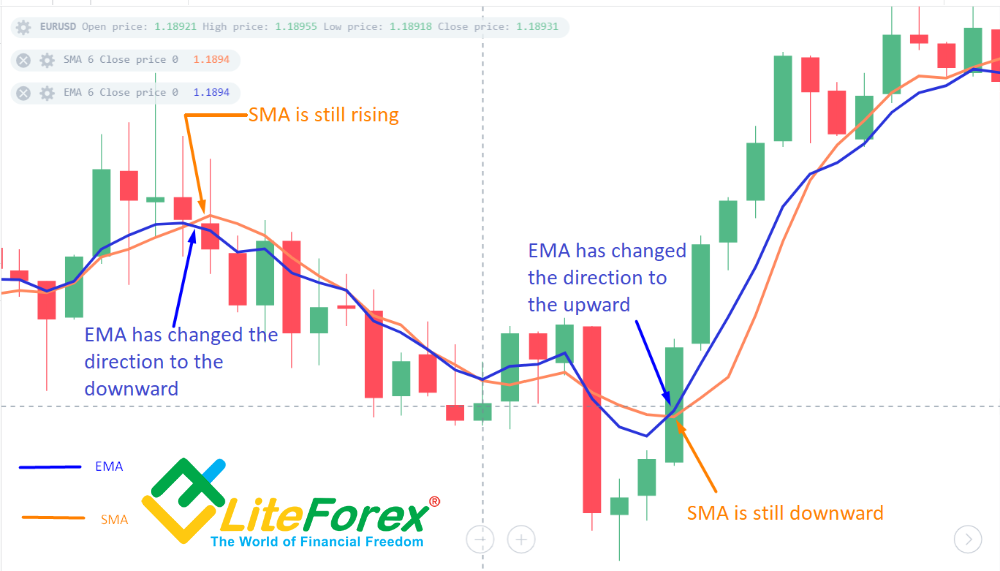
A Simple Moving Average (SMA) is a calculation of the average price of an asset or currency pair according to the number of periods in the range. It weights each candle and its corresponding closing price equally, with no one candle’s closing price given more significance than any other candle in the equation.

An Exponential Moving Average (EMA), however, while similar, gives more weight to the most recent candles, and so this type of moving average will react faster to the most recent trading activity. While at the outset this might appear to be the best way to go, it is important to keep in mind that whenever an indicator is ‘sped up’, it will be more likely to provide more random (false) entry signals. Most traders and trading entities such as banks and hedge funds will employ the use of SMAs.

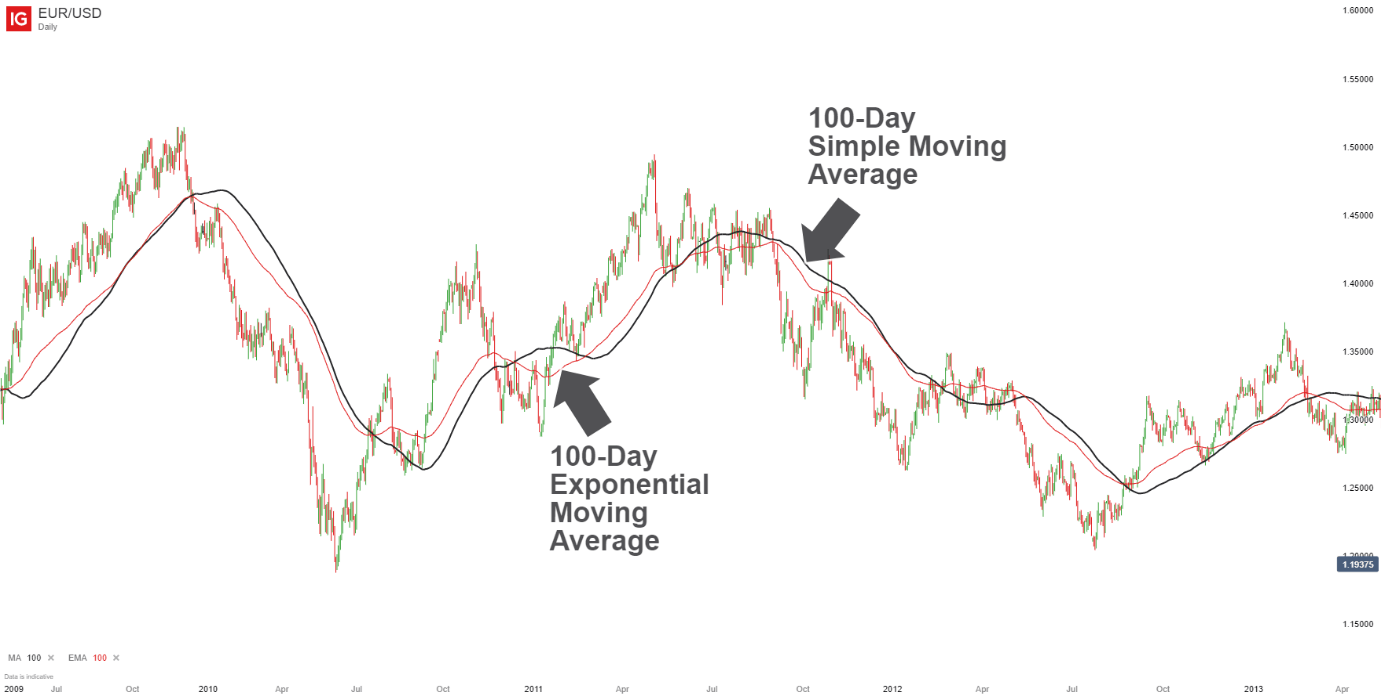
To see how these differences appear on a chart, take a look at the daily chart of the EUR/USD posted below.

Simple (SMA) vs Exponential Moving Average (EMA) on chart

Simple vs Exponential moving average: Which is better?

When it comes to the simple and exponential moving averages and the question of which is better, you can see that in the graphic above that there appears to be little difference between the two. Normally, the EMA will change sooner than the SMA because it emphasizes the more recent activity more than the older activity. But in this case there really is not much of a difference.

However, in general, the shorter the time frame and/or the more dramatic the price action, the greater the difference that you will see between the two MAs. Therefore, shorter-term traders might find the EMA more effective in implementing their trading strategies since it is more sensitive to the recent price movement.

New traders will play with both tools to find out which one they find to be better, and use that one in their trading approach. But the reality is that it is unlikely that one moving average will give you winning results if the other does not.

If you find that a switch from a SMA to an EMA turns a losing strategy into a winning strategy, it is probably your strategy that needs changing instead of the moving average. There is just not enough difference in the two to have that much of an impact in the results of a certain strategy. The 200-day SMA is popular for identifying the trend. If the market is above the 200-day SMA, the trend is considered to be up and if the market is below the SMA, the trend is considered down.

Short-term traders have made the 10-day EMA popular based on its use by some famous traders. But the only judge to what type of moving average to use is your account balance from month to month. If it helps your trading, then keep it – and if it does not help your trading, then look to replace it.

How to Trade Ranges

How to Trade Ranges

As we looked at in our previous article, the range market condition is often one of the more ignored conditions by new retail traders, and that’s generally due to the perception of capped potential. After all, if I’m trading a range and look to buy at support, then I should sell at resistance, right? Which would mean my maximum gain would be the distance between support and resistance.

In actuality this doesn’t necessarily have to be true because there are numerous ways to go about trading ranges or mean-reversion.

The general gist of trading ranges is that the trader is looking to buy at or around support in anticipation of prices rising or looking to sell at or near resistance with the intention of prices falling. And to be sure, that move can be capped by the other side of the market. But, there could also be greater continuation potential.

Consider for a moment, a trader looking to sell at resistance after prices have been range-bound; and when price does fall to support, the trader merely begins to scale-out of the position by closing a portion. There’s even the option of moving a stop to break-even at this point so that, worst case scenario, the market reverses – they still have some element of protection.

But – if the trader anticipates further falls, they can keep the remaining position open in anticipation of a breakdown through support. And if that does happen, well then the trader has held the range-based short entry into a fresh bearish breakout.

Using Price Action to Find Support and Resistance

As we look at in our price action sub-module, support and resistance from prior price movements can be helpful for traders and this is especially true for range-bound market conditions. With a range, the trader is, in essence, looking for support or resistance to hold as mean-reversion shows in that market. And one of the more common ways of finding support is by looking for areas on the chart that have already produced inflections.

The trader can then wait for evidence that buyers have entered around support or sellers around resistance, and this can be illustrated by candlestick wicks.

USD/CAD Four-Hour Chart

Chart prepared by James Stanley; USD/CAD four hour chart Jan 2022 – March 2022

One of the simpler methods that can be explained in this space is using an additional indicator to look for possible entries after the condition has been defined. So, as we looked at earlier with ADX, if ADX is below 20, the trader can then look for mean reversion entries. This should eliminate many reversal-like scenarios (since reversals are counter-trend movements) and it should also help to filter out trends.

On the below chart, I’ve attempted to illustrate how such a strategy can look. There’s two indicators on the bottom portion of the chart: On top we have the Average Directional Index and below that we have slow stochastics, as we looked at in our section on technical indicators.

The logic would be set so that if ADX is below 20, the trader can then look at taking signals from an indicator such as stochastic or CCI. On the below chart, I’ve identified bullish signals via stochastic crossovers with a blue line and bearish signals with a red line. When ADX goes back above 20, no signals are investigated.

EUR/USD Daily Chart

Chart prepared by James Stanley

Range Trading Summary

As you can see from the above graphic, such simple logic can help traders to locate and find ranges along with some usable information as to how they can work with them.

But, again, to reiterate, one of the more attractive reasons for range trading in general is the ability to manage risk, so that if support or resistance are broken, the trader knows relatively early that they strategy that they’re working with, well, it wouldn’t appear to be working.

Range trading is often ignored by new traders because these aren’t the market environments that one can dream on. If a range is going to hold, upside is going to be capped. And while there are ways that this can be harnessed, it’s not the Bitcoin-like movement that many are looking for when it comes to terms of volatility. But, for professional traders seeking out consistency and manageable risk protocols this can be a benefit, which is why experienced traders may seek out these ‘less entertaining’ market environments.

How to Become a Forex Trader & Build an FX Mindset

How to Become a Forex Trader & Build an FX Mindset

What does a forex trader do?

A forex trader takes long or short positions on currency pairs with the goal of making a profit. A forex trader is strategic, disciplined and always switched on to the markets. Whether focused on a technical or fundamental approach, or both, he or she will be looking to build an understanding of currency pairs’ behavior and set up profitable trades.

Forex trader symbols and currency market rates

In the 24-hour currency market, trading never sleeps, meaning there will always be action, although forex liquidity levels will peak and trough at certain points around the clock. Some traders may wish to operate in unsociable hours to put them in a position to capitalize on international markets.

What it takes to be an effective forex trader, by the DailyFX analysts

So what does it take to be an effective forex trader? From possessing a passion for the markets to having unshakeable discipline and more, here are the traits that will assist you as a forex trader from the horse’s mouth: our top analysts.

1) Have passion

“You must have a real interest – passion even – in whatever financial market/s you are going to trade” – Nick Cawley

When trading the foreign exchange markets, you must have a real interest and understanding of monetary policy, one of the main movers of price action. For example, if you are trading GBP/USD you need to be fully in tune with all Bank of England and US Federal Reserve policy moves and speeches – both drive the market. So aim to be on the same wavelength as the central bank/s, but don’t bet against them – they have big pockets and nearly always win.

2) Understand the macro drivers

“It’s vitally important for traders to know that all currencies can have many macro drivers at any given point” – David Cottle

The Australian Dollar is a primary example of a currency driven by a range of macro factors. It is often thought of as a ‘growth’ or ‘risk’ correlated unit – one which is likely to gain when the world feels better about global growth and struggle when the reverse is the case. While this is often true, there are a huge number of other possible drivers. Major commodity prices, Australian monetary policy prospects and localized political risk can all see it move against the general market grain at times.

In these days of highly correlated markets it’s tempting to separate currencies into ‘risk on’ and ‘risk off’ camps but this is far too simplistic.

3) Remember: It takes two to forex tango

“Currency pairs are driven by both sides of the equation” – Martin Essex

When trading currencies, a trader needs to understand what is happening in both relevant territories. For example, when trading GBP/USD, it’s advisable to keep up with the most recent Brexit news in addition to the latest on the US/China trade war. More generally, though, a good understanding of market trading is important, from stop losses to chart patterns; from market psychology to the role of central banks.

4) Exercise proper money management

“You can have the best forex trade ideas in the world and still lose if you can’t limit losses and capture profits” – David Rodriguez

Sound money management is the key difference between the hobbyist and the expert trader. To wit, real data from a major FX broker showed that its clients closed EUR/USD trades out at a gain 61% of the time, and yet lost money because the average winning trade was 48 pips while the average loser was 83 pips. That’s no way to make money, and that’s exactly why money management is the difference-maker between a hobbyist and a successful professional.

5) Have the right mindset

“Strong self-discipline is needed to follow a clear-cut game plan” – Paul Robinson

You have to be a self-starter, able to hold yourself accountable and learn from your mistakes; there will plenty of them. A love of markets and the process of trading, not just money, is extremely important – it will get you through the challenging times. Strong self-discipline is needed to follow a clear-cut game-plan, but also the flexibility to adapt to changing circumstances as market conditions are always evolving.

6) Show grit

“Grit is highly underrated in most facets of life” – James Stanley

Trading can be difficult. It can only appear easy from the outside because clicking a few buttons to buy or sell isn’t very difficult. But it’s not easy to consistently beat the crowd, and almost anyone on this path will, at some point, face challenges. Grit is what enables success in those challenges, and a lack of grit is what makes it easy to quit for whatever reason.

The Ultimate Checklist to Become a Forex Trader

Now you know what qualities you need, it’s time to understand how to be a forex trader from a practical standpoint. Here’s the checklist:

1) Find the right broker

Choosing the best forex broker will make all the difference when it comes to benefiting from quality of user experience, reliable client support and competitive pricing.

2) Know how trading capital works

As a forex trader you must understand margin and leverage. Margin allows a trader to open leveraged positions, meaning greater exposure to the market with smaller capital outlay. Newer traders often look at unused margin as buying power and therefore tend to be too aggressive on their position sizing. Leverage maximizes gains and losses making your account equity quite volatile. Regardless of the amount of leverage your broker offers, we suggest using little or no leverage in your trading.

3) Start with a demo account

Practice with a demo account to familiarize yourself with the markets. From here, you can build and refine a trading strategy, get comfortable with your chosen platform and build the confidence you need to trade real money.

4) Take the plunge

Trade small with your real money account at first, and work your way up. Trade with risk management protocols in place, using stop losses, and only trade when you have undertaken in-depth analysis, whether trading fundamentals or technicals, or both.

5) Never stop building your knowledge – and character

Winning traders never stop learning and building their expertise on key markets. You should know your selected currency pairs inside out, which technical factors are relevant, and how market events shape the movements of certain pairs. Recording your trades in a trading journal will help you assess your performance and be in a position to constantly review and reassess your approach.

Euro (EUR) Outlook: EUR/USD Remains in Thrall to Upcoming US Inflation Data

Euro (EUR) Outlook: EUR/USD Remains in Thrall to Upcoming US Inflation Data

The main economic release of the week, US CPI, will hit the screens today at 13:30 UK and will likely spur a round of volatility in what has been a quiet FX market so far this year. Headline inflation (y/y), currently at a five-month low, is seen ticking up by 0.1% to 3.2% on stubborn energy prices, while core inflation (y/y) is seen falling to 3.8% from 4.0% in November.

image1.pngimage2.png

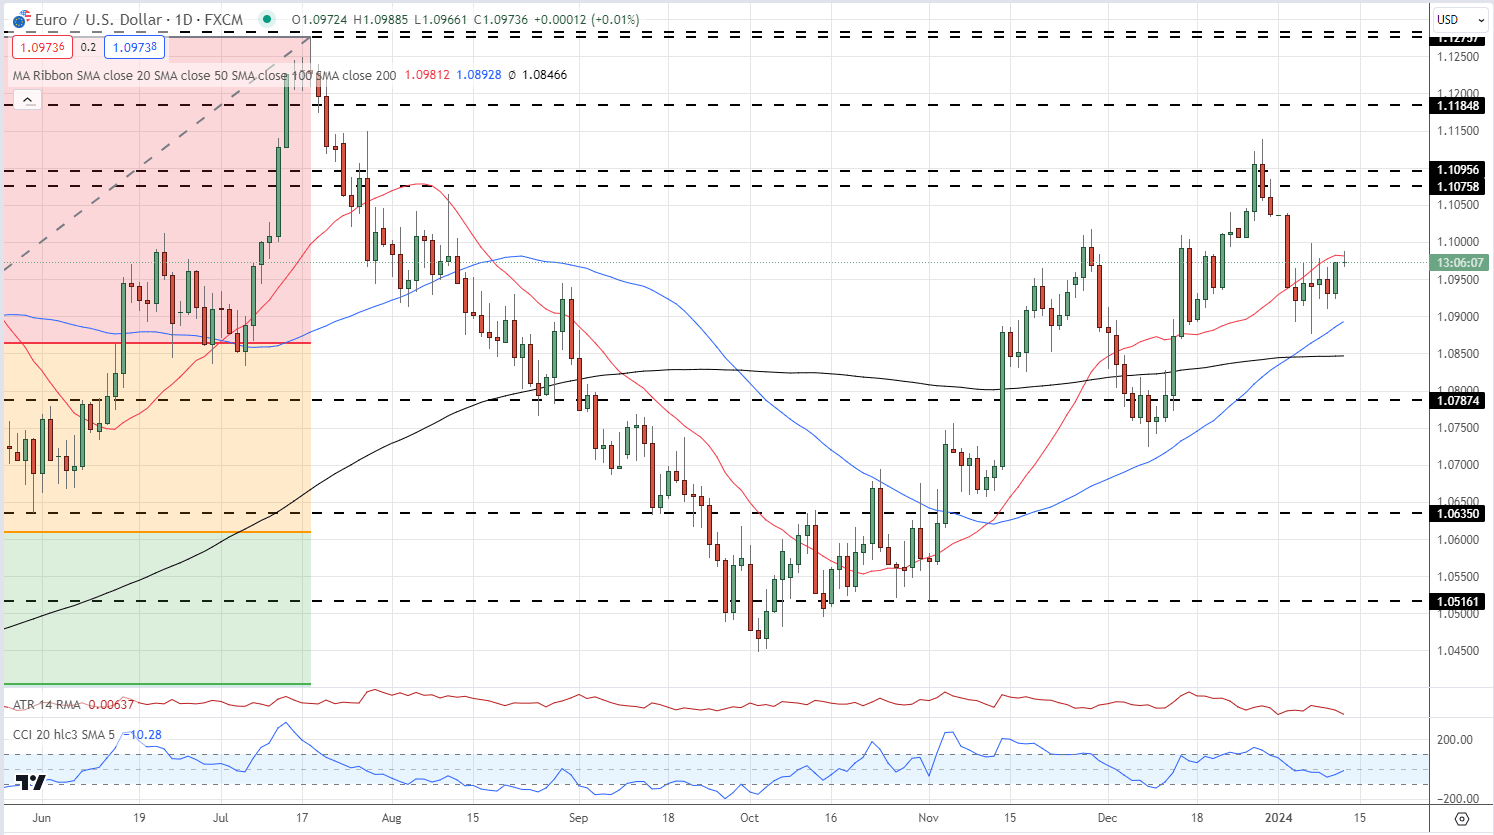
EUR/USD is trying to push higher ahead of the US data. The daily chart shows that a series of higher lows and higher highs that started in early October remains in place, with a trade above the December 28th high at 1.1138 needed to keep the trend going. The early January Golden Cross is providing support while the CCI indicator sits in neutral territory. EUR/USD needs to make a confirmed break above the 20-day simple moving average, currently at 1.0981, to keep pressing higher towards the 1.1075-1.1100 zone.

EUR/USD Daily Chart

image3.png

Chart Using TradingView

IG retail trader data show 43.22% of traders are net-long with the ratio of traders short to long at 1.31 to 1.The number of traders net-long is 12.07% lower than yesterday and 15.16% lower than last week, while the number of traders net-short is 10.15% higher than yesterday and 19.62% higher than last week.

We typically take a contrarian view to crowd sentiment, and the fact traders are net-short suggests EUR/USD prices may continue to rise.

To See What This Means for EUR/USD, Download the Full Report Below

EUR/USD Bullish

Data provided by of clients are net short.
Change in Longs Shorts OI
Daily -12% 17% 2%
Weekly -13% 22% 4%


How to Manage the Emotions of Trading

How to Manage the Emotions of Trading

The Importance of Controlling Emotions While Trading

The importance of day trading emotional control cannot be overstated.

Imagine you’ve just taken a trade ahead of Non-Farm Payrolls (NFP) with the expectation that if the reported number is higher than forecasts, you will see the price of EUR/USD increase quickly, enabling you to make a hefty short-term profit.

NFP comes, and just as you had hoped, the number beats forecasts. But for some reason, the price goes down!

You think back to all the analysis you had done, all the reasons that EUR/USD should be going up – and the more you think, the further the price falls.

As you see the red stacking up on your losing position, emotions begin to take over – this is the ‘Fight or Flight’ instinct. This impulse can often prevent us from accomplishing our goals and, for traders, this issue can be very problematic, leading to knee-jerk reactions.

Professional traders don’t want to take the chance that a rash decision will damage their account – they want to make sure that one knee-jerk reaction doesn’t ruin their entire career. It can take a lot of practice, and many trades, to learn how to minimize emotional trading.

The 3 Most Common Emotions Traders Experience

Some of the most common emotions traders experience include fear, nervousness, conviction, excitement, greed and overconfidence.

Fear/Nervousness

A common cause of fear is trading too big. Trading with improper size magnifies volatility unnecessarily and causes you to make mistakes you normally wouldn’t make if you weren’t under the stress of risking larger losses than normal.

Another culprit for fear (or nervousness) is you are in the ‘wrong’ trade, meaning one that doesn’t fit your trading plan.

Conviction/Excitement

Conviction and excitement are key emotions you’ll want to feed off, and you should feel these in every trade you enter. Conviction is the final piece of any good trade, and if you don’t have a level of excitement or conviction then there is a good chance you are not in the ‘right’ trade for you.

By ‘right’ we mean the correct trade according to your trading plan. Good trades can be losers just as bad trades can be winners. The idea is to keep yourself winning and losing on only good trades. Making sure you have conviction on a trade will help ensure this.

Greed/Overconfidence

If you find yourself only wanting to take trades that you deem as possible big winners, you could be getting greedy. Your greed may have been the result of doing well, but if you aren’t careful you may slip and end up in a drawdown.

Always check that you are using proper trade mechanics (i.e. sticking to stops, targets, good risk/management, and good trade set-ups). Sloppy trading as a result of overconfidence can end a strong run.

Learn more about managing greed and fear while trading.

How to Control Emotions While Trading: Top Tips and Strategies

Planning out your approach is key if you want to keep negative emotions out of your trading. The adage ‘Failing to plan is planning to fail,’ can hold true in financial markets.

As traders, there isn’t just one way of being profitable. There are many strategies and approaches that can help traders accomplish their goals. But whatever is going to work for that person is often going to be a defined and systematic approach; rather than one based on ‘hunches.’

Here are five ways to feel more in control of your emotions while trading.

1. Create Personal Rules

Setting your own rules to follow when you trade can help you control your emotions. Your rules might include setting risk/reward tolerance levels for entering and exiting trades, through profit targets and/or stop losses.

2. Trade the Right Market Conditions

Staying away from market conditions which aren’t ideal is also prudent. Not trading when you aren’t ‘feeling it’ is a good idea. Don’t look to the market to make you feel better; if you aren’t up to trading the simple solution may just be to step away.

3. Lower Your Trade Size

One of the easiest ways to decrease the emotional effect of your trades is to lower your trade size.

Here’s an example. Imagine a trader opening an account with $10,000. Our trader first places a trade for a $10,000 lot on EUR/USD.

As the trade moves at $1 a pip, the trader sees moderate fluctuations in the account. An amount of $320 was put up for margin, and our trader watches their usable margin of $9,680 fluctuate by $1 per pip.

Now imagine that same trader places a trade for $300,000 in the same currency pair.

Now our trader has to put up $9,600 for margin – leaving them with only $400 in usable margin – and now the trade is moving at $30 per pip.

After the trade moves against our trader only 14 pips, the usable margin is exhausted, and the trade is closed automatically as a margin call.

The trader is forced to take a loss; they don’t even have the chance of seeing price come back and pull the trade into profitable territory.

In this case, the new trader has simply put themselves in a position in which the odds of success were simply not in their favor. Lowering the leverage can greatly help diminish the risk of such events happening in the future.

4. Establish a Trading Plan and Trading Journal

In terms of fundamental factors, planning for various outcomes in the runup to key news events may also be a strategy to bear in mind.

The results between new traders using a trading plan, and those who don’t can be substantial. Compiling a trading plan is the first step to attack the emotions of trading, but unfortunately the trading plan will not completely obviate the effects of these emotions. Keeping forex trading journals may also be helpful.

5. Relax!

If you’re relaxed and enjoy your trading, you will be better equipped to respond rationally in all market conditions.