EUR/USD Forecast: Bullish Signals Hold as ECB and US Retail Sales Await

EUR/USD Forecast: Bullish Signals Hold as ECB and US Retail Sales Await

Wednesday Overview

The EUR/USD gained 0.74% on Wednesday. Following a 0.27% gain on Tuesday, the EUR/USD ended the day at $1.08739. The EUR/USD fell to a low of $1.07730 before rising to a high of $1.08966.

ECB Interest Rate Decision and Press Conference in the Spotlight

On Thursday, the ECB will deliver its final interest rate decision and press conference for 2023. Recent economic indicators support a more dovish interest rate outlook. However, uncertainty remains about the timing of the first ECB rate cut. Market expectations of a first ECB rate cut range from Q1 to the end of Q2 2023.

Trading Derivatives carries a high level of risk to your capital and you should only trade with money you can afford to lose. Trading Derivatives may not be suitable for all investors, so please ensure that you fully understand the risks involved, and seek independent advice if necessary. A Product Disclosure Statement (PDS) can be obtained either from this website or on request from our offices and should be considered before entering into a transaction with us. Raw Spread accounts offer spreads from 0.0 pips with a commission charge of USD $3.50 per 100k traded. Standard account offer spreads from 1 pips with no additional commission charges. Spreads on CFD indices start at 0.4 points. The information on this site is not directed at residents in any country or jurisdiction where such distribution or use would be contrary to local law or regulation.

Barring a surprise ECB interest rate decision, the ECB press conference will be the focal point. Economic and inflation forecasts and forward guidance on the timing of interest rate cuts need consideration. Suggestions of a Q1 2024 interest rate cut would be on the dovish side.

There are no euro area economic indicators for investors to consider on Thursday.

US Retail Sales and Jobless Claims to Play Second Fiddle to the ECB

On Thursday, US retail sales and jobless claims data will draw investor interest. An unexpected rise in retail sales and steady jobless claims would support bets on a soft landing. However, a spike in retail sales could test market bets on the timing of the first Fed rate cut.

Tight labor market conditions would support wage growth and disposable income. An upward trend in consumer spending would fuel demand-driven inflation and the need for a hawkish Fed rate path. A hawkish rate path would affect borrowing costs and disposable income. Downward trends in disposable income would impact consumer spending and dampen demand-driven inflation.

Economists forecast retail sales to fall by 0.1% in November after declining by 0.1% in October. Also, economists expect initial jobless claims to remain unchanged at 220k in the week ending December 9.

The US economic indicators need consideration. However, the stats will likely play second fiddle to the ECB press conference, which starts 15 minutes after the reports.

Short-Term Forecast:

Near-term trends for the EUR/USD will hinge on the ECB forecasts and forward guidance on interest rates. A gloomy economic outlook and suggestions of a Q1 2024 ECB rate cut could impact buyer appetite for the EUR/USD.

EUR/USD Price Action

Daily Chart

The EUR/USD remained above the 50-day and 200-day EMAs, affirming bullish price signals.

A EUR/USD break above the $1.09294 resistance level would support a move toward the $1.10 handle.

The ECB and US retail sales are focal points on Thursday.

However, a EUR/USD drop below the $1.0850 handle would bring the $1.07838 support level and the 50-day EMA into play. Buying pressure could intensify at $1.07830. The 50-day EMA is confluent with the $1.07838 support level.

The 14-period Daily RSI, 59.96, suggests a EUR/USD move to the $1.10 handle before entering overbought territory.
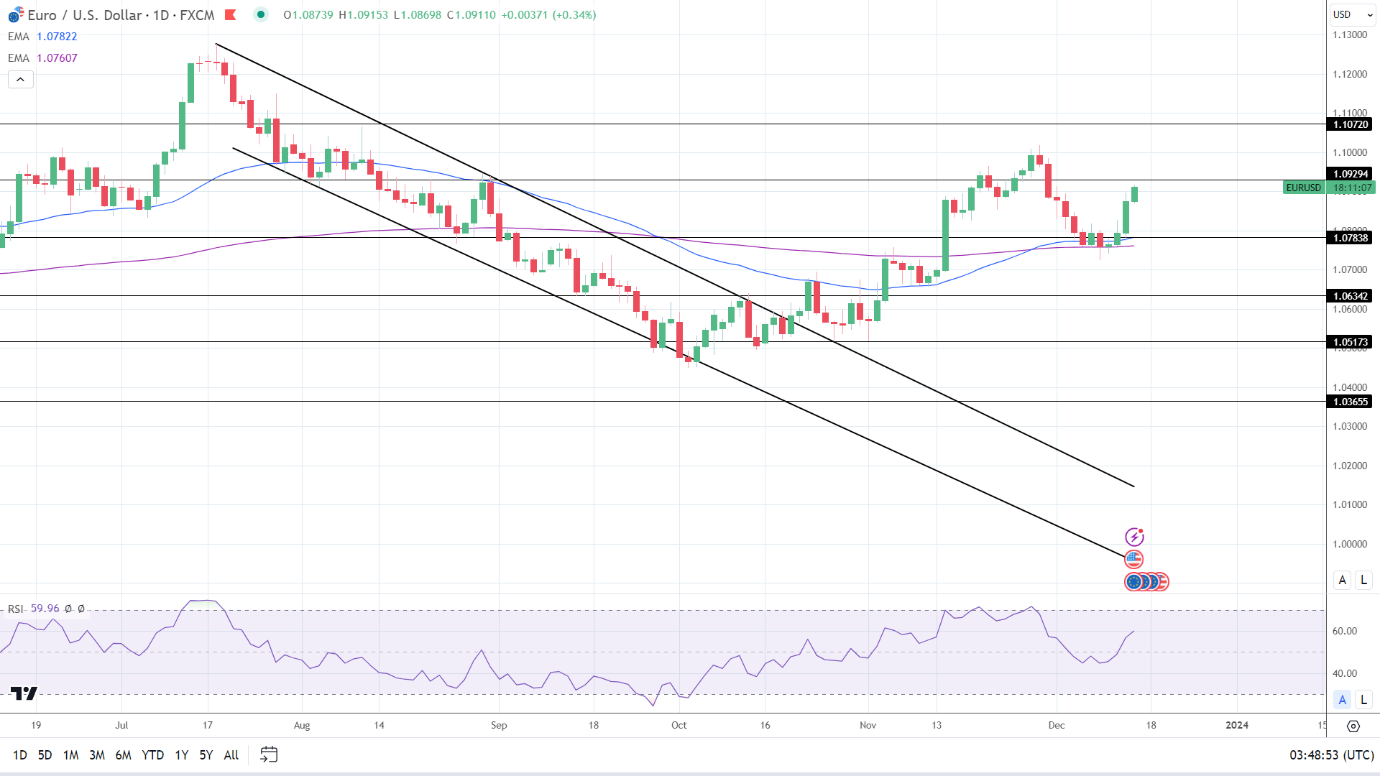
EUR/USD Daily Chart sends bullish price signals.
EURUSD 141223 Daily Chart

4-Hour Chart

The EUR/USD held above the 50-day and 200-day EMAs, with the EMAs reaffirming bullish price signals.

A EUR/USD break above the $1.09294 resistance level would bring the $1.10 handle into play.

However, a fall through the $1.08500 handle would give the bears a run at the 50-day and 200-day EMAs.

The 14-period RSI on the 4-hour chart, 74.47, shows the EUR/USD in overbought territory. Selling pressure could intensify at the $1.09294 resistance level.
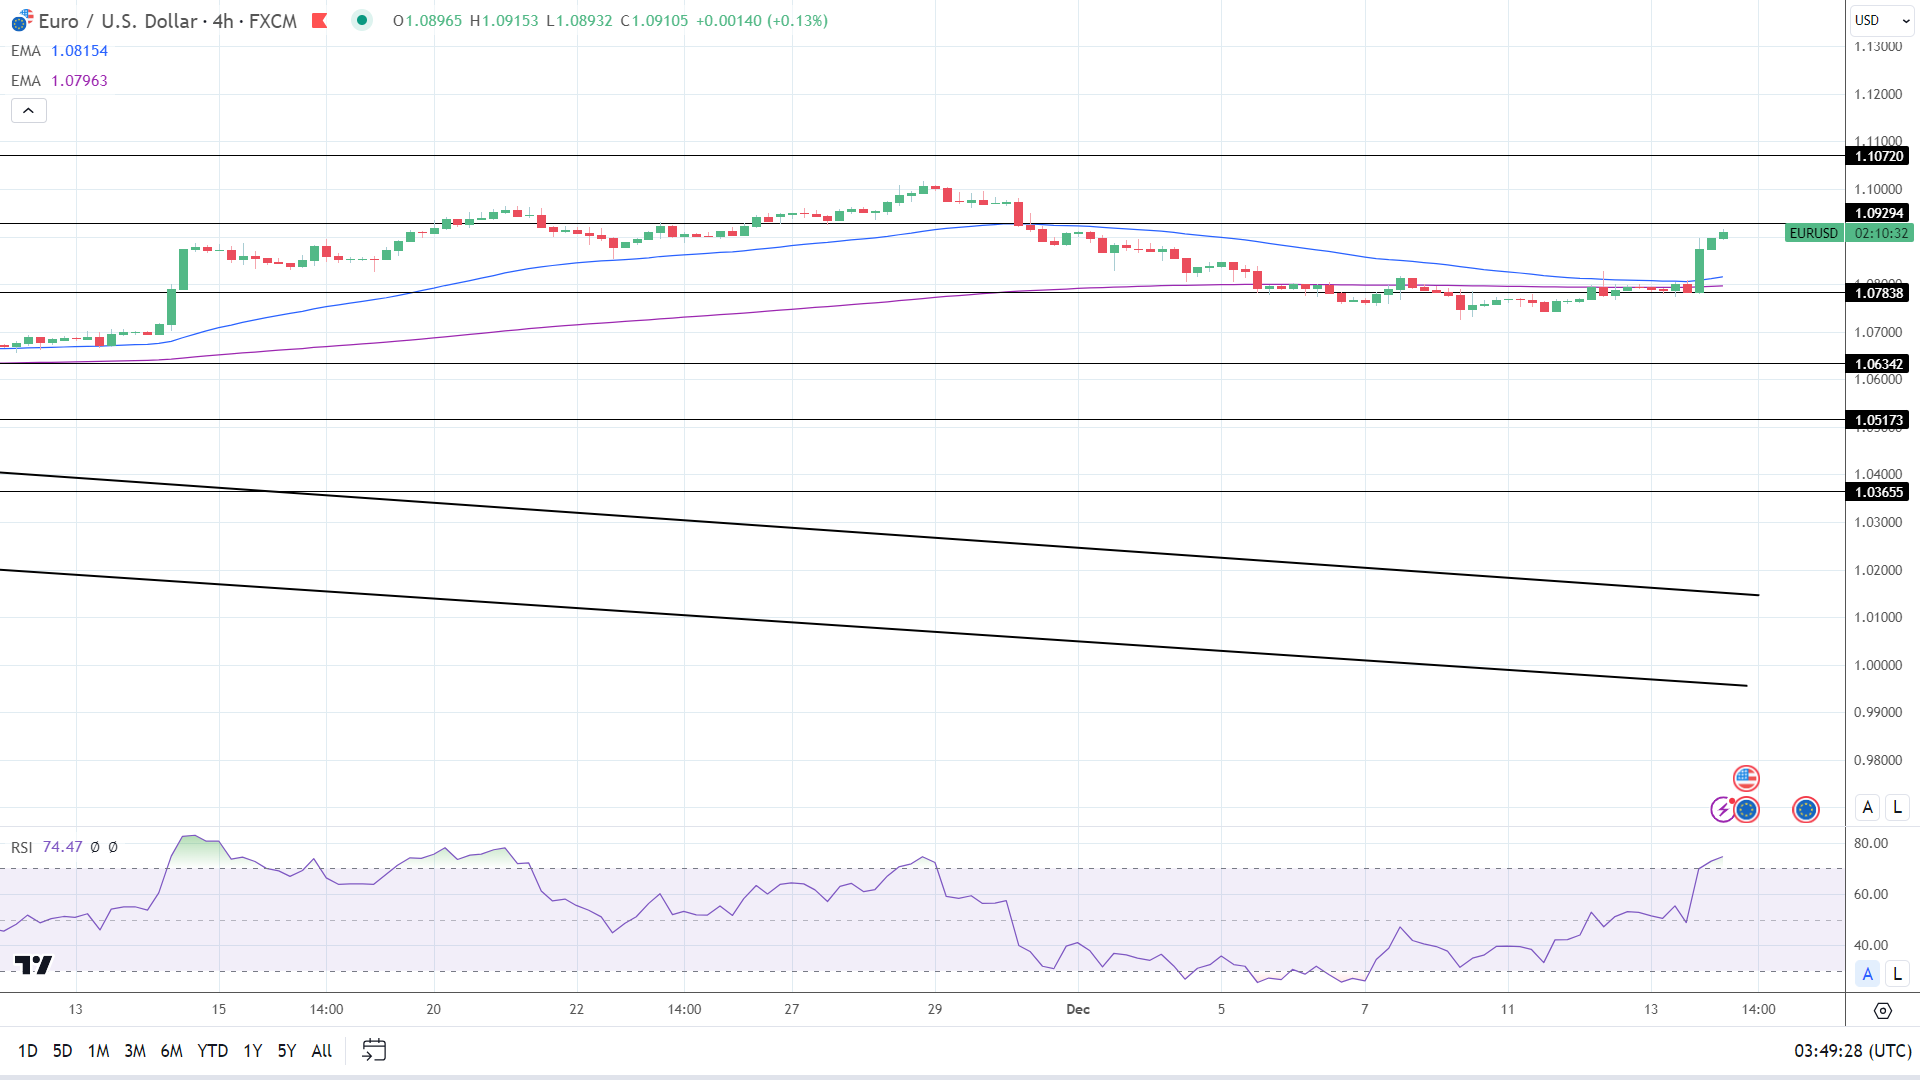
4-Hourly Chart EMAs affirm bullish price signal.
EURUSD 141223 4 Hourly Chart
Gold, Silver, Platinum Forecasts – Gold Attempts To Rebound As Traders Wait For Powell’s Comments

Gold, Silver, Platinum Forecasts – Gold Attempts To Rebound As Traders Wait For Powell’s Comments

Gold

Gold

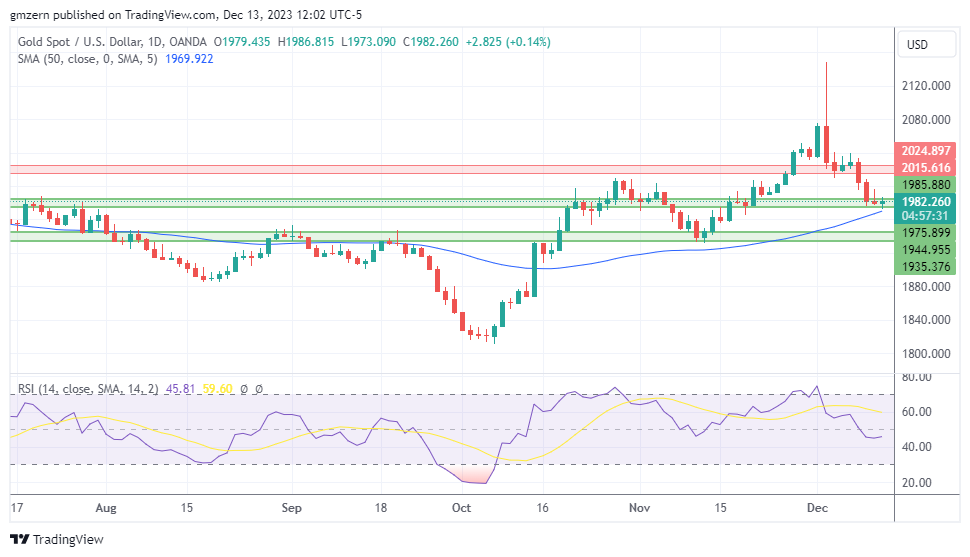
Gold 131223 Daily ChartGold settled near the $1980 level as traders waited for Fed decision. Treasury yields are moving lower, providing some support to gold markets.

If gold manages to settle back above the $1985 level, it will head towards the resistance at $2015 – $2025.

Trading Derivatives carries a high level of risk to your capital and you should only trade with money you can afford to lose. Trading Derivatives may not be suitable for all investors, so please ensure that you fully understand the risks involved, and seek independent advice if necessary. A Product Disclosure Statement (PDS) can be obtained either from this website or on request from our offices and should be considered before entering into a transaction with us. Raw Spread accounts offer spreads from 0.0 pips with a commission charge of USD $3.50 per 100k traded. Standard account offer spreads from 1 pips with no additional commission charges. Spreads on CFD indices start at 0.4 points. The information on this site is not directed at residents in any country or jurisdiction where such distribution or use would be contrary to local law or regulation.

Silver

Silver

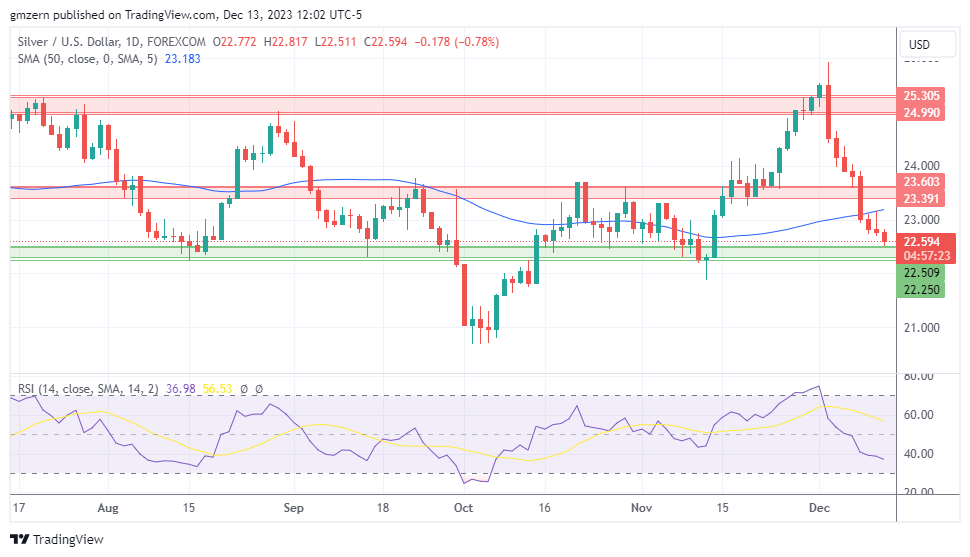
Silver 131223 Daily ChartSilver tests new lows as gold/silver ratio moved above the 87.50 level. In case gold/silver ratio settles above 88, it may gain additional upside momentum and move towards 90, which will be bearish for silver.

Silver is declining for 8th day in a row, but RSI remains in the moderate territory, so there is enough room to gain downside momentum.

Platinum

Platinum

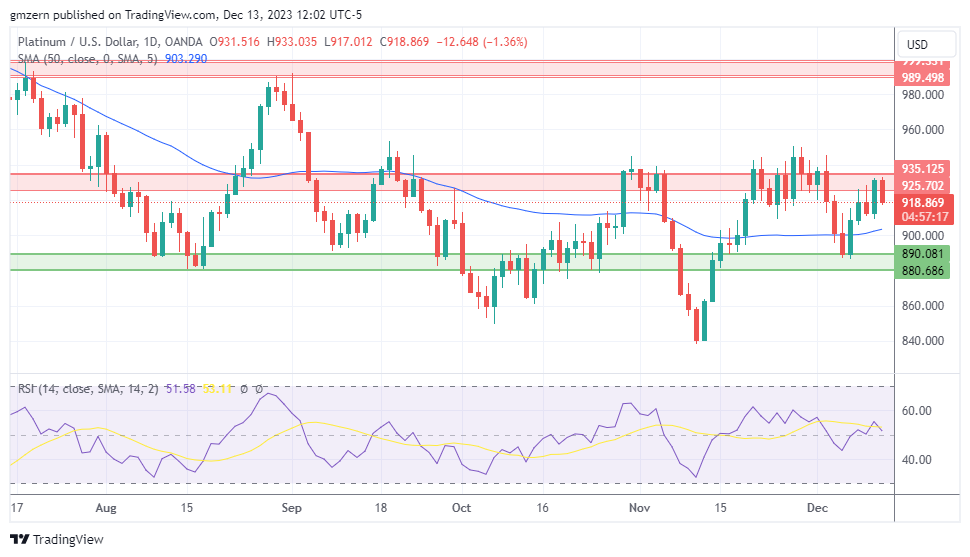
Platinum 131223 Daily ChartPlatinum failed to settle above the resistance at $925 – $935 and pulled back.

Most likely, platinum will need strong catalysts to have a chance to settle above the $935 level.

Hang Seng Index, ASX 200, Nikkei 225: Asian Markets to React to the Fed Projections

Hang Seng Index, ASX 200, Nikkei 225: Asian Markets to React to the Fed Projections

Overview of the Wednesday Session

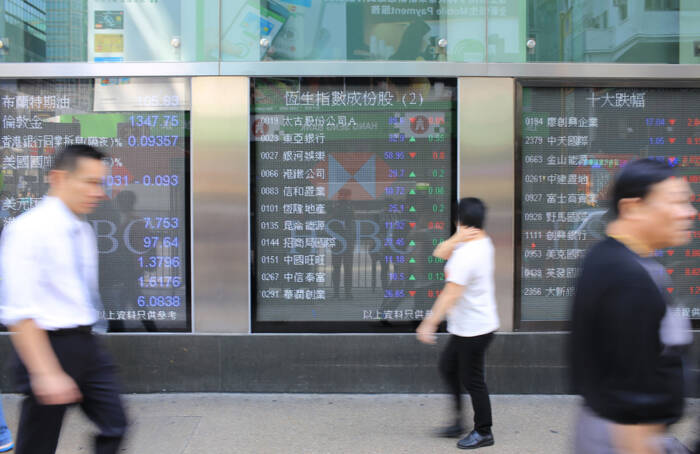
On Wednesday, the Asian equity markets had a mixed session. The Hang Seng Index resumed its downward spiral due to no stimulus measures from Beijing. However, hopes that the Fed would end its rate hike cycle and reduce bets on a Bank of Japan pivot supported the ASX 200 and the Nikkei.

Economic indicators from Japan beat forecasts, and a stronger USD/JPY contributed to the session gains.

Trading Derivatives carries a high level of risk to your capital and you should only trade with money you can afford to lose. Trading Derivatives may not be suitable for all investors, so please ensure that you fully understand the risks involved, and seek independent advice if necessary. A Product Disclosure Statement (PDS) can be obtained either from this website or on request from our offices and should be considered before entering into a transaction with us. Raw Spread accounts offer spreads from 0.0 pips with a commission charge of USD $3.50 per 100k traded. Standard account offer spreads from 1 pips with no additional commission charges. Spreads on CFD indices start at 0.4 points. The information on this site is not directed at residents in any country or jurisdiction where such distribution or use would be contrary to local law or regulation.

From Tuesday, the US CPI Report and the US equity markets set the tone for the Wednesday Asian session. On Tuesday, the Dow and S&P 500 ended the day up 0.48% and 0.46%, respectively. The Nasdaq Composite Index rose by 0.70%.

Federal Reserve to Impact the Asian Markets

The overnight FOMC interest rate decision, projections, and press conference will dictate risk sentiment on Thursday. Notably, the FOMC projections were favorable for the equity markets, with projections for the Federal Funds Rate lowered from 5.1% to 4.6% for 2024. The projections also pointed to a soft landing, with the Committee forecasting growth of 1.4% in 2024, down from a Q3 forecast of 1.5%.

The US equity markets responded to the projections and Fed Chair Powell’s press conference. The Nasdaq Composite Index gained 1.38%, with the Dow and S&P 500 rising by 1.40% and 1.37%, respectively.

Asian Economic Calendar and China

On Thursday, investors must consider the Asian economic calendar. From Japan, machinery orders and industrial production numbers warrant consideration. An improving macroeconomic environment could fuel bets on a Bank of Japan pivot from negative rates.

Australian employment numbers would affect market sentiment toward the RBA rate path and the ASX 200. Weaker labor market conditions could bring forward the timing of an RBA rate cut, a boon for ASX-listed stocks.

Away from the economic calendar, stimulus chatter from Beijing would also influence market risk sentiment. However, any stimulus plan must be convincing to fuel a broad-based Asian market rally.

ASX 200

ASX 200 had a positive Wednesday session.
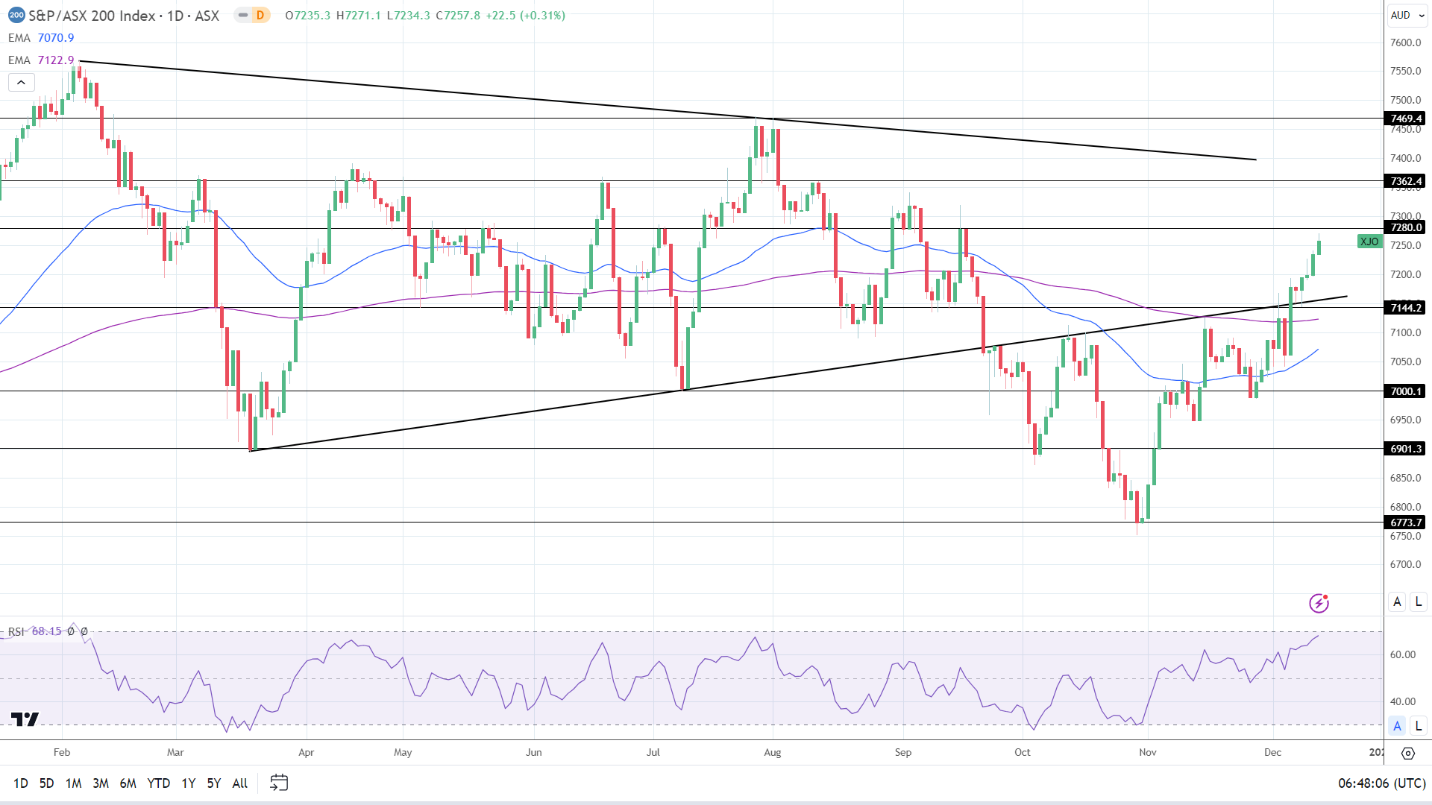
ASX200 141223 Daily ChartThe ASX 200 gained 0.31% on Wednesday. Gold and oil stocks stumbled. However, the big four banks and mining stocks contributed to the gains.

National Australia Bank Ltd. (NAB) and Westpac Banking Corp. (WBC) ended the day up 0.81% and 0.91%. Commonwealth Bank of Australia (CBA) and ANZ Group Holdings Ltd (ANZ) rose by 0.69% and 0.77%, respectively.

BHP Group Ltd (BHP) and Rio Tinto Ltd. (RIO) saw gains of 0.65% and 0.75%, respectively. Fortescue Metals Group Ltd. (FMG) rallied 1.33%.

However, Woodside Energy Group Ltd (WDS) and Santos Ltd (STO) fell by 1.05% and 0.14%, respectively. Gold (XAU/USD) stocks also had a negative session. Northern Star Resources Ltd. (NST) and Evolution Mining Ltd. (EVN) ended the day down 1.06% and 1.36%, respectively.

Hang Seng Index

Hang Seng Index ended the Wednesday session in the red.
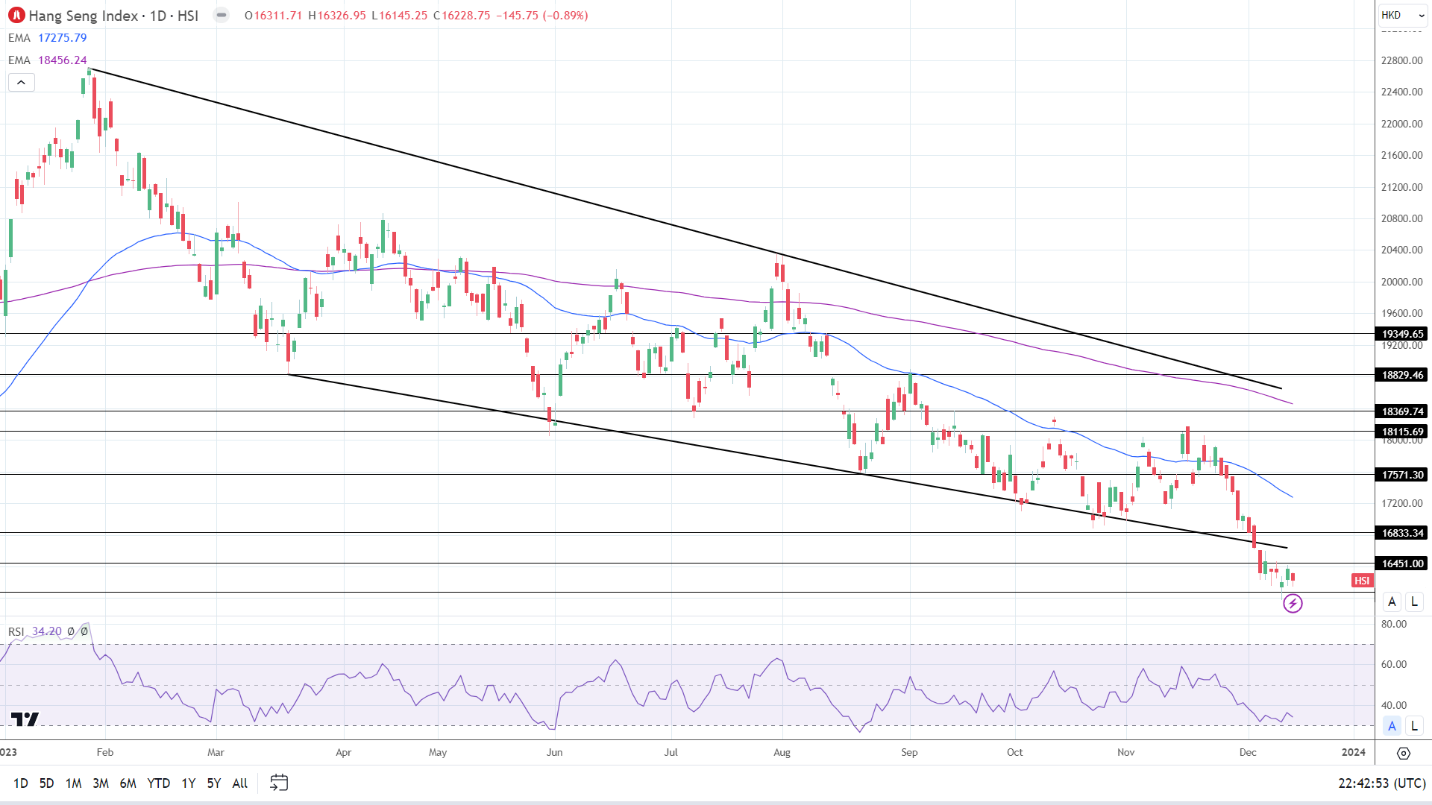
HSI 141223 Daily ChartThe Hang Seng Index declined by 0.89%. The Hang Seng Tech Index (HSTECH) fell by 1.18%, with the Hang Seng Mainland Properties Index (HSMPI) sliding by 2.44%.

Alibaba (9988) and Tencent (0700) saw losses of 1.00% and 1.41%

Bank stocks had a mixed session. HSBC (0005) and China Construction Bank (0939) fell by 0.16% and 0.44%, respectively. Industrial Commercial Bank (1398) ended the day up 0.82%.

The Nikkei 225

Nikkei ended the Wednesday session in positive territory.
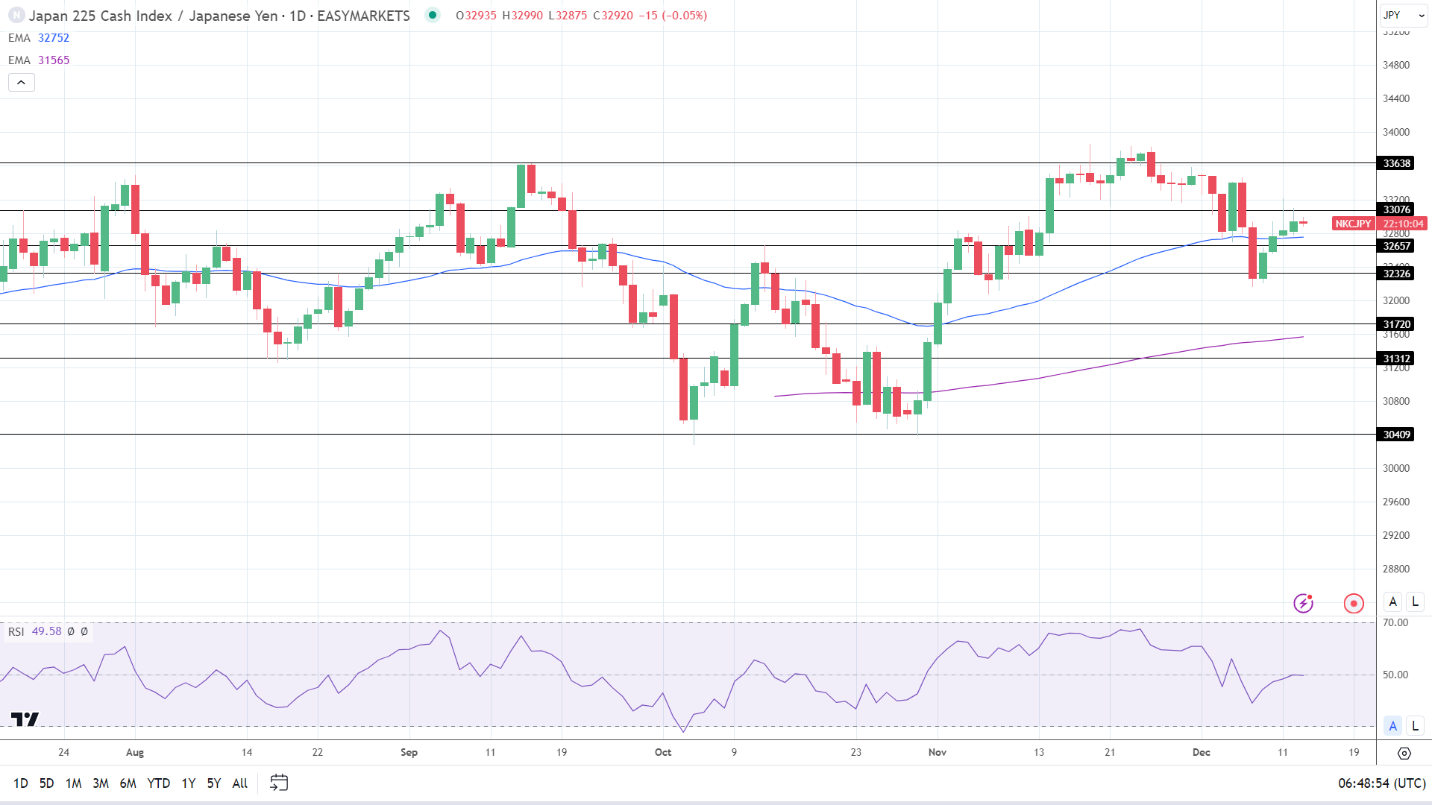
Nikkei 141223 Daily Chart(Graph for reference purposes only)

The Nikkei rose by 0.25%.

Bank stocks resumed their recent upward trend. Sumitomo Mitsui Financial Group Inc. (8316) and Mitsubishi UFJ Financial Group Inc. (8306) rose by 1.33% and 0.95%, respectively. However, it was a mixed session for the main components of the Nikkei.

Tokyo Electron Ltd. (8035) jumped by 4.71%. Sony Group Corp. (6758) and Softbank Group Corp. (9948) ended the day up 0.46% and 1.66%, respectively.

However, Fast Retailing Co. Ltd. (9983) and KDDI Corp. (9433) fell by 1.23% and 0.31%, respectively.

XRP News: Dovish Fed Boosts Ripple Amid Lawmaker Scrutiny and Appeal Uncertainty

XRP News: Dovish Fed Boosts Ripple Amid Lawmaker Scrutiny and Appeal Uncertainty

The Wednesday Overview

On Wednesday, XRP rose by 1.47%. After a 0.02% gain on Tuesday, XRP ended the day at $0.6279.

A Dovish Fed Inadvertently Gives XRP a Boost

XRP recovered from session losses on Wednesday, with dovish FOMC projections driving demand for riskier assets. Significantly, XRP rose to a session high of $0.6351 as investors responded to less hawkish interest rate projections for 2024.

Trading Derivatives carries a high level of risk to your capital and you should only trade with money you can afford to lose. Trading Derivatives may not be suitable for all investors, so please ensure that you fully understand the risks involved, and seek independent advice if necessary. A Product Disclosure Statement (PDS) can be obtained either from this website or on request from our offices and should be considered before entering into a transaction with us. Raw Spread accounts offer spreads from 0.0 pips with a commission charge of USD $3.50 per 100k traded. Standard account offer spreads from 1 pips with no additional commission charges. Spreads on CFD indices start at 0.4 points. The information on this site is not directed at residents in any country or jurisdiction where such distribution or use would be contrary to local law or regulation.

However, XRP gains were modest relative to the broader market. Bitcoin (BTC) rallied 3.47% to end the Wednesday session at $42,954. The total crypto market cap gained 2.84%, ending the day at $1,571 billion.

Increasing regulatory scrutiny and concerns about the SEC appealing the Programmatic Sales ruling capped gains.

SEC v Ripple Silence a Headwind

There were no SEC v Ripple case-related updates to influence investor sentiment on Wednesday. The lack of news left investors to consider prospects of the SEC appealing the ruling on the Programmatic Sales of XRP.

In July, Judge Torres ruled that XRP was not a security when sold programmatically on digital asset exchanges or through trading algorithms. In response, the SEC filed a motion for interlocutory appeal. Judge Torres rejected the motion in October. The court ruling meant that the SEC must wait until the conclusion of the SEC v Ripple case to file an appeal.

Notably, the SEC has expedited the case against Ripple since the court rejection. The SEC and Ripple are currently progressing through remedies-related discovery. The remaining charges in the SEC v Ripple case relate to the sale of XRP to institutional investors.

US case law could favor Ripple in terms of a final penalty. However, the SEC may be more interested in reversing the Programmatic Sales ruling. The SEC v Ripple case will likely reach its conclusion in the summer of 2024, if not before. From there, an appeal could extend into 2025.

Uncertainty could grip XRP investors until an appeal ruling or regulatory framework addresses the issues surrounding the classification of cryptos.

XRP Price Action

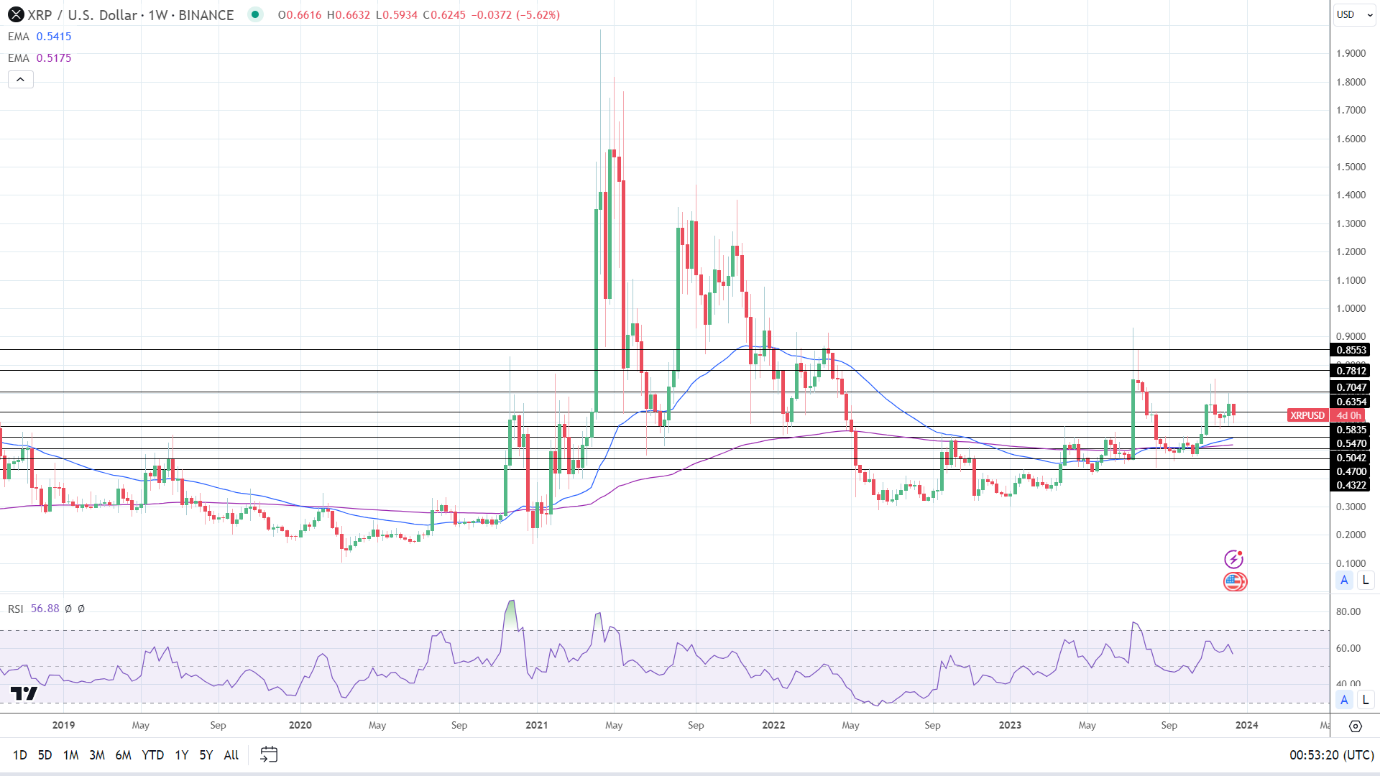
Weekly Chart sends bullish price signals.
XRPUSD 141223 Weekly Chart

Daily Chart

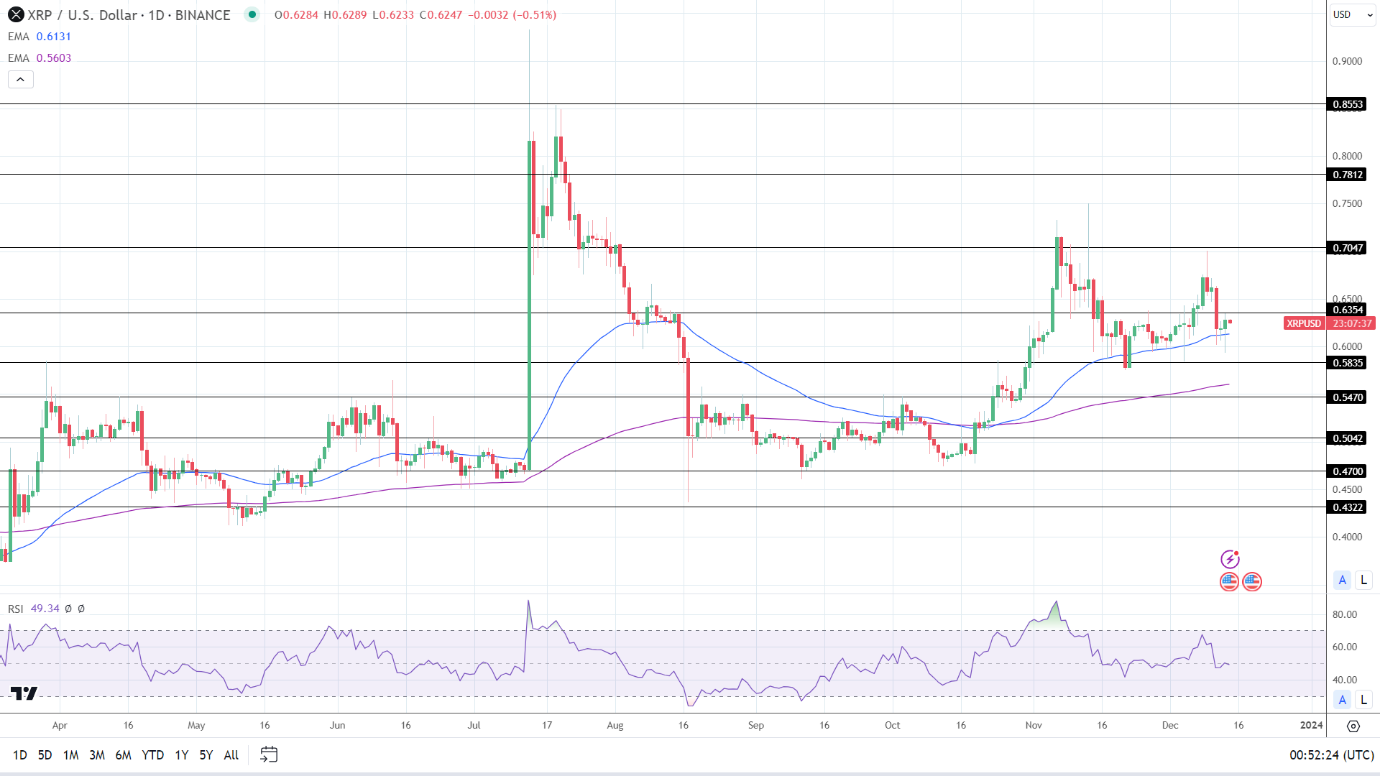
XRP remained above the 50-day and 200-day EMAs, affirming bullish price signals.

An XRP move through the $0.6354 resistance level would give the bulls a run at the $0.7047 resistance level.

US lawmaker commentary, SEC activity, and SEC v Crypto case-related news are focal points.

However, a break below the 50-day EMA would bring the $0.60 handle and the $0.5835 support level into play.

The 14-day RSI reading, 49.34, suggests a fall to the $0.5835 support level before entering oversold territory.

XRP Daily Chart affirms bullish price signals.
XRPUSD 141223 Daily Chart

4-Hourly Chart

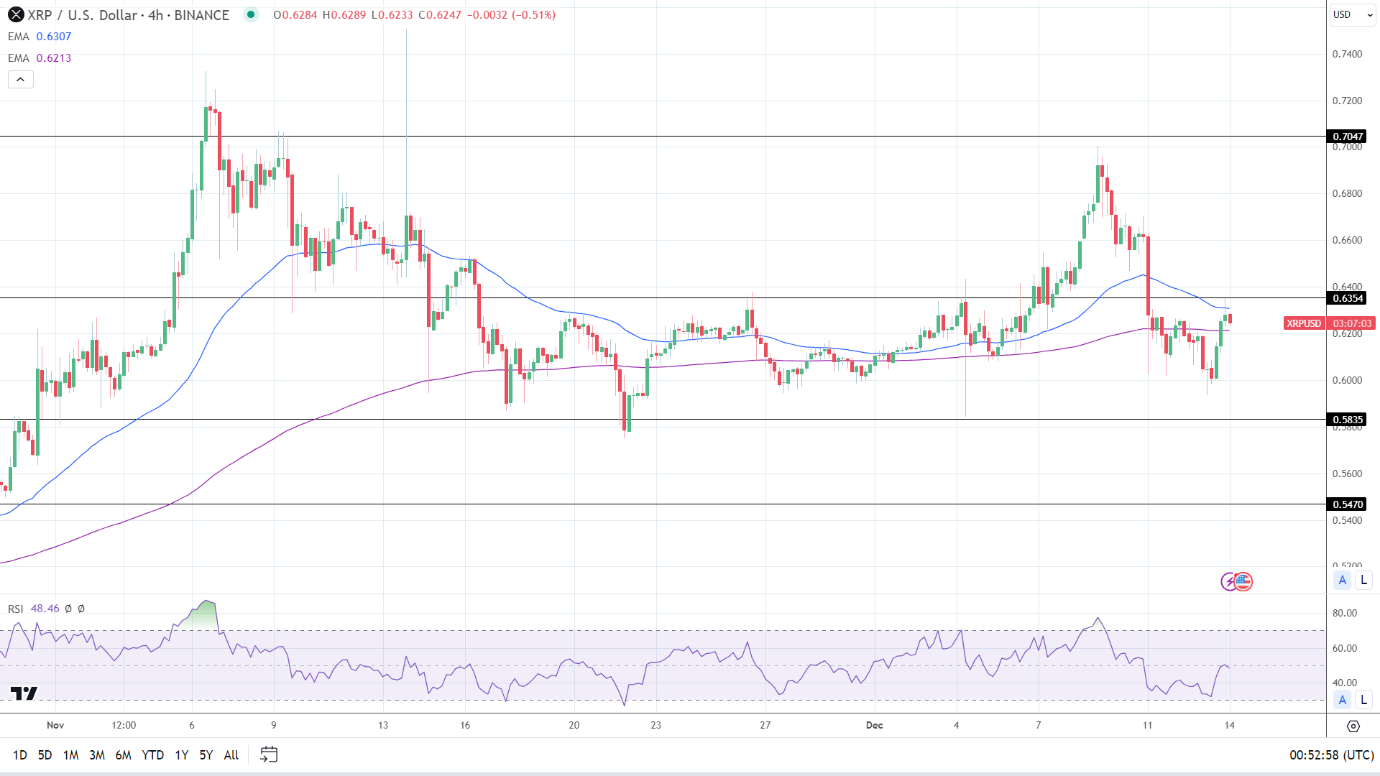
On the 4-hourly, XRP sat below the 50-day EMA while holding above the 200-day EMA, sending bearish near-term but bullish longer-term price signals.

An XRP break above the 50-day EMA would support a run at the $0.6354 resistance level.
However, an XRP fall through the 200-day EMA would give the bears a run at the $0.60 handle and the $0.5835 support level.

The 4-hourly RSI, with a reading of 48.46, suggests an XRP drop to the $0.60 handle before entering oversold territory.

XRP 4-Hourly Chart sends bearish near-term price signals.
XRPUSD 141223 4-Hourly Chart
How to use the PPI in Forex Trading

How to use the PPI in Forex Trading

What’s on this page
Car assembly line contributing to Producer Price Index (PPI)

Using PPI to trade forex: Talking points

  • PPI stands for the Producer Price Index, which is an important piece of economic data
  • PPI data is released during the second week of each month.
  • Forex traders can use PPI as a leading indicator to forecast consumer inflation measured by the Consumer Price Index (CPI).

PPI is an important piece of economic data due to its signaling effect on future expected inflation. Traders monitor PPI in forex trading because of the positive relationship between inflation and interest rates, but ultimately, traders are concerned with how the resultant interest rate changes are likely to affect currency pairs. Continue reading to learn more about the PPI index and how it affects the foreign exchange market.

What is PPI and what does it measure?

PPI stands for Producer Price Index and measures the change in the price of finished goods and services sold by producers. PPI data represents the monthly change in the average price of a basket of goods purchased by manufacturers.

How is PPI calculated?

PPI examines three production areas; commodity-based, industrial-based, and stage-of-processing-based companies. Released by the Bureau of Labor Statistics, PPI is created using data collected from a mailed survey of retailers selected via a process of systematic sampling of all firms listed with the Unemployment Insurance System.

Traders can see changes in PPI expressed as a percentage change from the previous year, or on a month to month basis.

PPI and inflation

A positive change in the PPI index implies that costs are rising and, in the end, price increases get passed down to consumers. If this effect is large enough, there will be an increase in future CPI figures to reflect that the general level of prices has increased.

PPI is a leading indicator of inflationInflation and the effect on the economy

An increase in the general price level is good for an economy but only when this is contained. When demand for goods and services increases, businesses must increase capital expenditure and hire more workers in order to increase their output to meet higher demand. The problem arises when prices increase drastically, resulting in a decrease in the purchasing power of a country’s currency. $1 can buy less than it could one year ago, for example.

In the 1950s, gasoline was $0.27, while apartment rent was $42/month and a movie ticket was $0.48. These figures are nowhere near to where they are today, and this reflects how inflation erodes the value of local currency. In an attempt to combat the erosion of purchasing power, central banks effectively reduce inflation by raising the benchmark interest rate.

How does PPI impact currencies?

When it comes to money there is always a trade-off: individuals can save money and earn interest, or they can spend money immediately and forgo any interest payments.

If PPI is on the rise it may cause the interest rates to rise. When interest rates go up, electing to save money looks more attractive as the reward (interest) is greater than before. Spending money becomes costlier because consumers would effectively be losing out on the higher interest rate when they choose to spend money instead of saving. As a result, increased PPI may filter down into increased rates and a stronger currency.

Using the Euro as an example, forex traders know that higher interest rates results in increased financial flows by foreign investors wanting to buy the higher yielding Euro. This effect tends to drive the value of the Euro up as the demand for the Euro has increased.

A popular strategy chasing higher interest rates is the “carry trade” strategy; whereby traders borrow funds in a currency that has a low interest rate and buy a currency with a higher interest rate.

Money follows yield and traders will look to take advantage of this.

Learn more about how interest rates affect forex.

How PPI affects the US dollar

The Producer Price Index tends to have little effect on the US dollar initially. This is because in the real economy there is a time lag between the increase in prices from producers, and the end result of higher inflation resulting from consumers having to fork out more at the tills.

DailyFX economic calendar showing Producer Price Index (PPI)However, don’t be misled by the “low priority” impact assessment of this data release. Astute traders are able to forecast the knock-on effects PPI is likely to have on CPI and interest rates and trade accordingly. Thus, the most valuable component of the PPI data is the signaling effect it provides to the market.

A Guide to GDP and Forex Trading

A Guide to GDP and Forex Trading

What forex traders need to know about GDP

What is GDP?

Developed in 1934 by Simon Kuznets, the Gross Domestic Product (GDP) measures the output and production of finished goods in a country’s economy. Usually, GDP is measured in three different time periods: monthly, quarterly and annually. This enables economists and traders to get an accurate picture of the overall health of the economy.

There are many approaches to calculating GDP, however, the US Bureau of Economic Analysis uses the “Expenditure Approach” using the formula:

GDP = Consumption (C) + Investment (I) + Government Spending (G) + (Exports (X) – Imports (M))

Understanding the relationship between GDP and the forex market

The general rule of thumb when looking at GDP data is looking at whether figures beat or fall below estimates (see relevant charts below):

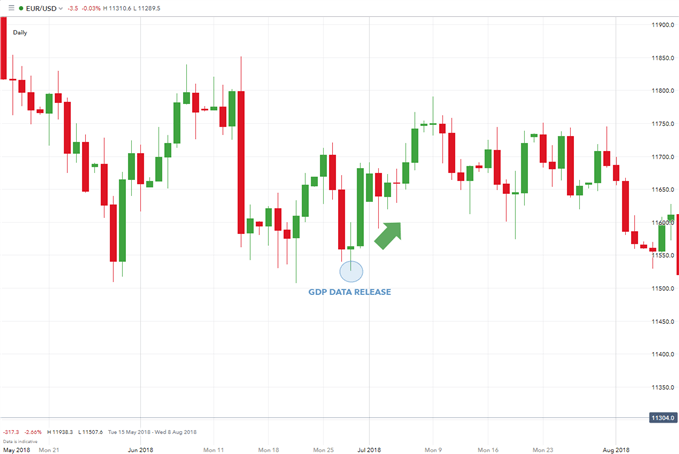
  • A lower than projected GDP reading will likely result in a sell off of the domestic currency relative to other currencies (USD depreciating against EUR).

EUR/USD chart: Low GDP data release

low GDP data reading and effect on EUR/USD

  • A higher than projected GDP reading will tend to strengthen the underlying currency versus other currencies (USD appreciating against EUR).

EUR/USD chart: High GDP data release

high GDP data reading impact on EUR/USD

GDP reports do not always have the same or expected effect on currencies. This is important to keep in mind before committing to a trade. Often, GDP figures are already fully/partially priced into the market meaning that the market may not react as anticipated once GDP figures are released.

Related economic data reports regularly allow for the market to ascertain a somewhat accurate estimate. Data to look out for:

Analysing GDP data to inform currency trading decisions

GDP, Inflation and Interest Rates

The advance release of GDP is four weeks after the quarter ends while the final release happens three months after the quarter ends. Both are released by the Bureau of Economic Analysis (BEA) at 08:30 ET. Typically, investors are looking for US GDP to grow between 2.5% to 3.5% per year.

Without the specter of inflation in a moderately growing economy, interest rates can be maintained around 3%. However, a reading above 6% GDP would show that the US economy is endanger of overheating which can, in turn, spark inflation fears.

Consequently, the Federal Reserve may have to raise interest rates to curb inflation and put the ‘brakes’ on an overheating economy. Maintaining price stability is one of the jobs of the Federal Reserve. GDP must stay in a ‘goldilocks range’: not too hot and not too cold.

GDP should not be high enough to trigger inflation or too low where it could lead to recession. A recession is defined by two consecutive negative quarters of GDP growth. The GDP ‘sweet spot’ varies from one country to another. For example, China has had GDP in double digits.

Forex traders are most interested in GDP as it is a complete health report card for a country’s economy. A country is ‘rewarded’ for a high GDP with a higher value of their currency. There is usually a positive expectance for future interest rate hikes because strong economies tend to get stronger creating higher inflation. This, in turn, leads to a central bank raising rates to slow growth and to contain the growing specter of inflation.

On the other hand, a country with weak GDP has a drastically reduced interest rate hike expectation. In fact, the central bank of a country that has two consecutive quarters of negative GDP may even choose to stimulate their economy by cutting interest rates.

Trading currency pairs using GDP data

Quarter-on-quarter figures tend to produce much more variable changes in the overall trend – e.g. Positive GDP figures beating estimates QoQ may be fleeting when taking into consideration year-on-year (YoY) data. YoY data allows for a broader perspective which could potentially highlight an overall trend.

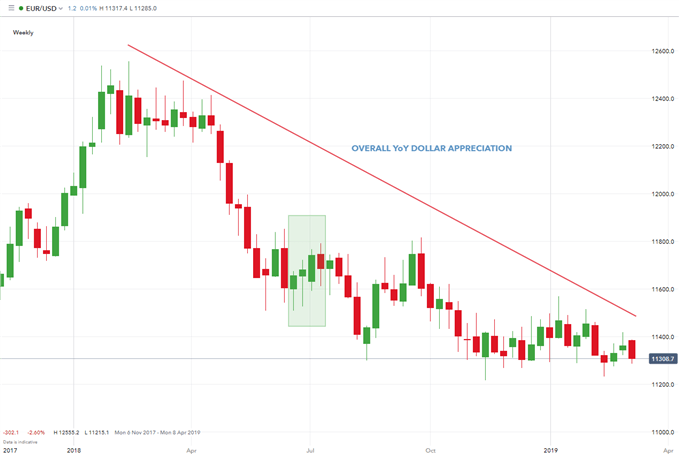
The chart below shows a longer time frame EUR/USD view as seen in Chart 2 above. This chart expresses the variation in short term QoQ data against the longer-term YoY trend.

GDP forex data year on year

Contractionary Monetary Policy: What is it and How Does it Work?

Contractionary Monetary Policy: What is it and How Does it Work?

What is Contractionary Monetary Policy?

Contractionary monetary policy is the process whereby a central bank deploys various tools to lower inflation and the general level of economic activity. Central banks do so through a combination of interest rate hikes, raising the reserve requirements for commercial banks and by reducing the supply of money through large-scale government bond sales, also known as, quantitative tightening (QT).

confused man looking at monetary policy terminologyIt may seem counter-intuitive to want to lower the level of economic activity but an economy operating above a sustainable rate produces unwanted effects like inflation – the general rise in the price of typical goods and services purchased by households.

Therefore, central bankers employ a number of monetary tools to intentionally lower the level of economic activity without sending the economy into a tailspin. This delicate balancing act is often referred to as a ‘soft landing’ as officials purposely alter financial conditions, forcing individuals and businesses to think more carefully about current and future purchasing behaviors.

Contractionary monetary policy often follows from a period of supportive or ‘accommodative monetary policy’ (see quantitative easing ) where central banks ease economic conditions by lowering the cost of borrowing by lowering the country’s benchmark interest rate; and by increasing the supply of money in the economy via mass bond sales. When interest rates are near zero, the cost of borrowing money is almost free which stimulates investment and general spending in an economy after a recession.

Contractionary Monetary Policy Tools

Central banks make use of raising the benchmark interest rate, raising the reserve requirements for commercial banks, and mass bond sales. Each is explored below:

1) Raising the Benchmark Interest Rate

The benchmark or base interest rate refers to the interest rate that a central bank charges commercial banks for overnight loans. It functions as the interest rate from which other interest rates are derived from. For example, a mortgage or personal loan will consist of the benchmark interest rate plus the additional percentage that the commercial bank applies to the loan to provide interest income and any relevant risk premium to compensate the institution for any unique credit risk of the individual.

Therefore, raising the base rate leads to the elevation of all other interest rates linked to the base rate, resulting in higher interest related costs across the board. Higher costs leave individuals and businesses with less disposable income which results in less spending and less money revolving around the economy.

road sign showing Fed rate hike ahead2) Raising Reserve Requirements

Commercial banks are required to hold a fraction of client deposits with the central bank in order to meet liabilities in the event of sudden withdrawals. It is also a means by which the central bank controls the supply of money in the economy. When the central bank wishes to reign in the amount of money flowing through the financial system, it can raise the reserve requirement which prevents the commercial banks from lending that money out to the public.

3) Open Market Operations (Mass Bond Sales)

Central banks also tighten financial conditions by selling large amounts of government securities, often loosely referred to as ‘government bonds’. When exploring this section, we will consider US government securities for ease of reference but the principles remain the same for any other central bank. Selling bonds means the buyer/investor has to part with their money, which the central bank effectively removes from the system for a long period of time during the lifetime of the bond.

The Effect of Contractionary Monetary Policy

Contractionary monetary policy has the effect of lowering economic activity and lowering inflation.

1) Effect of Higher Interest Rates : Higher interest rates in an economy make it more expensive to borrow money, meaning large scale capital investments tend to slow down along with general spending. On an individual level, mortgage payments rise, leaving households with lower disposable income.

Another contractionary effect of higher interest rates is the higher opportunity cost of spending money. Interest-linked investments and bank deposits become more attractive in a rising interest rate environment as savers stand to earn more on their money. However, inflation still needs to be taken into account as high inflation will still leave savers with a negative real return if it is higher than the nominal interest rate.

coins stacked in ascending order2) Effect of Raising Reserve Requirements : While reserve requirements are used to provide a pool of liquidity for commercial banks during times of stress, it can also be altered to control the supply of money in the economy. When the economy is overheating, central banks can raise reserve requirements, forcing banks to withhold a larger portion of capital than before, directly reducing the amount of loans banks can make. Higher interest rates combined with fewer loans being issued, lowers economic activity, as intended.

3) Effect of Open Market Operations (Mass Bond Sales) : US treasury securities have different lifespans and interest rates (‘T-bills’ mature anywhere between 4 weeks to 1 year, ‘notes’ anywhere between 2- 10 years and ‘bonds’ 20 to 30 years). Treasuries are considered to be as close as you can get to a ‘risk-free’ investment and therefore are often used as benchmarks for loans of corresponding time horizons i.e., the interest rate on a 30-year treasury bond can be used as the benchmark when issuing a 30-year mortgage with an interest rate above the benchmark to account for risk.

Selling mass amounts of bonds lowers the price of the bond and effectively raises the yield of the bond. A higher yielding treasury security (bond) means it’s more expensive for the government to borrow money and therefore, will have to reign in any unnecessary spending.

Examples of Contractionary Monetary Policy

Contractionary monetary policy is more straight forward in theory than it is in practice as there are plenty of exogenous variables that can influence the outcome of it. That is why central bankers endeavor to be nimble, providing themselves with options to navigate unintended outcomes and tend to adopt a ‘data-dependent’ approach when responding to different situations.

The example below includes the US interest rate (Federal funds rate), real GDP and inflation (CPI) over 20 years where contractionary policy was deployed twice. Something crucial to note is that inflation tends to lag the rate hiking process and that is because rate hikes take time to filter through the economy to have the desired effect. As such, inflation from May 2004 to June 2006 actually continued its upward trend as rates rose, before eventually turning lower. The same is observed during the December 2015 to December 2018 period.

Chart: Example of Contractionary Monetary Policy Examined

economic data when analyzing contractionary monetary policySource: Refinitiv Datastream

In both of these examples, contractionary monetary policy was unable to run its full course as two different crises destabilized the entire financial landscape. In 2008/2009 we had the global financial crisis (GFC) and in 2020 the spread of the coronavirus rocked markets resulting in lockdowns which halted global trade almost overnight.

These examples underscore the difficult task of employing and carrying out contractionary monetary policy. Admittedly, the pandemic was a global health crisis and the GFC emanated out of greed, financial misdeeds and regulatory failure. The most important thing to note from both cases is that monetary policy does not exist in a bubble and is susceptible to any internal or external shocks to the financial system. It can be likened to a pilot flying under controlled conditions in a flight simulator compared to a real flight where a pilot may be called upon to land a plane during strong 90 degree crosswinds.

The Importance of Liquidity in Forex Trading

The Importance of Liquidity in Forex Trading

What is liquidity and why is it important?

Liquidity in the forex market is by definition, the ability of a currency pair to be traded (bought/sold) on demand. When you’re trading major currency pairs, you’re trading an exceedingly liquid market. However, you are trading based on the available liquidity of financial institutions which get you in or out of the trade (currency pair) of your choosing.

liquidity in forex

Not all currency pairs are liquid. In fact, currencies tend to have varying levels of liquidity depending on whether they are major, minor and exotic pairs (including emerging market currencies). Forex liquidity dries up as traders move from major pairs to minor pairs and finally to the exotic pairs.

High Liquidity:

High liquidity in forex refers to a currency pair that can be bought/sold in significant sizes without large variances in its exchange rate (price level) – e.g. Major currency pairs such as EUR/USD.

Other major currency (highly liquid) pairs to be aware of:

Low Liquidity:

Low liquidity in forex refers to a currency pair that cannot be bought/sold in significant sizes without large variances in its exchange rate price level – e.g. Exotic currency pairs such as PLN/JPY.

Forex liquidity vs illiquidity: 3 Signs to look out for

From a trader’s point of view, an illiquid market will have chaotic moves or gaps because the level of buying or selling volume at any one moment can vary greatly. A highly liquid market is also known as a deep market or a smooth market and price action is also smooth. Most traders need and should require a liquid market because it is very hard to manage risk if you’re on the wrong side of a big move in an illiquid market.

Here are three signs to look out for which are:

1. GAPS WHEN TRADING FOREX

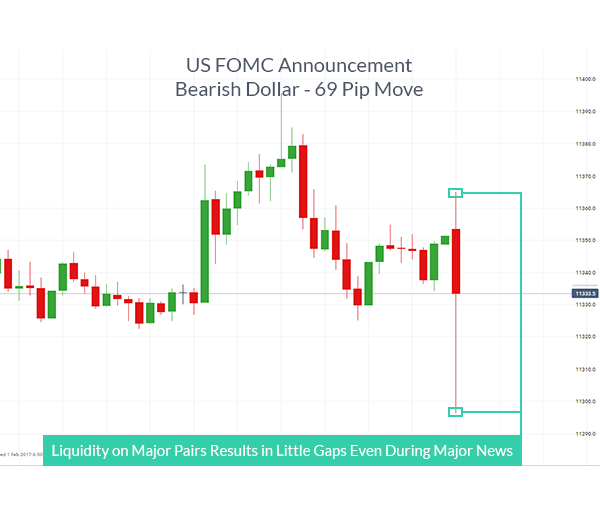
Gaps in forex vary compared to other markets. However, price gaps can occur in forex if an interest rate announcement or other high impact news announcement comes out against expectations.

Gaps can occur at the week’s opening on Sunday afternoon in the US. If there is a news announcement over the weekend, then overall gaps in forex are usually less than a 0.50% of a currency’s value.

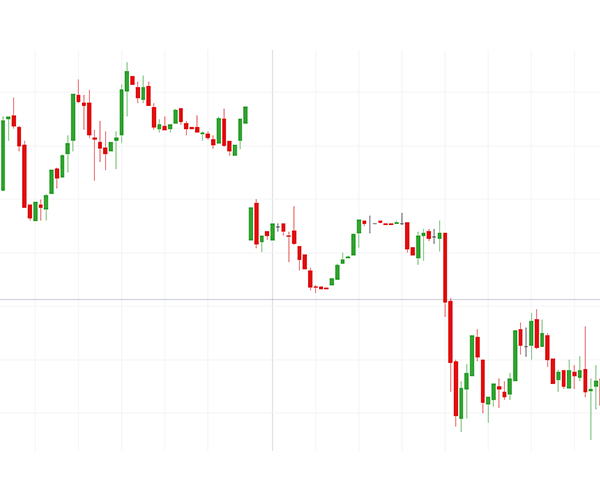
The charts below depict the difference in liquidity between the equity market and the forex market, as highlighted by gapping.

Equity markets are prone to gaps: FTSE 100 Index

Chart to show illiquid market and gaps

Forex market exhibits little/no gapping:

Chart to show a more liquid forex market

A market that trades 24 hours a day like the forex market is considered more liquid or simply tends to have fewer gaps due to the continuous nature in the equities market. This allows traders to enter and exit the market at their discretion. A market that only trades for a fraction of the day like the US Equity market or Futures Exchange would be condensed into a thinner market because prices can jump at the open if overnight news comes out against the crowd’s expectations.

2. THE FOREX LIQUIDITY INDICATOR

Brokers often offer a “volume” option on the chart whereby a trader can gauge the liquidity of the market. This forex liquidity indicator is interpreted by analysing the bars on the volume chart.

Each volume bar represents the volume traded during the specific period, thus giving the trader a suitable approximation of liquidity. It is important to remember that most brokers only reflect their own liquidity data and not the overall forex market liquidity. However, using a broker’s liquidity as a gauge can represent the retail market fittingly depending on the size of the broker.

3. DIFFERENT TIMES OF DAY OFFER VARYING AMOUNTS OF LIQUIDITY

Short term traders or scalpers should be aware of how liquidity in forex varies through the trading day. There are less active hours like the Asian Session that is often range bound meaning support and resistance levels are more likely to hold from a speculation point of view. The major moving market sessions such as the London session and US session are more prone to breakouts and larger percentile moves on the day.

The time of day that you’re likely to see the biggest moves are the US Morning Session because it overlaps with the European / London Session which alone accounts for roughly +50% of total daily global volume. The US session alone accounts for around 20% and in the US Afternoon, you will often see a sharp drop off in aggressive moves except for when the Federal Open Market Committee (FOMC) comes out with a surprise announcement which is but a few times a year.

Liquidity Risk vs Reward

The relationship between risk and reward in financial markets is almost always proportionate, so understanding the risks involved in a trade must be taken into consideration.

A primary example of liquidity risk in the forex market is the Swiss Franc crisis in 2015. The Swiss central bank announced they would no longer be preserving the Swiss Franc peg against the Euro causing the interbank market to become broken due to an inability to price the market. This led to brokers being unable to offer liquidity on CHF. As interbank pricing (the backbone of forex pricing) returned, EUR/CHF prices were far from the previous range. This led to retail client account balances for those trading CHF to be largely affected. While these “Black Swan” events are rare, they are not impossible.

Retail forex traders need to manage these liquidity risks by either lowering their leverage or making use of guaranteed stops whereby the broker is obligated to honour your stop price level.

Weighing up the options between liquidity risk and reward should not be overlooked and should be included as a part of a trader’s analysis routine.

Further reading to take your forex trading to the next level

  • The forex market has evolved over centuries. For a summarized account of the most important developments shaping this $5 trillion-a-day market, read more on the history of forex.
  • Our research team analyzed over 30 million live trades to uncover the traits of successful traders. Incorporate these traits to give yourself an edge in the markets.
  • Traders often look to retail client sentiment when trading popular FX markets. DailyFX provides such data, based on IG client sentiment.
  • If you are just starting out on your trading journey, it is essential to understand the basics. Download our free New to Forex trading guide.
Oil Prices Forecast: Lower Amid Inflation, Fed Rates, Global Demand Outlook

Oil Prices Forecast: Lower Amid Inflation, Fed Rates, Global Demand Outlook

Oil Prices Stabilize Amid Market Pressures

Crude oil prices are drifting lower early Wednesday after a significant 3% drop in the previous session. This decline, marking a six-month low, was driven by oversupply worries and concerns about softening demand, accentuated by a recent unexpected rise in U.S. consumer prices.

Inflation and Fed Rates Impact

The surprising increase in the U.S. consumer price index (CPI) for November has solidified expectations that the Federal Reserve might not lower interest rates in the near term.

Trading Derivatives carries a high level of risk to your capital and you should only trade with money you can afford to lose. Trading Derivatives may not be suitable for all investors, so please ensure that you fully understand the risks involved, and seek independent advice if necessary. A Product Disclosure Statement (PDS) can be obtained either from this website or on request from our offices and should be considered before entering into a transaction with us. Raw Spread accounts offer spreads from 0.0 pips with a commission charge of USD $3.50 per 100k traded. Standard account offer spreads from 1 pips with no additional commission charges. Spreads on CFD indices start at 0.4 points. The information on this site is not directed at residents in any country or jurisdiction where such distribution or use would be contrary to local law or regulation.

Prolonged higher interest rates could impede economic growth, influencing a weaker demand for oil. This situation is particularly critical as higher rates tend to bolster the U.S. Dollar, making dollar-denominated commodities like crude oil more expensive for international buyers, thereby diminishing demand.

Global Demand and Supply Forecasts

The outlook for global oil demand growth suggests a slowdown in 2024, with OPEC and the International Energy Agency (IEA) differing in their projections. The negative market sentiment is further aggravated by doubts over whether the OPEC+ agreement to curtail supplies by 2.2 million barrels per day in the first quarter will effectively balance the market.

U.S. Production and Inventory Insights

The U.S. Energy Information Administration (EIA) has revised its projections, expecting a rise in U.S. crude oil production and lowering its price forecast for Brent crude in 2024. Conversely, Tuesday’s report cited a decline in U.S. crude stocks, as indicated by the American Petroleum Institute (API), which points to a mixed short-term market outlook.

Market Direction and Short-term Forecast

The direction of the oil market on Wednesday now hinges on the outcome of the Federal Reserve’s policy meeting and the weekly Energy Information Administration (EIA) report.

A decision leaning towards a more hawkish stance could trigger further declines in oil prices. Additionally, Wednesday’s US oil stockpile data could offer further clues about market balances.

The ongoing global economic and geopolitical factors, including rising Russian crude exports and the recent OPEC+ output cut agreement, contribute to a bearishly skewed market, indicating a potential continuation of the oil price downtrend in the short term.

Technical Analysis

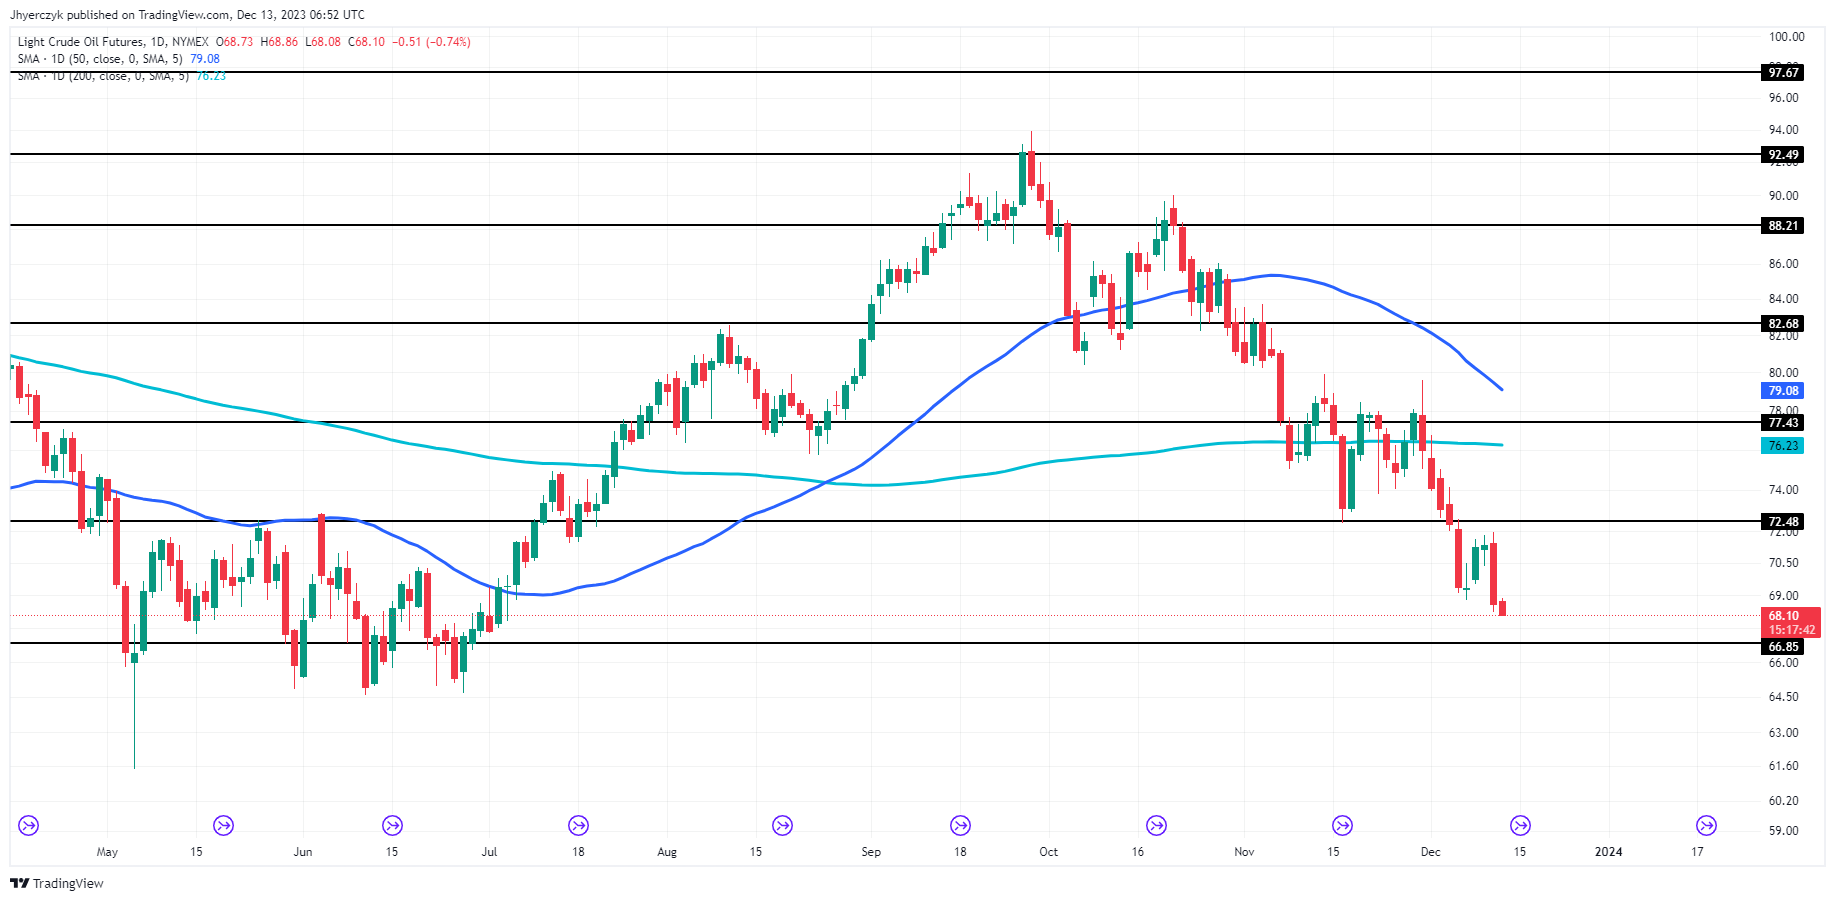
Daily LIght Crude Oil FuturesLight Crude Oil Futures currently trade at $68.14, below both the 200-day ($76.23) and 50-day ($79.08) moving averages, suggesting a bearish trend.

The current price, slightly lower than the previous close of $68.61, is just above the minor support level at $66.85, indicating some resilience. However, it’s significantly below the minor resistance at $72.48 and the main resistance at $77.43. This positioning between the minor support and minor resistance, closer to the former, hints at a cautious market sentiment.

Overall, the market sentiment for Light Crude Oil Futures appears bearish, considering its position relative to key moving averages and resistance levels.

DAX Index: ECB and Fed Rate Path Bets to Test Investor Resilience

DAX Index: ECB and Fed Rate Path Bets to Test Investor Resilience

Overview of the DAX Performance on Tuesday

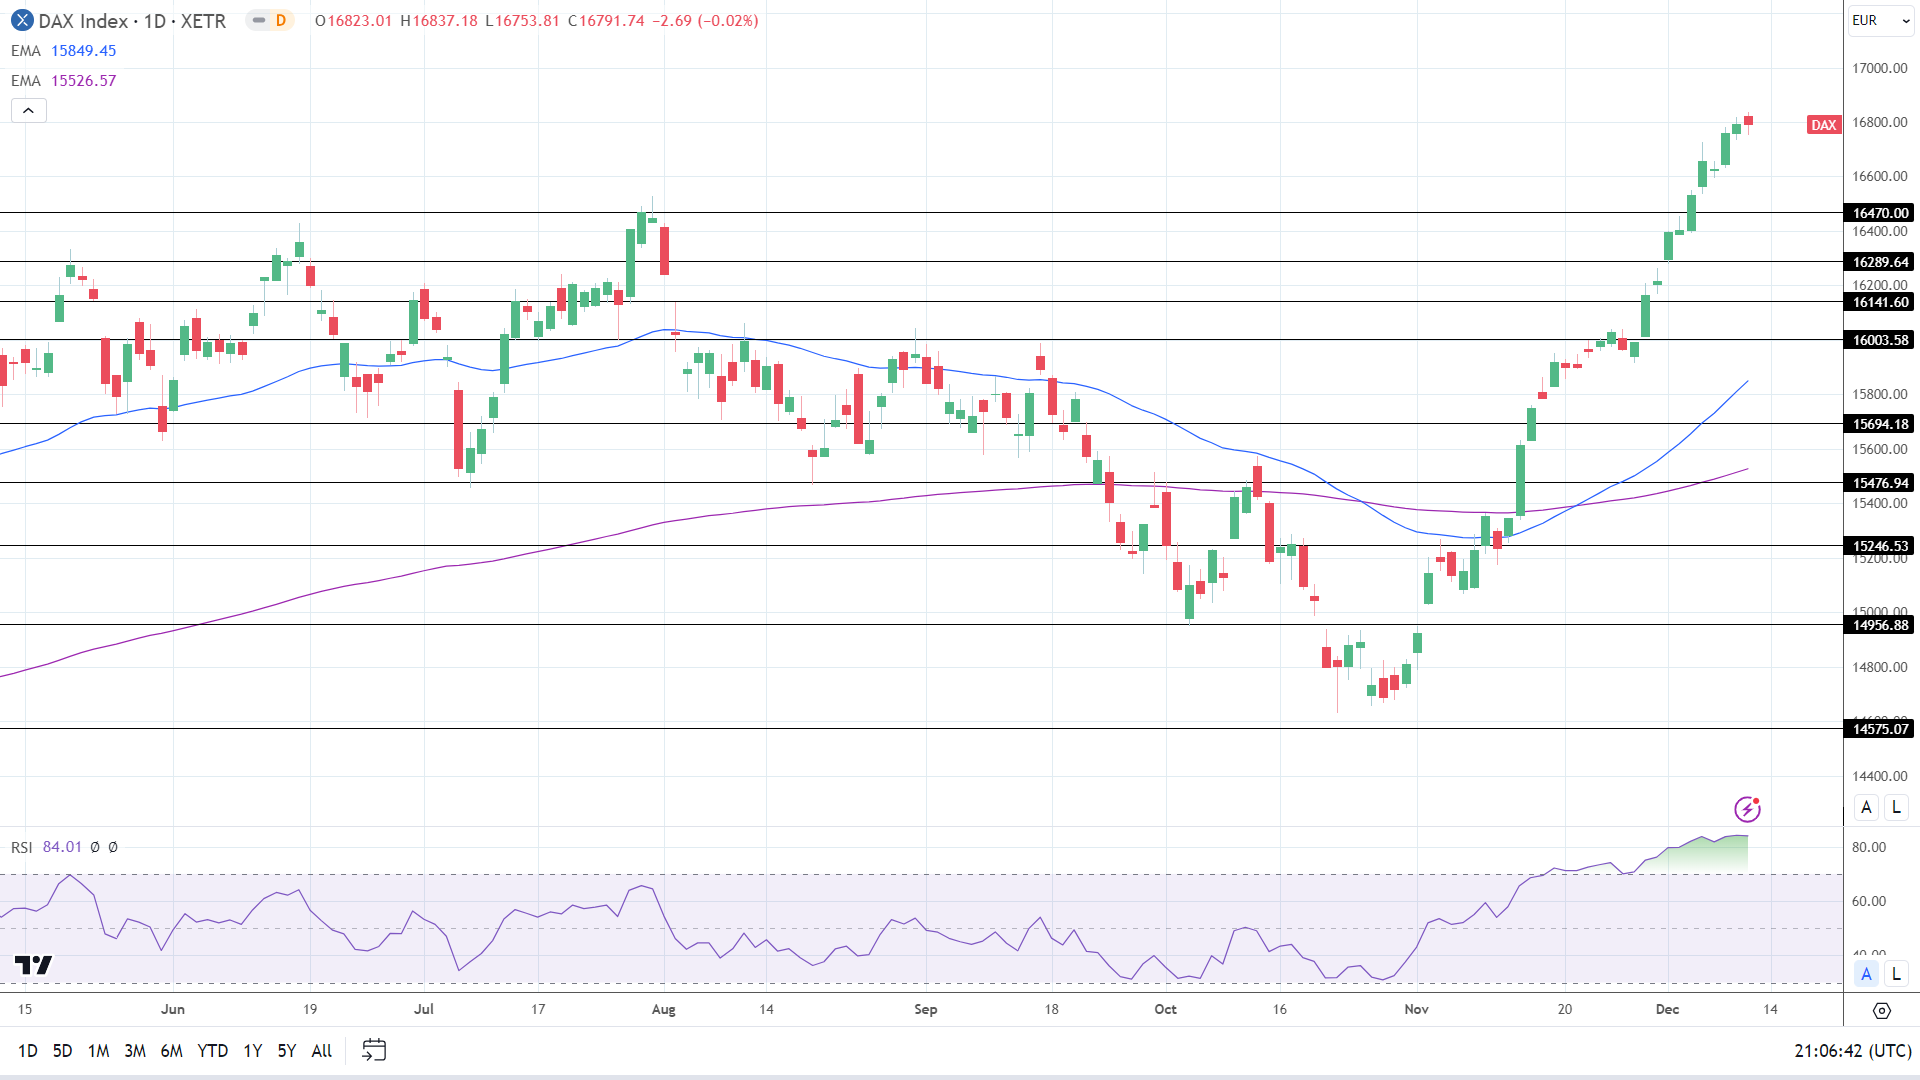
The DAX slipped by 0.02% on Tuesday. After a 0.21% gain on Monday, the DAX ended the Monday session at 16,792. Significantly, the DAX struck a new All-Time High (ATH) of 16,837 before falling into negative territory.

ZEW Economic Sentiment Numbers Delivered an Early Boost

On Tuesday, ZEW Economic Sentiment indicators for Germany and the Eurozone surprised the markets. Amidst the gloomy macroeconomic backdrop, analysts had a more positive view of the respective economies.

Trading Derivatives carries a high level of risk to your capital and you should only trade with money you can afford to lose. Trading Derivatives may not be suitable for all investors, so please ensure that you fully understand the risks involved, and seek independent advice if necessary. A Product Disclosure Statement (PDS) can be obtained either from this website or on request from our offices and should be considered before entering into a transaction with us. Raw Spread accounts offer spreads from 0.0 pips with a commission charge of USD $3.50 per 100k traded. Standard account offer spreads from 1 pips with no additional commission charges. Spreads on CFD indices start at 0.4 points. The information on this site is not directed at residents in any country or jurisdiction where such distribution or use would be contrary to local law or regulation.

The German ZEW Economic Sentiment indicator climbed from 9.8 to 12.8 in December. Economists forecast a fall to 8.8.

However, German wholesale prices from earlier in the session supported bets on a less hawkish ECB rate path. Wholesale prices were down 3.6% year-over-year in November vs. a 4.2% decline in October.

US CPI Report Tests Fed Rate Cut Bets

On Tuesday, the US CPI Report influenced buyer demand for DAX-listed stocks. Sticky inflation numbers for November eased bets on a Q1 Fed rate cut. Significantly, the reduced bets on a Fed rate cut countered market expectations of a less hawkish ECB rate path.

The US core inflation rate held steady at 4.0%, with consumer prices unexpectedly rising in November. Sticky inflation would be a headwind for the DAX as investors prepare for the Fed and ECB policy decisions.

However, the US equity markets offered the DAX with late support. On Tuesday, the Nasdaq Composite Index gained 0.70%, with the Dow and the S&P 500 rising by 0.48% and 0.46%, respectively. Market bets on the Fed ending its rate hike cycle contributed to the gains.

The Tuesday Market Movers

Zalando SE and Siemens Energy AG sat at the bottom of the DAX for a second consecutive session. Concerns about consumer demand left Zalando AG down 4.74%. Investors reacted further to the news of Morgan Stanley (MS) downgrading Encavis, another renewable energy producer, leaving Siemens Energy AG down 4.19%.

Auto stocks had a mixed session. Porsche declined by 0.80%, with Volkswagen and Mercedes Benz Group falling by 0.54% and 0.52%, respectively. BMW ended the session down 0.36%. Daimler Truck Holding bucked the trend, gaining 0.65%.

The mixed session reflected the countering influences of sticky US inflation and bets on a less hawkish ECB rate path.

However, Hannover Rueck SE rallied 2.13% as investors responded to its net profit projection (24%) for 2024.

Eurozone Industrial Production in Focus

On Wednesday, new loan data from China will draw investor interest. A jump in new loans could ease concerns about demand. However, news of progress toward a stimulus package in Beijing would likely have more impact.

Eurozone industrial production numbers warrant investor attention. Weaker-than-expected figures could fuel bets on a more dovish ECB. Economists forecast industrial production to decline by 0.3% in October after falling 1.1% in September.

US Producer Prices and the Fed in Focus

Later in the Wednesday session, US producer prices for November need consideration. After the US CPI Report, a larger-than-expected rise in producer prices could support bets on the Fed to leave rates unchanged over the near term.

Economists forecast producer prices to increase by 1.0 % year-over-year vs. 1.3% in October.

The US CPI Report and the producer price numbers will likely draw the Fed’s attention. Investor concerns regarding Fed interest rate projections may impact DAX-listed stocks.

The futures markets pointed to a mixed start to the Wednesday session. The DAX was down 26 points, while the Nasdaq mini was up 25.

Short-Term Forecast

Over the near term, trends for the DAX will hinge on the Fed and the ECB. A hawkish Fed could counter a dovish ECB. Significantly, a hawkish ECB could spook investors who expect the ECB to consider rate cuts in H1 2024.

DAX Technical Indicators

Daily Chart

The DAX held above the 50-day and 200-day EMAs, with the EMAs sending bullish price signals.

A DAX breakout from the Tuesday ATH 16,837 would support a move to the 17,000 psychological resistance level.

Eurozone industrial production and US producer prices are focal points during the European session.

However, a drop below the 16,750 handle would support a fall to the 16,470 support level.

The 14-day RSI reading of 84.01 shows the DAX in overbought territory. Selling pressure could intensify at the Tuesday ATH of 16,837.

DAX Daily EMAs send bullish price signals.
DAX 131223 Daily Chart

4-Hourly Chart

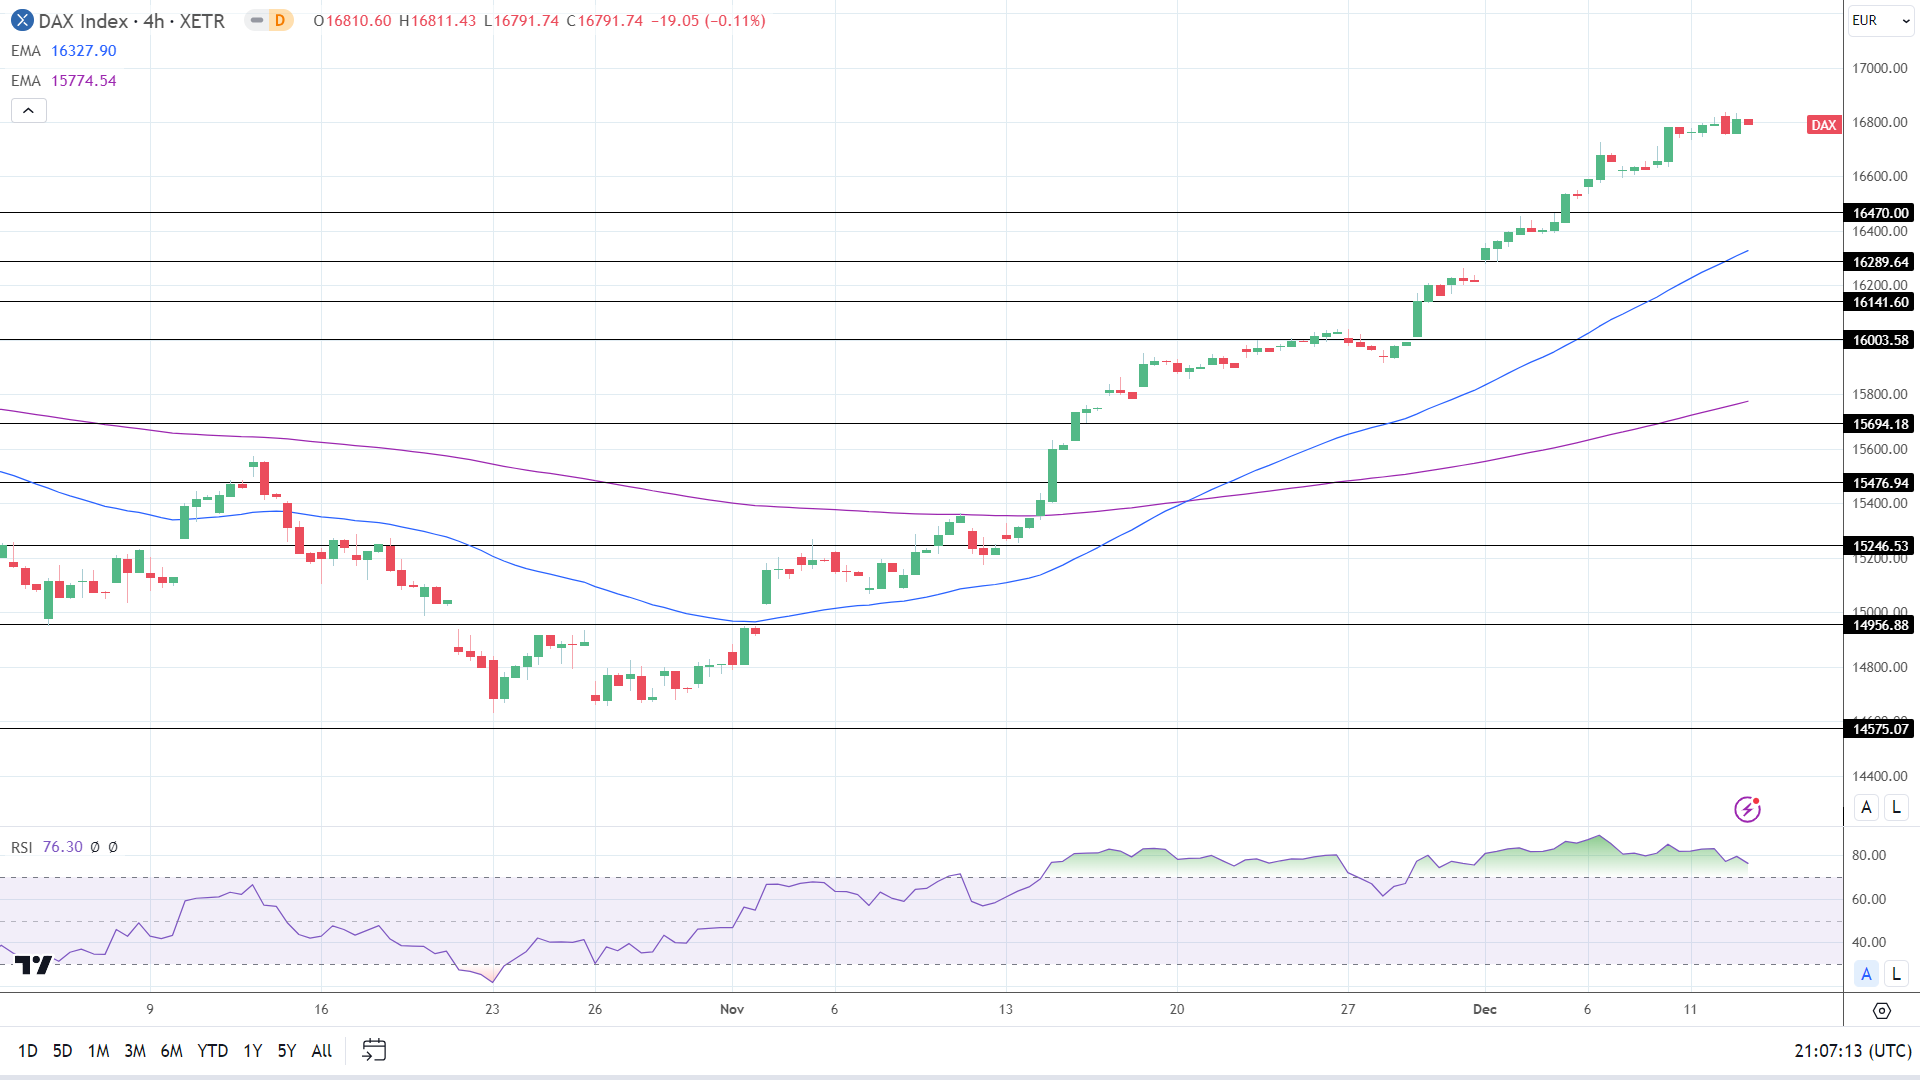
The DAX sat above the 50-day and 200-day EMAs, with the EMAs affirming bullish price signals.

A DAX breakout from the Tuesday ATH 16,837 would give the bulls a run at the 17,000.

However, a break below the 16,750 handle would bring the 16,470 support level into play.

The 76.30 14-4 hour RSI shows the DAX in overbought territory. Selling pressure could intensify at the all-time high of 16,837.

4-Hourly Chart EMAs affirm bullish price signals.
DAX 131223 4-Hourly Chart