EUR/USD Forecast: US Producer Prices and the Fed in the Spotlight

EUR/USD Forecast: US Producer Prices and the Fed in the Spotlight

Tuesday Overview

The EUR/USD rose by 0.27% on Tuesday. Following a 0.05% gain on Monday, the EUR/USD ended the day at $1.07941. The EUR/USD fell to a low of $1.07582 before rising to a high of $1.08277.

Eurozone Industrial Production in Focus

On Wednesday, Eurozone industrial production figures for October will garner investor interest. The manufacturing sector accounts for less than 40% of the Eurozone economy. However, weakness in the euro area economy could support bets on a less hawkish ECB rate path. A deteriorating demand environment remains a concern despite current inflation levels.

Trading Derivatives carries a high level of risk to your capital and you should only trade with money you can afford to lose. Trading Derivatives may not be suitable for all investors, so please ensure that you fully understand the risks involved, and seek independent advice if necessary. A Product Disclosure Statement (PDS) can be obtained either from this website or on request from our offices and should be considered before entering into a transaction with us. Raw Spread accounts offer spreads from 0.0 pips with a commission charge of USD $3.50 per 100k traded. Standard account offer spreads from 1 pips with no additional commission charges. Spreads on CFD indices start at 0.4 points. The information on this site is not directed at residents in any country or jurisdiction where such distribution or use would be contrary to local law or regulation.

Economists forecast industrial production to decline by 0.3% in October vs. a 1.1% slide in September.

With the ECB delivering its interest rate decision on Thursday, the EUR/USD could be more sensitive to the numbers.

US Producer Prices and the Fed in the Spotlight

On Wednesday, US producer prices need consideration. An increase in producer prices could indicate an improving demand environment. Within an improving demand environment, producers pass price increases on to consumers, driving demand-driven inflation. A positive inflation outlook could force the Fed to leave rates higher for longer to curb spending and dampen inflationary pressures.

Economists forecast producer prices to increase by 1.0% in November (Oct: +1.3%).

While the producer prices are a leading indicator of inflation, investors may hold back on decisive moves. The focal points will be the Fed interest rate decision, FOMC projections, and FOMC press conference. With the markets betting on the Fed leaving interest rates steady, the FOMC projections and press conference will move the dial.

Upward revisions to inflation, growth, and interest rate forecasts would drive buyer demand for the US dollar. However, Fed Chair Powell’s views on rate cut discussions also need consideration.

Short-Term Forecast:

Near-term trends for the EUR/USD will hinge on the Fed and ECB (Thurs) policy decisions and forward guidance. Recent economic indicators and central bank speeches suggest a monetary policy tilt toward the US dollar on resilient macroeconomic fundamentals.

EUR/USD Price Action

Daily Chart

The EUR/USD sat above the 50-day and 200-day EMAs, sending bullish price signals.

A EUR/USD return to the $1.08 handle would give the bulls a run at the $1.09294 resistance level.

Eurozone industrial production and the Fed are the focal points.

However, a EUR/USD fall through the $1.07838 support level and the EMAs would bring sub-$1.07 into view.

The 14-period Daily RSI, 48.03, indicates a EUR/USD fall below the $1.07000 handle before entering oversold territory.
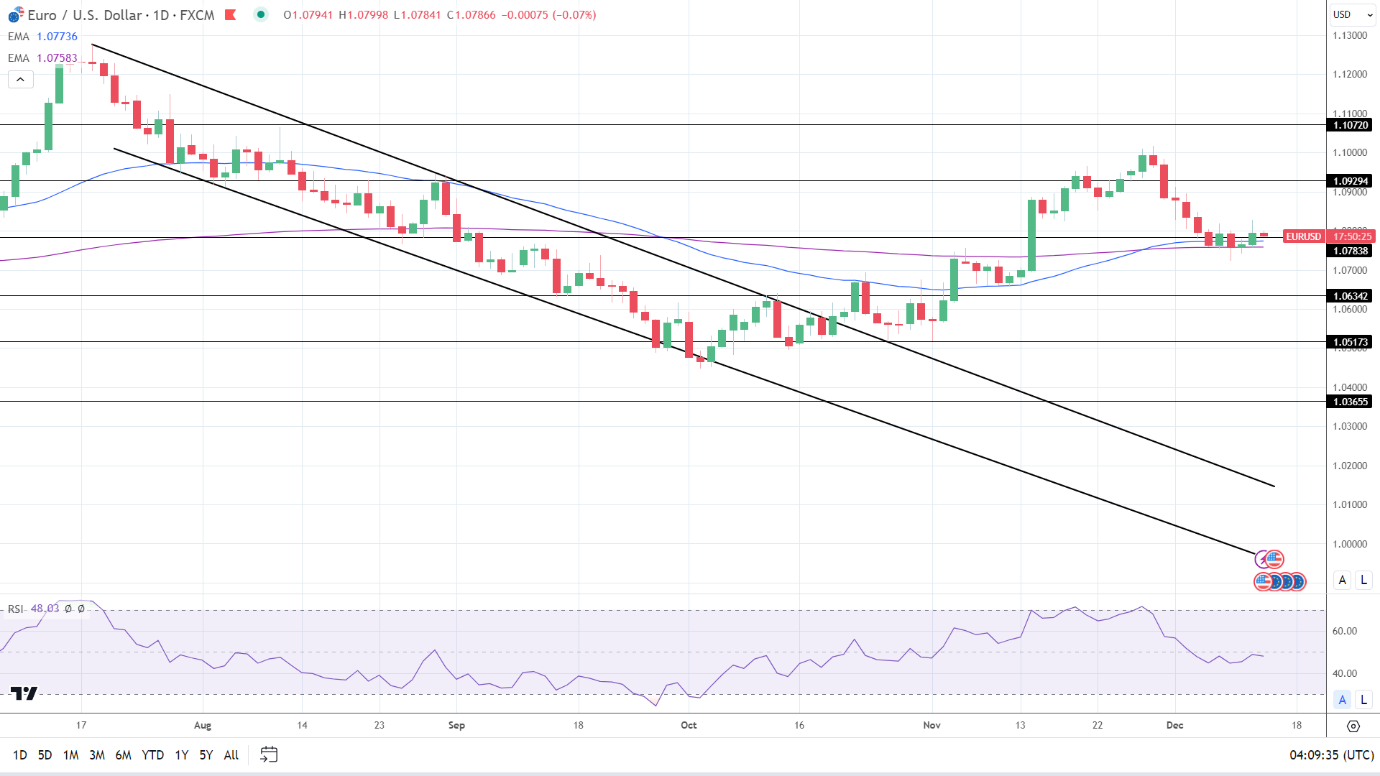
EUR/USD Daily Chart sends bullish price signals.
EURUSD 131223 Daily Chart

4-Hour Chart

The EUR/USD sat below the 50-day and 200-day EMAs, sending bearish price signals.

A EUR/USD break above the 200-day EMA would support a move to the 50-day EMA and the $1.0850 handle.

However, a EUR/USD drop below the $1.07838 support level would bring sub-$1.07500 into view.

The 14-period RSI on the 4-hour chart, 50.27, indicates a EUR/USD move through the 50-day EMA before entering overbought territory.
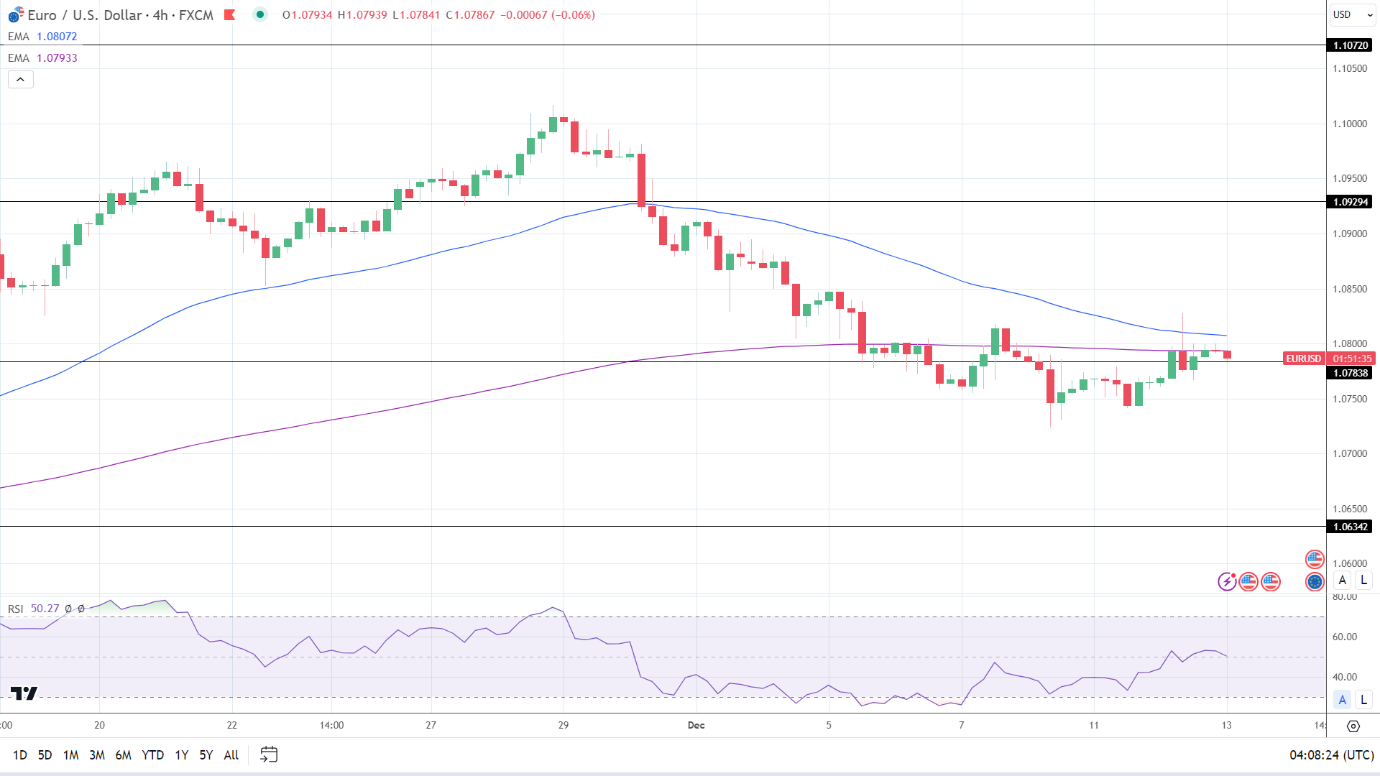

4-Hourly Chart sends bearish price signals.
EURUSD 131223 4 Hourly Chart
Gold Prices Forecast: Volatility Ahead as Fed Rate Decision Nears

Gold Prices Forecast: Volatility Ahead as Fed Rate Decision Nears

Gold Prices Waver as Fed Decision Looms

In early trading on Wednesday, gold (XAU/USD) prices are drifting lower, with traders closely watching the Federal Reserve’s impending interest rate decision. Spot Gold saw a decrease to $1974.71, while February Comex Gold futures also declined to $1990.10. This shift in gold prices is a direct response to the buildup of anticipation around the Fed’s policy announcement.

Interest Rates and Gold’s Prospects

With the market largely expecting the Fed to maintain interest rates between 5.25% and 5.50%, based on recent inflation figures, gold’s outlook appears uncertain. Should this rate stability continue, it might dampen the enthusiasm of gold investors who are looking for signs of a more dovish Fed stance. Additionally, the Fed’s future rate hike plans, as indicated in the “dot plot”, will be closely analyzed for any hawkish indications, potentially placing further pressure on gold prices.

Trading Derivatives carries a high level of risk to your capital and you should only trade with money you can afford to lose. Trading Derivatives may not be suitable for all investors, so please ensure that you fully understand the risks involved, and seek independent advice if necessary. A Product Disclosure Statement (PDS) can be obtained either from this website or on request from our offices and should be considered before entering into a transaction with us. Raw Spread accounts offer spreads from 0.0 pips with a commission charge of USD $3.50 per 100k traded. Standard account offer spreads from 1 pips with no additional commission charges. Spreads on CFD indices start at 0.4 points. The information on this site is not directed at residents in any country or jurisdiction where such distribution or use would be contrary to local law or regulation.

CPI Data and Economic Outlook

Recent data shows the U.S. Consumer Price Index (CPI) increased marginally by 0.1% last month, a slight change from October. Annually, the CPI was up 3.1% in November, a modest decrease from October’s 3.2% rise. These subtle shifts in inflation could prompt the Federal Reserve to reconsider its aggressive rate hike strategy, possibly making gold more appealing as an investment. Signs of economic slowdown could further solidify gold’s position as a sought-after safe-haven asset.

Global Influences and Dollar Dynamics

Gold’s value is also being shaped by the strength of the U.S. dollar and global geopolitical tensions. A weaker dollar could bolster gold prices, while a stronger dollar tends to have the opposite effect. Ongoing international disputes, particularly in Ukraine and across the Taiwan Strait, add to gold’s appeal as a safe-haven asset.

Diverse Analyst Perspectives

Analysts offer varying forecasts for gold: some anticipate a surge above $2,000, especially if the Fed adopts a more dovish approach amid economic downturns and effective inflation management.

Others advise caution, noting the Fed’s focus on curbing inflation and predicting limited short-term growth for gold. A minority voice warnings of potential price drops below $1,900, influenced by a stronger dollar and possible hawkish Fed moves.

In conclusion, gold’s immediate direction hinges on the Federal Reserve’s forthcoming decisions and key economic indicators. The interplay of these factors suggests a period of heightened volatility and uncertainty in the gold market.

Technical Analysis

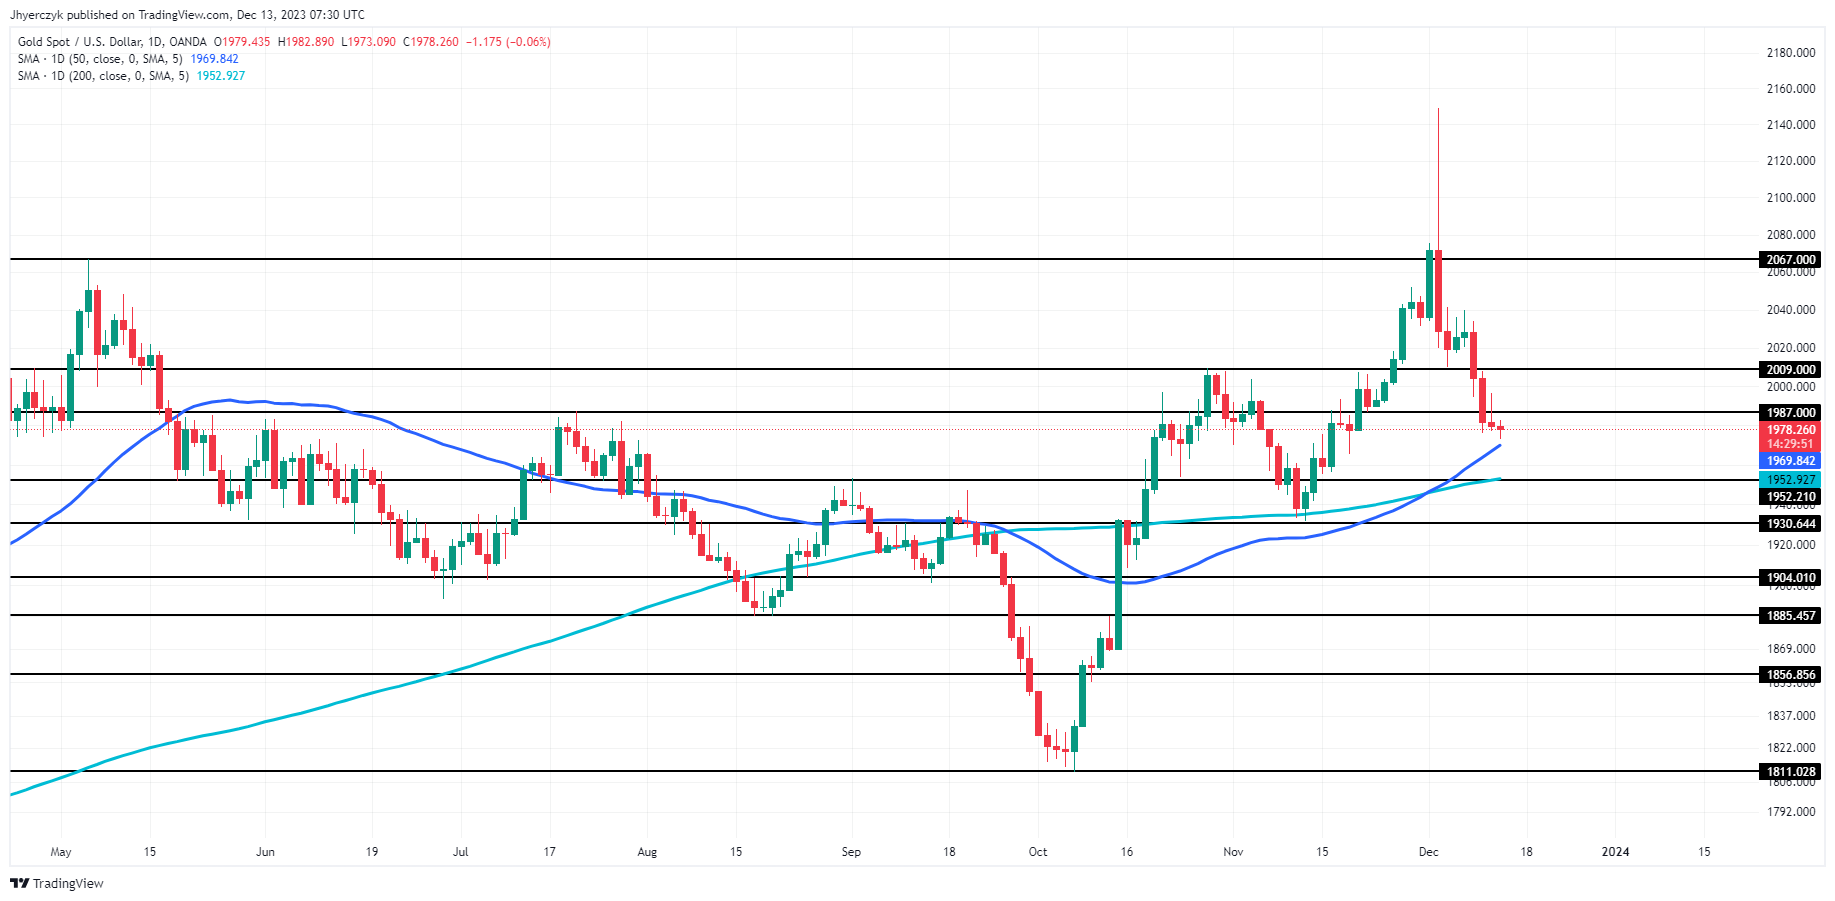
Daily Gold (XAU/USD)Gold (XAU/USD) is currently trading at $1979.30, hovering just above its 200-day moving average of $1952.93 and slightly below the 50-day average of $1969.85. This positioning indicates a neutral to slightly bullish sentiment, as the price is supported above the main and minor support levels of $1952.21 and $1930.64, respectively.

The proximity to minor resistance at $1987.00 and main resistance at $2009.00 suggests potential challenges for further upward movement. The market appears cautiously optimistic, but with resistance levels in close range, gold’s price movement is likely to be influenced by its ability to breach these thresholds.

This analysis points towards a balanced market sentiment with a slight bullish inclination, pending further price action around these key levels.

Hang Seng Index, ASX 200, Nikkei 225: US CPI Report, China, and the Fed in Focus

Hang Seng Index, ASX 200, Nikkei 225: US CPI Report, China, and the Fed in Focus

Overview of the Tuesday Session

On Tuesday, the Asian equity markets enjoyed a positive session. The Hang Seng Index ended a three-day losing streak. Hopes for a stimulus package from Beijing drove buyer demand. Investors responded to news of Chinese officials meeting to discuss stimulus plans and growth targets. The ASX 200 also benefitted from stimulus bets and Monday’s US equity market gains.

Easing fears of a Bank of Japan pivot from negative rates contributed to gains for the Nikkei Index. The gains came despite a weaker USD/JPY during the Asian session.

Trading Derivatives carries a high level of risk to your capital and you should only trade with money you can afford to lose. Trading Derivatives may not be suitable for all investors, so please ensure that you fully understand the risks involved, and seek independent advice if necessary. A Product Disclosure Statement (PDS) can be obtained either from this website or on request from our offices and should be considered before entering into a transaction with us. Raw Spread accounts offer spreads from 0.0 pips with a commission charge of USD $3.50 per 100k traded. Standard account offer spreads from 1 pips with no additional commission charges. Spreads on CFD indices start at 0.4 points. The information on this site is not directed at residents in any country or jurisdiction where such distribution or use would be contrary to local law or regulation.

The US equity markets set the tone for the Tuesday Asian session. On Monday, the Dow and S&P 500 rose by 0.43% and 0.39%, respectively. The Nasdaq Composite Index gained 0.20%.

US CPI Report to Set the Tone for the Wednesday Session

The overnight US CPI Report from Tuesday will set the tone for the Wednesday Asian session. The US annual and core inflation rates aligned with forecasts, signaling sticky inflation. In November, the core inflation rate held steady at 4.0%. Bets on a Q1 2024 Fed rate cut eased, while market expectations of a May 2024 Fed rate cut remained steady.

According to the CME FedWatch Tool, probabilities for a May Fed rate cut were:

  • 25-basis point rate cut – 50.0% vs. 50.4% (before the CPI Report).
  • 50-basis point rate cut – 23.7% vs. 24.0% (before the CPI Report).

10-year US Treasury yields initially jumped in response to the CPI Report before pulling back, supporting the appetite for riskier assets. On Tuesday, the Nasdaq Composite Index ended the day up 0.70%. The Dow and S&P 500 saw gains of 0.48% and 0.46%, respectively.

Asian Economic Calendar, China, and Fed Jitters

On Wednesday, the Asian economic calendar warrants attention. Tankan Survey-based numbers from Japan will draw investor interest. The Tankan Large Manufacturers Index will be the focal point. Economists forecast the Index to rise from 9 to 10 in Q4. Notably, the Bank of Japan will consider the survey-based numbers in the next monetary policy meeting.

Post-release BoJ commentary could also influence the Nikkei. Rising bets on the BoJ delaying plans to exit negative rates could support buyer demand.

However, updates from the closed-door meetings in China and Fed jitters will also influence the Asian equity markets.

ASX 200

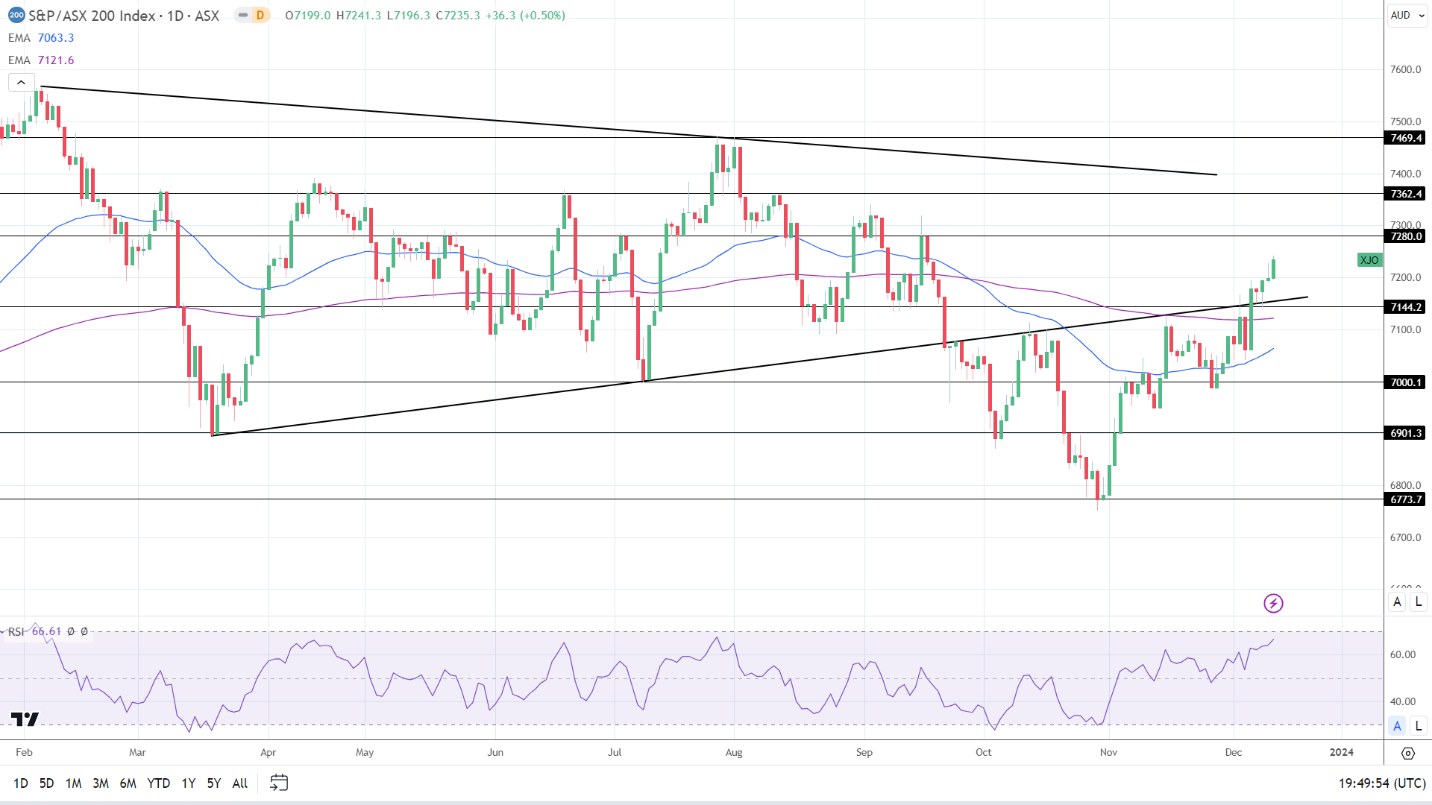
ASX 200 enjoyed a positive Tuesday session.
ASX200 131223 Daily ChartThe ASX 200 rose by 0.50% on Tuesday. Tech stocks led the way, with the S&P/ASX All Technology Index rallying 1.17%.

Oil stocks had a positive Tuesday session. Woodside Energy Group Ltd (WDS) and Santos Ltd (STO) gained 0.26% and 0.27%, respectively. However, it was a mixed session for the big four banks and mining stocks.

ANZ Group Holdings Ltd (ANZ) and National Australia Bank Ltd. (NAB) saw gains of 0.77% and 0.75%. Commonwealth Bank of Australia (CBA) rose by 0.44%, while Westpac Banking Corp. (WBC) ended the session flat.

BHP Group Ltd (BHP) and Fortescue Metals Group Ltd. (FMG) ended the session up 0.04% and 1.62%, respectively. Rio Tinto Ltd. (RIO) declined by 0.29%.

Gold (XAU/USD) stocks also had a mixed session. Northern Star Resources Ltd. (NST) fell by 0.16%, while Evolution Mining Ltd. (EVN) rose by 0.28%.

Hang Seng Index

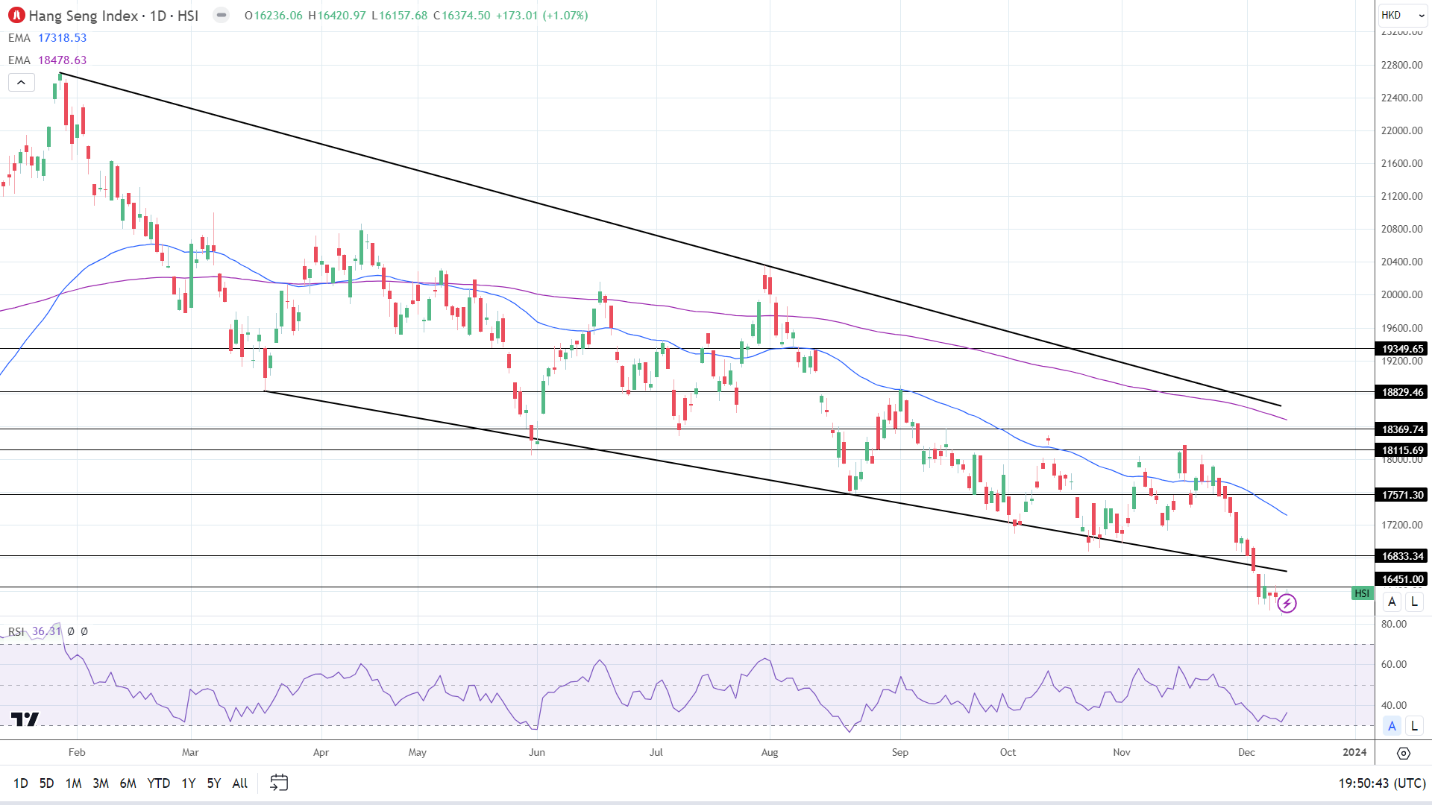
Hang Seng Index ends four day losing streak.
HSI 131223 Daily ChartThe Hang Seng Index gained 1.07% on Tuesday, with the tech and real estate sectors contributing. The Hang Seng Tech Index rallied 1.74%, with the Hang Seng Mainland Properties index climbing 4.53%.

Alibaba (9988) and Tencent (0700) saw gains of 1.89% and 1.37%

Bank stocks also had a positive session on hopes of a stimulus plan. HSBC (0005) increased by 0.58%. China Construction Bank (0939) and Industrial Commercial Bank (1398) ended the day up 1.58% and 1.11%, respectively.

The Nikkei 225

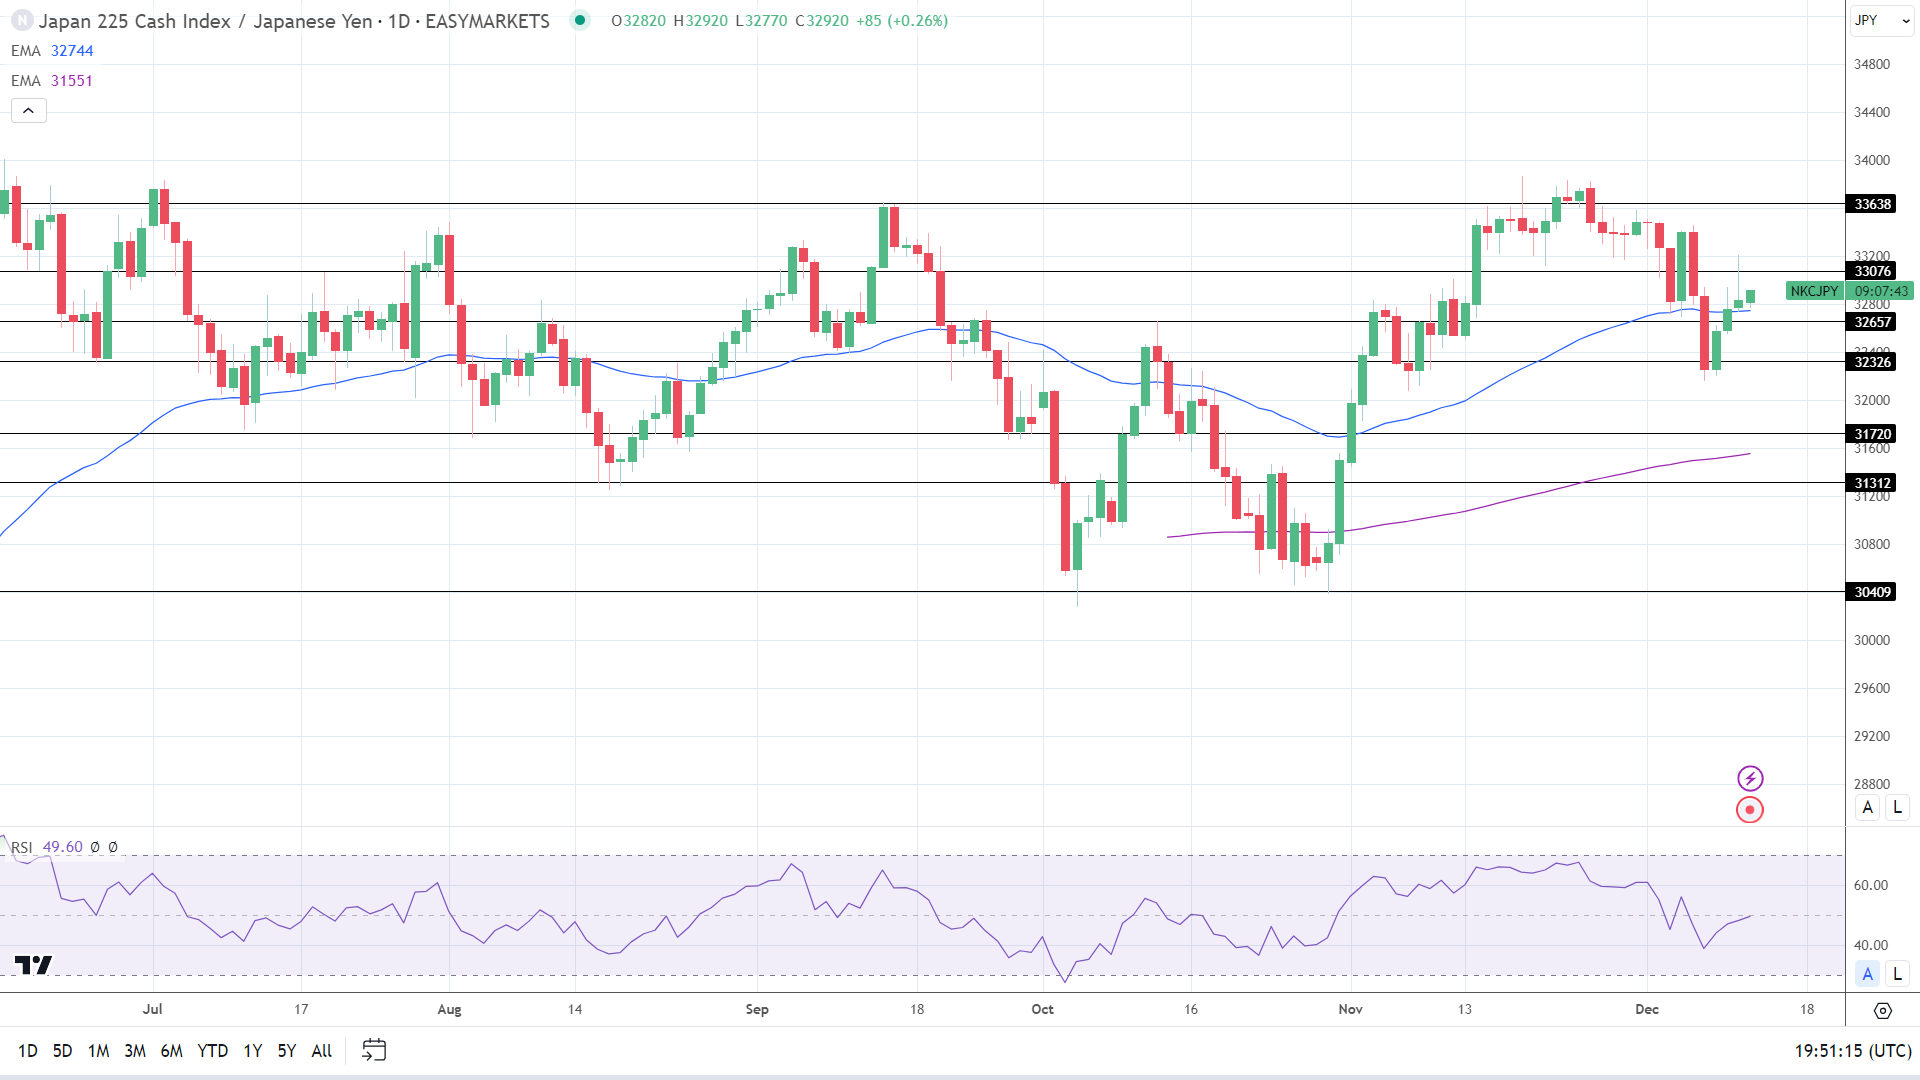
Nikkei made gains on BoJ policy bets.
Nikkei 131223 Daily Chart(Graph for reference purposes only)

The Nikkei increased by 0.16%. A weaker USD/JPY capped the upside.

Bank stocks ended a four-day winning streak on easing bets on a BoJ pivot. Sumitomo Mitsui Financial Group Inc. (8316) and Mitsubishi UFJ Financial Group Inc. (8306) fell by 1.20% and 1.60%, respectively. However, it was a positive session for the main components of the Nikkei.

Tokyo Electron Ltd. (8035) gained 1.48%. Fast Retailing Co. Ltd. (9983) and KDDI Corp. (9433) ended the day up 0.65% and 0.64%, respectively. Sony Group Corp. (6758) and Softbank Group Corp. (9948) rose by 0.19% and 0.36%, respectively

XRP News: The SEC v Ripple Final Push – Legal Battle and Regulatory Risks

XRP News: The SEC v Ripple Final Push – Legal Battle and Regulatory Risks

The Tuesday Overview

On Tuesday, XRP gained 0.02%. After a 6.50% slide on Monday, XRP ended the day at $0.6188.

SEC v Ripple Silence a Headwind

There was no SEC v Ripple case-related news for investors to digest on Tuesday. The SEC and Ripple entered the final stage of the case in November. Remedies-related discovery ends on February 12, 2024.

Trading Derivatives carries a high level of risk to your capital and you should only trade with money you can afford to lose. Trading Derivatives may not be suitable for all investors, so please ensure that you fully understand the risks involved, and seek independent advice if necessary. A Product Disclosure Statement (PDS) can be obtained either from this website or on request from our offices and should be considered before entering into a transaction with us. Raw Spread accounts offer spreads from 0.0 pips with a commission charge of USD $3.50 per 100k traded. Standard account offer spreads from 1 pips with no additional commission charges. Spreads on CFD indices start at 0.4 points. The information on this site is not directed at residents in any country or jurisdiction where such distribution or use would be contrary to local law or regulation.

The discovery process gives Ripple the opportunity to water down the $770 million in XRP sales to institutional investors. In contrast, the SEC will look for ways to scoop a punitive disgorgement. Considering the stakes, a pre-February settlement remains elusive.

The lack of progress toward a settlement leaves an SEC appeal of the Programmatic Sales of XRP ruling in the distance. However, an appeal is likely, barring US legislation addressing the securities law issue.

Significantly, the prospect of an appeal and the uncertainty about the outcome exposes XRP to regulatory risk.

Senator Elizabeth Warren and SEC Chair Gary Gensler Remain Focal Points

On Tuesday, amicus curiae attorney John E. Deaton revisited the recent Senator Elizabeth Warren press release. Discussing the latest move against the US digital asset space, Deaton said,

“Her bill is a BIG deal. NINE US Senators have joined her, including Republicans and Independents. As I’ve said, if you’re talking about people, Elizabeth Warren is the single biggest threat to Crypto in the United States. It’s not Gensler because Gensler takes his marching orders from Warren.”

Notably, Senator Warren has a poor record of sponsoring successful bills. However, increasing anti-crypto rhetoric on Capitol Hill could give the Digital Asset Anti-Money Laundering Act a chance.

While the bill may not directly impact XRP, the impact on US crypto exchanges could be significant. The bill could directly impact the SEC vs. Coinbase (COIN) case. Imposing banking regulations onto the digital asset space would give the SEC statutory authority to regulate crypto exchanges.

In August, Coinbase filed a motion to dismiss (MTD). Coinbase argued the SEC lacked the statutory authority to regulate crypto exchanges. Senator Warren’s bill could address the issue of statutory authority for the SEC.

However, Senator Elizabeth Warren is not the only vocal Senator on Capitol Hill. In August, Senator Cynthia Lummis filed an amicus brief supporting the Coinbase MTD. Notably, Senators Lummis and Kirsten Gillibrand introduced the Responsible Financial Innovation Act in 2022, proposing the CFTC has more authority over the digital asset space.

Updates on the passage of the two bills could materially influence XRP and the crypto market.

XRP Price Action

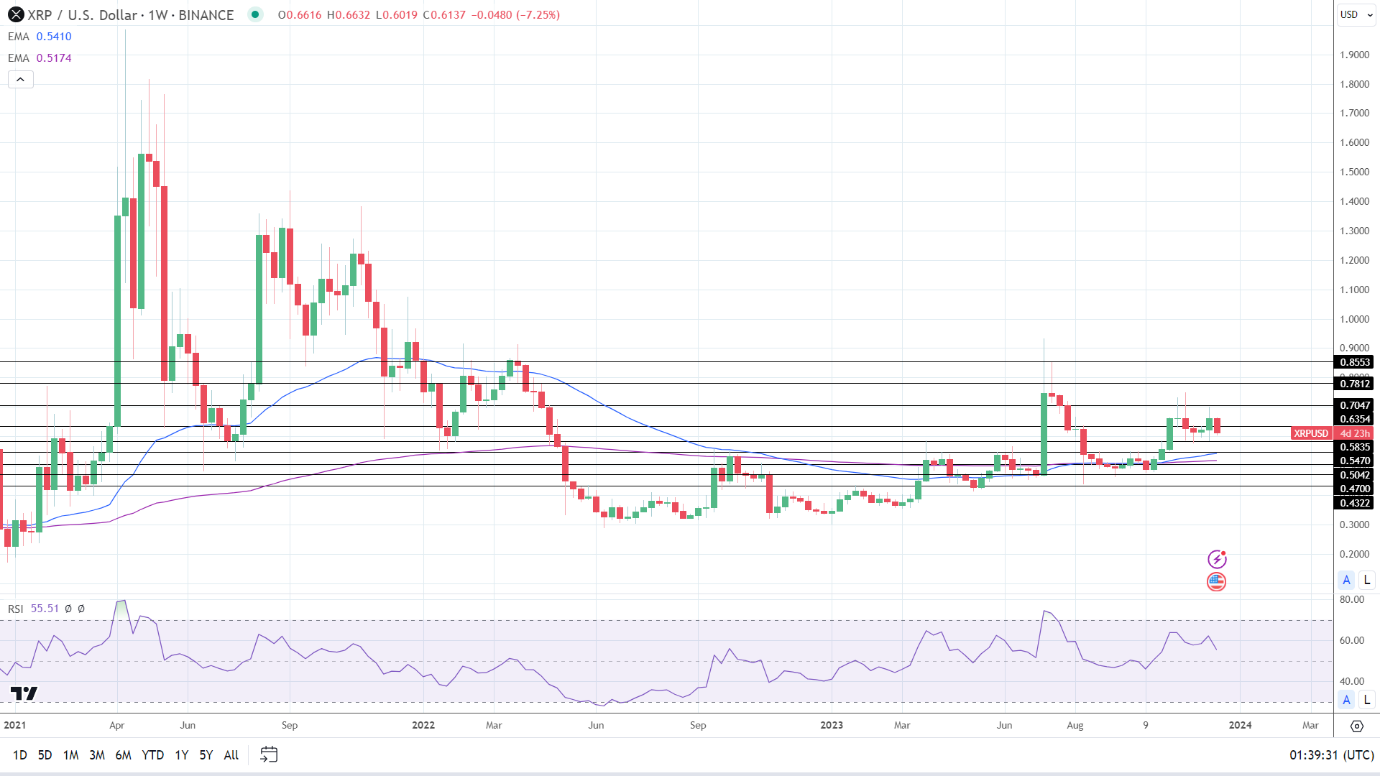
Weekly Chart sends bullish price signals.
XRPUSD 131223 Weekly Chart

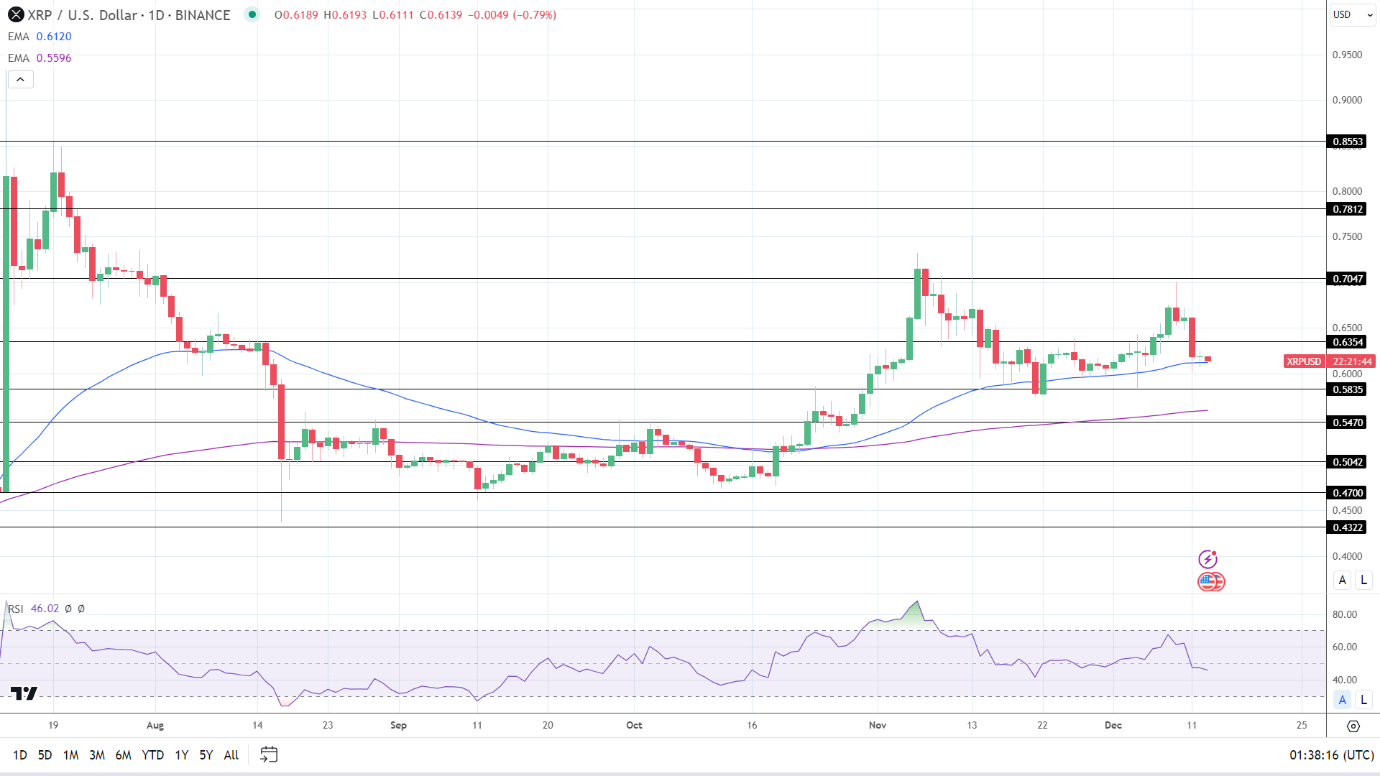
Daily Chart

XRP held above the 50-day and 200-day EMAs, sending bullish price signals.

An XRP break above the $0.6354 resistance level would support a move to the $0.7047 resistance level.

SEC v Crypto case-related news, US lawmaker comments, and SEC activity remain focal points.

However, a fall through the 50-day EMA would bring the $0.5835 support level into play.

The 14-day RSI reading, 46.02, indicates a drop to the $0.5835 support level before entering oversold territory.

XRP Daily Chart sends bullish price signals.
XRPUSD 131223 Daily Chart

4-Hourly Chart

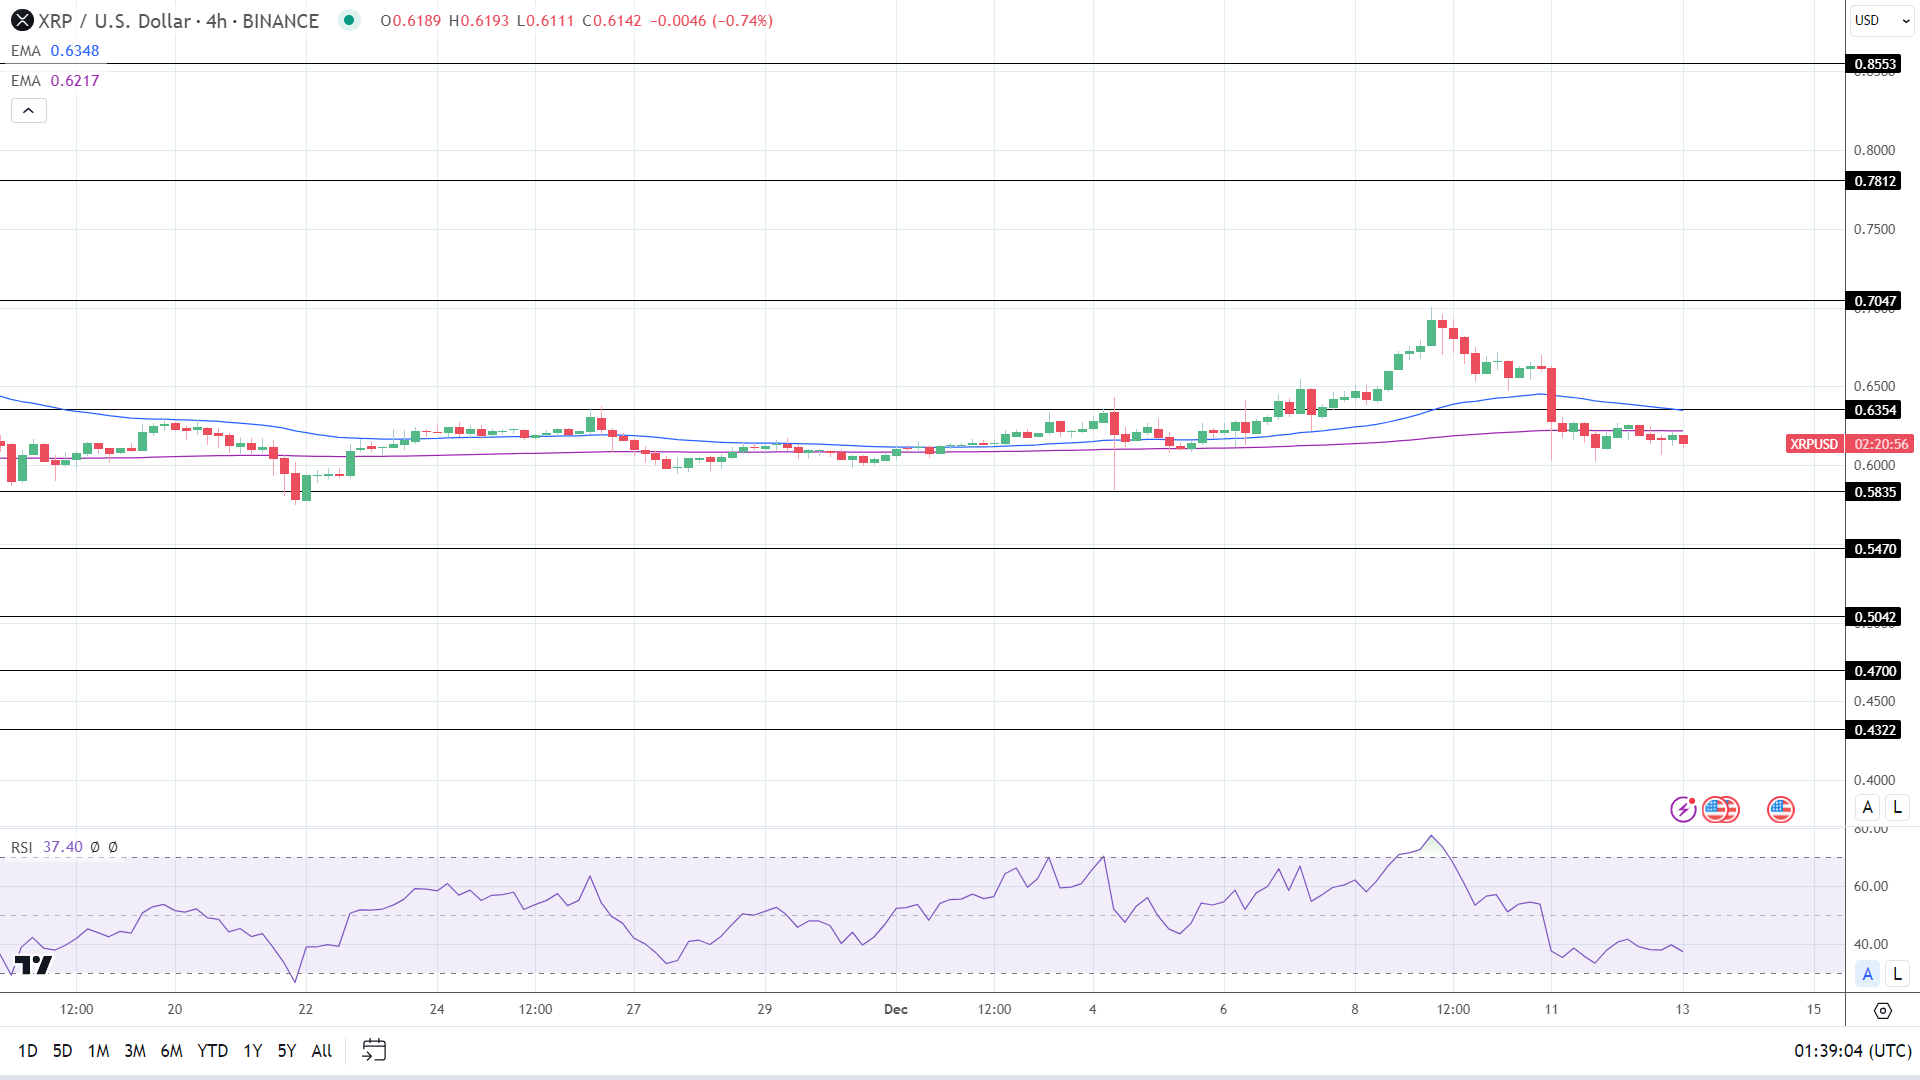
On the 4-hourly, XRP remained below the 50-day and 200-day EMAs, affirming bearish price signals.

An XRP move through the 200-day EMA would support a break above the 50-day EMA and the $0.6354 resistance level. However, selling pressure could intensify at $0.6350. The 50-day EMA is confluent with the $0.6354 resistance level.

However, an XRP fall through the $0.60 handle would bring the $0.5835 support level into play.

The 4-hourly RSI, with a reading of 37.40, indicates an XRP fall to the $0.60 handle before entering oversold territory.

XRP 4-Hourly Chart sends bearish price signals.
XRPUSD 131223 4-Hourly Chart
Traders Cut Bets On Dovish Fed As Inflation Meets Expectations

Traders Cut Bets On Dovish Fed As Inflation Meets Expectations

On December 12, U.S. released inflation reports for November. Inflation Rate declined from 3.2% in October to 3.1% in November, while Core Inflation Rate remained unchanged at 4%. Both reports met analyst estimates.

Inflation data is especially important as Fed will release its interest rate decision tomorrow. Markets expect that Fed will leave the federal funds rate unchanged, so traders will be mostly focused on Powell’s comments.

U.S. Dollar Index moved from session lows after the release of inflation reports. It looks that traders expected that Inflation Rate would drop to 3%, while Core Inflation Rate would dip to 3.9%. When the report was released, such traders rushed to cover their short positions. Currently, U.S. Dollar Index is trying to settle above the 104.00 level.

Gold pulled back towards the $1980 level as traders focused on U.S. dollar’s rebound. Rising Treasury yields put additional pressure on gold markets. From a big picture point of view, the market sentiment remains bearish after an unsuccessful attempt to settle above the $2100 level.

SP500 pulled back from session highs as traders reacted to inflation data. Inflation did not fall faster than expected, so traders fear that Fed may not be dovish. However, it should be noted that the pullback was not significant. Currently, SP500 settled near the 4615 level. The market sentiment remains bullish, and Powell’s press conference is the only catalyst that can change the trend in the near term.

Bitcoin (BTC) Price Rebound in Motion, Can it Reach $50k after $100M Liquidations?

Bitcoin (BTC) Price Rebound in Motion, Can it Reach $50k after $100M Liquidations?

Bitcoin (BTC) price tumbled 5% toward $41,600 on Monday, December 11 as bullish traders suffered over $100 million worth of liquidations within hours. With BTC making an instant rebound above $42,000, a vital technical indicator highlights the next significant resistance ahead.

Bitcoin’s Price Correction Triggered $104 Million LONG Liquidations

Bitcoin experienced a flash crash on Monday, Dec 11, which sent the pioneer cryptocurrency on a 5% tailspin toward $41,600. BTC made a quick rebound above, but not before the derivatives traders had taken a $100 million hit.

Trading Derivatives carries a high level of risk to your capital and you should only trade with money you can afford to lose. Trading Derivatives may not be suitable for all investors, so please ensure that you fully understand the risks involved, and seek independent advice if necessary. A Product Disclosure Statement (PDS) can be obtained either from this website or on request from our offices and should be considered before entering into a transaction with us. Raw Spread accounts offer spreads from 0.0 pips with a commission charge of USD $3.50 per 100k traded. Standard account offer spreads from 1 pips with no additional commission charges. Spreads on CFD indices start at 0.4 points. The information on this site is not directed at residents in any country or jurisdiction where such distribution or use would be contrary to local law or regulation.

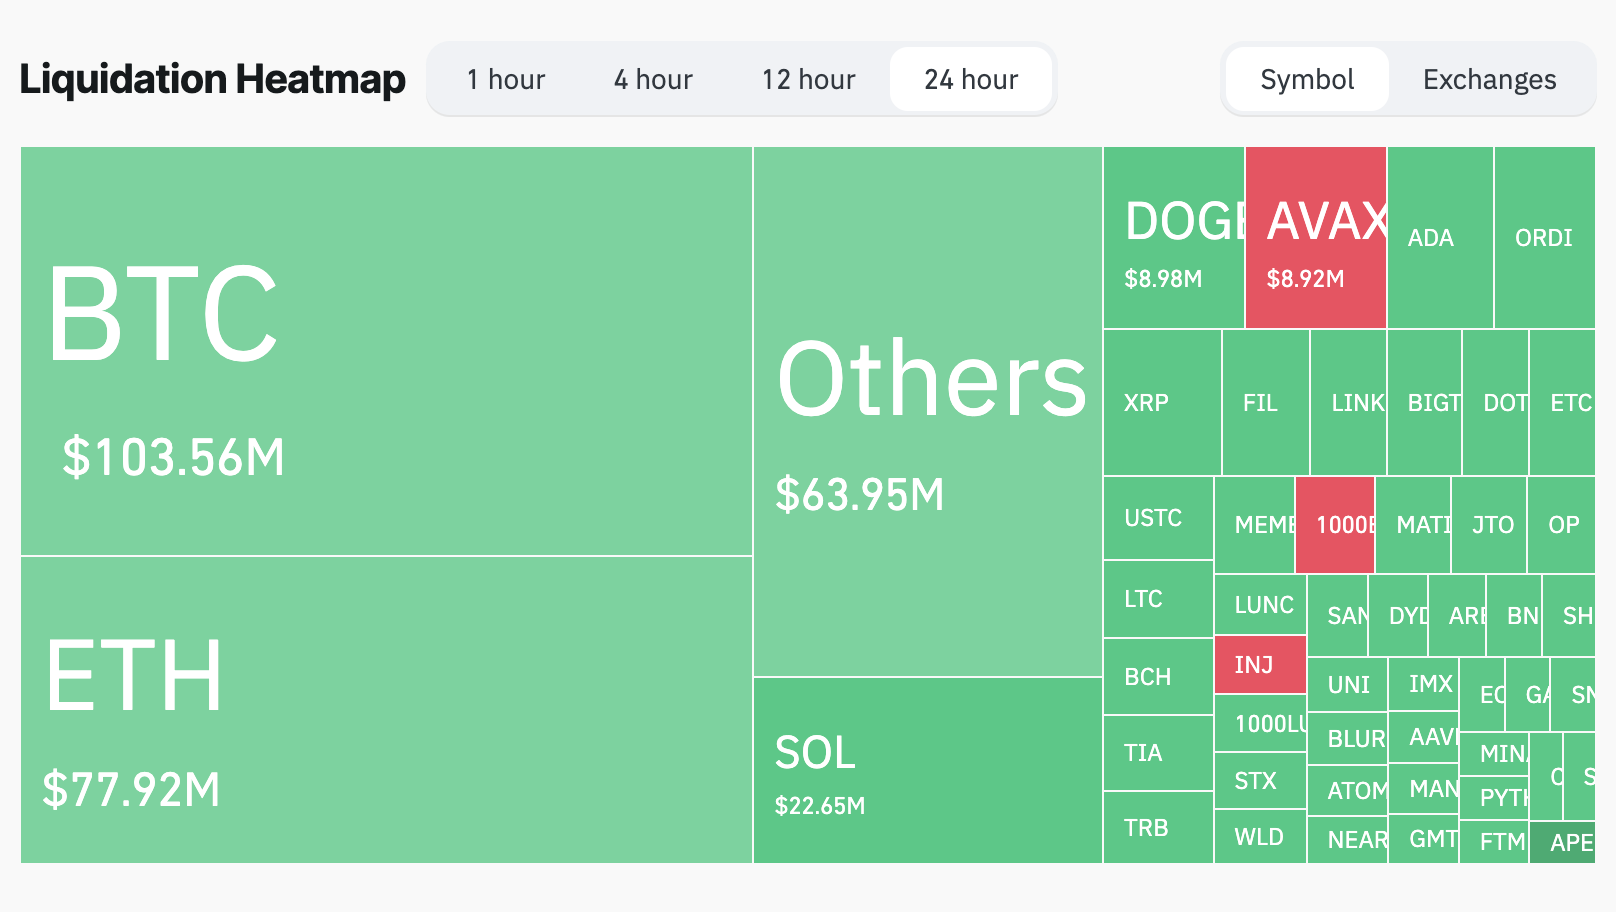
According to crypto derivatives data tracker, Coinglass, about $400 million worth of crypto futures contracts were wiped out during the eventful flash crash on Monday morning. Notably, the chart below illustrates that Bitcon LONG position holders (bullish traders) took a hit of $103.46 million over the last 24 hours.

Crypto Futures Markets Liquidations Heatmap, Dec 11 2023. | Source: Coinglass

Crypto Futures Markets Liquidations Heatmap, Dec 11 2023. | Source: Coinglass The Crypto Liquidations Heatmap is a visual representation that displays the liquidation events of cryptocurrency positions across various assets and trading pairs during a given trading period.

It provides a graphical overview of the areas where a significant number of liquidations that occurred in the market on Dec 11.

The chart above clearly illustrates that traders who held LONG positions  on Bitcoin and Ethereum (ETH) suffered majority of the losses that arose for the $389 million liquidations in the global crypto derivatives markets on Monday.

BTC and ETH LONG traders took a loss of $103.56 and $77.92 million, which accounts for 26% and 20% of the total liquidations respectively.

Interestingly, BTC price made a quick rebound above $42,000 by noon (GMT) as the bulls swooped to defend their positions.

Can Bitcoin Price Reach $50,000 ?

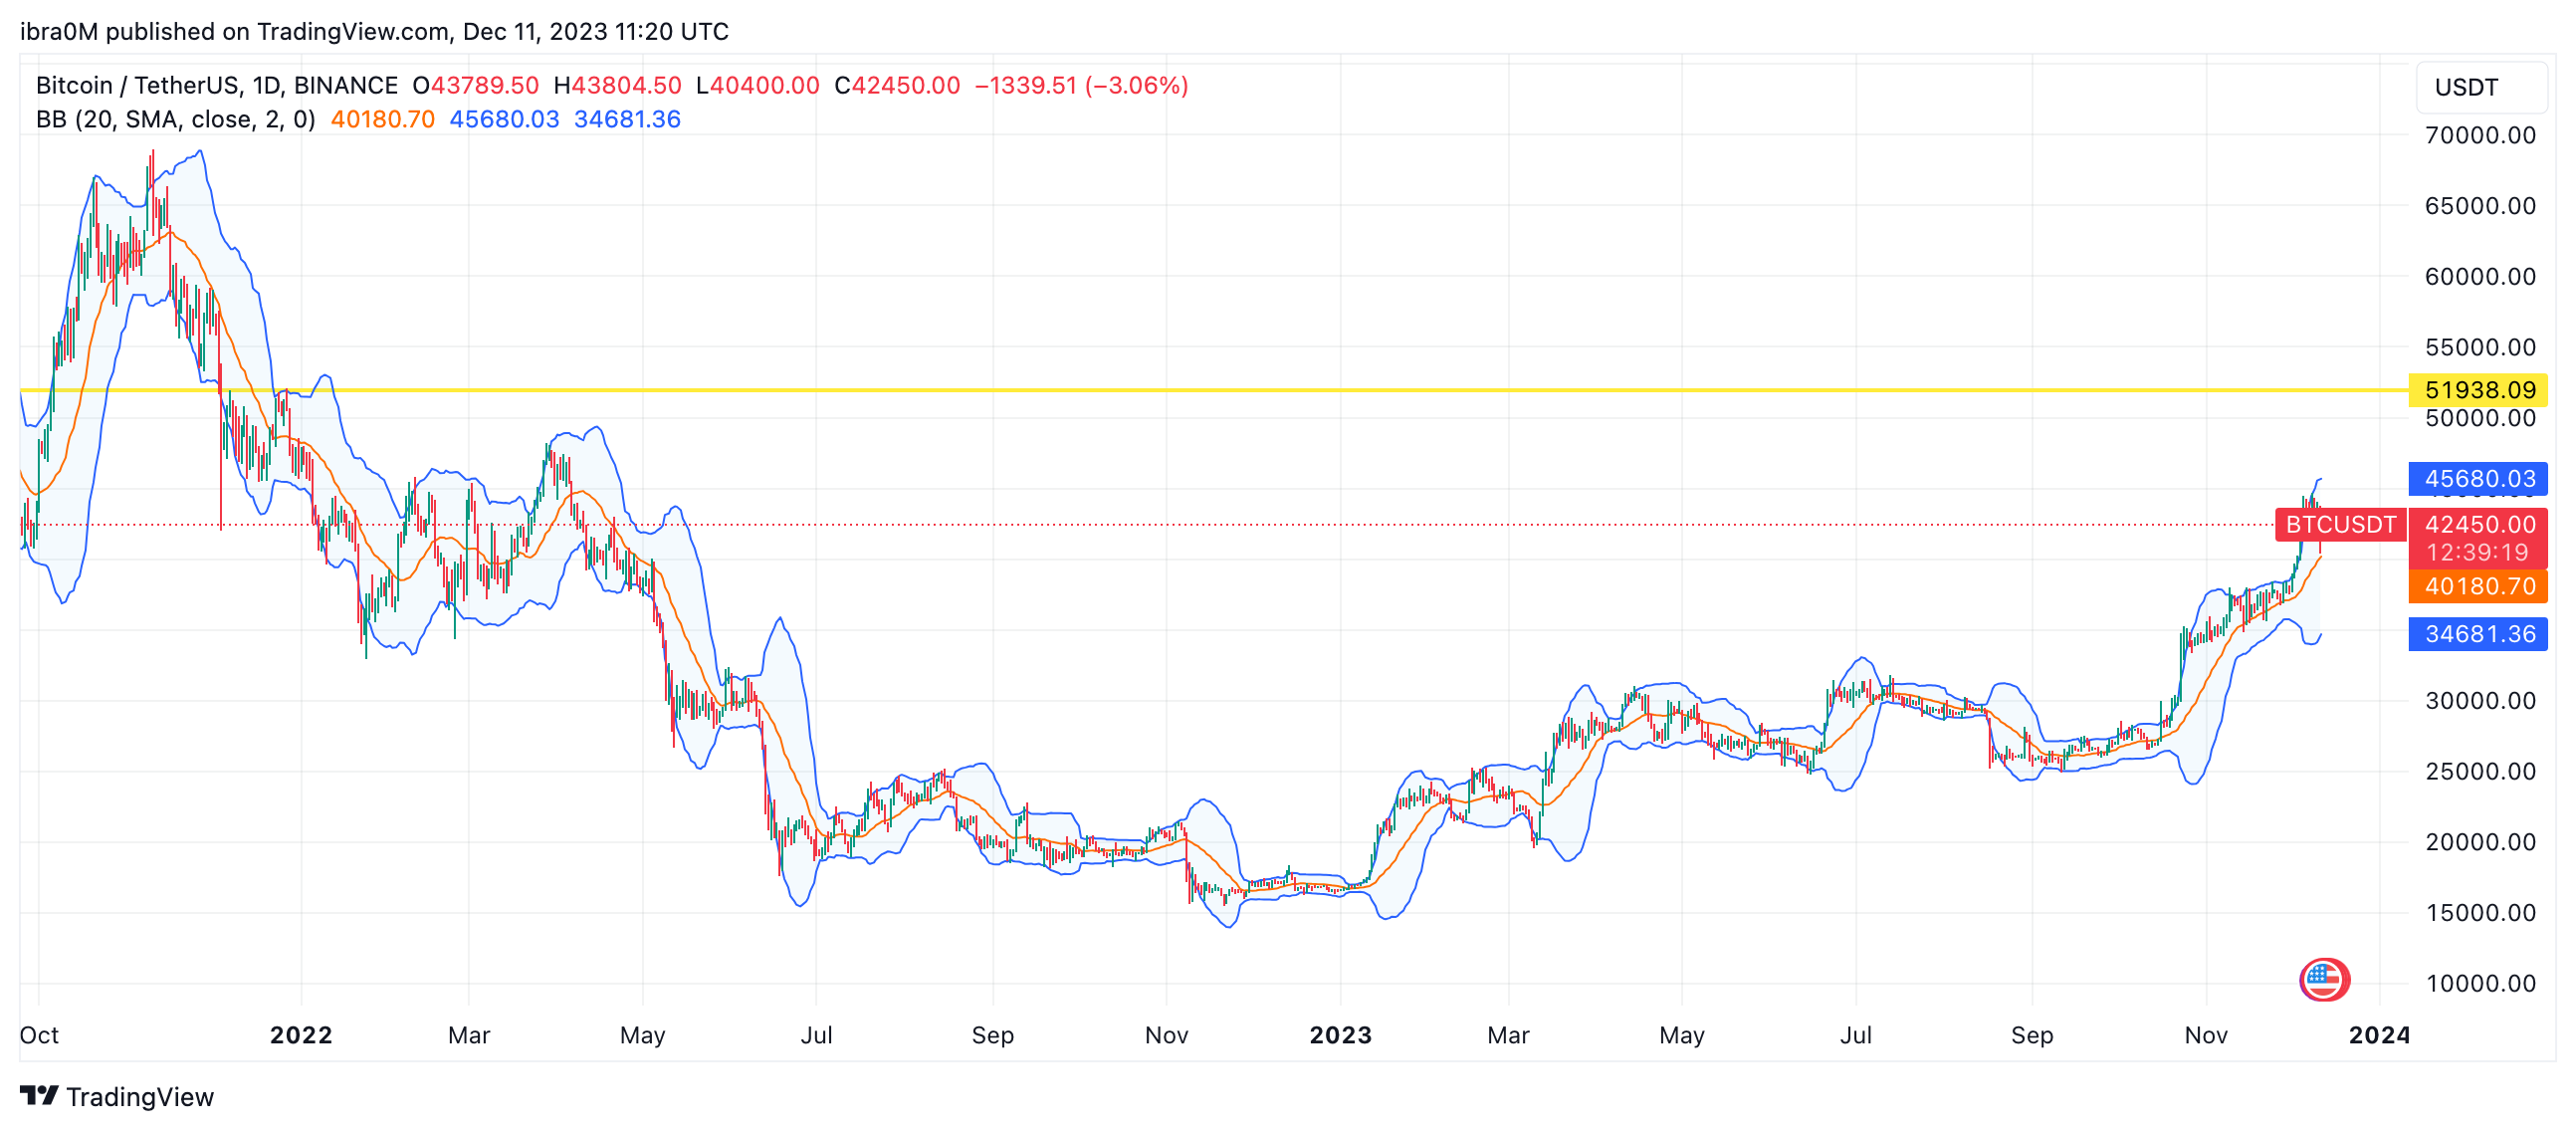
Bitcoin price remains on track to reach $50,000 based on key on-chain indicators like network usage, and whale accumulation. Furthermore, from a technical perspective, the Bollinger Bands indicator suggests that breaking the initial resistance around $45,700 will likely trigger a decisive breakout above $52,000.

As depicted in the chart below, Bitcoin price is well below upper Bollinger Band at $45,655, suggesting that the market is far from overheated. Given that the recent correction on Monday has also cooled funding rates and aggressive trading in the derivatives market, prospective investors could consider this alignment a decent entry point.

If current holders keep defending their positions as observed in the last 24 hours, those anticipated fresh capital inflows could power BTC price above the $45,700 resistance and trigger a $52,000 retest in the long term.

Bitcoin (BTC) Price Forecast Dec 2023. Source: TradingView

Bitcoin (BTC) Price Forecast Dec 2023. Source: TradingViewBut on downside, the bears could seize control of the market if Bitcoin price dips below the $40,000 psychological support level.

However, the lower Bollinger Band at $40,171, could form a major accumulation zone, and prevent a major downswing.

US Dollar Index News: DXY Firms Ahead of Fed Meeting, CPI Data

US Dollar Index News: DXY Firms Ahead of Fed Meeting, CPI Data

Dollar-Yen Bounce Back

The dollar rebounded above 145 yen, countering its recent drop against the Japanese currency. This change stems from speculations about the Bank of Japan possibly nearing the end of its ultra-low interest rate policy. However, recent reports indicate the BOJ might maintain its current stance, awaiting stronger wage growth evidence.

Currency Movements

Sterling saw a minor decline, while the euro edged up slightly. The dollar index, tracking the greenback against a basket of currencies, increased to 104.12. All eyes are now on the Federal Open Market Committee meeting and the U.S. inflation report, which could influence the dollar’s trajectory.

Short-term Outlook

The market’s immediate focus is on the Federal Reserve meeting and Chair Jerome Powell’s remarks. The market reaction to Powell’s tone will be critical – a more cautious or dovish approach might lead to a softer dollar, while a firmer stance could uphold the currency’s strength.

Technical Analysis

Daily US Dollar Index (DXY)

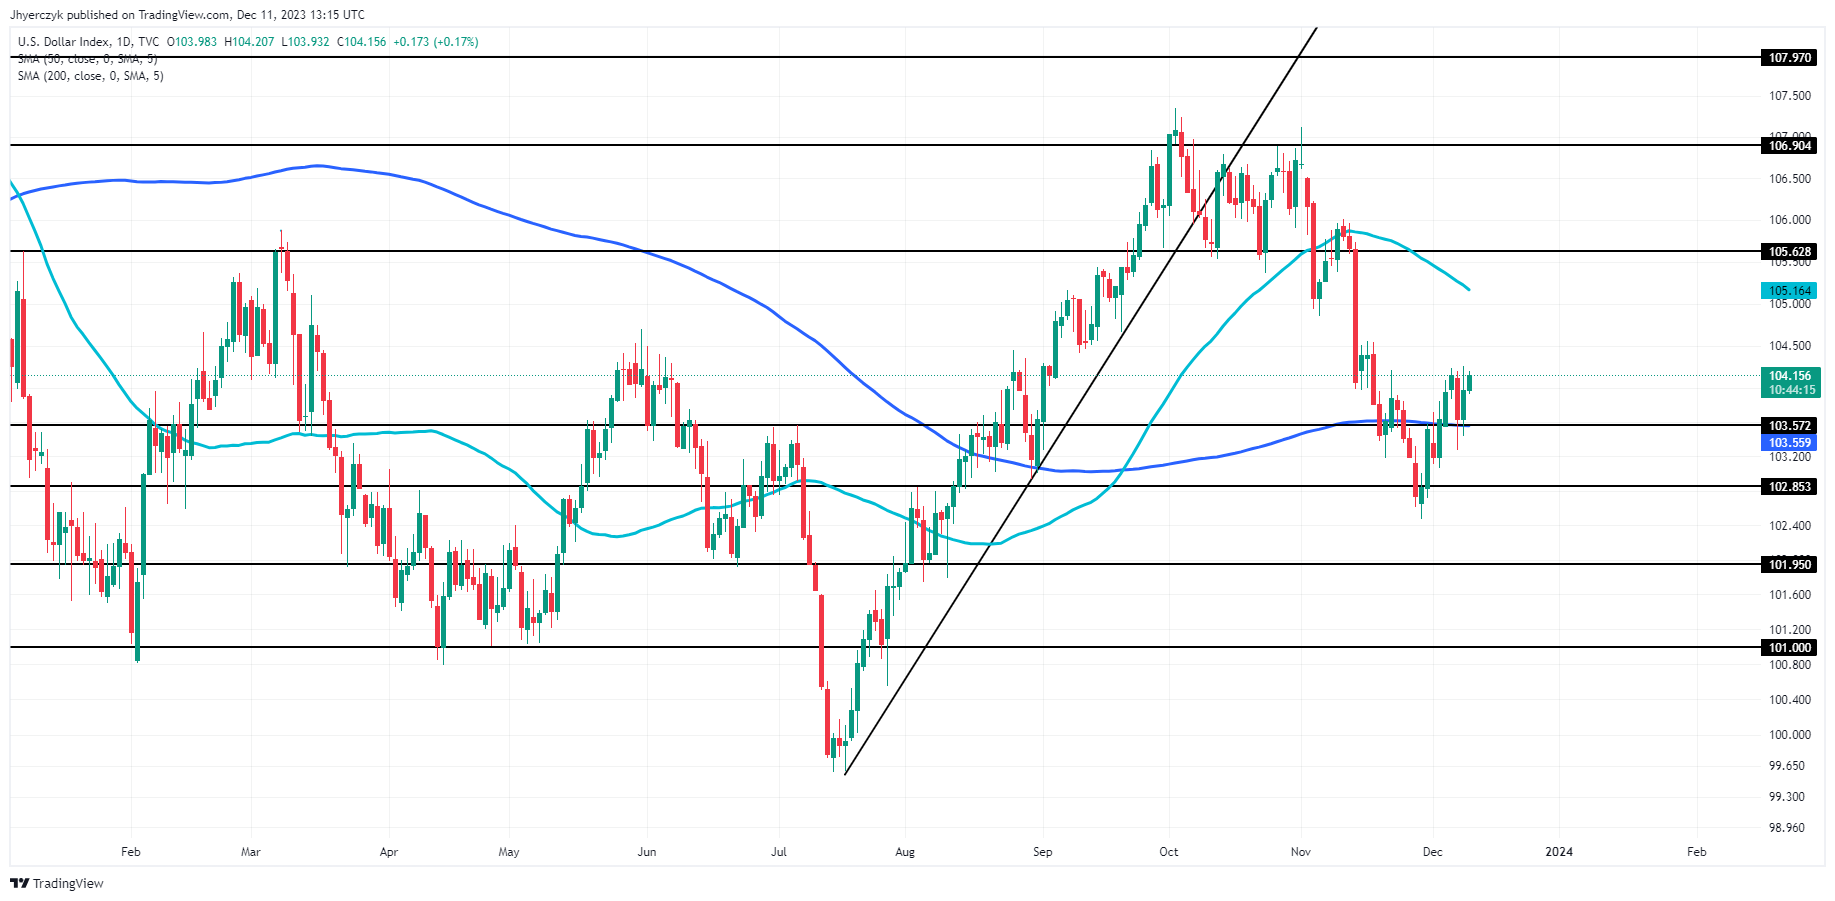
The current market sentiment for the U.S. Dollar Index (DXY) is neutral to slightly bullish. The current daily price of natural gas, at 104.136, is positioned between the 200-day and 50-day moving averages, which stand at 103.559 and 105.164 respectively. This positioning suggests a balanced market sentiment, as the price is hovering around significant moving average levels.

The proximity of the price to minor support at 103.572 and main support at 102.853 indicates a level of stability, reducing the likelihood of a sharp decline. Similarly, the closeness to minor resistance at 105.628 and main resistance at 106.904 suggests potential for upward movement but also indicates that significant bullish momentum might be capped.

Overall, the technical indicators point to a cautiously optimistic outlook, with the market leaning towards a slight bullish bias in the short term.

USD/JPY Weekly Forecast: Markets Peel Back Hopes for BoJ Policy Change

USD/JPY Weekly Forecast: Markets Peel Back Hopes for BoJ Policy Change

JAPANESE YEN FUNDAMENTAL BACKDROP

The Japanese Yen ended the week on a volatile note after being pushed and prodded from the Asian session all the way through to the much awaited Non-Farm Payroll (NFP) report. Japanese GDP significantly missed estimates and the QoQ print fell into negative territory thus heightening recessionary fears moving forward. This may keep the Bank of Japan’s (BOJ) more cautious to tighten monetary policy despite high levels of inflation.

Although we have seen the BoJ Governor Ueda hint at a policy shift, I do not expect anything major from the December meeting without easing the market into it. Data dependency is more crucial than ever for the Japanese central bank as solid additional support for inflation and labor data is required to push the BoJ into changing their current stance. Money markets price in an interest rate hike around September/October 2024 (refer to table below) which supplements my expectation for no drastic changes just yet.

BANK OF JAPAN INTEREST RATE PROBABILITIES

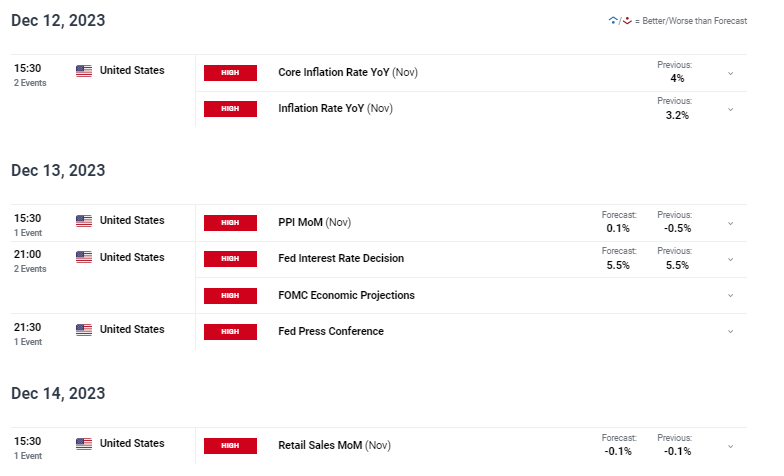
With no Japanese specific data scheduled next week (see economic calendar below), the US will come into focus. After an upside surprise via the NFP report on all metrics, the greenback may further its ascendency should inflation beat forecasts. That being said, the Federal Reserve is likely to keep rates on hold but could pair with a hawkish narrative from Fed Chair Jerome Powell to maintain a restrictive monetary policy environment. US PPI and retail sales will round off the high impact data for the week ahead of the following week’s BoJ rate announcement.

USD/JPY ECONOMIC CALENDAR (GMT +02:00)

image2.png

USD/JPY TECHNICAL ANALYSIS

USD/JPY DAILY CHART

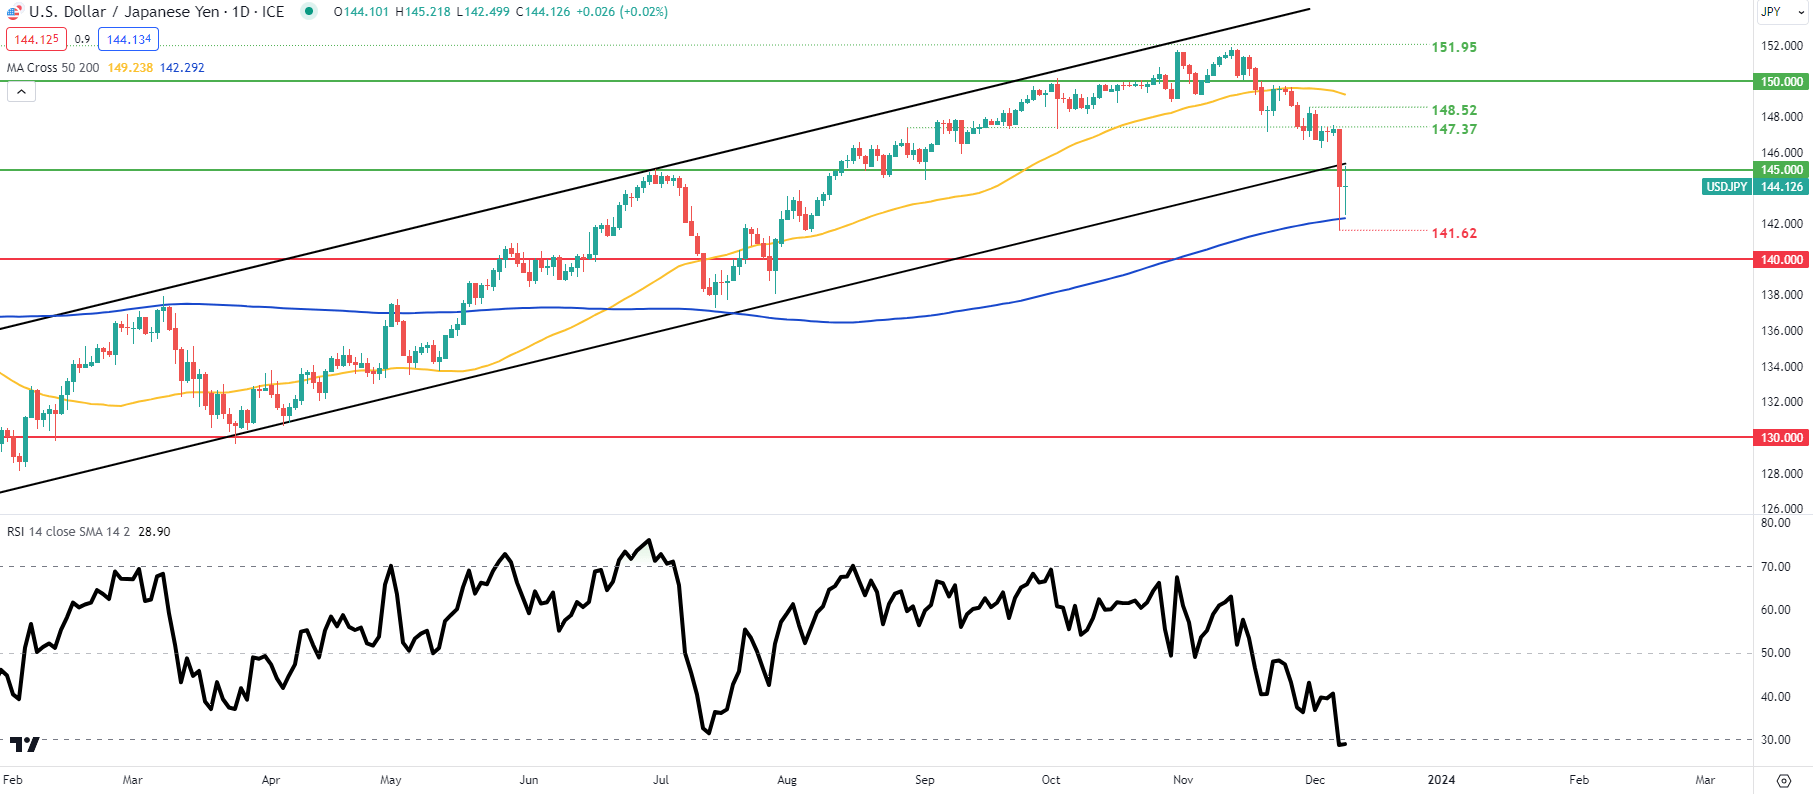
Daily USD/JPY price action above shows bears looking to breach the longer-term channel support zone. Support was found around the 200-day moving average (blue) as the pair moves into oversold territory on the Relative Strength Index (RSI). A weekly close in an around channel support/145.00 psychological handle will not confirm a downside bias and could spark a pullback for the USD.

Key resistance levels:

  • 148.52
  • 147.37
  • Channel support
  • 145.00

Key support levels:

  • 200-day MA
  • 141.62
  • 140.00
Oil Prices Forecast: US Strategic Reserve Refill Plans Lift WTI and Brent Crude

Oil Prices Forecast: US Strategic Reserve Refill Plans Lift WTI and Brent Crude

Slight Follow-Through Rally

Crude oil prices are higher early Monday, responding to the U.S.’s initiative to replenish its strategic reserves, offsetting concerns about surplus supply and subdued demand forecasts for the coming year. Despite the early strength, the trend is still down and the market is bearish. Therefore, any rally is likely to be a short-term event and another shorting opportunity. It’s going to take time and a major event to shift sentiment enough over the short-run to drive out the stubbornly strong shorts.

Brent and WTI crude futures both opened the week with gains, continuing the rise from Friday. This increase comes despite the longest streak of weekly declines since 2018, highlighting ongoing oversupply concerns. The market is currently balancing these supply issues against the backdrop of uncertain demand, particularly from China.

Trading Derivatives carries a high level of risk to your capital and you should only trade with money you can afford to lose. Trading Derivatives may not be suitable for all investors, so please ensure that you fully understand the risks involved, and seek independent advice if necessary. A Product Disclosure Statement (PDS) can be obtained either from this website or on request from our offices and should be considered before entering into a transaction with us. Raw Spread accounts offer spreads from 0.0 pips with a commission charge of USD $3.50 per 100k traded. Standard account offer spreads from 1 pips with no additional commission charges. Spreads on CFD indices start at 0.4 points. The information on this site is not directed at residents in any country or jurisdiction where such distribution or use would be contrary to local law or regulation.

Economic Influences

The U.S. move to add up to 3 million barrels to the Strategic Petroleum Reserve (SPR) is providing some stability. Despite this, doubts linger about the effectiveness of OPEC+’s production cuts. RBC Capital Markets forecasts a significant draw in stocks initially, but a more moderated reduction over the full year.

Geopolitical Impact

China’s economic situation, especially deflationary trends in its consumer price index, raises questions about its recovery and oil demand. Additionally, a recent meeting between Russia and Saudi Arabia focused on OPEC+ production cuts, adding another layer of complexity to the global oil market.

Short-Term Outlook

The crude oil market is facing a mix of bullish and bearish factors in the short term. The U.S. signaling of intentions to acquire up to 3 million barrels for the Strategic Petroleum Reserve (SPR) may have helped establish a bottom, but it’s going to take effective OPEC+ production cuts to tighten supply and support a rally.

However, weaker compliance, global central banks’ monetary policies, and China’s economic stability are key variables that could influence market direction.

Geopolitical developments in oil-producing regions also remain a critical factor in determining the supply trend. These elements will likely shape the trend of oil prices on Monday.

Technical Analysis

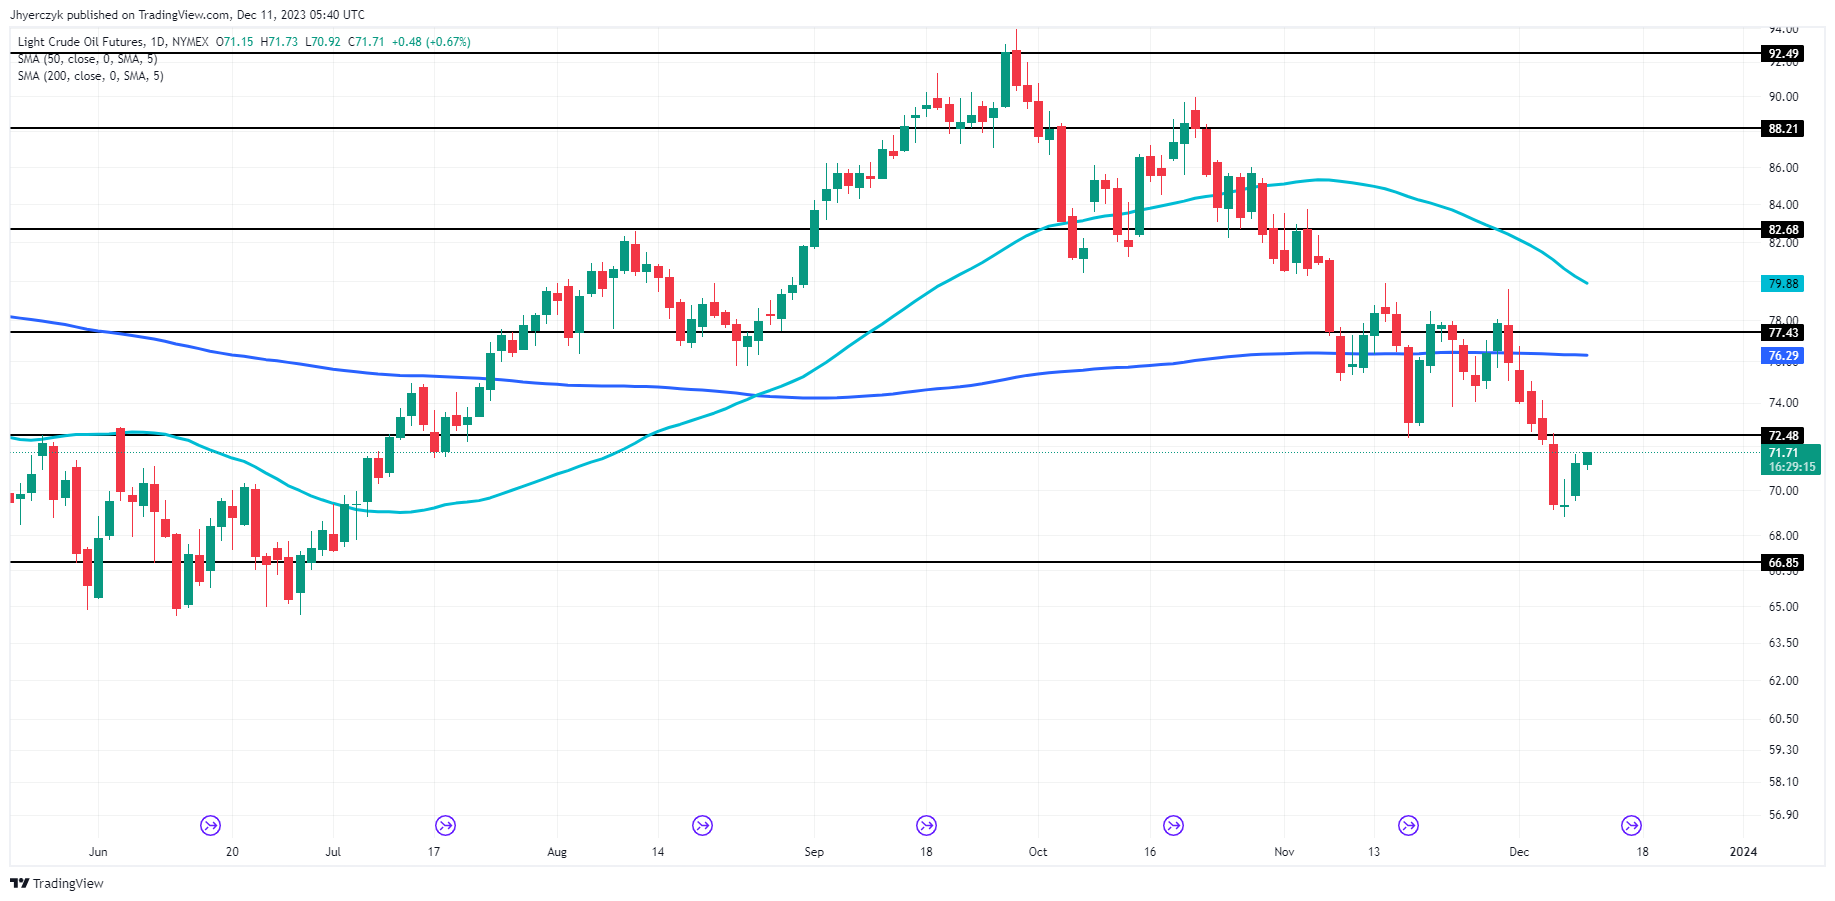
Daily Light Crude Oil FuturesThe current daily price of Light Crude Oil Futures at 71.70, marginally above the previous day’s close of 71.23, indicates a modest uptick. However, it remains below both the 50-day moving average of 79.88 and the 200-day moving average of 76.29, suggesting bearish sentiment in a broader context.

The price sits beneath the minor resistance at 72.48 and well below the main resistance at 77.43, reinforcing a bearish outlook over the medium term. The minor support level at 66.85, though not currently active, serves as a potential lower boundary.

In today’s scenario, the current price is pivotal, potentially setting a bullish tone for the day. Overall, however, despite the slight rise, market sentiment for Light Crude Oil Futures leans towards bearish in the short to medium term.

DAX Index: The ECB and US Consumer Inflation Expectation Numbers in Focus

DAX Index: The ECB and US Consumer Inflation Expectation Numbers in Focus

Overview of the DAX Performance on Friday

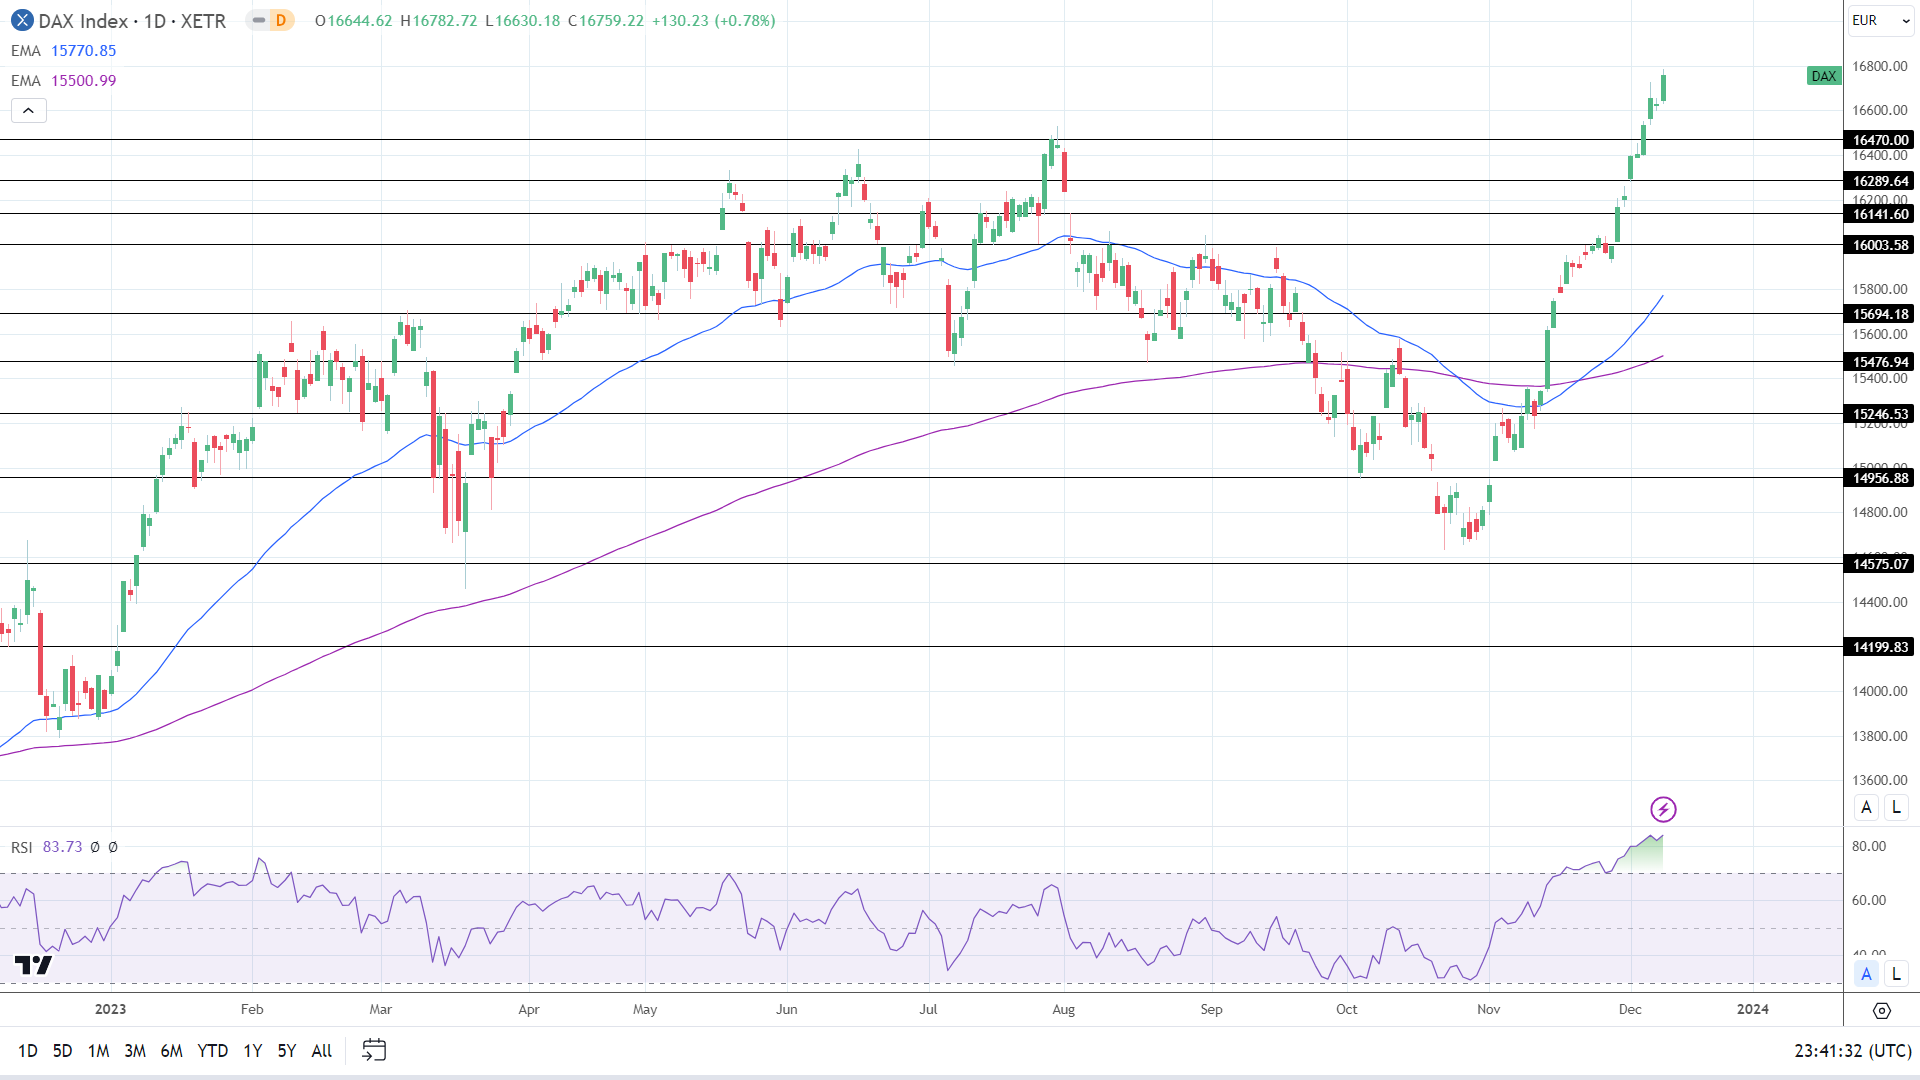
The DAX gained 0.78% on Friday. After a 0.16% loss on Thursday, the DAX ended the Friday session at 16,759. Significantly, the DAX struck a new ATH of 16,783.

German Inflation Softened in November

On Friday, German economic indicators offered early support. The finalized CPI Report from Germany affirmed the preliminary numbers. In November, the German annual inflation rate softened from 3.8% to 3.2%. Softer inflation numbers across the euro area would support a less hawkish ECB rate path and support consumption.

Trading Derivatives carries a high level of risk to your capital and you should only trade with money you can afford to lose. Trading Derivatives may not be suitable for all investors, so please ensure that you fully understand the risks involved, and seek independent advice if necessary. A Product Disclosure Statement (PDS) can be obtained either from this website or on request from our offices and should be considered before entering into a transaction with us. Raw Spread accounts offer spreads from 0.0 pips with a commission charge of USD $3.50 per 100k traded. Standard account offer spreads from 1 pips with no additional commission charges. Spreads on CFD indices start at 0.4 points. The information on this site is not directed at residents in any country or jurisdiction where such distribution or use would be contrary to local law or regulation.

US Jobs Report Eased Fears of a Hard Landing

The US Jobs Report and US consumer sentiment offered late support. Recent labor market stats raised concerns about the US labor market. JOLTs job openings and the ADP Employment numbers fueled bets on a March Fed rate cut to prevent a hard landing.

However, a lower US unemployment rate and a jump in hiring comforted the markets. Notably, wage growth softened from 4.1% to 4.0% year-over-year. A larger-than-expected rise in the Michigan Consumer Sentiment Index was also positive for the DAX. Significantly, the Inflation Expectations Index held steady at 4.5%.

The US equity markets ended the Friday session in positive territory. The Nasdaq Composite Index gained 0.45%, with the Dow and the S&P 500 rising by 0.36% and 0.41%.

The Friday Market Movers

Consumer-linked stocks were among the front-runners. Zalando SE rallied 2.81%, with Adidas gaining 1.18%. The market bets on a less hawkish ECB rate path drove buyer demand. A less hawkish rate path could raise disposable income and fuel consumer spending.

Auto stocks also made gains. BMW gained 2.35%, with Volkswagen rising by 1.16%. Daimler Truck Holding and Mercedes Benz Group ended the session up 0.88% and 0.85%. Porsche increased by 0.55%. Lower borrowing costs are a boon for the auto sector.

ECB Speakers in Focus Before Thursday

On Monday, ECB commentary will garner investor interest. ECB Executive Board member Elizabeth McCaul is on the calendar to speak. Support for discussions on interest rate cuts would drive buyer demand for DAX-listed stocks.

Recent ECB commentary supported the rising bets on a less hawkish ECB interest rate trajectory. ECB hawk Isabel Schnabel spoke on Tuesday, December 5, suggesting further rate hikes were unlikely.

US Inflation in the Focus

Later in the Monday session, US inflation figures also need consideration. Consumer Inflation Expectations numbers for November could influence market risk sentiment before the US CPI Report (Tues). Economists forecast Consumer Inflation expectations to accelerate from 3.6% to 3.8%.

Hotter-than-expected numbers could reduce bets on a March Fed rate cut. Reducing bets on a Q1 2024 Fed rate cut could affect riskier assets.

The futures markets pointed to a mixed start to the Monday session. The DAX was up 18 points, while the Nasdaq mini was down 41 points.

Short-Term Forecast

Near-term trends for the DAX will hinge on the US CPI Report (Tues), the Fed economic projections and press conference (Wed), and the ECB press conference (Thurs). A pickup in inflationary pressure and a hawkish Fed could counter a dovish ECB.

DAX Technical Indicators

Daily Chart

The DAX held above the 50-day and 200-day EMAs, with the EMAs sending bullish price signals.

A DAX move through the Friday ATH of 16,783 would bring the 17,000 psychological resistance level into play.

ECB commentary and US inflation are focal points on Monday.

However, a drop below the 16,750 handle would support a fall toward the 16,470 support level.

The 14-day RSI reading of 83.73 shows the DAX in overbought territory. Selling pressure could intensify at the Friday ATH of 16,783.

DAX Daily Chart EMAs send bullish price signals.
DAX 111223 Daily Chart

4-Hourly Chart

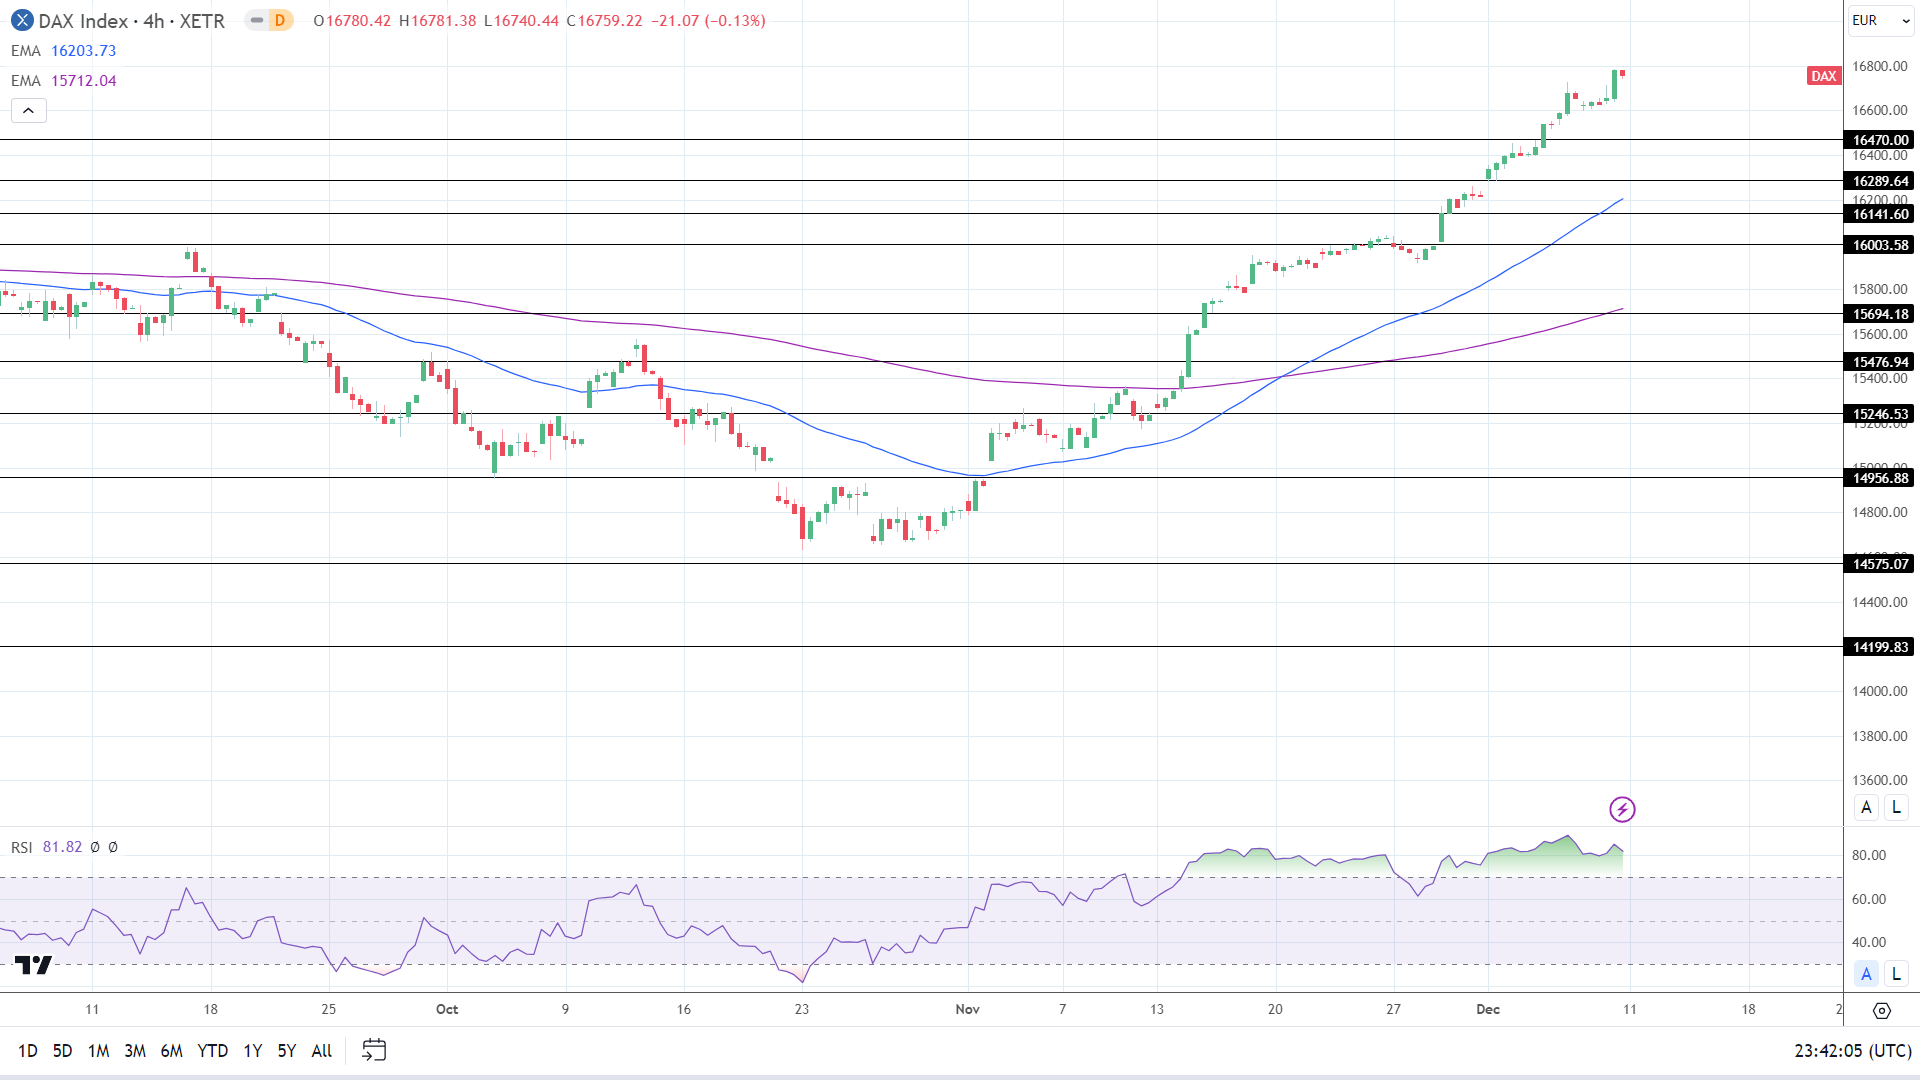
The DAX remained above the 50-day and 200-day EMAs, with the EMAs affirming bullish price signals.

A DAX move through the Thursday ATH of 16,783 would give the bulls a run at 17,000.

However, a drop below the 16,750 handle would bring the 16,470 support level into play.

The 81.82 14-4 hour RSI shows the DAX in overbought territory. Selling pressure may intensify at the all-time high of 16,783.
4-Hourly Chart EMAs affirm bullish price signals.
DAX 111223 4-Hourly Chart