US Jobs Report Preview: What’s Next for Gold, US Dollar, Yields & Nasdaq 100?

US Jobs Report Preview: What’s Next for Gold, US Dollar, Yields & Nasdaq 100?

The U.S. Bureau of Labor Statistics will release the November employment report on Friday morning, an event that could bring significant volatility to financial markets and give rise to attractive trading setups heading into the weekend.

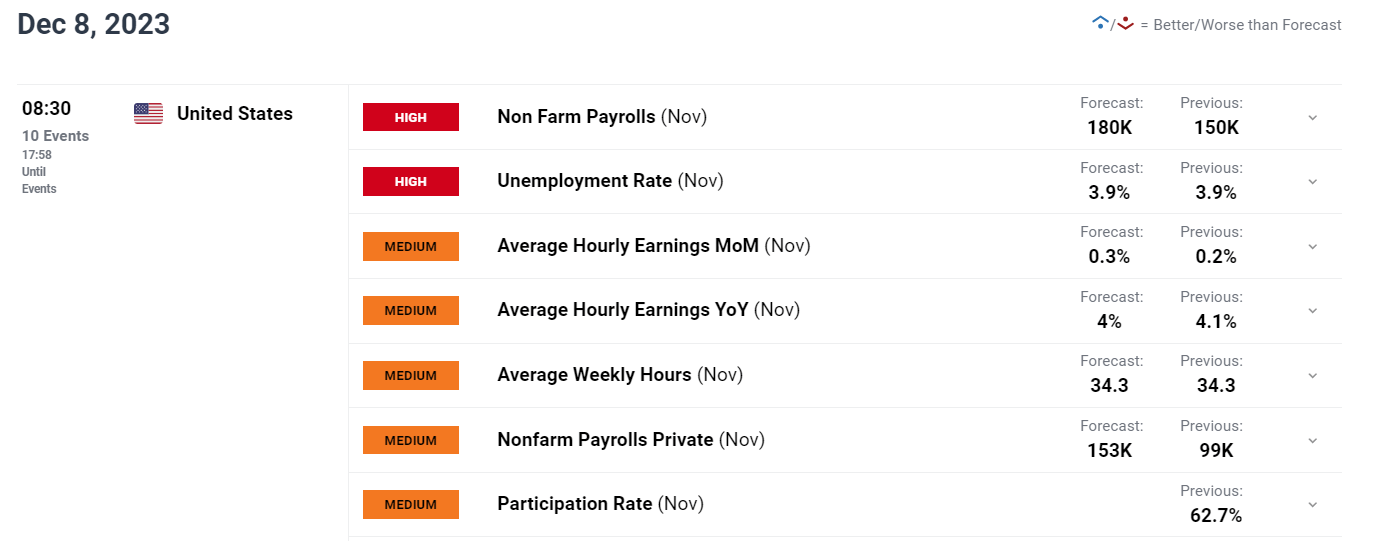
According to consensus estimates, the U.S. economy generated 180,000 jobs last month after an increase of 150,000 payrolls in October. With this result, the unemployment rate is expected to remain unchanged at 3.9%.

Elsewhere, average hourly earnings, a powerful inflation gauge closely followed by the central bank, are forecast to have risen 0.3% m-o-m, bringing the 12-month reading from 4.1% to 4.0%, a positive, albeit small, directional improvement for policymakers.

Unsure about the U.S. dollar’s trend? Gain clarity with our latest quarterly forecast. Download a free copy of the guide now!

UPCOMING US JOBS REPORT

image1.png

To sustain recent market dynamics—keeping Treasury yields and the U.S. dollar biased lower while maintaining the broader bullish momentum going for risk assets and precious metals, incoming data will have to validate overly dovish interest rate expectations by showing that the economy is starting to slow down sharply.

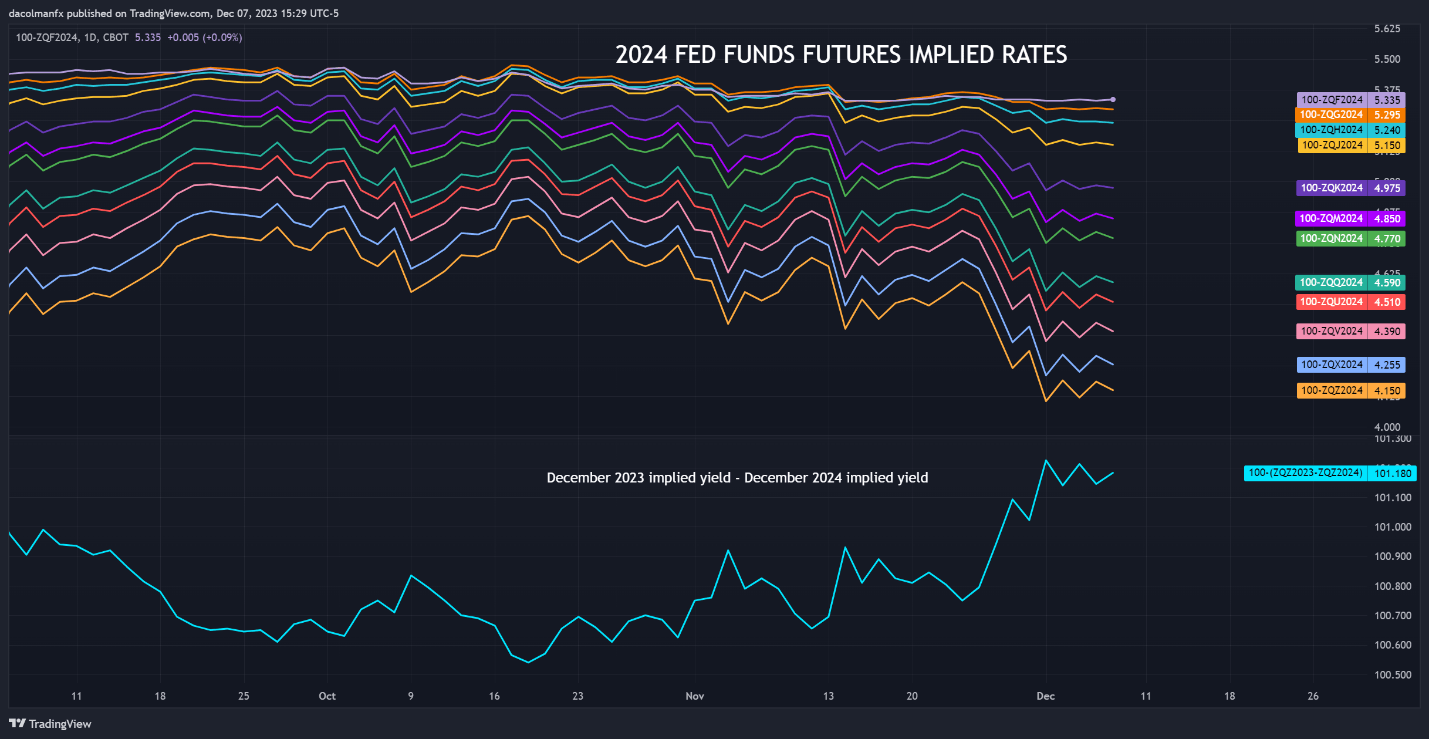
In the chart below, which displays the implied yield on all 2024 Fed funds futures contracts, we can see that rate-cut bets have risen aggressively in recent weeks, with traders discounting over 100 basis points of easing by the end of next year. Markets may be sniffing trouble on the horizon, or they may be dead wrong.

Stay ahead of the curve! Request your complimentary gold forecast for a thorough overview of the precious metal’s technical and fundamental outlook

2024 FED FUNDS FUTURES CONTRACTS (IMPLIED YIELDS)

A graph of different colored lines Description automatically generated


Any data from the November employment report that contradicts the premise of broadening economic weakness and is inconsistent with too much easing over the next 12 months, such as robust job creation or extremely hot wage growth, could push traders to unwind extremely dovish monetary policy wagers, boosting yields and this U.S. dollar. This scenario would weigh on gold and the Nasdaq 100.

Conversely, disappointing NFP figures that surprise to the downside by a wide margin could have the opposite effect on markets by justifying concerns about brewing economic challenges and by supporting the case for several rate cuts in the coming quarters. This scenario, likely to apply downward pressure on yields and the U.S. dollar, could prove beneficial for gold prices and the Nasdaq 100.

AUD Forecast: Australian Households Managing Tough Financial Conditions, RBA’s Brischetto

AUD Forecast: Australian Households Managing Tough Financial Conditions, RBA’s Brischetto

AUSTRALIAN DOLLAR FUNDAMENTAL BACKDROP

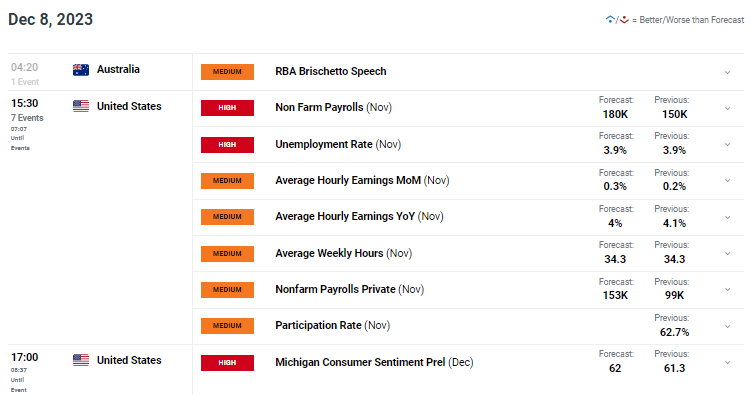
The Australian dollar followed improving risk sentiment this Friday as markets dismissed fears of the upcoming Non-Farm Payrolls (NFP) report (see economic calendar below). Misses ADP employment change and flat jobless claims could have been contributing factors but with the recent disconnect between ADP and NFP, there is still room for an NFP surprise to the upside. Weaker US consumer credit supplemented the AUD but as mentioned above, NFP will be the key driver for short-term guidance. Average earnings will be scrutinized whether or not the recent downtrend continues with the US trading session capping off with Michigan consumer sentiment data.

AUD/USD ECONOMIC CALENDAR (GMT +02:00)

image1.png

From an Australian perspective, the Reserve Bank of Australia’s (RBA) Andrea Brischetto issued an alert around Australians risk of financial stress due to the current high interest rate environment and increasing unemployment. Although early days, the seed has been planted for households to adopt more cautious pending habits to meet their financial obligations. Overall, households are coping well and highlight the resilience of the Australian economy – net positive for the AUD.

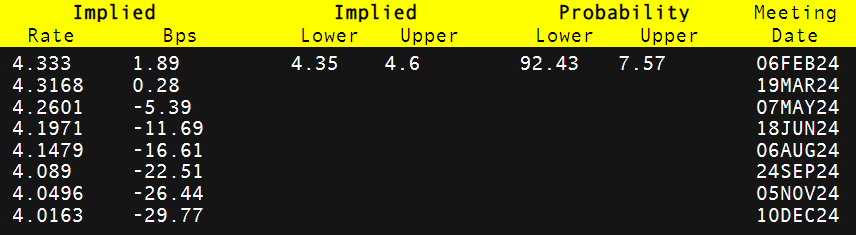
Money market pricing below may be a positive sign for Australian households with expectations showing a dovish repricing this week by around 12bps (December 2024) as well as little hope for an additional rate hike. We have seen this trend ripple across central bank forecasts as the lagged impact of tight monetary policy takes effect.

RBA INTEREST RATE PROBABILITIES

image2.png

Option expiries for today for AUD/USD are shown below with preference to the upside relative to current levels.

  • AUD/USD: 0.6700 (AUD727.9M), 0.6850 (AUD642.3M), 0.6525 (AUD505.4M)

TECHNICAL ANALYSIS

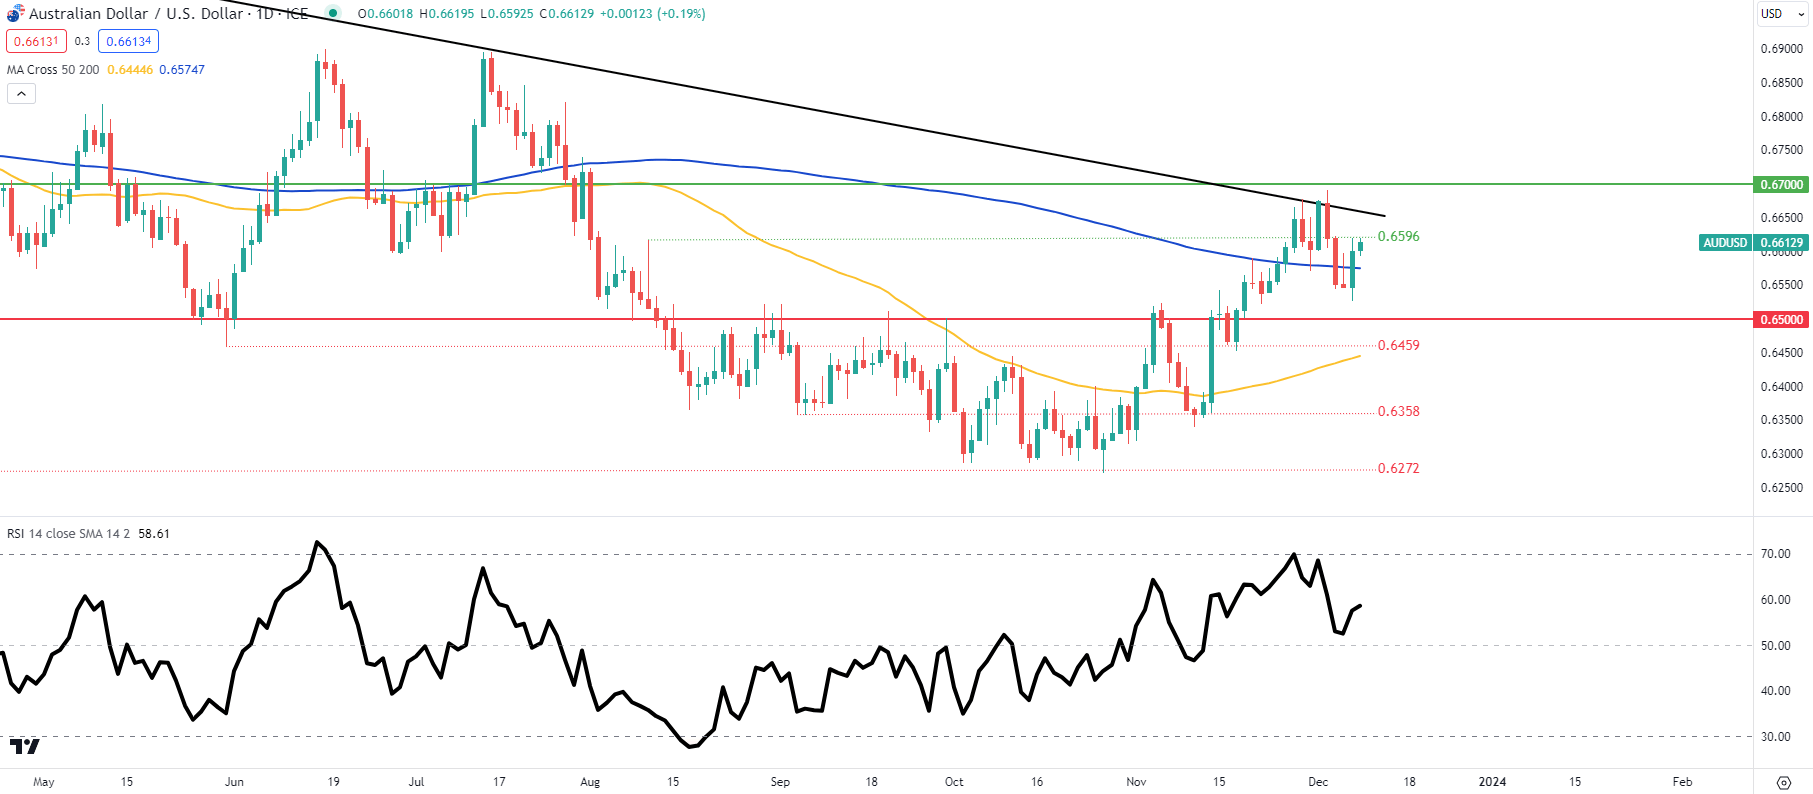
AUD/USD DAILY CHART

image3.png

AUD/USD daily price action above shows hesitancy by traders to favor a directional bias at this point with NFPs looming. It would be wise to remain cautious and potentially look for opportunities post-NFP. A beat could see AUD/USD bulls breach the long-term trendline resistance (black) and look to test July swing highs. On the contrary, a miss may push the Aussie dollar below the 200-day moving average (blue) once more and retest the 0.6500 psychological handle.

  • 0.6700
  • Trendline resistance
  • 0.6596

Key support levels:

  • 200-day MA
  • 0.6500
  • 0.6459
  • 50-day MA
  • 0.6358
NFP and Forex: What is NFP and How to Trade It?

NFP and Forex: What is NFP and How to Trade It?

What is the NFP?

The non-farm payroll (NFP) figure is a key economic indicator for the United States economy. It represents the number of jobs added, excluding farm employees, government employees, private household employees and employees of nonprofit organizations.

US Non Farm Payroll historical results

NFP releases generally cause large movements in the forex market. The NFP data is normally released on the first Friday of every month at 8:30 AM ET. This article will explain the role NFPs play in economics and how to apply NFP release data to a forex trading strategy.

How does the NFP affect forex?

NFP data is important because it is released monthly, making it a very good indicator of the current state of the economy. The data is released by the Bureau of Labor Statistics and the next release can be found on an economic calendar.

Employment is a very important indicator to the Federal Reserve Bank. When unemployment is high, policy makers tend to have an expansionary monetary policy (stimulatory, with low interest rates). The goal of an expansionary monetary policy is to increase economic output and increase employment.

So, if the unemployment rate is higher than usual, the economy is thought to be running below its potential and policy makers will try to stimulate it. A stimulatory monetary policy entails lower interest rates and reduces demand for the Dollar (money flows out of a low yielding currency). To learn exactly how this works, see our article on how interest rates effect forex.

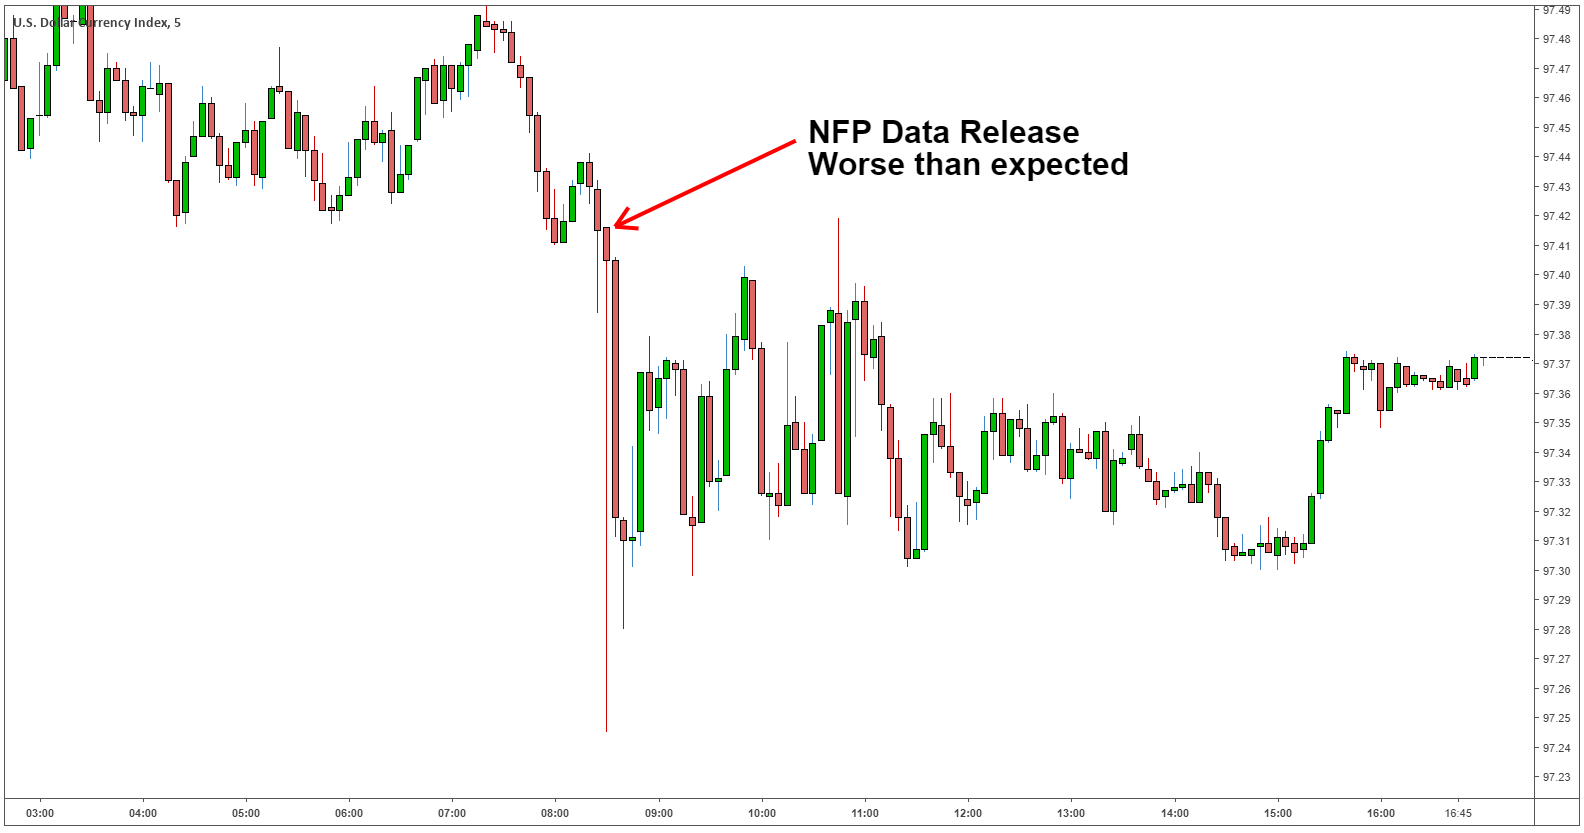
The chart below shows how volatile forex can be after an NFP release. The expected NFP results for March 8, 2019 were 180k (job additions), the actual result disappointed with only 20k jobs being added. As a result, the Dollar Index (DXY) depreciated in value and volatility increased.

NFP forex reaction

Forex traders must be wary of data releases like the NFP. Traders could get stopped-out due to the sudden increase in volatility. When volatility increases, spreads do too, and increased spreads can lead to margin calls.

Which currency pairs are most affected by NFP

The NFP data is an indicator of American employment, so your currency pairs that include the US Dollar (EUR/USD, USD/JPY, GBP/USD, AUD/USD, USD/CHF and others) are most affected by the data release.

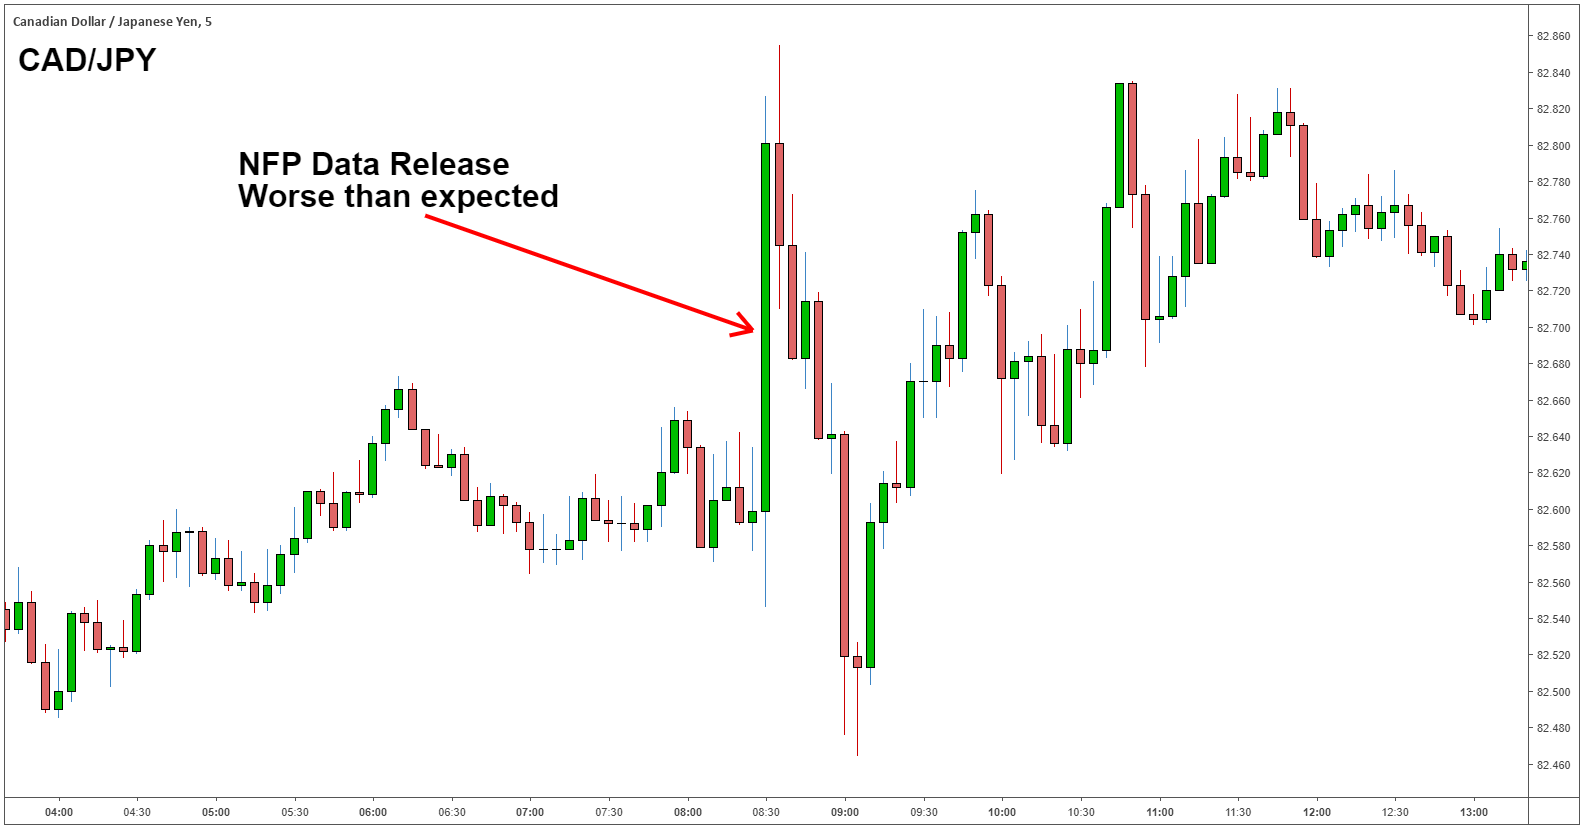
Other currency pairs also display an increase in volatility when the NFP releases, and traders must be aware of this as well, because they may get stopped out. The chart below shows the CAD/JPY during the NFP data release. As you can see, the increase in volatility could stop a trader out of their position even though they are not trading a currency pair linked to the US Dollar.

CAD/JPY NFP reaction

Non-farm payroll release dates

The Bureau of Labor statistics normally releases the NFP data on the first Friday of each month at 8:30 AM ET. The release dates can be found on the Bureau of Labor Statistic’s website.

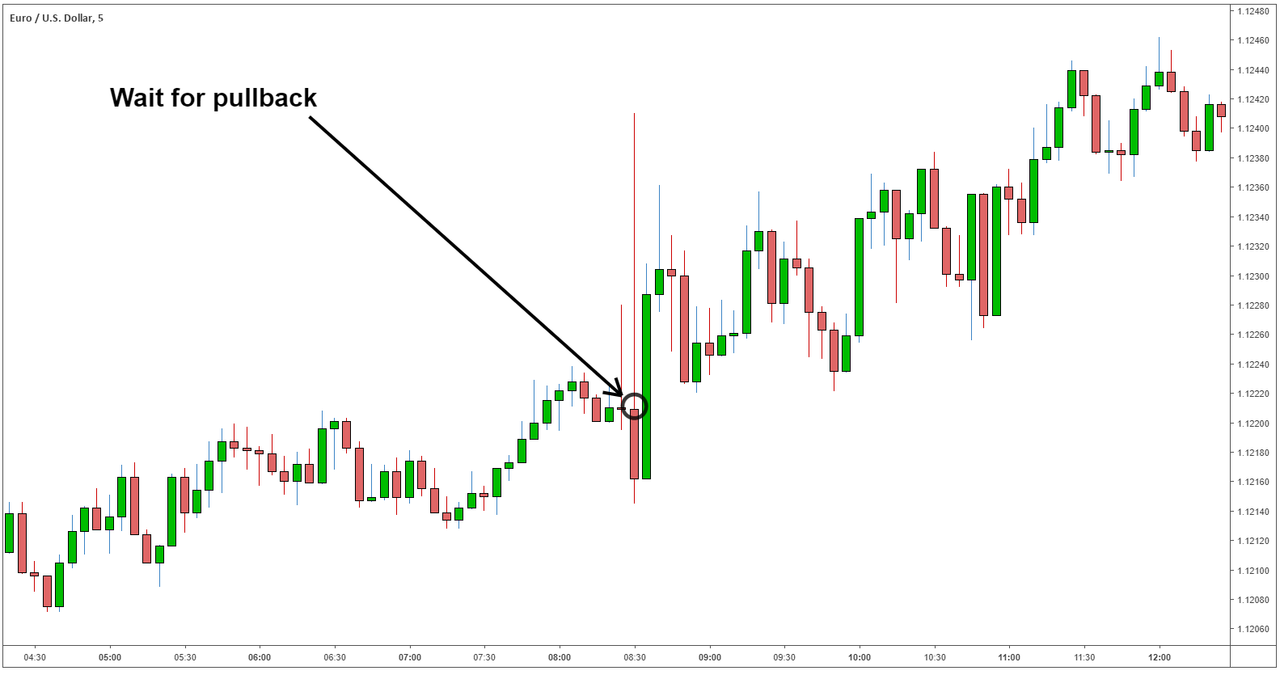
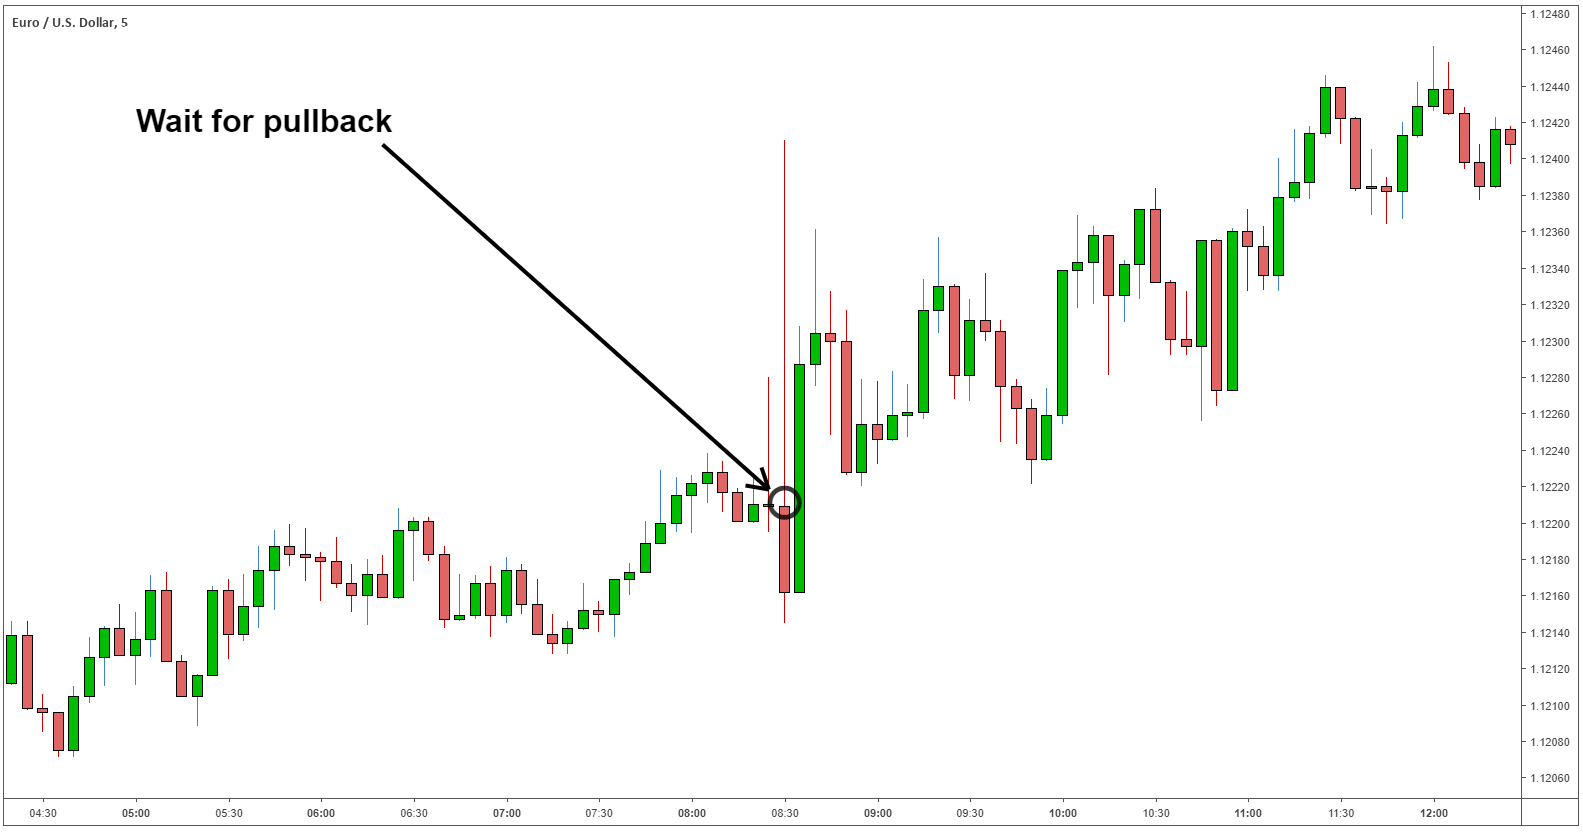
Due to the volatile nature of the NFP release, we recommend using a pull-back strategy rather than a breakout strategy. Using a pullback strategy, traders should wait for the currency pair to retrace before entering a trade.

Using the same example as above (NFP results 20k vs 180k expected) we expect the US Dollar to depreciate. In the example below, we use the EUR/USD. Because the NFP data came out worse than expected, we forecast the EUR/USD to appreciate.

EUR/USD NFP data pullback strategy

Trading the NFP data releases: Top tips & further reading

Here are a few tips to remember when using NFP data releases to inform your forex trading:

  1. NFP data is released on the first Friday of every month.
  2. The NFP data release is accompanied with increased volatility and widening spreads.
  3. Currency pairs not related to the US Dollar could also see increased volatility and widening spreads.
  4. Trading the NFP data release can be dangerous due to the increase in volatility and possible widening of spreads. To combat this, and to avoid getting stopped-out, we recommend using the appropriate leverage, or no leverage at all.

Other important data releases to watch:

While the NFP generally moves the market, data like CPI (inflation), Fed funds rates, and GDP growth are important data releases too.

If you want to know more about trading the news and data releases, see our trading the news beginner guide. We also suggest reading our traits of successful traders guide to avoid the number one mistake traders make when trading forex.

Further reading on forex fundamentals

We also recommend finding out more about the role of central banks in the forex market, and what central bank interventions involve.

Use the DailyFX economic calendar to keep an eye on all the important economic data releases, including central bank speeches and interest rate data. Don’t forget to bookmark our Central Bank Rates Calendar so you can prepare for regular announcements.

Understanding Inflation and its Global Impact

Understanding Inflation and its Global Impact

What is Inflation?

Inflation is the rise in prices of goods and services in an economy over a period of time, and is often displayed in percentage form. For example, if inflation is 2%, this suggests that prices are (on average) 2% higher than the previous period. Therefore, if a bottle of water cost $1 last year then this year it should be around $1.02. Inflation can result in significant costs to an economy as the purchasing power of individuals fall.

Deflation

Deflation is the opposite of inflation where prices fall. This suggests low demand for goods and services and often leads low interest rates. Deflation is atypical amongst developed countries.

Stagflation vs Hyperinflation

Stagflation occurs when an economy is stagnant (low growth) but inflation is still prevalent. This can occur when external factors impact an economy such as the price of oil.

Hyperinflation is an extremely high rate of inflation within an economy. Hyperinflation can be caused by an increase in money supply which consequently results in increased consumer spending and higher demand for goods and services.

Both deflation and hyperinflation can be detrimental to an economy and can result in higher rates of unemployment and lower growth. This makes the role of central banks critically important to control inflation as a lack of stability may have the potential for destructive penalties.

Measuring Inflation

Consumer Price Index (CPI)

This is one of the more common ways of measuring inflation, calculating inflation is based on a basket of goods and services which are often referred to as a ‘cost-of-living index’. Common cost-of-living indexes are the Consumer Price Index (CPI) and Retail Price Index (RPI). These measures relate to inflation experienced by consumers on a daily basis. Each central bank faces unique headwinds in selecting appropriate items to include within their inflation calculation.

Core CPI vs Headline CPI:

Two common phrases when dealing with inflation is ‘core’ and ‘headline’ CPI. This differentiating factor between the two terms is quite simple. Core CPI refers to the omission of food and energy prices from the Consumer Price Index while headline CPI includes both food and energy prices.

Producer Price Index (PPI)

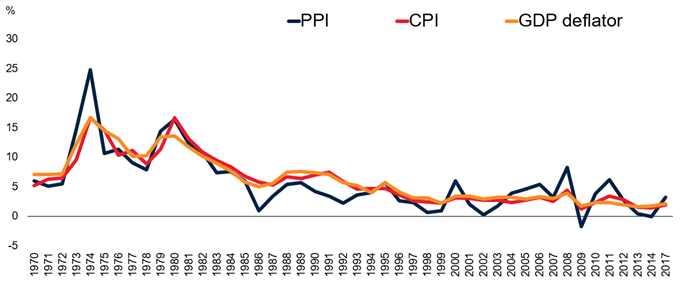
The Producer Price Index (PPI) focuses on inflation at the early stages of production which can provide essential information for manufacturers and industry. The chart below shows the historical comparison between the different inflation measures (CPI, PPI and GDP Deflator). It is clear that PPI is the most volatile which can be explained in part by producers being unable to pass on relatable costs to the consumer in difficult periods such as the global financial crisis.

GDP Deflator

Another way to measure inflation is via the GDP deflator which takes into account domestic goods only while CPI and/or RPI includes foreign goods, as well. A second key difference is that the GDP deflator method encompasses all goods and services while CPI and/or RPI only measures the price of goods and services bought by consumers. Because the GDP deflator is not restricted by a fixed basket of goods, it has an advantage over the others.

GDP Deflator = (Nominal GDP/Real GDP) x 100

Each measure has bespoke properties that may appeal to different individuals. Therefore, there is no ‘best’ way to calculate inflation but rather each measure has unique aspects that will be suited for different requirements and applications.

PPI vs CPI vs GDP Deflator
PPI vs CPI vs GDP Deflator

Source: World Bank

Sources of Inflation

Inflation can begin via many avenues in isolation or combination. Below are a few of the primary sources of inflation that can distress any nation across the globe:

Exchange Rates

A weakening local currency means that more local currency is required to purchase imports. This increased cost gets passed on to the end consumer which can contribute to inflation.

Essential Commodity Prices

Most manufacturers require inputs to produce a certain good. These often come in the form of commodities such as iron ore or oil. If these inputs increase in price due, then those costs can be passed on to consumers and the higher costs are a form of inflation.

Interest Rates

Lower interest rates theoretically lead to more spending by consumers, ultimately resulting in greater demand and cost of goods; which should lead to inflation, all factors held equal.

Government Debt

Increases in government debt may infer that there is a greater potential of a government default, which leads to higher yields on treasury securities to compensate potential investors for the higher risk. The effect this has on the public is that more tax revenue will be allocated to the higher interest payments on government debt obligations which reduces living standards. Businesses in turn increase the prices of goods and services to offset the lessened government expenditures, and this can lead to inflation.

The sources listed above generally fall into two broad categories of inflation which are:

  1. Demand-Pull Inflation – This type of inflation comes as a result of an increase in aggregate demand inclusive of households, governments, foreign buyers and businesses.
  2. Cost-Push Inflation – Supply is the driver of inflationary pressure for cost-push inflation. When supply falls due to higher production costs, the outcome is higher final prices for consumers.

Consequences of Inflation

Value of Money

The most obvious penalty of inflation from a consumer point of view is the higher cost of goods and services. This translates to a decrease in the value of money as individuals can now purchase fewer goods and services with the same amount of money prior to an inflationary rise.

Wealth Gaps

The inequitable distribution of inflationary pressure amongst individuals can lead to changes in wealth. For example, individuals with loans during periods of high inflation will benefit as the real value of their debt repayments will fall over time while others may not.

Inflation Volatility

Fluctuating or erratic inflation data complicates business operations as businesses do not know where to set prices, and this can have a negative effect on the economy as both businesses and consumers adjust to the higher rates of inflation. Long-term business deals will also incur higher costs as volatile inflation causes a higher risk premia on hedging costs, which can reduce foreign investor confidence.

Central banks use of Inflation Targeting

Inflation targeting is quite simple in theory as involves a central bank setting a specific inflation goal in percentage terms. This strategy is achieved by manipulating monetary policy. The goal of inflation targeting allows central banks along with the public to have more clarity in terms of future expectations. The reason behind inflation targeting is control with regards to price stability, and price stability can be attained by governing inflation.

Generally an inflation target of 1% – 2% is familiar as it allows governments and central banks some flexibility at this low base. As a rule of thumb, any deviation greater than 1% either side of the targeted figure is cause for concern and has generally lead to policy intervention.

How do Governments Control Inflation?

There are many ways governments go about controlling inflation which can have knock-on effects (positive and negative) to the economy depending on current economic conditions. The most common way is via contractionary monetary policy which is used by central banks to curb inflation by restricting liquidity. This is achieved via 3 main avenues:

1. Decrease Money Supply

Decreasing money supply simply gives consumers less money to spend overall and should help limit inflation. One way this can be realized is by increasing interest on sovereign bond payments which can attract more investors to buy bonds.

2. Reserve Constraints

Restricting the amount of money banks are allowed to keep can influence the amount of money being lent to consumers. That is, if banks are required to keep higher amounts of money as a legal threshold, then naturally banks will have less money to lend. This should decrease consumer spending and thus, inflation.

3. Raising Interest Rates

Higher interest rates which result in fewer individuals willing to borrow and therefore leads to a decrease in spending. There’s also a greater opportunity cost of investing capital into a business given the higher rates of return that could be had through capital markets.

Global Inflation and Key Relationships

Advanced vs Developing Economies
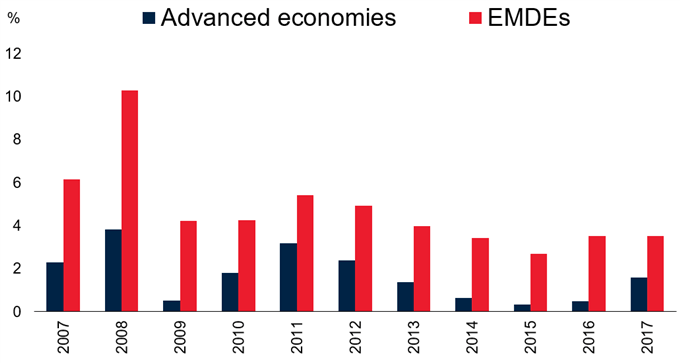
Advanced vs Developing economies

Source: World Bank

The chart above shows a consistent and logical pattern whereby the historical inflation rate in developed countries is generally less than emerging and developing economies (EMDE).There are two primary reasons behind this:

  1. EMDE generally have higher growth rates which can lead to excess demand.
  2. Volatile currencies are present in many EMDE which makes central banks’ management of monetary policy more difficult than those in advanced economies.

The Phillips Curve

The historical relationship between unemployment and inflation has been largely inverse which means that high levels of unemployment correlates with lower inflation and vice versa. The reason why the inverse relationship exists is best explained with basic economics. For example, an increase in aggregate demand which is a consequence of demand-pull inflation, results in higher prices of goods and services and lower unemployment. This lower unemployment means that there is more income available in the economy to spend on goods and services. Both elements have recurrent effects on one another and is best represented by the basic Phillips Curve (see chart below).
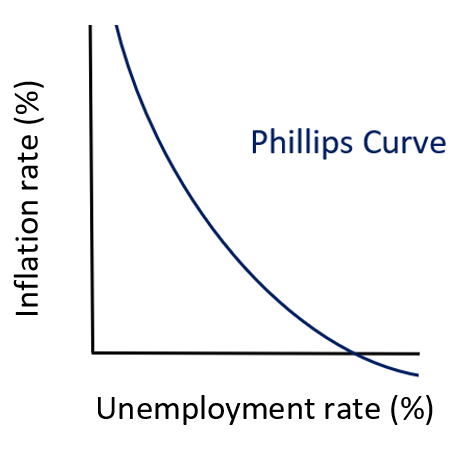
The Phillips Curve

Source: Created by Warren Venketas

Inflation: Conclusion

This article has demonstrated the wide reaching implication of inflation from more concentrated effects to wide-ranging systemic global impacts. Inflation is an important economic tool from a macroeconomic perspective but also can be powerful if understood and implemented within a trading strategy as inflation data can cause changes in price in many financial markets.

Oil Prices Forecast: Saudi’s Call to Join Output Cuts Fuels Short-Covering Rally

Oil Prices Forecast: Saudi’s Call to Join Output Cuts Fuels Short-Covering Rally

Oil Prices See Modest Rise Ahead of Key U.S. Jobs Report

International benchmark Brent crude and U.S. benchmark West Texas Intermediate (WTI) crude oil are edging higher early Friday. This cautious rise comes as traders await the U.S. Non-Farm Payrolls report, a potential influencer for the Federal Reserve’s upcoming policy meeting. Despite some recovery fueled by calls from Saudi Arabia and Russia for OPEC+ members to join output cuts, oil benchmarks are still on course for a seventh consecutive weekly decline.

Market Dynamics and OPEC+ Intervention

Both Brent and WTI crude futures have experienced their steepest weekly losses in five weeks, with current trading showing Brent at $75.65 and WTI at $70.75. The decline to their lowest levels since late June reflects market concerns about oversupply. This bearish sentiment is further underscored by the market’s contango structure, with front-month prices trading lower than those in future months. Some short sellers are covering their positions, viewing the market as oversold, leading to a slight rebound.

Trading Derivatives carries a high level of risk to your capital and you should only trade with money you can afford to lose. Trading Derivatives may not be suitable for all investors, so please ensure that you fully understand the risks involved, and seek independent advice if necessary. A Product Disclosure Statement (PDS) can be obtained either from this website or on request from our offices and should be considered before entering into a transaction with us. Raw Spread accounts offer spreads from 0.0 pips with a commission charge of USD $3.50 per 100k traded. Standard account offer spreads from 1 pips with no additional commission charges. Spreads on CFD indices start at 0.4 points. The information on this site is not directed at residents in any country or jurisdiction where such distribution or use would be contrary to local law or regulation.

OPEC+’s Struggle for Solidarity Amid Global Supply Concerns

Saudi Arabia and Russia, leading figures in OPEC+, have urged for collective output cuts to stabilize the global economy. Despite OPEC+’s agreement on a 2.2 million barrels per day cut, actual production reduction is anticipated to be significantly lower. The lack of adherence to commitments among some OPEC+ members adds to the market’s uncertainties.

Global Demand Outlook: China and India

Concerns over China’s economic health continue to pressure the market, with Chinese crude oil imports showing a significant year-on-year decline in November. This reduction in demand is attributed to high inventory levels and weak economic signals. Similarly, India, another key oil consumer, witnessed a drop in fuel consumption in November, further contributing to the bearish sentiment.

Short-Term Forecast: Bearish Amid Supply Surplus and Demand Woes

In summary, the short-term outlook for the oil market remains bearish. The combination of a global supply surplus, weak demand from major consumers like China and India, and the uncertainty around OPEC+ commitments all contribute to this outlook. The forthcoming U.S. Non-Farm Payrolls report and its potential impact on the Federal Reserve’s decisions are key factors that traders will closely monitor in the coming days. Especially since these decisions could have an impact on the greenback and consequently on foreign demand for dollar-denominated oil.

Technical Analysis

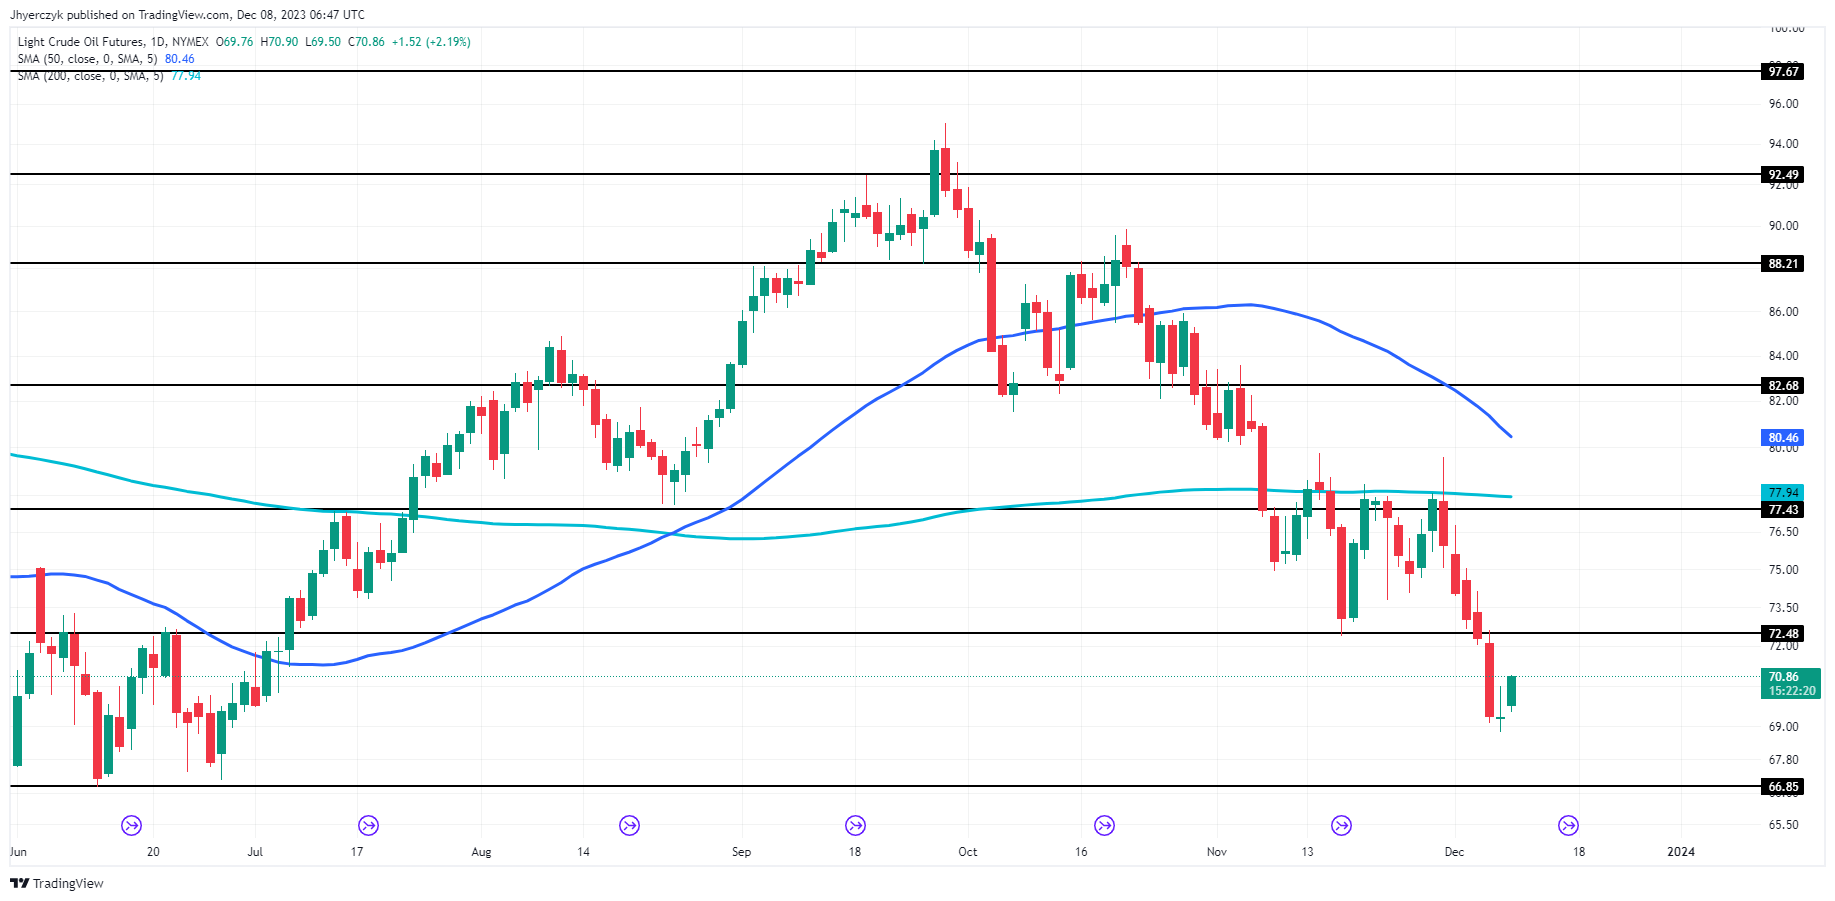
Daily Light Crude Oil FuturesThe current daily price of light crude oil futures at 70.79 is positioned below both the 200-day and 50-day moving averages, which are 77.93 and 80.46 respectively. This indicates a bearish trend, as the price is trading below these key average levels.

The current price is also situated between the minor support at 66.85 and minor resistance at 72.48. The proximity to the minor resistance level suggests a test of this threshold could be imminent. If the price breaks through this resistance, it could signal a shift towards a bullish sentiment.

However, until such a break occurs, the prevailing market sentiment for light crude oil futures remains bearish, influenced by its position relative to the moving averages and current resistance levels.

DAX Index: German Inflation and the US Jobs Report in Focus

DAX Index: German Inflation and the US Jobs Report in Focus

Overview of the DAX Performance on Thursday

The DAX slipped by 0.16% on Thursday. After a 0.75% gain on Wednesday, the DAX ended the session at 16,629. Significantly, the DAX ended a seven-day winning streak.

German Industrial Production Disappoints

On Thursday. economic indicators from Germany disappointed the markets for the second session. German industrial production unexpectedly declined in October. Production fell by 0.4% after a 1.3% decline in September.

Trading Derivatives carries a high level of risk to your capital and you should only trade with money you can afford to lose. Trading Derivatives may not be suitable for all investors, so please ensure that you fully understand the risks involved, and seek independent advice if necessary. A Product Disclosure Statement (PDS) can be obtained either from this website or on request from our offices and should be considered before entering into a transaction with us. Raw Spread accounts offer spreads from 0.0 pips with a commission charge of USD $3.50 per 100k traded. Standard account offer spreads from 1 pips with no additional commission charges. Spreads on CFD indices start at 0.4 points. The information on this site is not directed at residents in any country or jurisdiction where such distribution or use would be contrary to local law or regulation.

The weaker-than-expected numbers contributed to an early loss.

Eurozone GDP numbers added to the negative sentiment. The Eurozone economy stalled year-over-year in Q3, a revision from 0.1% growth.

Earlier in the session, trade data from China set the tone. While exports unexpectedly rose, a decline in imports signaled a weak demand outlook. Concerns about the Chinese economy left the Asian equity markets in negative territory on Thursday, affecting market risk sentiment through the European session.

US Labor Market Stats Offered Comfort

On Thursday, the US labor market was in focus for the third consecutive session. Weaker-than-expected JOLTs job openings and ADP Employment numbers raised concerns about the US economy. However, initial jobless claims increased modestly last week, providing market relief.

Nonetheless, the numbers continued to support bets on a Q1 2024 Fed rate cut.

The US equity markets ended the Thursday session in positive territory. The Nasdaq Composite Index rallied 1.37%, with the Dow and the S&P 500 gaining 0.17% and 0.80%.

The Thursday Market Movers

Bank stocks were among the worst performers on a deteriorating outlook as central banks consider rate cuts. A lower interest rate environment impacts net interest margins and the bottom line. Commerzbank slid by 4.14%, with Deutsche Bank declining by 0.89%.

Retail stocks also stumbled on concerns about the euro area economy. Zalando and Adidas ended the session down 3.35% and 2.99%.

Auto stocks also struggled amidst the gloomy outlook as investors considered the economy. Porsche fell by 0.87%, with BMW and Volkswagen declining by 0.75% and 0.73%. Daimler Truck Holding and Mercedes Benz Group ended the session down 0.28% and 0.05%.

However, BASF was among the front-runners, gaining 1.47%. Revamp plans drew investor interest.

German Inflation in the Spotlight

On Friday, German inflation numbers for November warrant investor attention. Revision to preliminary numbers will move the dial. The markets expect the ECB to take a less hawkish rate path. Softer-than-expected numbers would support earlier discussions on interest rate cuts and the DAX.

According to preliminary numbers, the annual inflation rate softened from 3.8% to 3.2%

US Jobs Report in the Spotlight

On Friday, the US Jobs Report will be the main report of the day. Weaker-than-expected wage growth and an increase in the unemployment rate could cement bets on a Q1 2024 Fed rate cut. However, a marked deterioration in labor market conditions could spook investors and impact the DAX.

Economists forecast average hourly earnings to increase by 0.3% in November after rising by 0.2% in October. However, economists expect the US unemployment rate to hold steady at 3.9%. In line with or better than the forecast numbers could affect Fed rate hike bets.

While the Jobs Report will be the focal point, US consumer confidence figures also need consideration. A pickup in consumer confidence would ease fears of a hard landing. Economists forecast the Michigan US Consumer Sentiment Index to increase from 61.3 to 62.0 in December. Beyond the headline figure, the inflation component will also influence risk sentiment.

The futures markets pointed to a mixed start to the Friday session. The DAX was up 21 points, while the Nasdaq mini was down 16 points.

Short-Term Forecast

Near-term trends for the DAX will depend on the US Jobs Report. Softer-than-expected wage growth and a steady unemployment rate would support a Q1 2024 Fed Rate cut without spooking investors. Rising bets on a Fed rate cut could support a DAX move toward 17,000.

DAX Technical Indicators

Daily Chart

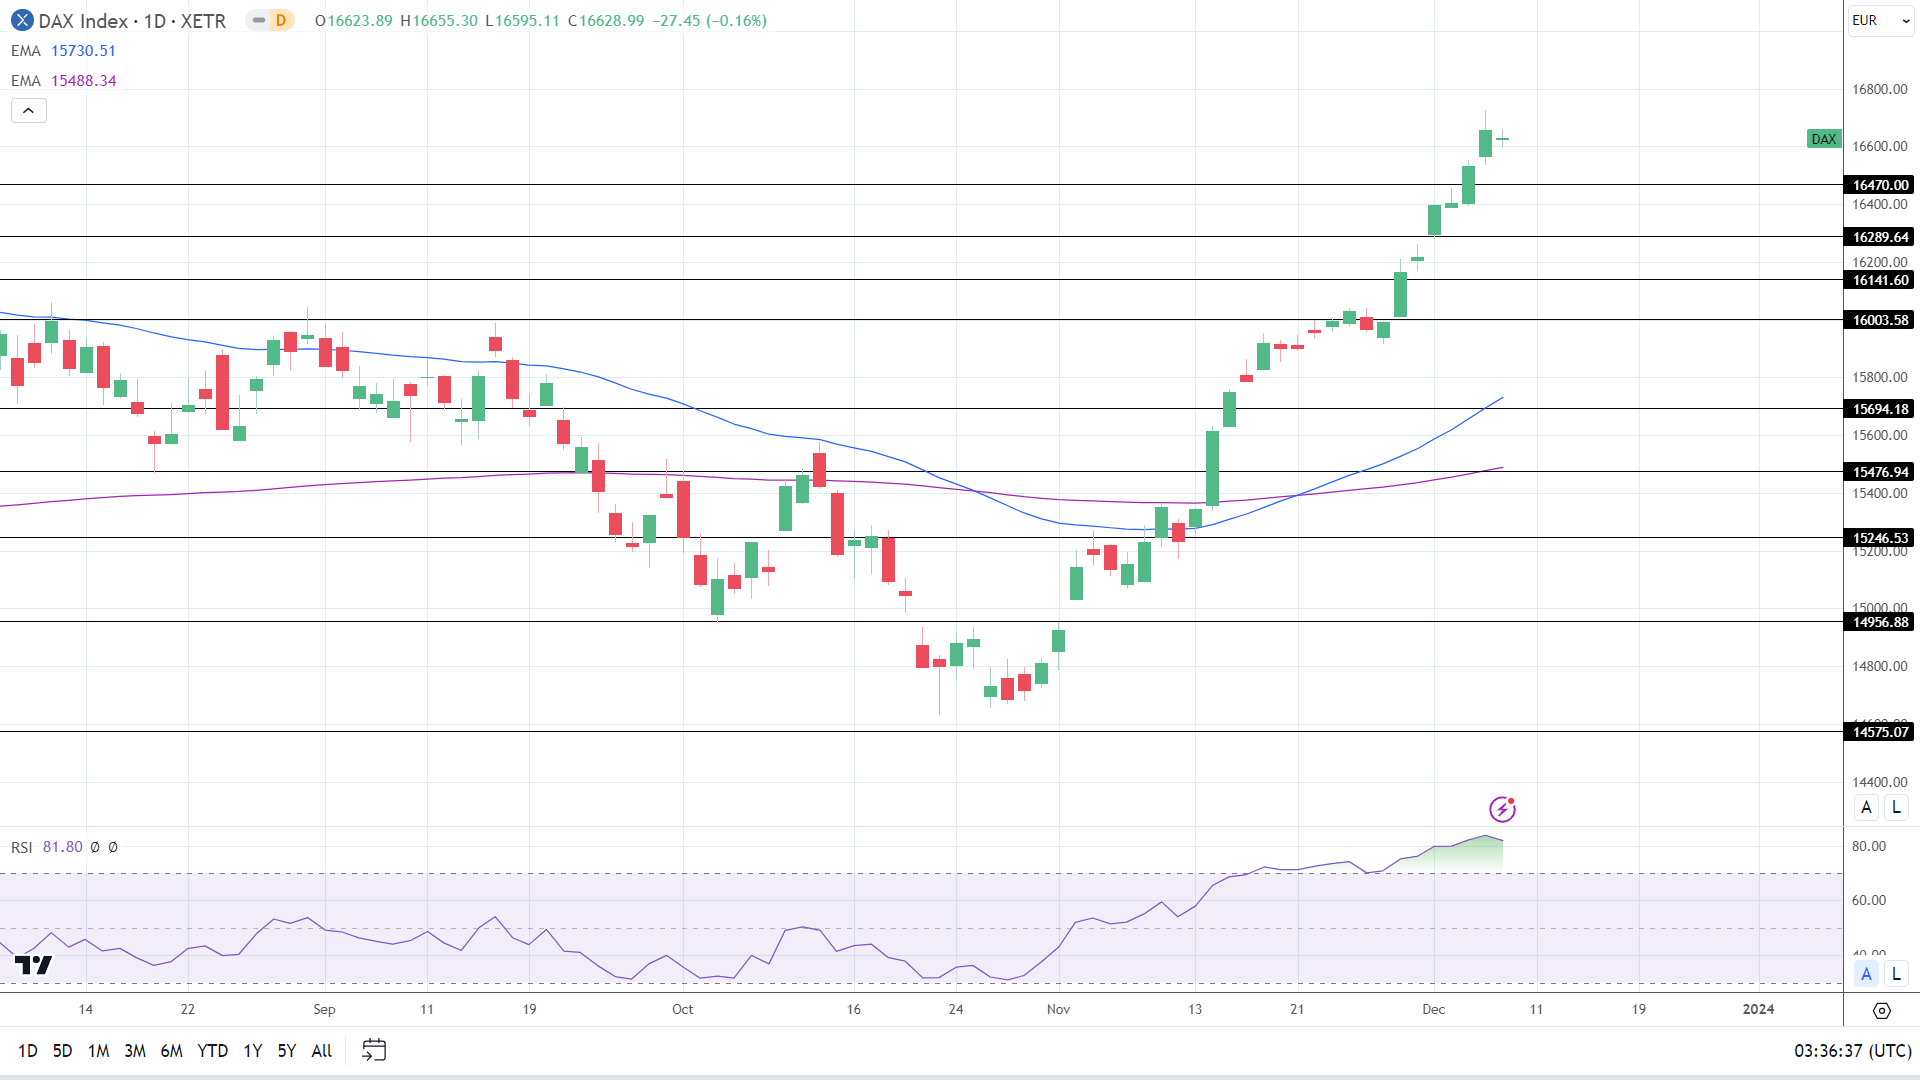
The DAX remained above the 50-day and 200-day EMAs, with the EMAs affirming bullish price signals.

A DAX move through the Wednesday ATH of 16,727 would give the bulls a run at the 17,000 psychological resistance level.

The US Jobs Report will be the focal point on Friday.

However, a fall through the 16,470 support level would bring the 16,290 support level into play.

The 14-day RSI reading of 81.80 shows the DAX in overbought territory. Selling pressure could intensify at the Wednesday ATH of 16,727.

DAX Daily Chart EMAs send bullish price signals.
DAX 081223 Daily Chart

4-Hourly Chart

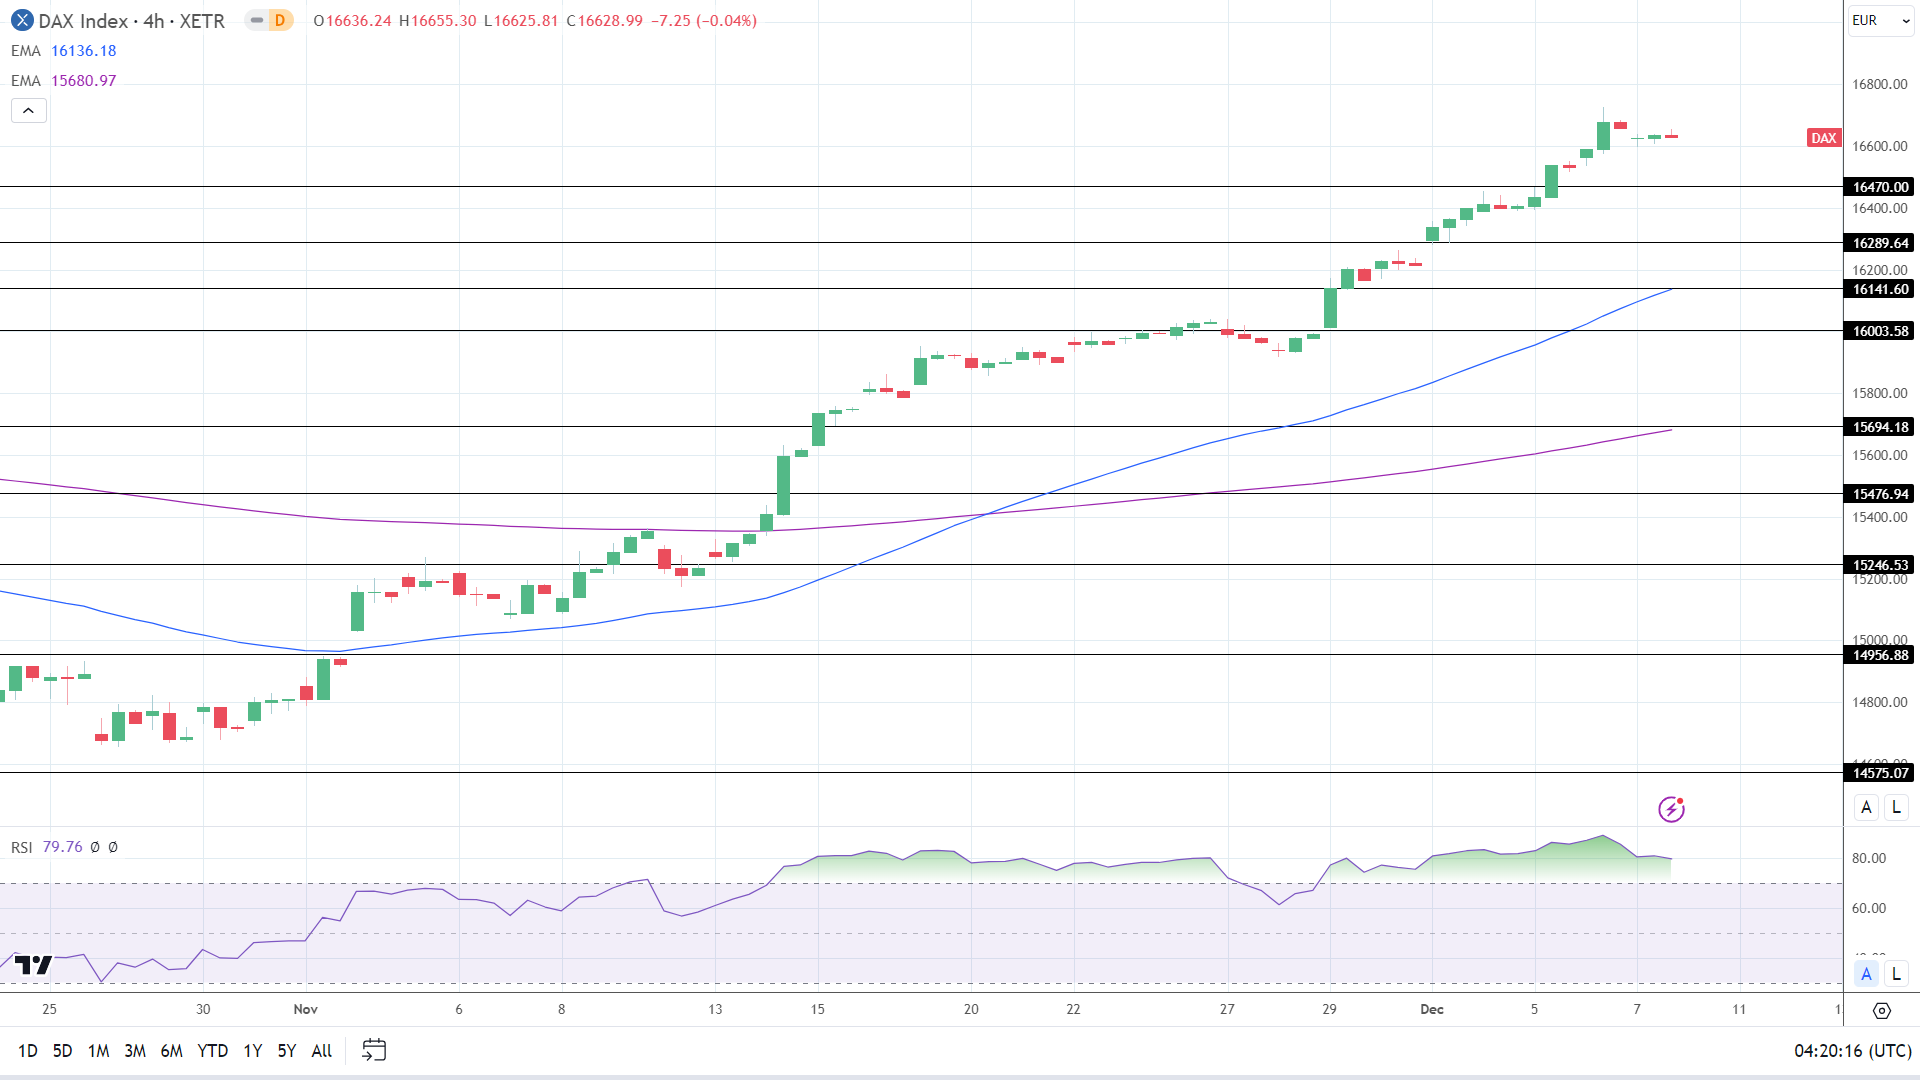
The DAX sat above the 50-day and 200-day EMAs, with the EMAs reaffirming bullish price signals.

A DAX break above the Wednesday ATH of 16,727 would support a move to 17,000.

However, a drop below the 16,470 support level would give the bears a run at the 16,290 support level.

The 79.76 14-4 hour RSI shows the DAX in overbought territory. Selling pressure may intensify at the all-time high of 16,727.

4-Hourly Chart EMAs send bullish price signals.
DAX 081223 4-Hourly Chart
EUR/USD Forecast: A Return to $1.0850 Hinged on the US Jobs Report

EUR/USD Forecast: A Return to $1.0850 Hinged on the US Jobs Report

Thursday Overview

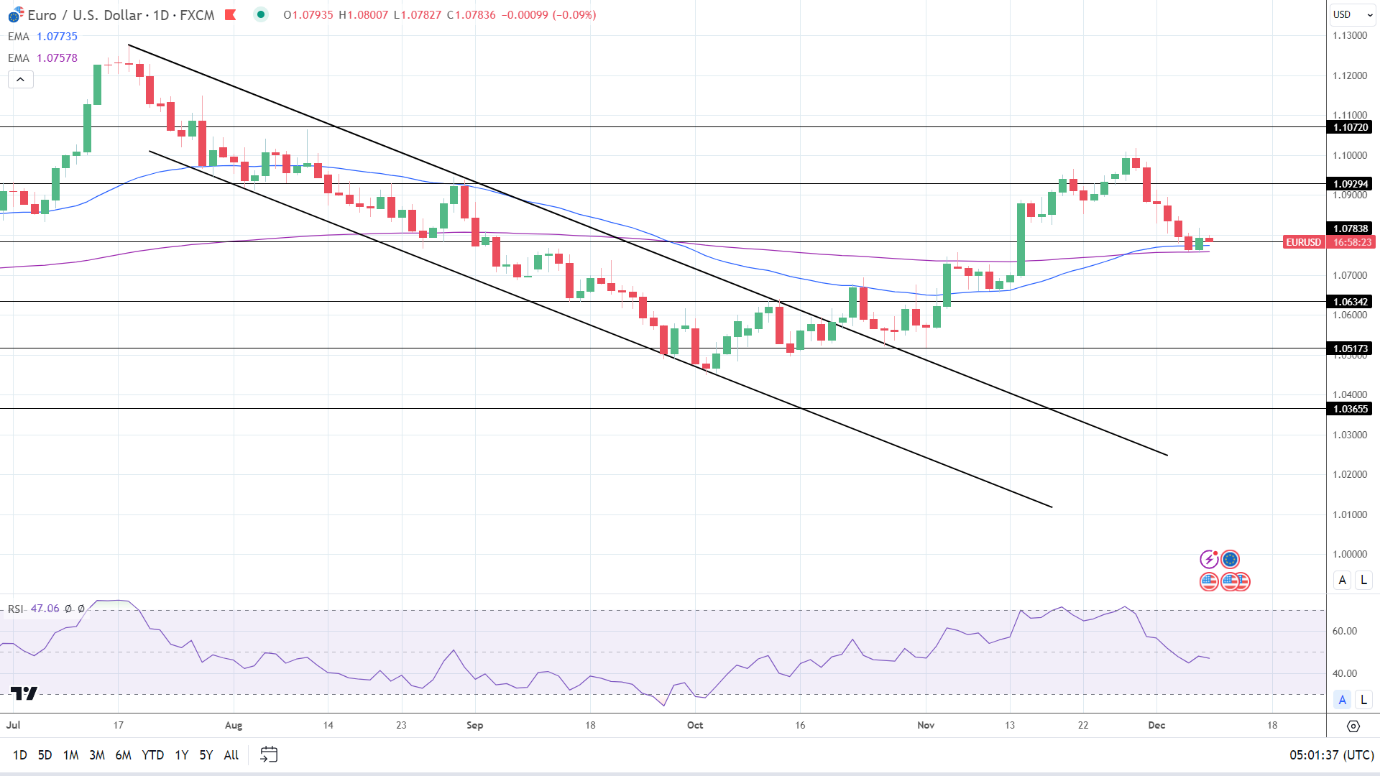
The EUR/USD gained 0.27%. After a 0.30% loss on Wednesday, the EUR/USD ended the day at $1.07935. The EUR/USD fell to a low of $1.07550 before rising to a high of $1.08177.

German Inflation in the Spotlight

On Friday, finalized German inflation figures for November need investor consideration. A downward revision to the preliminary number could impact the buyer demand for the EUR. Softer inflationary pressures would allow the ECB to take a less hawkish rate path.

Trading Derivatives carries a high level of risk to your capital and you should only trade with money you can afford to lose. Trading Derivatives may not be suitable for all investors, so please ensure that you fully understand the risks involved, and seek independent advice if necessary. A Product Disclosure Statement (PDS) can be obtained either from this website or on request from our offices and should be considered before entering into a transaction with us. Raw Spread accounts offer spreads from 0.0 pips with a commission charge of USD $3.50 per 100k traded. Standard account offer spreads from 1 pips with no additional commission charges. Spreads on CFD indices start at 0.4 points. The information on this site is not directed at residents in any country or jurisdiction where such distribution or use would be contrary to local law or regulation.

According to preliminary numbers, the annual inflation rate softened from 3.8% to 3.2% in November.

Beyond the numbers, ECB commentary needs monitoring. ECB Executive Board member Luis De Guindos is on the calendar to speak. Support for early discussions about rate cuts could weigh on the EUR/USD. Significantly, recent euro area economic indicators suggested a weakening macroeconomic environment at the start of Q4. Further deterioration could result in a prolonged economic recession.

US Jobs Report and Consumer Sentiment in the Spotlight

On Friday, the all-important US Jobs Report will be in focus. Hotter-than-expected wage growth and a steady unemployment rate could reduce bets on a Q1 2024 Fed rate cut. A pickup in wage growth would increase disposable income, fueling consumer spending and demand-driven inflation. A positive consumer spending outlook could force the Fed to maintain a hawkish rate path.

Economists forecast the unemployment rate to hold steady at 3.9%. Significantly, economists expect average hourly wages to increase by 0.3% in November vs. 0.2% in October.

While the Jobs Report is the focal point, US consumer sentiment numbers also warrants consideration. A pickup in consumer sentiment could signal a positive outlook for spending and force the Fed to maintain a hawkish rate path.

Short-Term Forecast:

EUR/USD near-term trends hinge on the US Jobs Report. A better-than-expected US Jobs Report may dampen Fed rate cut bets and support a EUR/USD retreat. Euro area macroeconomic conditions could pressure the ECB to bring forward discussions about rate cuts, another possible headwind.

EUR/USD Price Action

Daily Chart

The EUR/USD held above the 50-day and 200-day EMAs, sending bullish price signals.

A EUR/USD break above the $1.07838 resistance level would give the bulls a run at the $1.09294 resistance level.

German inflation numbers and the US Jobs Report are the focal points.

However, a EUR/USD fall through the 50-day and 200-day EMAs would bring sub-$1.07 support levels into play.

The 14-period Daily RSI, 47.06, suggests a EUR/USD drop to the $1.07000 handle before entering oversold territory.

EUR/USD Daily Chart sends bullish price signals.
EURUSD 081223 Daily Chart

4-Hour Chart

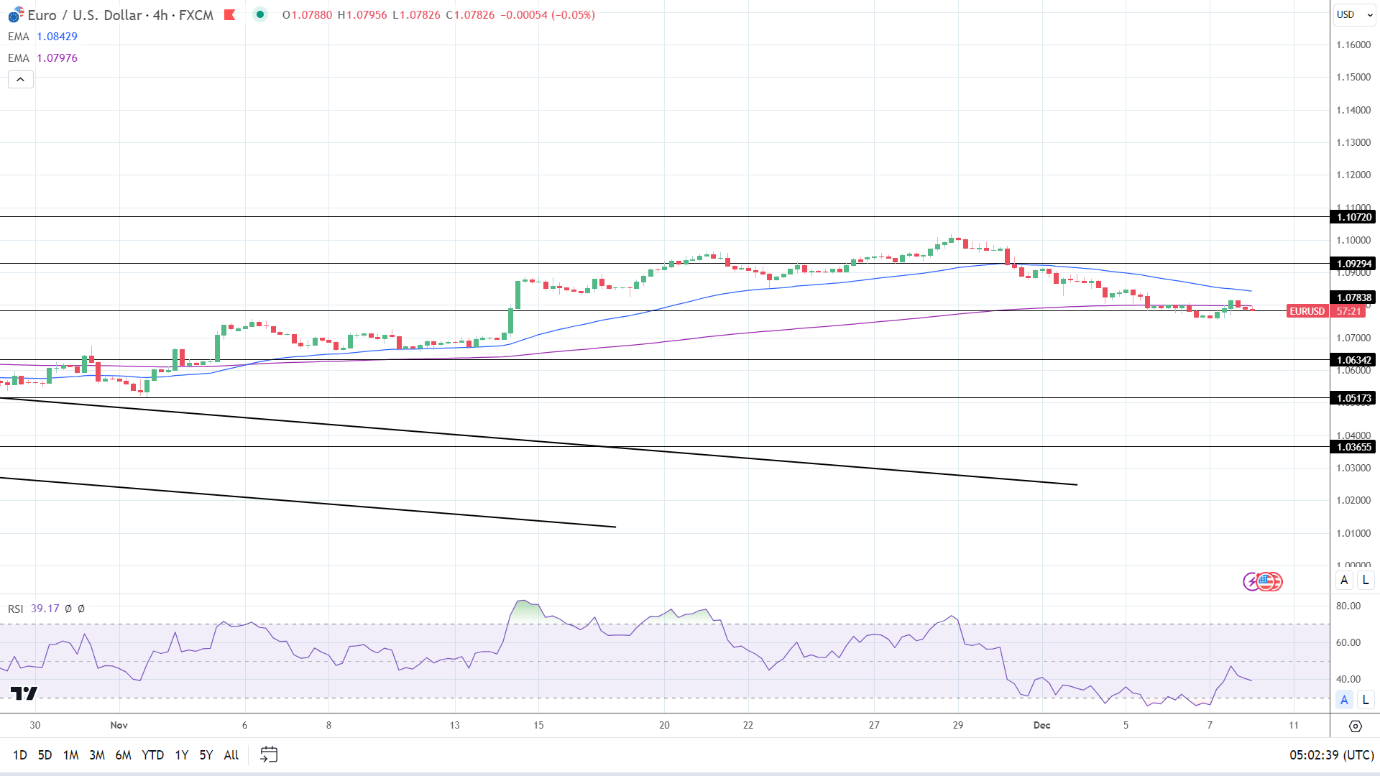
The EUR/USD remained below the 50-day and 200-day EMAs, affirming bearish price signals.

A EUR/USD move through the $1.07838 resistance level and 200-day EMA would give the bulls a run at the 50-day EMA.

However, a EUR/USD fall through the $1.07500 handle could signal a fall to the $1.06342 support levels.

The 14-period RSI on the 4-hour chart, 39.17, suggests a EUR/USD drop to $1.07 before entering oversold territory.

4-Hourly Chart sends bearish price signals.
EURUSD 081223 4 Hourly Chart
NASDAQ Index, SP500, Dow Jones Forecasts – NASDAQ Rallies As AMD Gains 9%

NASDAQ Index, SP500, Dow Jones Forecasts – NASDAQ Rallies As AMD Gains 9%

SP500

SP500
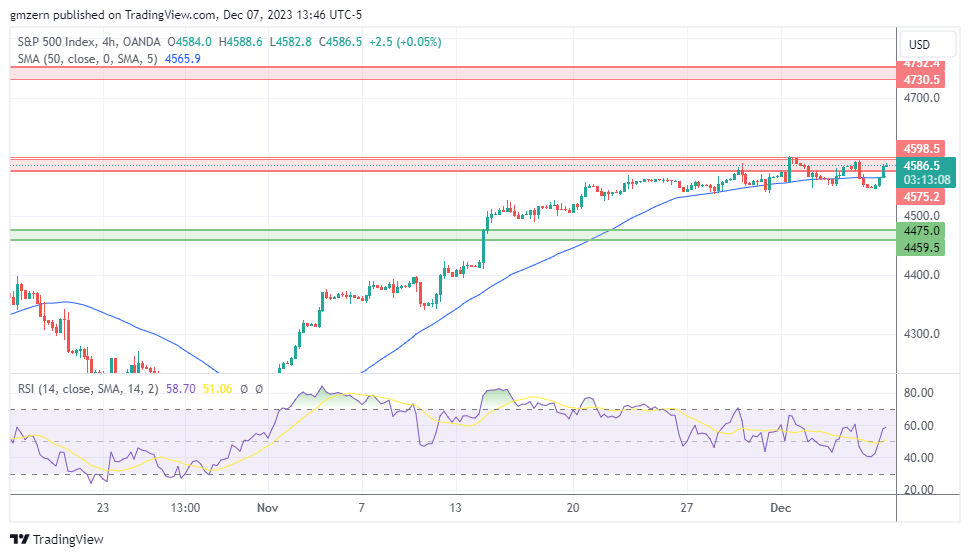
SP500 071223 4h ChartSP500 gains ground as traders buy AI-related stocks. Advanced Micro Devices, which is up by 9%, is the biggest gainer in today’s trading session. Today, traders also focused on the Initial Jobless Claims report. The report showed that 220,000 Americans filed for unemployment benefits in a week, compared to analyst consensus of 222,000.  Treasury yields were mostly flat as bond traders waited for additional catalysts after the recent moves. Today’s rally was broad, and the majority of market segments were moving higher. However, energy stocks remained under pressure as oil markets tested new lows amid worries about demand for oil in China.

From the technical point of view, SP500 continues its attempts to settle above the key resistance at 4575 – 4600. If SP500 settles above the 4600 level, it will gain additional upside momentum and head towards the next resistance at 4730 – 4750.

Trading Derivatives carries a high level of risk to your capital and you should only trade with money you can afford to lose. Trading Derivatives may not be suitable for all investors, so please ensure that you fully understand the risks involved, and seek independent advice if necessary. A Product Disclosure Statement (PDS) can be obtained either from this website or on request from our offices and should be considered before entering into a transaction with us. Raw Spread accounts offer spreads from 0.0 pips with a commission charge of USD $3.50 per 100k traded. Standard account offer spreads from 1 pips with no additional commission charges. Spreads on CFD indices start at 0.4 points. The information on this site is not directed at residents in any country or jurisdiction where such distribution or use would be contrary to local law or regulation.

NASDAQ

NASDAQ
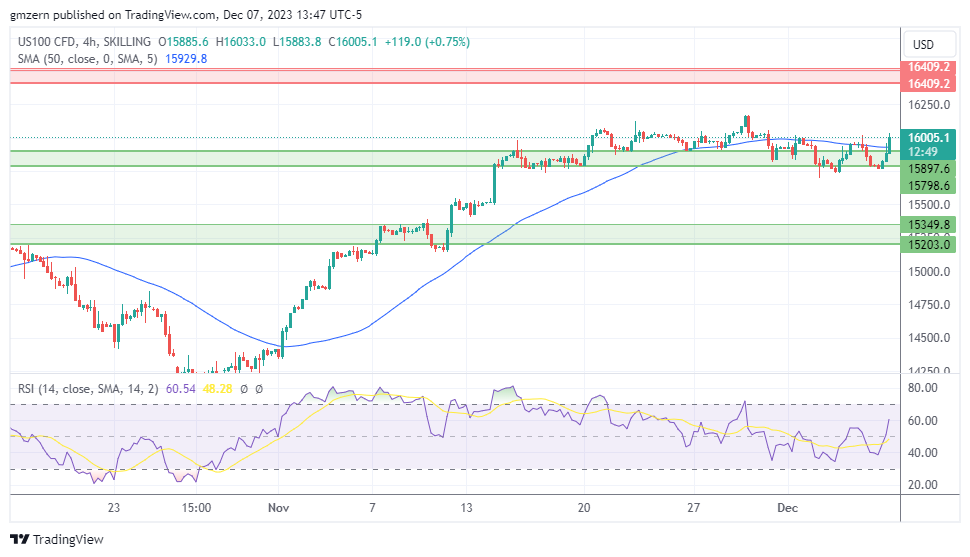
NASDAQ 071223 4h ChartNASDAQ moved back above the 16,000 level amid a strong rally in tech stocks. AI euphoria remains the key positive catalyst for NASDAQ index.

NASDAQ has been consolidating near the 16,000 level since mid-November. RSI remains in the moderate territory, so there is plenty of room to gain momentum in case the right catalysts emerge. From the technical point of view, NASDAQ needs to settle above 16,000 to move towards the next resistance at 16,400 – 16,500.

Dow Jones

Dow Jones
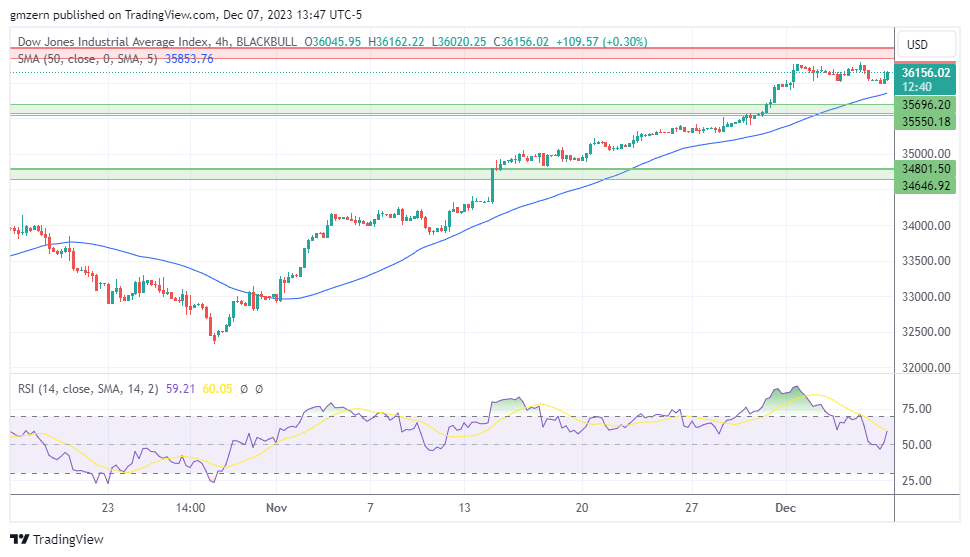
Dow Jones 071223 4h ChartDow Jones gained some ground in today’s trading session. Dow Jones’ gains were limited by the pullback in Merck stock, which was down by more than 1% after the company scrapped phase 3 study of a combination of two drugs to treat certain lung cancer patients.

The nearest resistance level for Dow Jones is located in the 36,350 – 36,500 range. A move above 36,500 will provide Dow Jones with an opportunity to gain additional upside momentum.

Silver Prices Forecast: XAG/USD’s Stability Tested by Upcoming U.S. Labor Market Report

Silver Prices Forecast: XAG/USD’s Stability Tested by Upcoming U.S. Labor Market Report

Silver Prices Eye Weekly Decline Amid U.S. Economic Data

Silver (XAG/USD) prices are poised for their first weekly drop in four weeks, influenced by a strengthening dollar. However, the market remains steady as investors anticipate crucial U.S. jobs data, which could impact the Federal Reserve’s rate decision in March.

Current Market Position and Future Projections

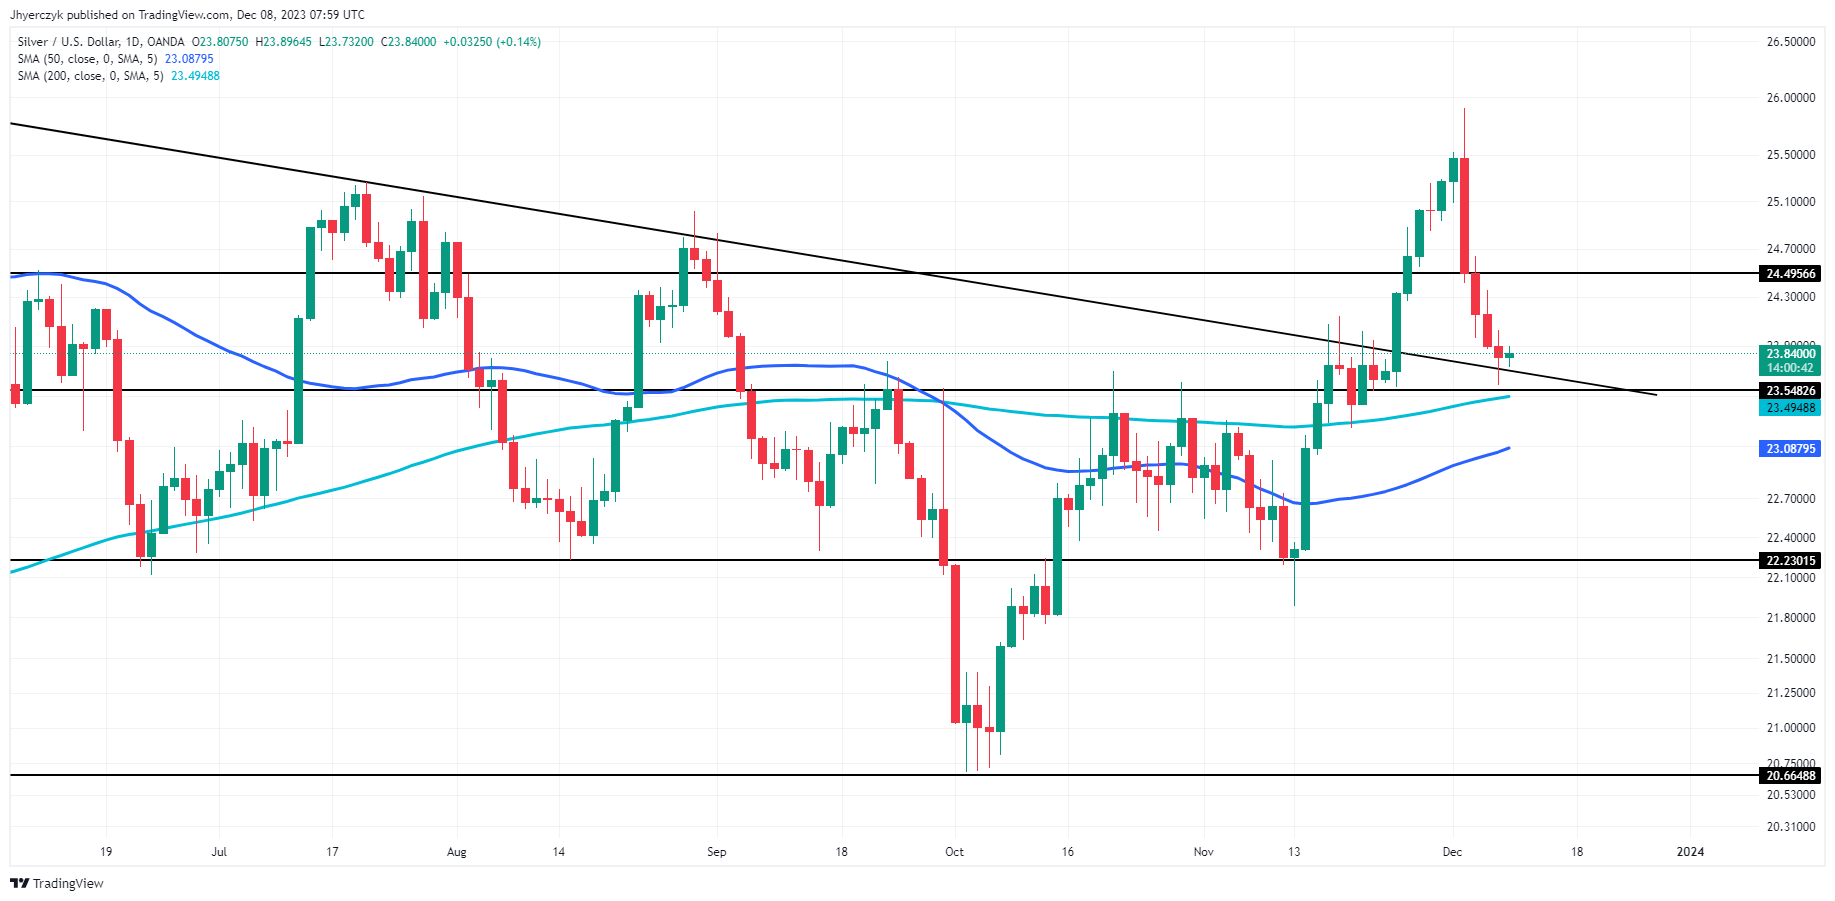
As of 07:35 GMT, spot silver edged slightly lower to $23.82 per ounce, marking a near 2% drop for the week. Conversely, U.S. silver futures showed an uptick at $24.12. Despite this week’s decline, silver has generally been well-supported above $23.90, but upcoming payroll data could challenge this stability. Earlier in the week, silver reached a seven-month high of $26.34, propelled by expectations of a Fed rate cut, before uncertainty over the timing led to a decline.

Trading Derivatives carries a high level of risk to your capital and you should only trade with money you can afford to lose. Trading Derivatives may not be suitable for all investors, so please ensure that you fully understand the risks involved, and seek independent advice if necessary. A Product Disclosure Statement (PDS) can be obtained either from this website or on request from our offices and should be considered before entering into a transaction with us. Raw Spread accounts offer spreads from 0.0 pips with a commission charge of USD $3.50 per 100k traded. Standard account offer spreads from 1 pips with no additional commission charges. Spreads on CFD indices start at 0.4 points. The information on this site is not directed at residents in any country or jurisdiction where such distribution or use would be contrary to local law or regulation.


Economic Indicators and the Federal Reserve Outlook

Recent economic data, including ADP’s employment change report and the Job Openings and Labor Turnover Survey (JOLTS), suggest a cooling U.S. labor market. These reports, coupled with lower-than-expected weekly jobless claims, are crucial ahead of the Fed’s policy meeting next week. The central bank is expected to maintain current interest rates, but the market seeks clues about future policies and economic outlook.

Influence of the Dollar and Non-Farm Payrolls

The dollar index’s potential to break a three-week losing streak could make silver more expensive for holders of other currencies. Meanwhile, the upcoming U.S. non-farm payrolls report is set to be a significant determinant of market direction, with particular interest in the unemployment rate and average earnings.

Short-Term Forecast: Market Reactions Awaited

In the short term, silver’s trend will be heavily influenced by the U.S. labor market data and the subsequent Federal Reserve’s response. With markets indicating a possible rate cut by March, the outcome of these economic reports will be pivotal in shaping the direction of silver prices in the coming weeks.

Technical Analysis

Daily Silver (XAG/USD)The current daily price of Silver (XAG/USD) at 23.82 is slightly above both the 200-day and 50-day moving averages, which are at 23.49 and 23.09 respectively. This positioning above the key moving averages suggests a bullish sentiment in the short term.

The price is hovering just above the minor support level of 23.55, providing a narrow margin above this threshold. If the price remains above this level, it could maintain its bullish stance.

However, the proximity to the minor resistance at 24.50 will be a key area to watch. If the price breaks through this resistance, it could signal a stronger bullish momentum. Conversely, a drop below the minor support level could shift the sentiment towards bearish.

Overall, the market sentiment for Silver currently leans towards bullish, but with caution due to the vulnerability of the support level.

Gold Prices Forecast: XAU/USD Steady Ahead of US Non-Farm Payrolls Report

Gold Prices Forecast: XAU/USD Steady Ahead of US Non-Farm Payrolls Report

Gold Prices Steady Ahead of U.S. Jobs Report

Gold (XAU/USD) prices are relatively stable on Friday, with markets closely monitoring the upcoming U.S. Non-Farm Payrolls report at 13:30 GMT, for clues about potential Federal Reserve rate cuts. Spot gold has seen a slight increase, while U.S. gold futures are unchanged, as investors await the key labor market data. Immediately after the report, trader focus will shift to next week’s Federal Reserve policy decisions.

Weekly Performance and Rate Cut Expectations

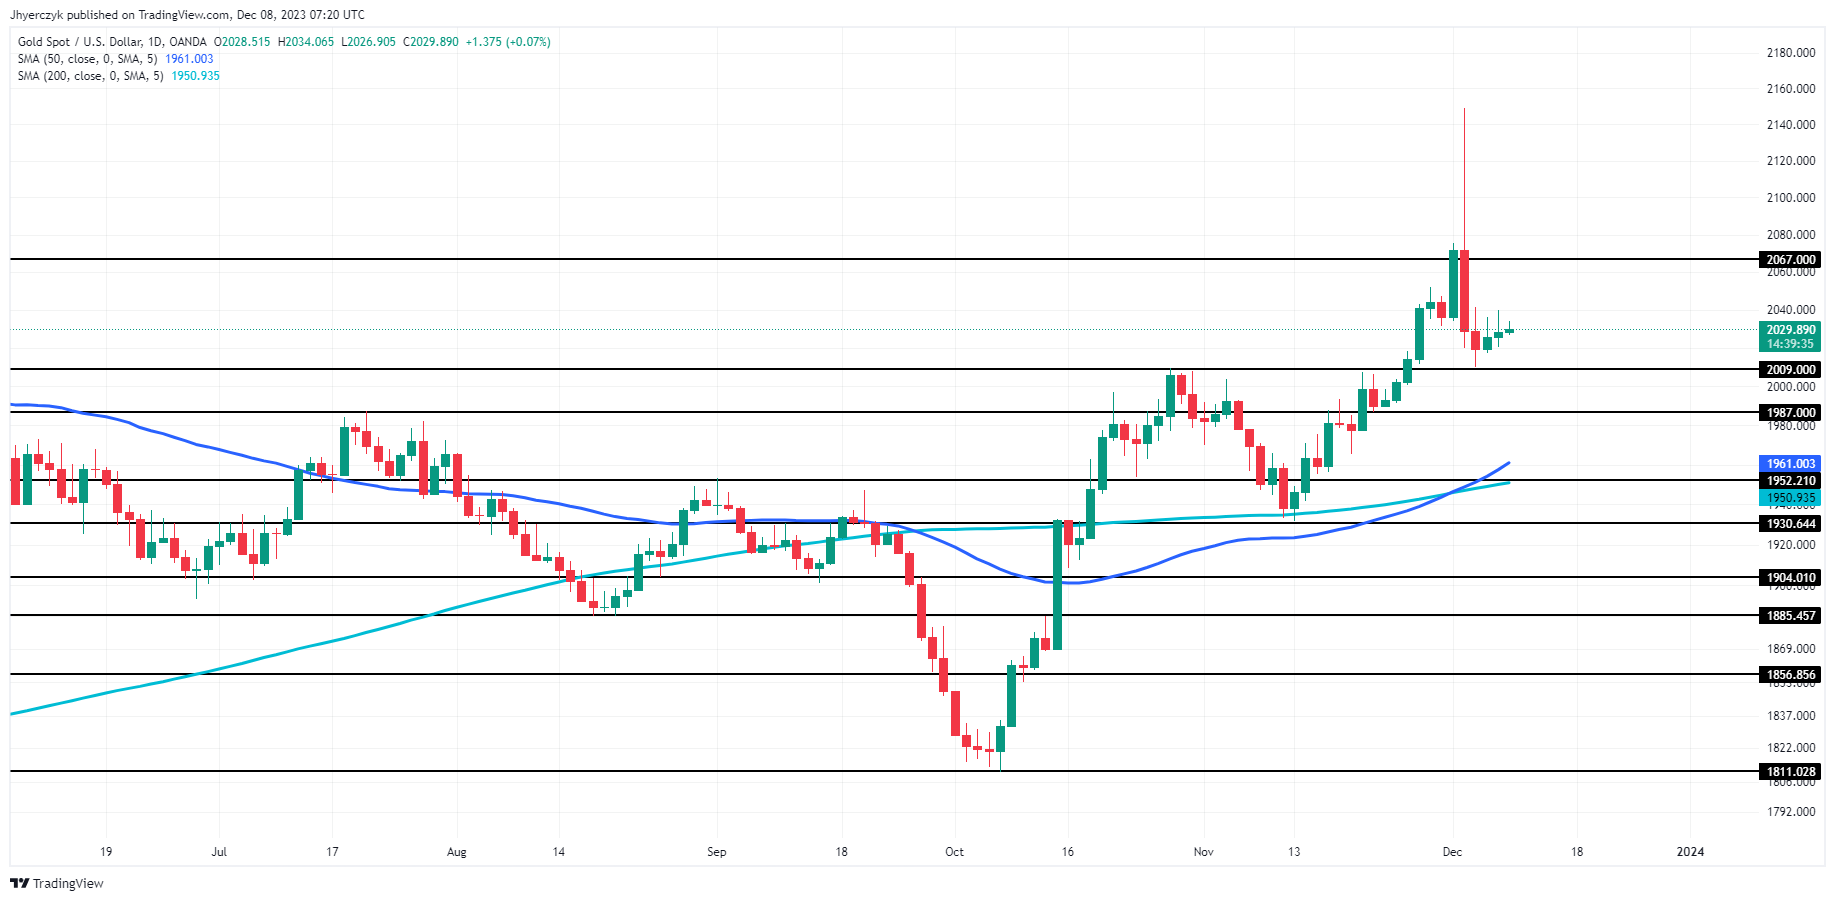
This week, gold is on track for its first weekly decline in four, mainly due to a firmer dollar. However, the precious metal has maintained support above the $2,009 per ounce level. Earlier in the week, gold reached a record high, fueled by expectations of a Fed rate cut, but uncertainty over the cut’s timing caused a subsequent drop.

Trading Derivatives carries a high level of risk to your capital and you should only trade with money you can afford to lose. Trading Derivatives may not be suitable for all investors, so please ensure that you fully understand the risks involved, and seek independent advice if necessary. A Product Disclosure Statement (PDS) can be obtained either from this website or on request from our offices and should be considered before entering into a transaction with us. Raw Spread accounts offer spreads from 0.0 pips with a commission charge of USD $3.50 per 100k traded. Standard account offer spreads from 1 pips with no additional commission charges. Spreads on CFD indices start at 0.4 points. The information on this site is not directed at residents in any country or jurisdiction where such distribution or use would be contrary to local law or regulation.

Economic Data and Market Sentiment

Recent U.S. economic reports have hinted at a cooling labor market, potentially influencing the Fed’s rate policy. Notably, ADP’s employment change report showed fewer private payrolls added in November than expected. Additionally, the Job Openings and Labor Turnover Survey (JOLTS) indicated a significant decline in job openings in October. These factors, combined with lower-than-expected weekly jobless claims, suggest a gradual slowing of the labor market.

Fed’s Upcoming Policy Meeting and Dollar Index Movements

As the Federal Reserve’s policy meeting approaches, markets are pricing in a 59% chance of a U.S. rate cut by March. The dollar index is set to break a three-week losing streak, which could impact gold prices, making it more expensive for holders of other currencies.

Short-Term Forecast: Focus on Labor Market Data

In the short term, the gold market’s focus will be on the U.S. non-farm payrolls report, particularly on the unemployment rate and average earnings. Any significant deviation from expectations in these metrics could heavily influence market reactions and gold prices. Overall, the precious metal’s outlook hinges on the interpretation of labor market data and its potential impact on Fed policy.

Technical Analysis

Daily Gold (XAU/USD)The current daily price of Gold (XAU/USD) at 2029.55 is trading above both the 200-day and 50-day moving averages, positioned at 1950.93 and 1960.99 respectively. This indicates a bullish sentiment as the price is comfortably above these key moving average benchmarks.

Additionally, the price is currently between the minor support level at 2009.00 and the minor resistance level at 2067.00. This placement suggests the market is in a consolidation phase within this range.

The proximity to the minor resistance level might lead to a test of this threshold. If the price successfully breaches the 2067.00 resistance, it could signal further bullish momentum. Conversely, a drop below the 2009.00 support level may shift the sentiment towards bearish.

However, given the current position above key moving averages and support levels, the short-term market sentiment for Gold appears to be bullish.