XRP News: US Republican Candidate Ramaswamy Talked Crypto

XRP News: US Republican Candidate Ramaswamy Talked Crypto

The Thursday Overview

On Thursday, XRP gained 0.45%. Following a 3.11% rally on Wednesday, XRP ended the session at $0.6434.

SEC Appeal Could Clash with the 2024 US Presidential Election

There was no SEC v Ripple case-related news to influence investors and XRP. However, optimism toward the ongoing case continued to drive buyer demand. Notably, XRP struck a three-week high of $0.6547 on Thursday.

Trading Derivatives carries a high level of risk to your capital and you should only trade with money you can afford to lose. Trading Derivatives may not be suitable for all investors, so please ensure that you fully understand the risks involved, and seek independent advice if necessary. A Product Disclosure Statement (PDS) can be obtained either from this website or on request from our offices and should be considered before entering into a transaction with us. Raw Spread accounts offer spreads from 0.0 pips with a commission charge of USD $3.50 per 100k traded. Standard account offer spreads from 1 pips with no additional commission charges. Spreads on CFD indices start at 0.4 points. The information on this site is not directed at residents in any country or jurisdiction where such distribution or use would be contrary to local law or regulation.

Currently, the SEC and Ripple are proceeding through remedies-related discovery. XRP may respond to a favorable disgorgement. However, the ruling is unlikely to have a lasting impact on XRP or the broader market. Judge Analisa Torres ruled that XRP sales to institutional investors broke US securities laws.

XRP will show greater sensitivity to the SEC appealing the Programmatic Sales of XRP ruling. The SEC must wait until the end of the case against Ripple before appealing. Based on the recent court briefing schedule, the SEC must file its final brief by April 19, 2024. The SEC must then wait for Judge Torres to deliver the ruling, which could mean an appeal by the summer.

Several external forces could influence SEC plans to appeal the Programmatic Sales ruling. A Republican victory in the US Presidential Election is one of note.

The US Presidential Election: A Republican Victory?

In November 2024, the US could have a new President. The outcome of the Presidential Election could be significant for XRP and the broader market. A Joe Biden victory would likely mean more of the same with SEC Chair Gary Gensler at the helm.

However, a Republican win could expedite progress toward a regulatory framework and end the reign of regulation by enforcement.

US Republican Leadership Candidate Vivek Ramaswamy had this to say about crypto in a televised Q&A session,

“Fraudsters, criminals, and terrorists have been defrauding people for a long time. Our regulations need to catch up with the current moment. The fact that SBF was able to do what he did at FTX shows that whatever they have in the current framework isn’t working. And I think it is nothing short of embarrassing that Gary Gensler, the current leader of the SEC, in front of Congress, could not even say whether Ethereum counted as a regulated security or not.”

Ramaswamy went on to say,

“And so, I think this is just another example of the administrative state gone too far. Here’s the dirty little secret in American politics today. The people who we elect to run the government are not the ones who are running the government. It is the bureaucrats in those three letter agencies.”

A newly appointed SEC Chair with a more favorable view on cryptos may end the pursuit of ‘all things securities.’

XRP Price Action
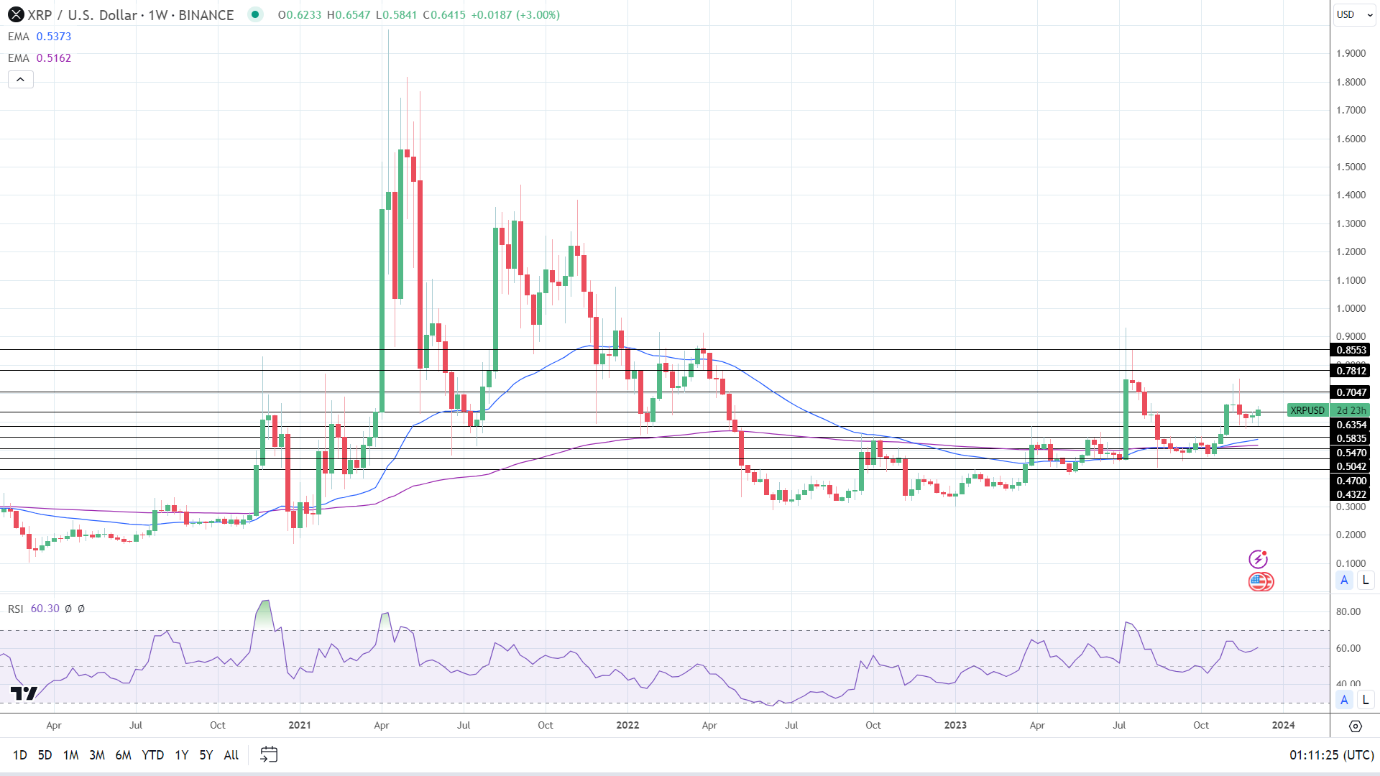
Weekly Chart sends bullish price signals.
XRPUSD 081223 Weekly Chart

Daily Chart

XRP remained above the 50-day and 200-day EMAs, sending bullish price signals.

An XRP move through the Thursday high of $0.6547 would bring the $0.67 handle and the $0.7047 resistance level into view.

SEC activity and SEC v Crypto case-related news remain focal points.

However, a break below the $0.6354 support level would give the bears a run at the 50-day EMA.

The 14-day RSI reading of 60.38 indicates an XRP return to the $0.70 handle before entering overbought territory.
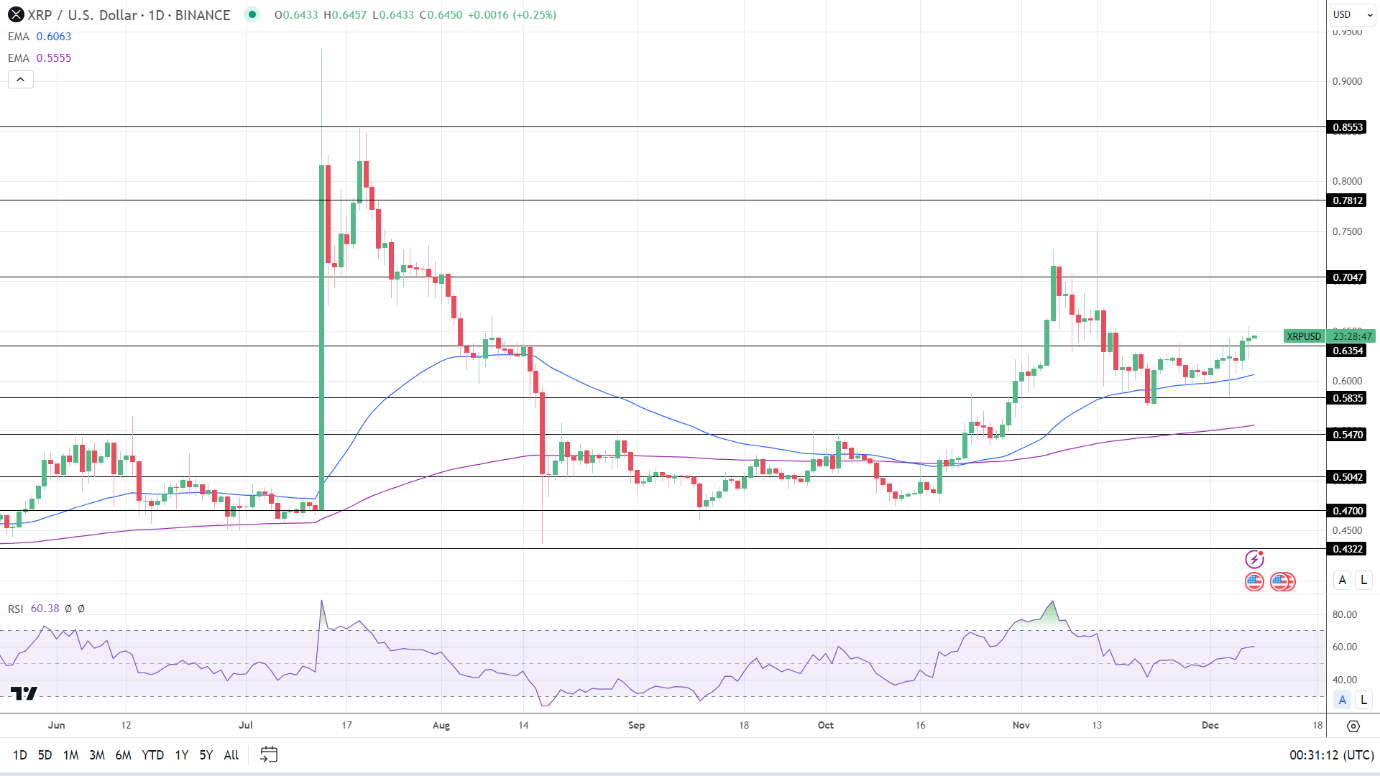
XRP Daily Chart affirms bullish price signals.
XRPUSD 081223 Daily Chart

4-Hourly Chart

On the 4-hourly, XRP sat above the 50-day and 200-day EMAs, affirming bullish price signals.

An XRP breakout from the Thursday high of $0.6547 would support a move toward the $0.7047 resistance level.

However, an XRP fall through the $0.6354 support level would give the bears a run at the 50-day EMA.

The 4-hourly RSI, with a reading of 58.67, indicates an XRP move to the $0.70 handle before entering overbought territory.
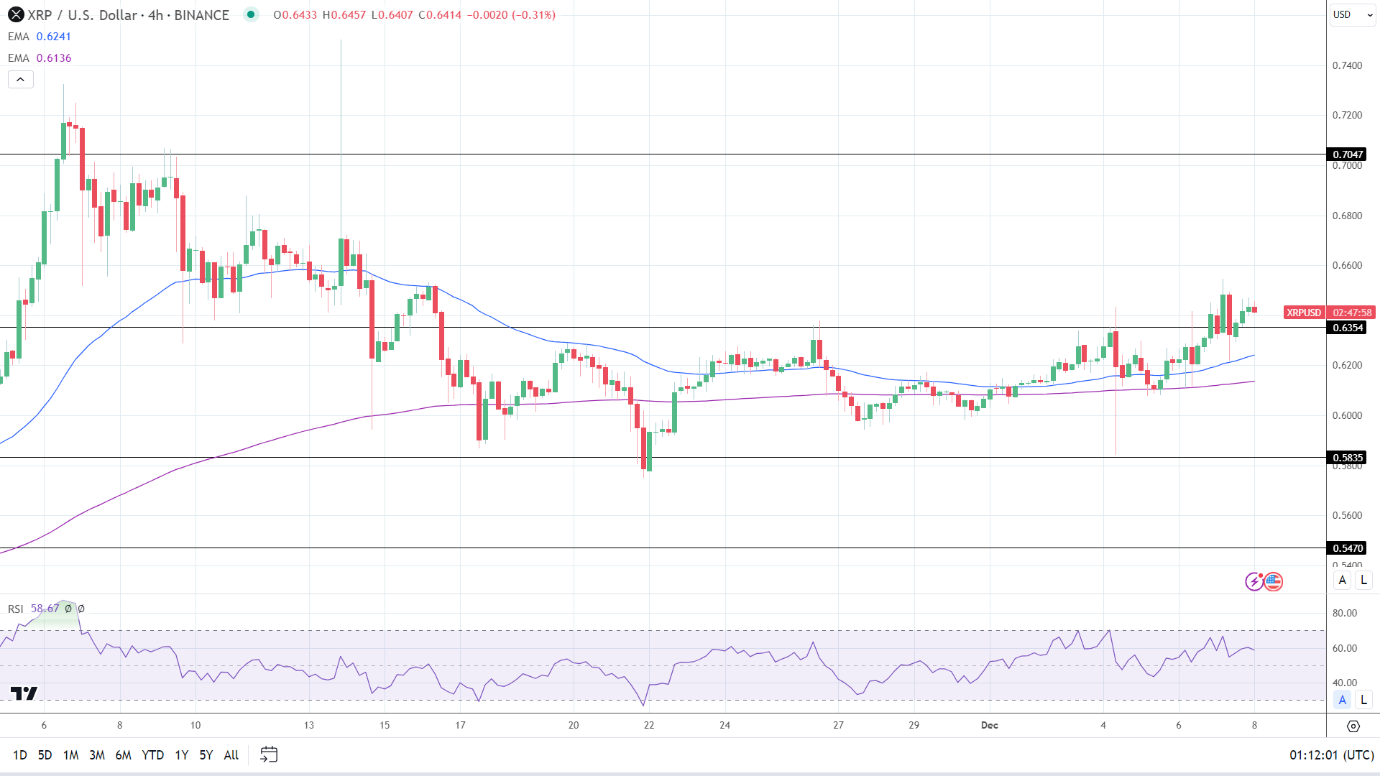
XRP 4-Hourly Chart reaffirms bullish price signals.
XRPUSD 081223 4-Hourly Chart
Japanese Yen Latest – USD/JPY Posts a Fresh Three-Month Low on BoJ Talk

Japanese Yen Latest – USD/JPY Posts a Fresh Three-Month Low on BoJ Talk

The Japanese Yen is strengthening against a range of currencies today after recent Bank of Japan commentary suggested that the central bank may be looking at various ways of ending its ultra-loose monetary policy. According to BoJ deputy governor Ryozo Himino, ending the current ultra-loose monetary policy would not harm the economy, while governor Kazuo Ueda noted that the central bank has not decided which interest rate to look at it when the BoJ finally ends their negative interest rate policy. This faintly hawkish messaging was countered by governor Ueda adding that Japan’s economy is still struggling and will continue to do so in 2024.

USD/JPY reacted to today’s comments by sliding to a fresh three-month low. Looking to the months ahead, if the US starts to reduce interest rates – 125 bp of rate cuts are forecast by the Fed in 2024 – and the Bank of Japan leaves policy unchanged – or even starts to tighten policy – the rate differential between the two currencies will narrow, pushing USD/JPY lower.

After posting a multi-decade high of 151.91 on November 13th, USD/JPY has moved lower as fears of central bank intervention capped any further upside. Today’s sharp turn lower now sees USD/JPY trade around 145.30 and further losses cannot be discounted. The pair trades below the 20- and 50-day simple moving averages and a break below the 145 level would bring into focus the 200-day sma at 142.26.

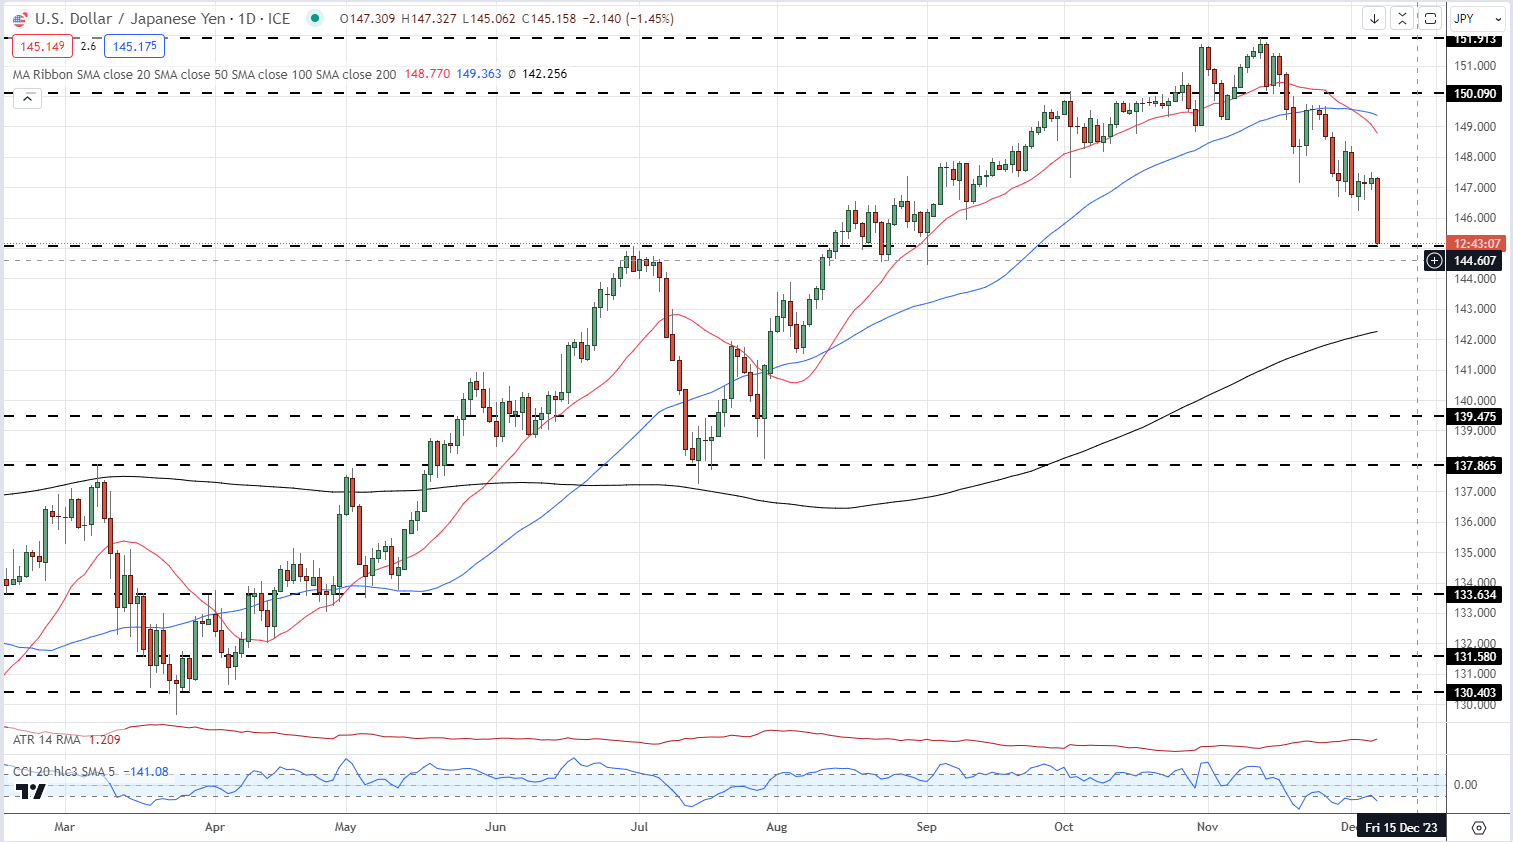
USD/JPY Daily Price Chart – December 7, 2023

image1.png

Retail trader data shows 27.40% of traders are net-long with the ratio of traders short to long at 2.65 to 1.The number of traders net-long is 1.71% lower than yesterday and 0.43% lower than last week, while the number of traders net-short is 5.47% lower than yesterday and 11.03% lower than last week.

Download the Latest IG Sentiment Report to See How Daily/Weekly Changes Affect the USD/JPY Price Outlook

GBP Price Forecast: UK House Price Index Rises for 2nd Consecutive Month

GBP Price Forecast: UK House Price Index Rises for 2nd Consecutive Month

GBPUSD FUNDAMENTAL BACKDROP

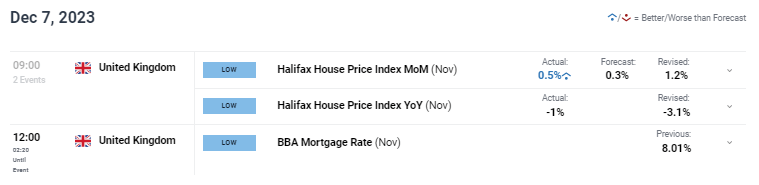
The British pound remains depressed but is attempting to find support this morning after housing prices surprised to the upside MoM (see economic calendar below). FX markets are relatively muted with little high impact economic data scheduled ahead of tomorrow’s Non-Farm Payroll (NFP) report. After yesterday’s weak UK construction PMI figures and minimal impact from Bank of England (BoE) Governor Andrew Bailey, focus now shifts to the US for guidance.

GBP/USD ECONOMIC CALENDAR (GMT +02:00)

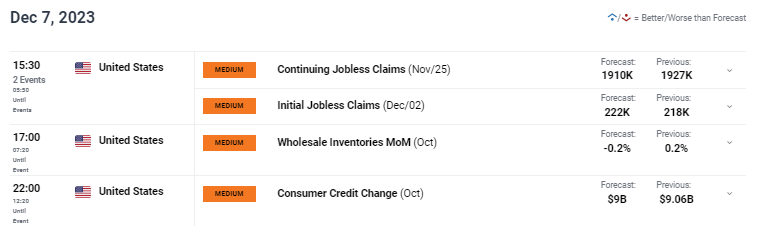
image1.pngimage2.png

Later today, jobless claims data will be closely watched with particular emphasis on initial jobless claims as this statistic shows any new/emerging unemployment. ADP employment change missed forecasts yesterday but taking into account its recent disconnect with NFP numbers, markets will largely dismiss its predictive capability.

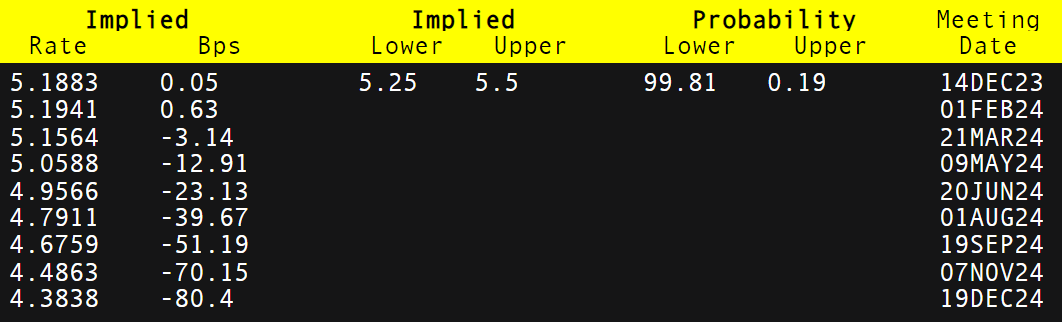
Money market pricing for the BoE (shown below) has been ‘dovishly’ repriced and with only UK GDP and UK jobs reports to come before the next rate announcement, these two data points will carry significant weight as to pricing moving forward.

BANK OF ENGLAND INTEREST RATE PROBABILITIES

image3.png

TECHNICAL ANALYSIS

GBP/USD DAILY CHART

image4.png

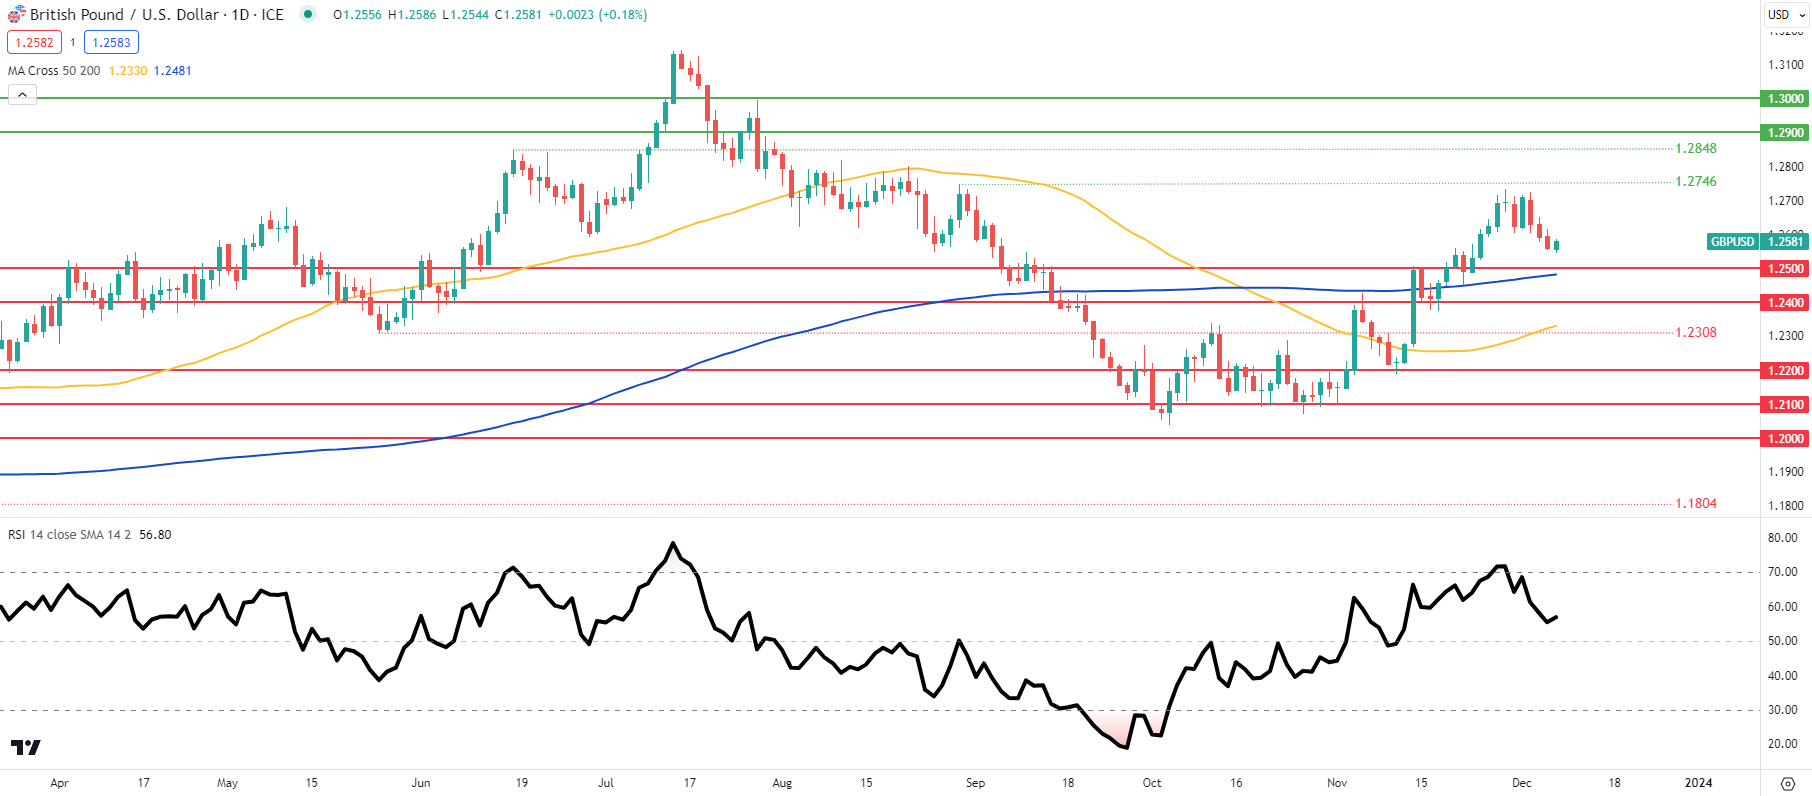
Daily GBP/USD price action is nearing key support at the 1.2500 psychological handle/200-day moving average (blue) as the pair comes off overbought territory shown via the Relative Strength Index (RSI). Short-term directional bias will come from tomorrow’s NFP’s that are expected higher and may extend cable’s recent downside.

Key resistance levels:

  • 1.2900
  • 1.2848
  • 1.2746

Key support levels:

  • 1.2500
  • 200-day MA
  • 1.2400
Oil Prices Forecast: EIA Report, China’s Demand Impacts Global Trends

Oil Prices Forecast: EIA Report, China’s Demand Impacts Global Trends

Rebounding Oil Prices

International benchmark Brent and U.S. benchmark WTI crude oil futures are showing signs of recovery on Thursday, attempting to rebound from the week’s significant losses. At 06:20 GMT, February Brent futures traded at $74.55, up by 0.34%, while January WTI futures were at $69.62, marking a 0.35% increase. This recovery follows a dip to a six-month low in the previous session, indicating a volatile market.

Inventory Shifts and Production Changes

The latest EIA report highlights a notable decrease in U.S. crude oil stockpiles, marking the first production drop since July. Contrasting with the decline in crude inventories, which fell by 4.6 million barrels, gasoline and distillate inventories rose. This increase, particularly the 5.4 million barrel surge in gasoline stocks, suggests heightened refiner output.

Trading Derivatives carries a high level of risk to your capital and you should only trade with money you can afford to lose. Trading Derivatives may not be suitable for all investors, so please ensure that you fully understand the risks involved, and seek independent advice if necessary. A Product Disclosure Statement (PDS) can be obtained either from this website or on request from our offices and should be considered before entering into a transaction with us. Raw Spread accounts offer spreads from 0.0 pips with a commission charge of USD $3.50 per 100k traded. Standard account offer spreads from 1 pips with no additional commission charges. Spreads on CFD indices start at 0.4 points. The information on this site is not directed at residents in any country or jurisdiction where such distribution or use would be contrary to local law or regulation.

OPEC+ and Global Supply Concerns

Oil prices have experienced a roughly 10% decline since OPEC+ announced voluntary output cuts of 2.2 million barrels per day. OPEC’s production in November also fell, driven by reduced shipments from Nigeria and Iraq, alongside sustained cuts by Saudi Arabia and others. High-level discussions between Russian and Saudi leaders further indicate ongoing efforts to stabilize oil prices.

China’s Influence on the Market

China’s market activities significantly impacted global oil dynamics. November saw China’s crude oil imports falling to a four-month low, driven by high inventory levels and weakening economic indicators. Moody’s recent downgrade warnings for several Chinese state-owned entities reflect broader economic concerns, influencing the global demand outlook.

Short-Term Market Outlook

Considering these factors, the short-term outlook for the oil market appears bearish. The contango market structure for Brent and WTI suggests less immediate concern about supply shortages. Additionally, the increase in U.S. gasoline inventories and China’s reduced oil import demand contribute to a cautious market sentiment, potentially leading to further price fluctuations.

Technical Analysis

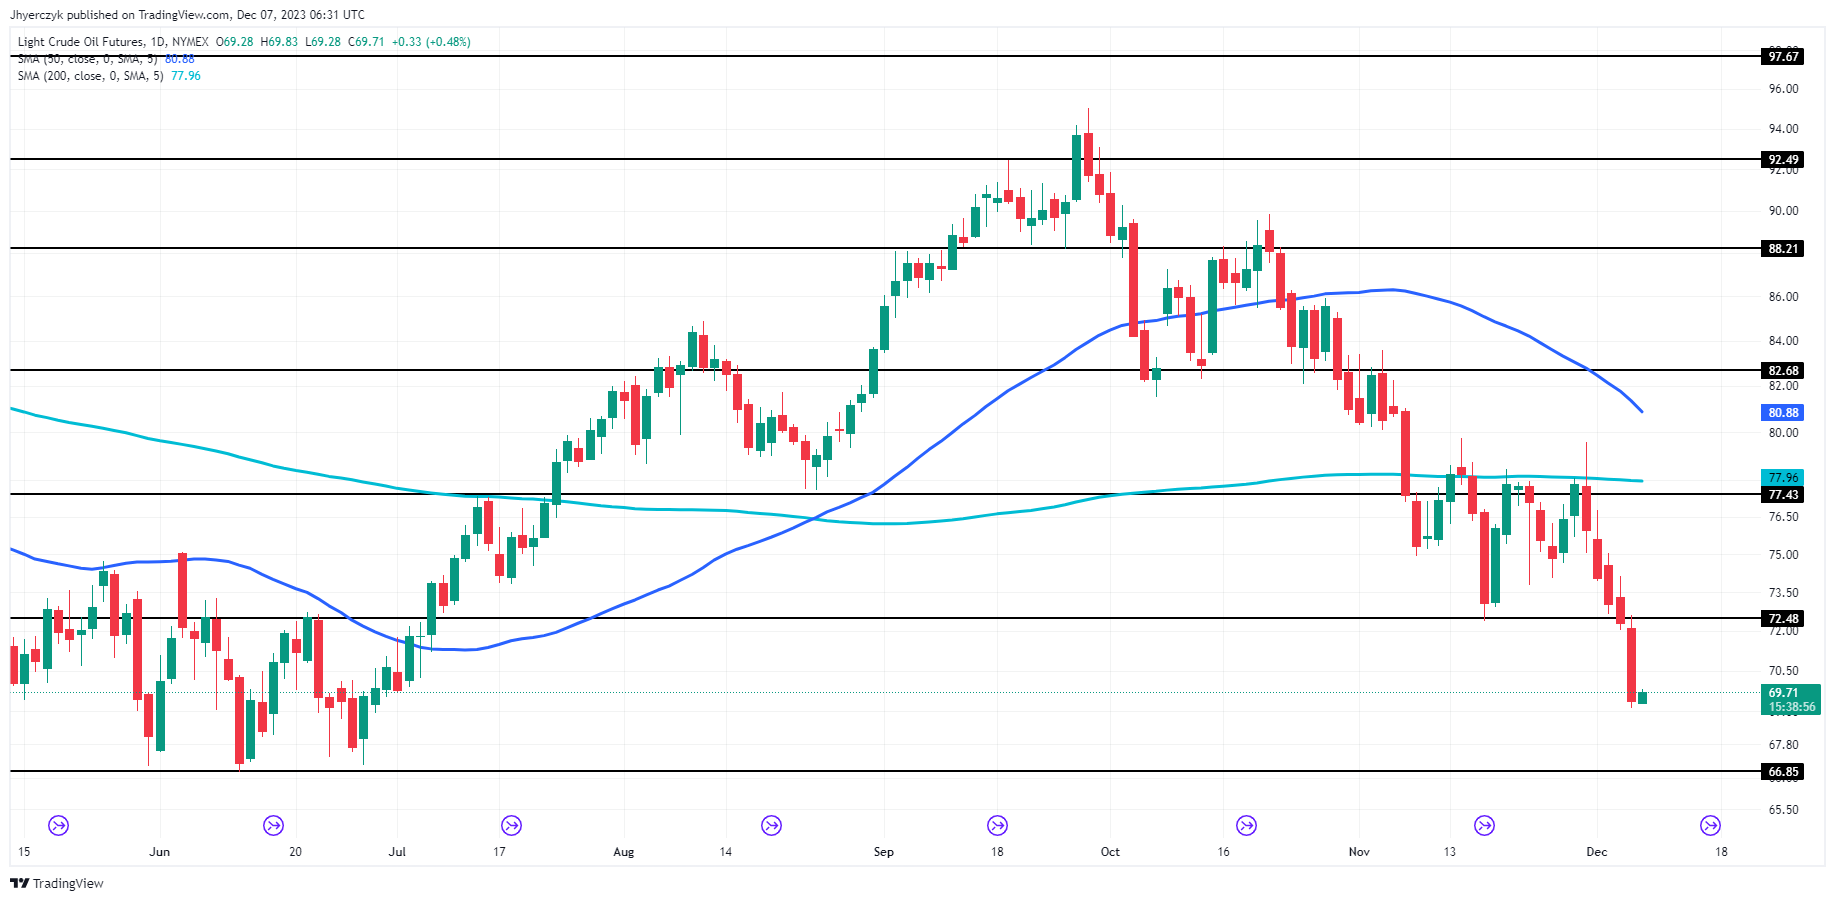
Daily Light Crude Oil FuturesThe current daily price of light crude oil futures at $69.68 shows a slight increase from the previous close of $69.38, suggesting modest upward momentum. However, this price is below both the 200-day moving average (MA) of $77.96 and the 50-day MA of $80.88, indicating a bearish trend in the longer term.

The current price is positioned between the minor support level of $66.85 and the minor resistance level of $72.48.

Considering these factors, the current market sentiment leans towards bearish, but with a possibility of short-term bullish movements if the price breaches the minor resistance level of $72.48. However, the current downside momentum suggests the most likely near-term target is $66.85.

AUD to USD Forecast: Australian Trade Surplus Widens on Export Rise

AUD to USD Forecast: Australian Trade Surplus Widens on Export Rise

Wednesday Overview of the AUD/USD

The AUD/USD declined by 0.05% on Wednesday. Following a 1.02% slide on Tuesday, the Aussie dollar ended the Tuesday session at $0.65484. The Australian dollar rose to a high of $0.65973 before falling to a low of $0.65462.

Australian Trade Surplus Widened in October

On Thursday, Australian trade data drew investor interest early in the session. The trade surplus widened from A$6.786 billion to A$7.129 billion in October. Economists forecast a trade surplus of A$7.500 billion. Significantly, exports increased by 0.4%, while imports declined by 1.9%.

Trading Derivatives carries a high level of risk to your capital and you should only trade with money you can afford to lose. Trading Derivatives may not be suitable for all investors, so please ensure that you fully understand the risks involved, and seek independent advice if necessary. A Product Disclosure Statement (PDS) can be obtained either from this website or on request from our offices and should be considered before entering into a transaction with us. Raw Spread accounts offer spreads from 0.0 pips with a commission charge of USD $3.50 per 100k traded. Standard account offer spreads from 1 pips with no additional commission charges. Spreads on CFD indices start at 0.4 points. The information on this site is not directed at residents in any country or jurisdiction where such distribution or use would be contrary to local law or regulation.

According to the ABS,

  • General merchandise exports increased by 0.1% while merchanting goods exports jumped by 22.5%.
  • Exports of non-monetary gold rose by 5.3%.
  • Imports of general merchandise declined by 2.6%.
  • However, non-monetary gold imports surged by 26.4%.

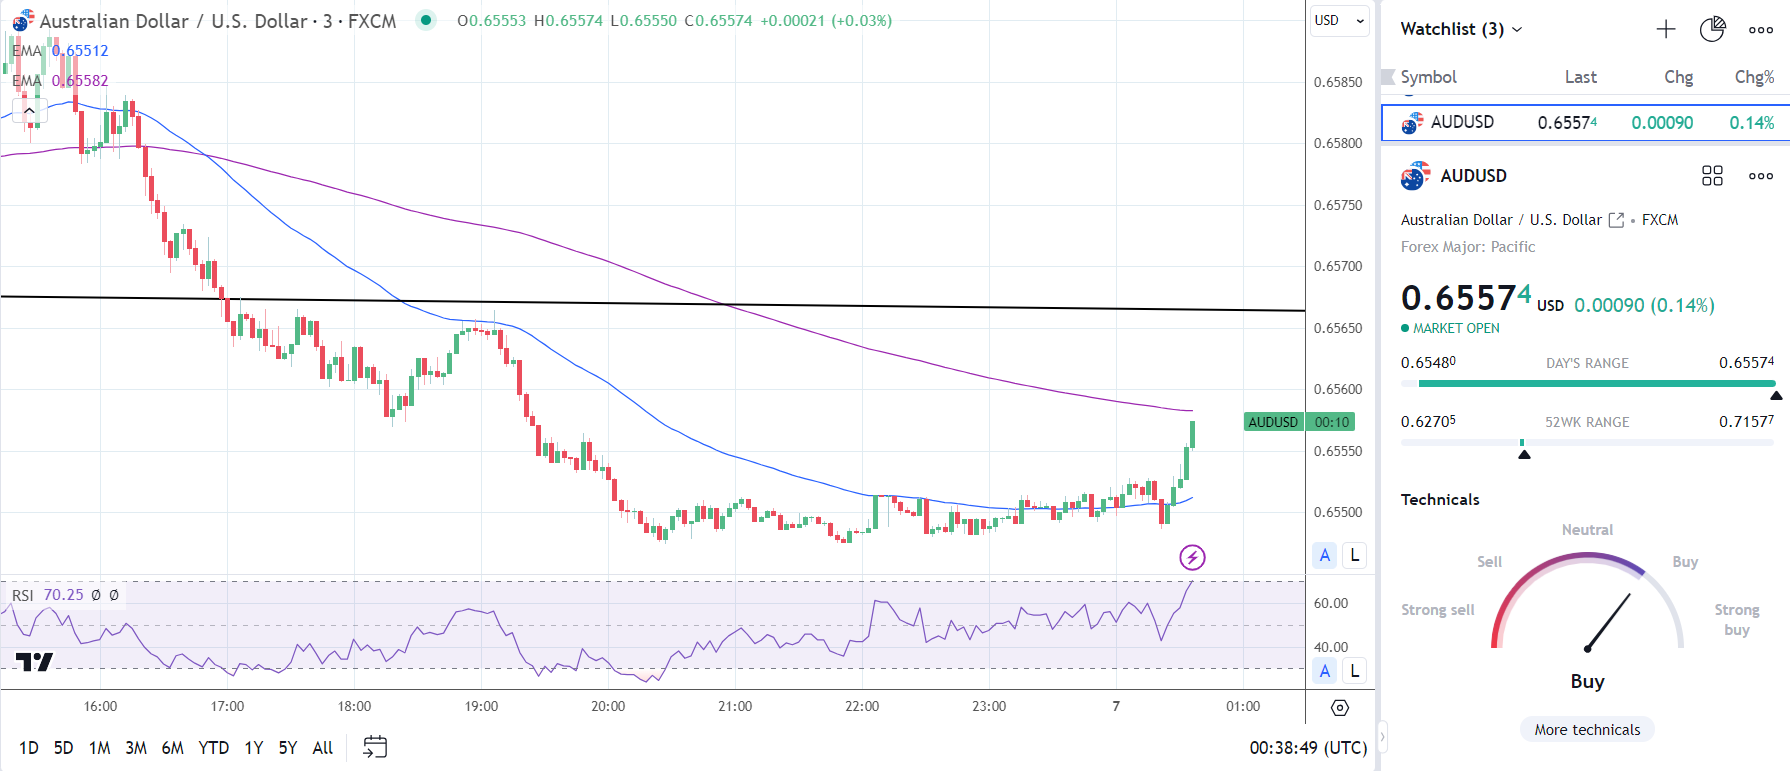
The Aussie dollar responded positively to the stats. After an initial dip to $0.65519, the AUD/USD rose to a post-stat high of $0.65574. However, the trade data is unlikely to ease bets on a December 2024 RBA rate cut.

AUD/USD reaction to trade data.
AUDUSD 071223 3 Minute Chart

China Trade Data in the Spotlight

On Thursday, trade data from China will garner investor interest. Better-than-expected trade terms would fuel buyer appetite for the Aussie dollar.

China accounts for one-third of Australian exports. Australia has a trade-to-pivot ratio above 50%. Improving trade terms for China would drive demand Australian goods, supporting the Australian economy and the Aussie dollar.

Economists forecast exports to decline by 1.1% year-over-year in November versus -6.4% in October. However, economists expect imports to rise by 3.3% vs. 3.0% in October. A less marked decline in exports and uptick in imports could signal an improving demand environment.

US Labor Market in the Spotlight

Later in the Thursday session, US labor market numbers also need consideration. US weekly jobless claims could influence bets on a Q1 2024 Fed rate cut.

Softer labor market conditions could impact wage growth and reduce disposable income. A downward trend in disposable income would affect consumer spending and dampen demand-driven inflation. A softer inflation outlook would allow the Fed to take a less hawkish Fed rate path.

Economists forecast initial jobless claims to increase from 218k to 222k in the week ending December 2.

Short-Term Forecast

In the near term, AUD/USD trends will hinge on the trade data from China and the US Jobs Report. A pickup in demand for Chinese goods and softer US wage growth would support an AUD/USD move toward $0.67.

AUD/USD Price Action

Daily Chart

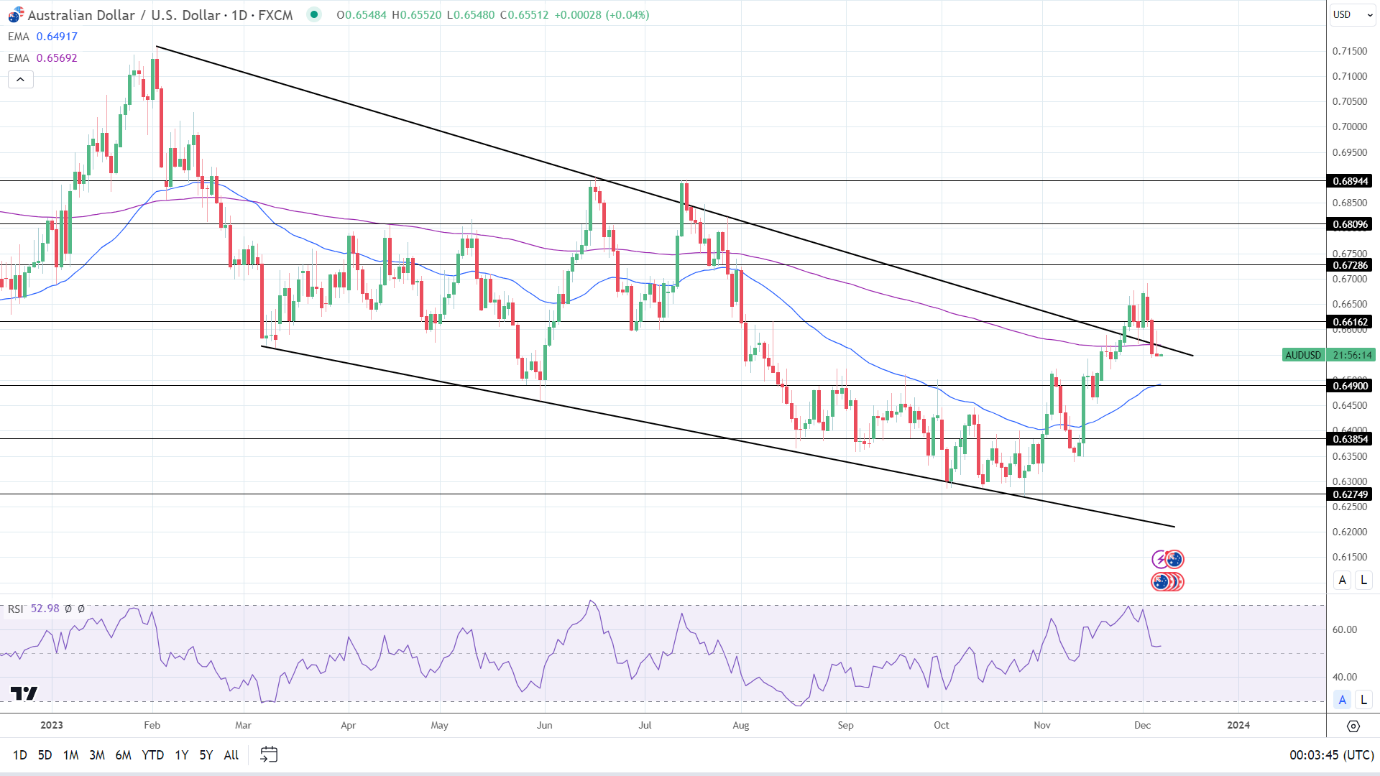
The AUD/USD remained below the 200-day EMA while sitting above the 50-day EMA, affirming bullish near-term but bearish longer-term price signals.

An AUD/USD move through the trend line and 200-day EMA would give the bulls a run at the $0.66162 resistance level. Selling pressure could intensify at $0.65700. The 200-day EMA is confluent with the trend line.

China trade data and the US labor market are focal points on Thursday.

However, a fall through the $0.65500 handle would support a move to the $0.64900 support level.

A 14-period Daily RSI reading of 52.98 indicates an AUD/USD return to the $0.66 handle before entering overbought territory (typically above 70 on the RSI scale).

AUD to USD Daily Chart sends bearish near-term price signals.
AUDUSD 071223 Daily Chart

4-Hourly Chart

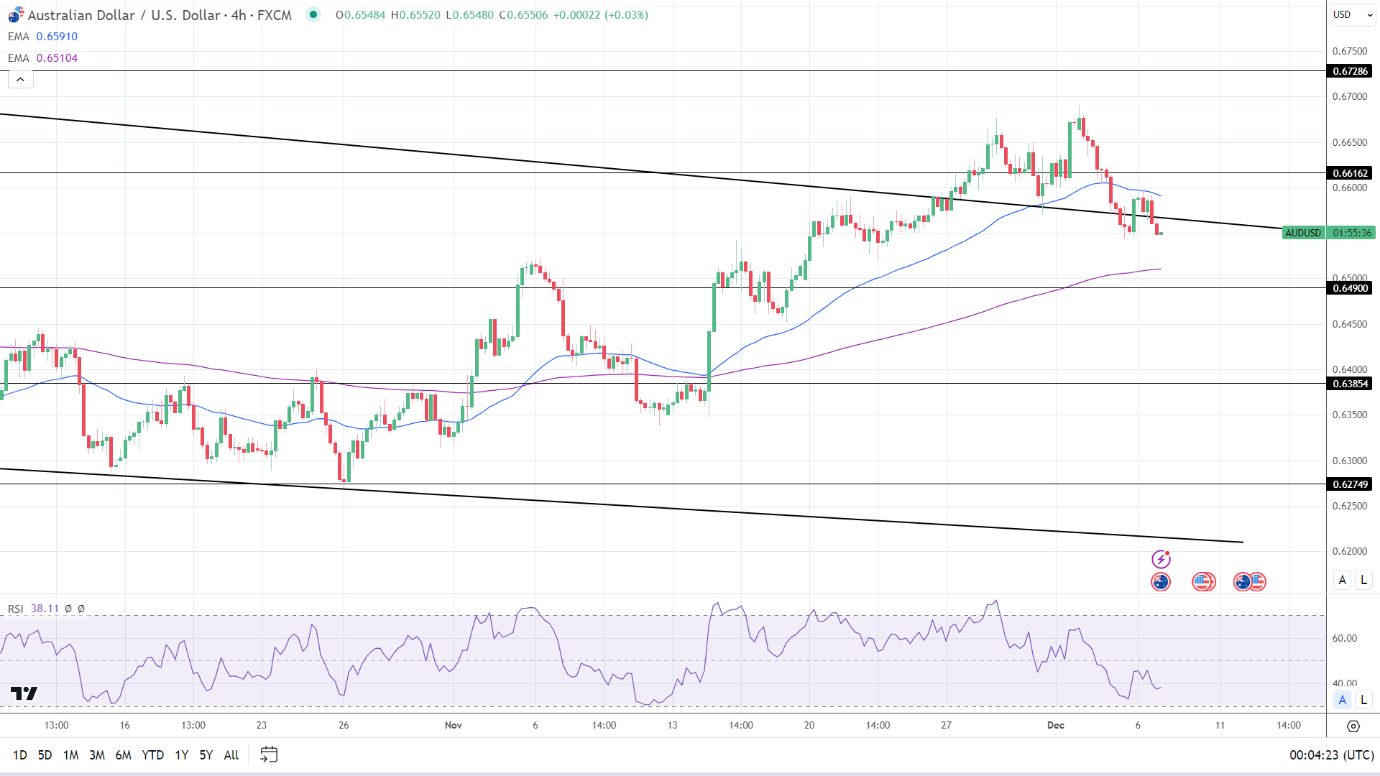
The AUD/USD remained below the 50-day while holding above the 200-day EMA, affirming bearish near-term but bullish longer-term price signals.

An AUD/USD move through the trend line would bring the 50-day EMA and the $0.66162 resistance level into play.

However, a fall through the $0.65500 handle would give the bears a run at the 200-day EMA and the $0.64900 support level.

The 14-period 4-Hourly RSI at 38.11 indicates an AUD/USD drop to the 200-day EMA before entering oversold territory.

4-Hourly Chart affirms bearish near-term price signals.
AUDUSD 071223 4-Hourly Chart
EUR/USD Forecast: German Industrial Production and Eurozone GDP Numbers in Focus

EUR/USD Forecast: German Industrial Production and Eurozone GDP Numbers in Focus

Wednesday Overview

The EUR/USD declined by 0.30% on Wednesday. Following a 0.37% loss on Tuesday, the EUR/USD ended the day at $1.07641. The EUR/USD rose to a high of $1.08047 before falling to a low of $1.07586.

German Industrial Production and Eurozone GDP Numbers in the Spotlight

On Thursday, German industrial production and Eurozone GDP numbers warrant investor attention. An upswing in industrial production could influence buyer appetite for the EUR/USD. The German manufacturing sector accounts for less than 30% of the German economy. Improving numbers would ease fears of a prolonged economic recession.

Trading Derivatives carries a high level of risk to your capital and you should only trade with money you can afford to lose. Trading Derivatives may not be suitable for all investors, so please ensure that you fully understand the risks involved, and seek independent advice if necessary. A Product Disclosure Statement (PDS) can be obtained either from this website or on request from our offices and should be considered before entering into a transaction with us. Raw Spread accounts offer spreads from 0.0 pips with a commission charge of USD $3.50 per 100k traded. Standard account offer spreads from 1 pips with no additional commission charges. Spreads on CFD indices start at 0.4 points. The information on this site is not directed at residents in any country or jurisdiction where such distribution or use would be contrary to local law or regulation.


Economists forecast industrial production to increase by 0.2% in October vs. a 1.4% decline in September.

However, Eurozone GDP numbers for Q3 will have more impact. An upward revision to Q3 GDP numbers could support bets on a higher-for-longer ECB rate path. According to second estimate figures, the Eurozone economy contracted by 0.1% in Q3. Aside from the headline numbers, private consumption and services need consideration.

Beyond the numbers, ECB commentary will move the dial. ECB President Christine Lagarde is on the calendar to speak.

US Jobless Claims in the Spotlight

On Thursday, US jobless claims will garner investor interest. We expect increased market sensitivity to the weekly report as investors consider the US Jobs Report (Fri). A larger-than-expected rise in jobless claims would support Q1 2024 Fed rate cut bets.

Weaker labor market conditions could impact wage growth and disposable income. A downward trend in disposable income would affect consumer spending and dampen demand-driven inflation. A softer inflation outlook would support a less hawkish Fed rate path.

Economists forecast initial jobless claims to increase from 218k to 222k in the week ending December 2.

Short-Term Forecast:

EUR/USD near-term trends hinge on the US Jobs Report (Fri) and central bank forward guidance. Weaker US wage growth would lead to expectations of a more dovish stance from the Fed, affecting demand for the US dollar.

EUR/USD Price Action

Daily Chart

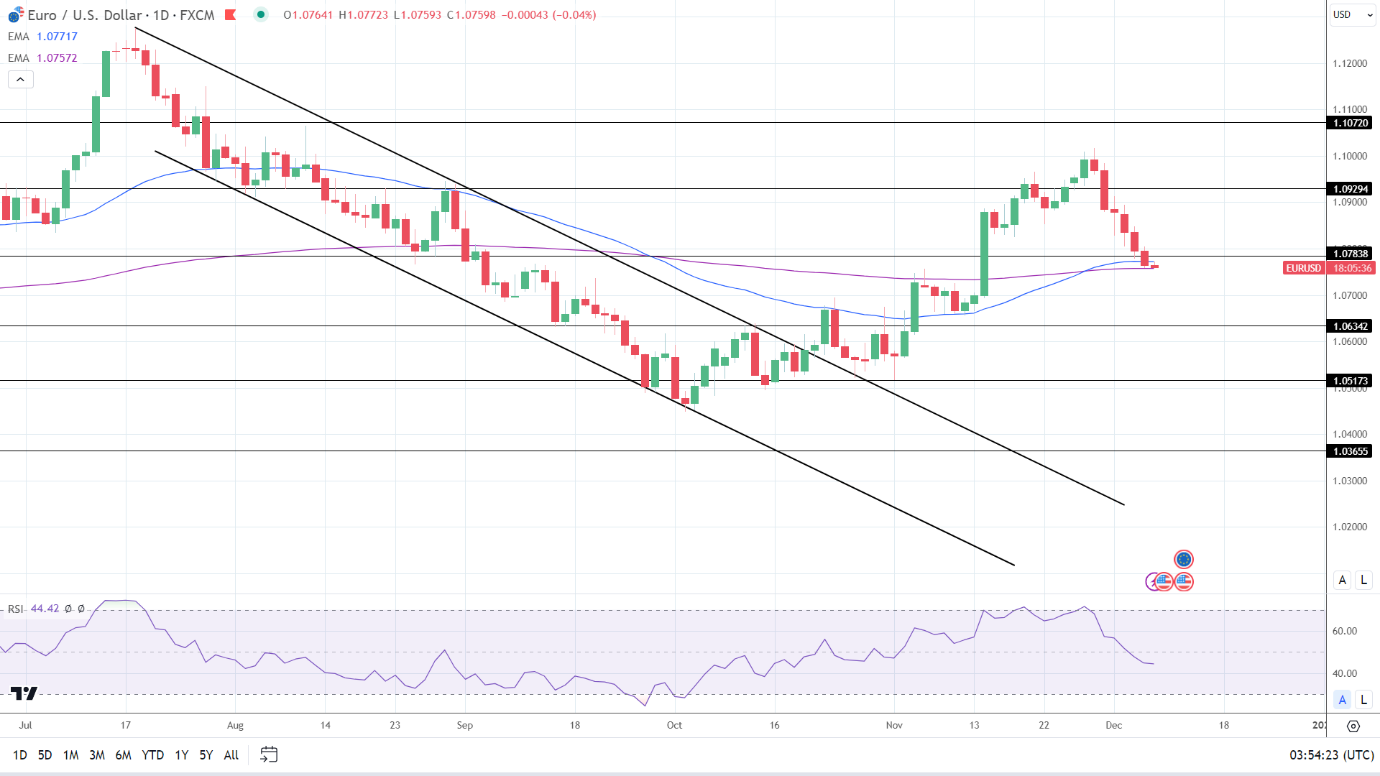
The EUR/USD sat below the 50-day EMA while holding above the 200-day EMA, sending bearish near-term but bullish longer-term price signals.

A EUR/USD break above the 50-day EMA and $1.07838 resistance level would support a move toward the $1.09294 resistance level.

German and Eurozone economic indicators, ECB commentary, and US jobless claims will influence buyer demand.

However, a EUR/USD break below the 200-day EMA would bring the $1.06342 support level into view.

The 14-period Daily RSI, 44.42, indicates a EUR/USD fall to $1.07000 before entering oversold territory.

EUR/USD Daily Chart sends mixed signals.

EURUSD 071223 Daily Chart

4-Hour Chart

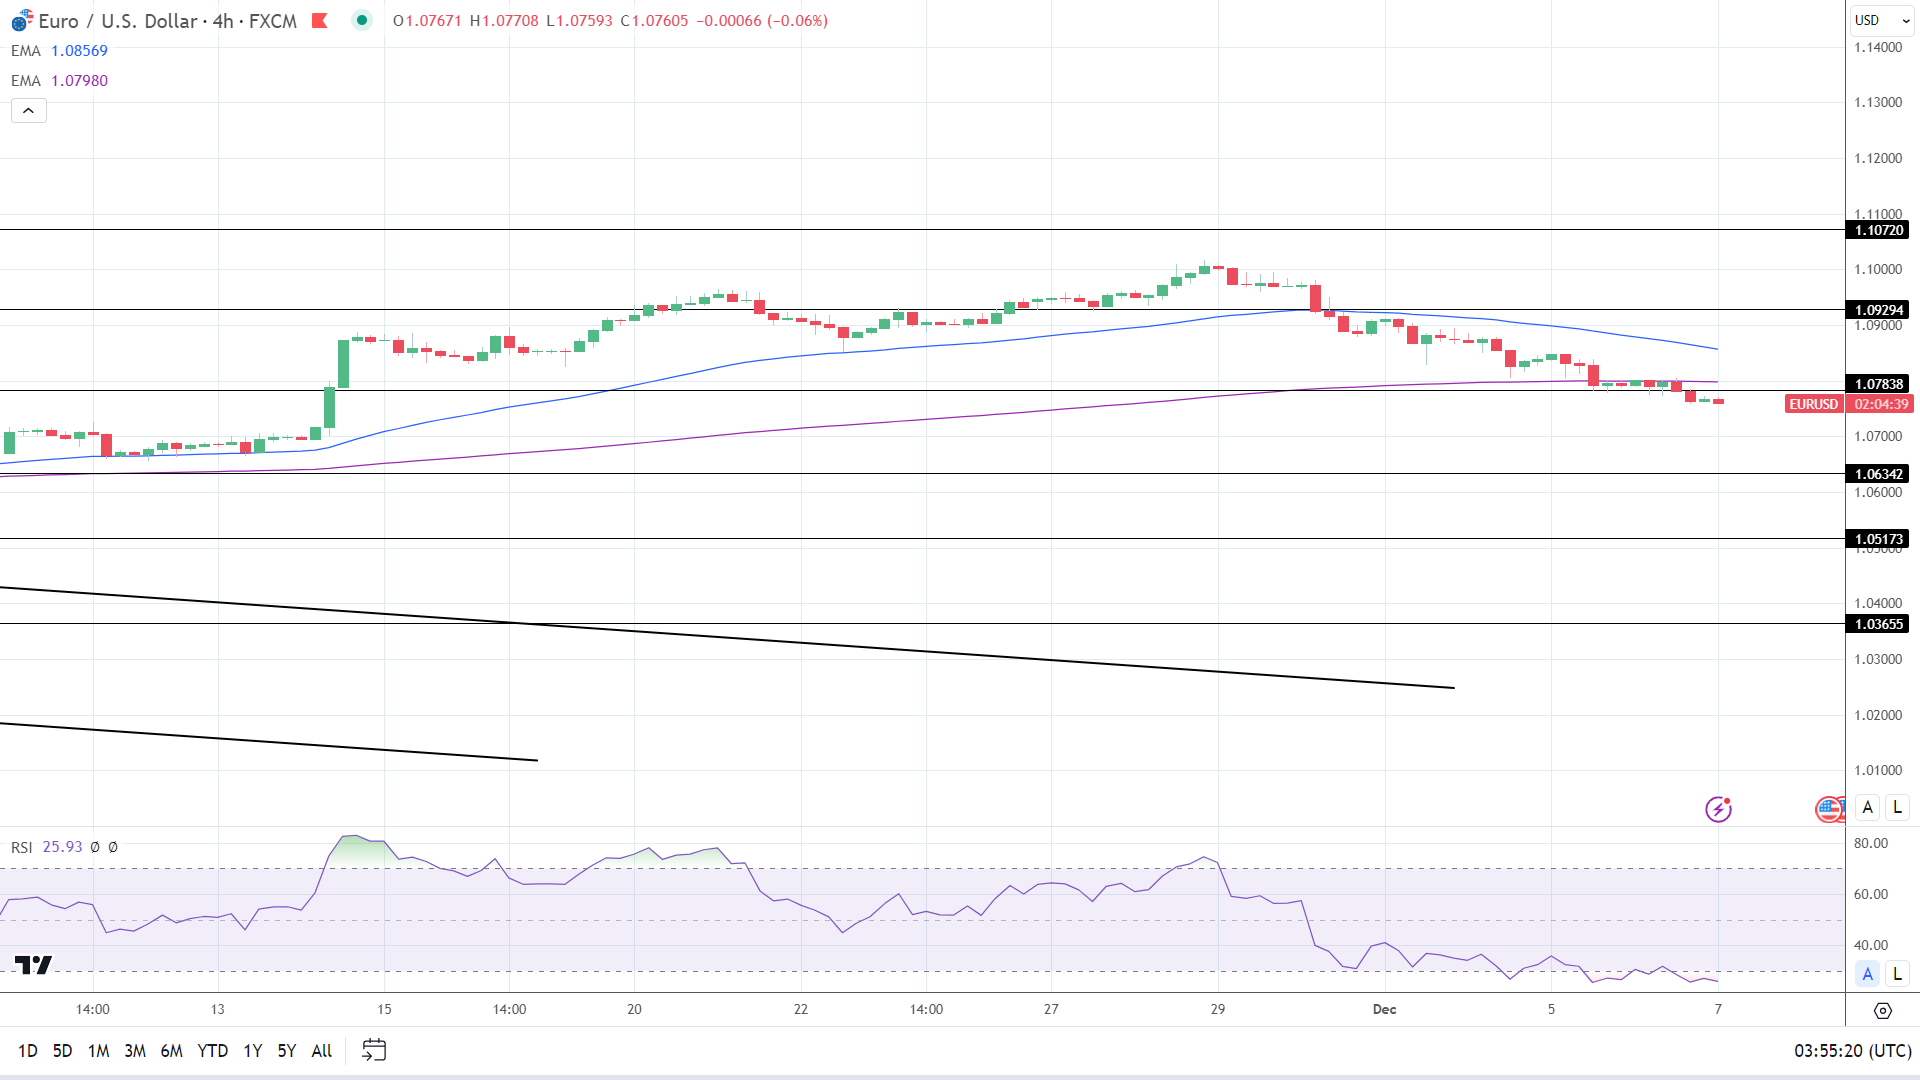
The EUR/USD sat below the 50-day and 200-day EMAs, sending bearish price signals.

A EUR/USD break above the $1.07838 resistance level and 200-day EMA would bring the 50-day EMA into play.

However, a EUR/USD drop below the $1.07500 handle would bring the $1.06342 support levels into play.

The 14-period RSI on the 4-hour chart, 25.93, shows the EUR/USD in oversold territory. Buying pressure may intensify at the $1.07500 handle.

4-Hourly Chart EMAs send bearish price signals.
EURUSD 071223 4 Hourly Chart
XRP News: Optimism Toward the SEC v Ripple Case Resurfaces

XRP News: Optimism Toward the SEC v Ripple Case Resurfaces

The Wednesday Overview

On Wednesday, XRP rallied 3.11%. After a 0.48% decline on Tuesday, XRP ended the session at $0.6405. In contrast, the total crypto market cap declined by 0.82% to $1,554 billion.

Optimism Toward the SEC v Ripple Case Sends XRP to $0.64

There were no SEC v Ripple case-related for investors to consider on Wednesday. However, the SEC and Ripple are progressing through remedies-related discovery. Investor hopes for a favorable settlement fueled buyer demand on Wednesday.

Trading Derivatives carries a high level of risk to your capital and you should only trade with money you can afford to lose. Trading Derivatives may not be suitable for all investors, so please ensure that you fully understand the risks involved, and seek independent advice if necessary. A Product Disclosure Statement (PDS) can be obtained either from this website or on request from our offices and should be considered before entering into a transaction with us. Raw Spread accounts offer spreads from 0.0 pips with a commission charge of USD $3.50 per 100k traded. Standard account offer spreads from 1 pips with no additional commission charges. Spreads on CFD indices start at 0.4 points. The information on this site is not directed at residents in any country or jurisdiction where such distribution or use would be contrary to local law or regulation.

The SEC will attempt to scoop up the $770 million from XRP sales to institutional investors. However, case law suggests a significantly lower penalty.

  • Morrison v NAB: The US Supreme Court ruled the SEC only has jurisdiction over US-based sales. During remedies-related discovery, XRP will demonstrate the amount of XRP sales to US institutional investors.
  • Liu v SEC: The court ruled a disgorgement amount must not exceed the net profits and must go to the victims. Ripple will deduct expenses associated with the sale of XRP to US institutional investors to derive net profits.
  • SEC v Govil: The court ruled the SEC cannot demand a punitive disgorgement without demonstrating the financial impact of the XRP sales on investors. If the price of XRP is higher than at the time of sales to institutional investors, there was no harm to investors. Ripple will look to demonstrate the uptrend in the price of XRP before, during, and after the sale of XRP to institutional investors.

With case law on the side of the Defendant, the SEC could settle before the conclusion of discovery. A favorable settlement would be a boon for XRP and the crypto market. However, XRP could face another period of uncertainty.

The SEC will likely appeal the court ruling on the Programmatic Sales of XRP. Significantly, the appeal process would likely extend into 2025, possibly leaving XRP in limbo for another year.

However, the outcome of the SEC v Coinbase (COIN) case could alter the SEC’s plans to appeal against the ruling.

SEC v Coinbase: The Coinbase Motion to Dismiss Ruling

On January 17, 2024, the SEC and Coinbase will deliver oral arguments regarding the Coinbase motion to dismiss (MTD). Coinbase argues the SEC lacks the statutory authority to regulate crypto exchanges. If Judge Katherine Failla grants the MTD, the SEC would lose its bid to classify cryptos traded on exchange as securities.

The outcome of the SEC v Coinbase case could significantly impact the US crypto market. Another SEC loss may incentivize US lawmakers to roll out a US crypto regulatory framework favoring innovation while protecting investors.

XRP Price Action

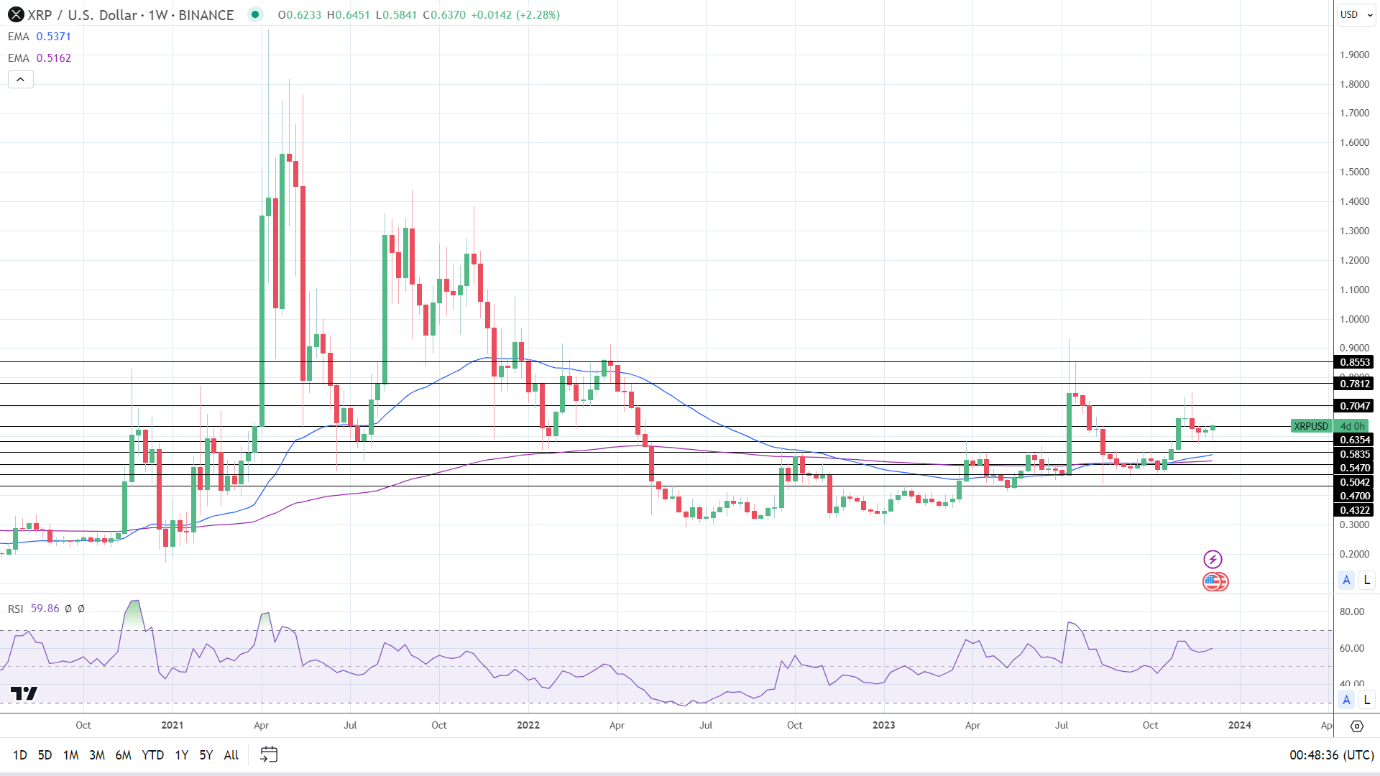
Weekly Chart sends bullish price signals.
XRPUSD 071223 Weekly Chart

Daily Chart

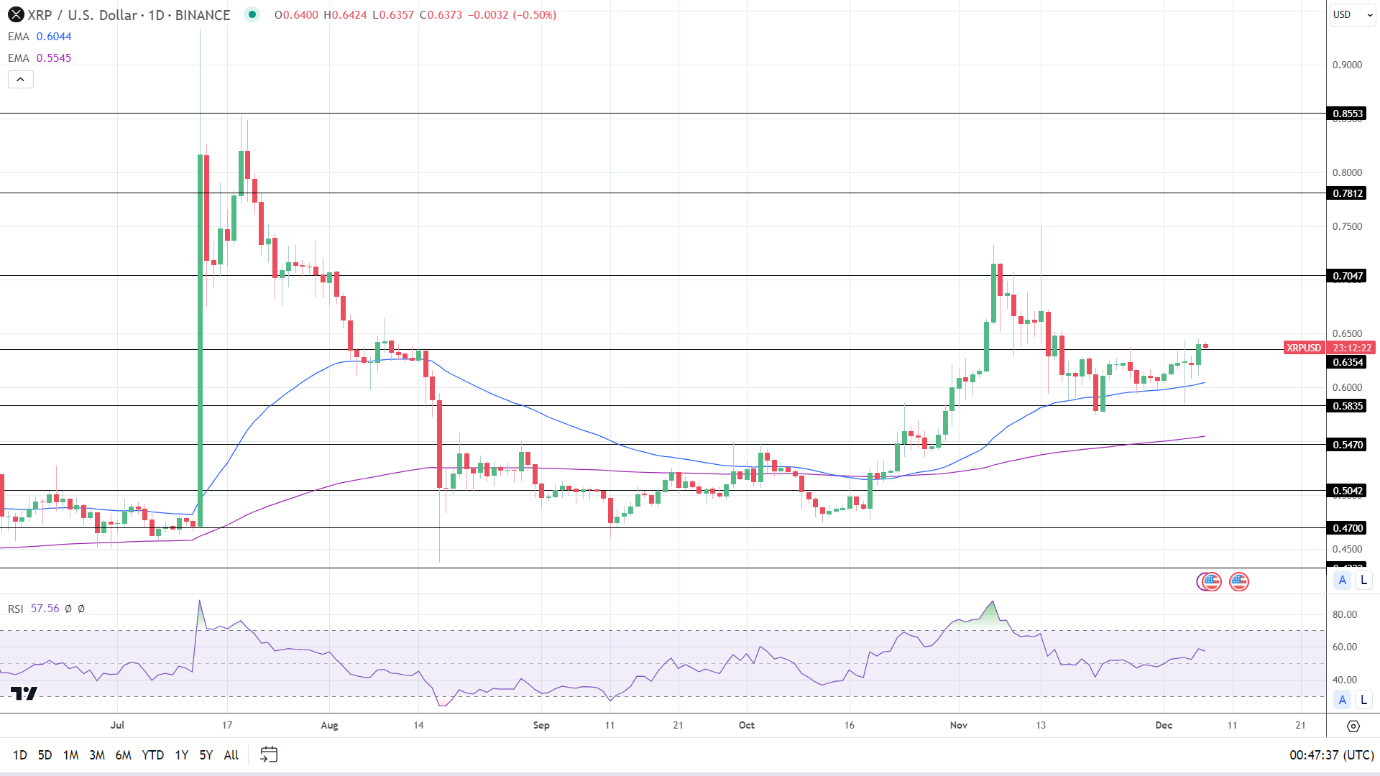
XRP held above the 50-day and 200-day EMAs, affirming bullish price signals.

An XRP return to $0.65 would support a move toward the $0.7047 resistance level.

SEC v Coinbase and Ripple case-related news are the focal points on Thursday.

However, a fall through the $0.6354 support level would give the bears a run at the 50-day EMA. A break below the 50-day EMA would bring the $0.5835 support level into view.

The 14-day RSI reading of 57.56 suggests an XRP move through the $0.65 handle before entering overbought territory.
XRP Daily Chart affirms bullish price signals.
XRPUSD 071223 Daily Chart

4-Hourly Chart

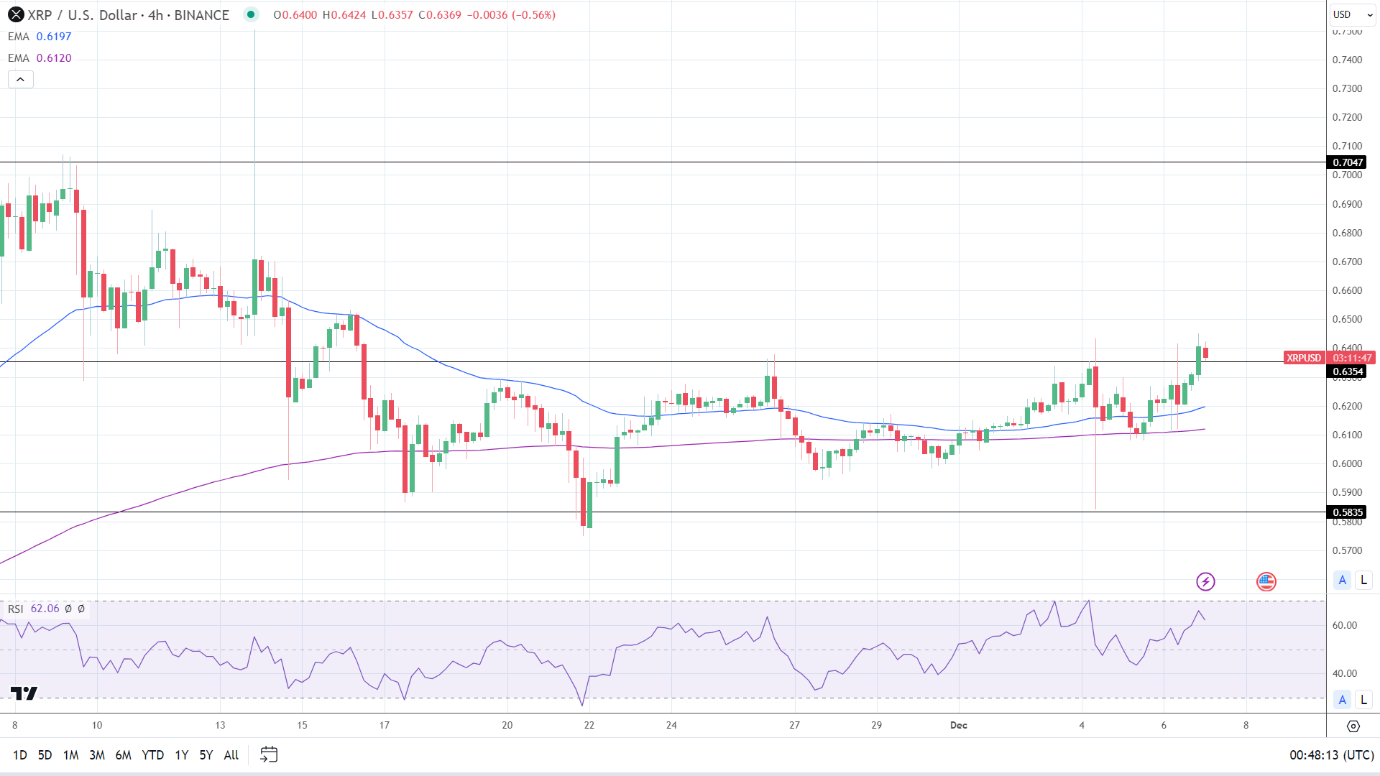
On the 4-hourly, XRP held above the 50-day and 200-day EMAs, reaffirming bullish price signals.

A move to $0.65 would bring the $0.7047 resistance level into view.

However, a break below the $0.6354 support level would bring the 50-day and 200-day EMAs into play.

The 4-hourly RSI, with a reading of 62.06, suggests a return to the $0.65 handle before entering overbought territory.

XRP 4-Hourly Chart reaffirms bullish price signals.
XRPUSD 071223 4-Hourly Chart
Hang Seng Index, ASX 200, Nikkei 225: China Trade in the Spotlight

Hang Seng Index, ASX 200, Nikkei 225: China Trade in the Spotlight

Overview of the Wednesday Session

On Wednesday, the Asian equity markets found a firmer footing. The Nikkei 225 led the Hang Seng Index and the ASX200 into positive territory.
A larger-than-expected fall in US job openings raised bets on a Q1 2024 Fed rate cut. JOLTS Job Openings fell from 9.350 million to 8.733 million in October. However, a pickup in US service sector activity drove expectations of a US soft landing. The ISM Non-Manufacturing Index increased from 51.8 to 52.7 in November.

Trading Derivatives carries a high level of risk to your capital and you should only trade with money you can afford to lose. Trading Derivatives may not be suitable for all investors, so please ensure that you fully understand the risks involved, and seek independent advice if necessary. A Product Disclosure Statement (PDS) can be obtained either from this website or on request from our offices and should be considered before entering into a transaction with us. Raw Spread accounts offer spreads from 0.0 pips with a commission charge of USD $3.50 per 100k traded. Standard account offer spreads from 1 pips with no additional commission charges. Spreads on CFD indices start at 0.4 points. The information on this site is not directed at residents in any country or jurisdiction where such distribution or use would be contrary to local law or regulation.

On Tuesday, the Nasdaq Composite Index ended the session up 0.31%. A 2.11% fall in 10-year US Treasury yields supported tech stocks. However, the Dow and the S&P 500 fell by 0.22% and 0.06%, respectively.

The Asian economic calendar and ratings news failed to affect the appetite for riskier assets. In the third quarter, the Australian economy expanded by just 0.2% vs. 0.4% in the previous quarter.

On Thursday, Moody’s affirmed China’s A1 rating but downgraded the outlook from stable to negative.

However, 10-year JGB yields pulled back, driving demand for Nikkei-listed stocks.

ADP Labor Market Stats and Yields to Set the Tone

US economic indicators from Wednesday will set the tone for the Thursday Asian session. The ADP reported a 103k increase in employment in November after a 113k rise in October. US Treasury yields reflected the rising bets on a Q1 2024 Fed rate cut. However, the US equity markets ended the session in negative territory.

10-year US Treasury yields declined by 1.46% to 4.106%. The Nasdaq Composite Index declined by 0.56%, with the Dow and S&P 500 falling by 0.19% and 0.39%, respectively.

China Trade Data to Influence Market Risk Sentiment

On Thursday, the Asian economic calendar also warrants consideration. Trade data from Australia will draw investor interest early in the session. Better trade terms could signal an improving demand environment. Economists forecast the Australian trade surplus to widen from A$6.786 billion to A$7.500 billion in October.

However, trade data from China will be the focal point. A pickup in exports could support demand for riskier assets. Economists forecast exports to decline by 0.8% year-over-year in November. Exports were down 6.4% in October. Imports also need consideration, with an unexpected fall in imports likely to signal a weakening demand outlook.

Beyond the economic calendar, stimulus chatter from Beijing and government bond yields will also influence.

ASX 200

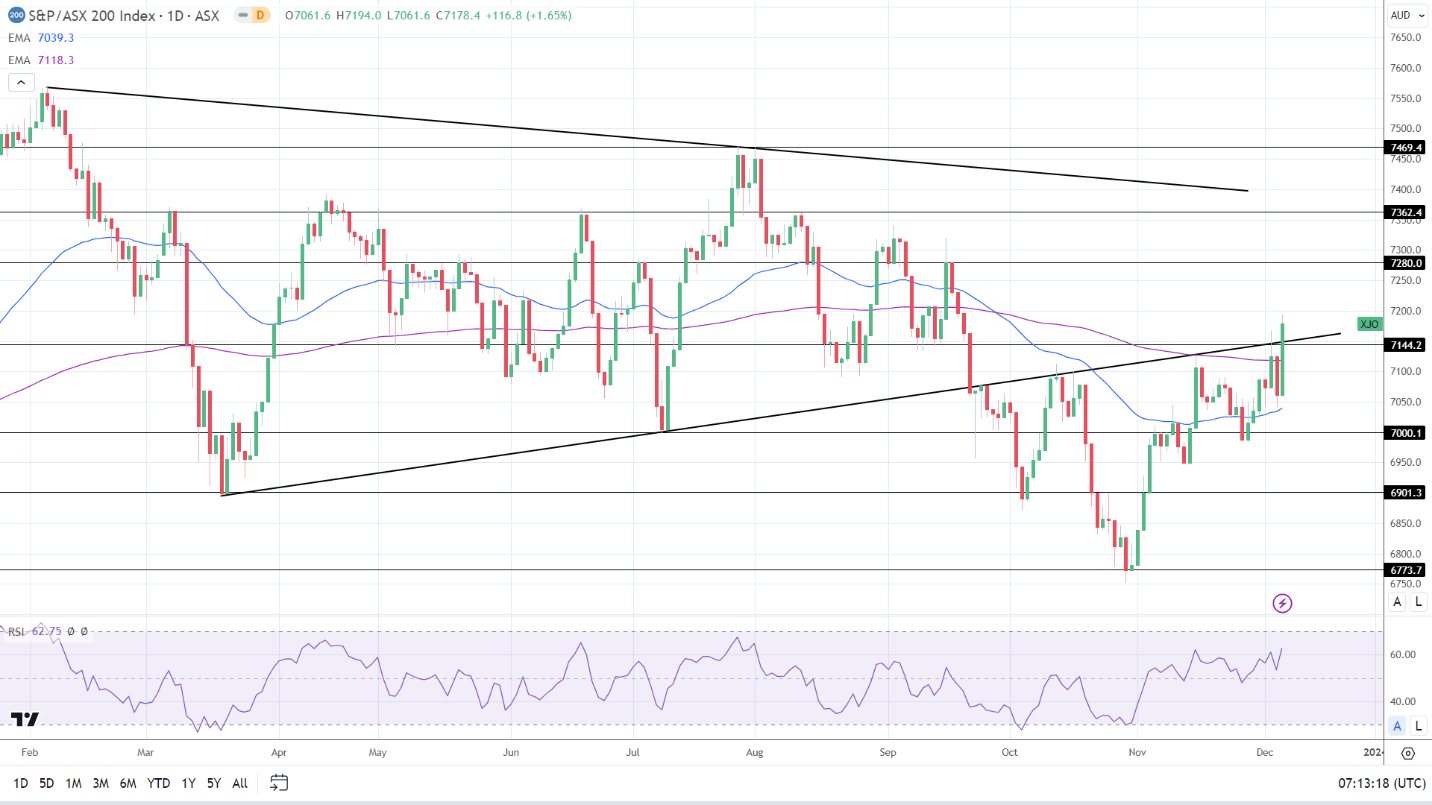
ASX 200 rallied on Wednesday.
ASX200 071223 Daily ChartThe ASX 200 rallied 1.65% on Wednesday. Bets on a December 2024 RBA rate cut drove demand for tech, mining, and bank stocks. The S&P ASX All Technology Index (XTX) gained 1.67%.

Mining stocks had a positive session. BHP Group Ltd (BHP) and Rio Tinto Ltd. (RIO) gained 1.53% and 0.68% on higher iron ore prices. Fortescue Metals Group Ltd. (FMG) ended the day up 0.04%.

Bank stocks made solid gains. National Australia Bank Ltd. (NAB) and Westpac Banking Corp. (WBC) rallied 1.91% and 1.73%. Commonwealth Bank of Australia (CBA) and ANZ Group Holdings Ltd (ANZ) rose by 1.56% and 1.27%.

Energy stocks had a mixed session. Woodside Energy Group Ltd (WDS) gained 1.05%, while Santos Ltd (STO) ended the session flat.

A pickup in spot Gold (XAU/USD) supported Northern Star Resources Ltd. (NST), which rose by 1.05%. However, Evolution Mining Ltd. (EVN) tumbled by 13.04%. The company issued 138.2 million new shares at an 8.2% discounted price of $3.80. Evolution Mining Ltd. will use the funds to acquire an 80% stake in the Northparkes Copper-Gold Mine.

Hang Seng Index

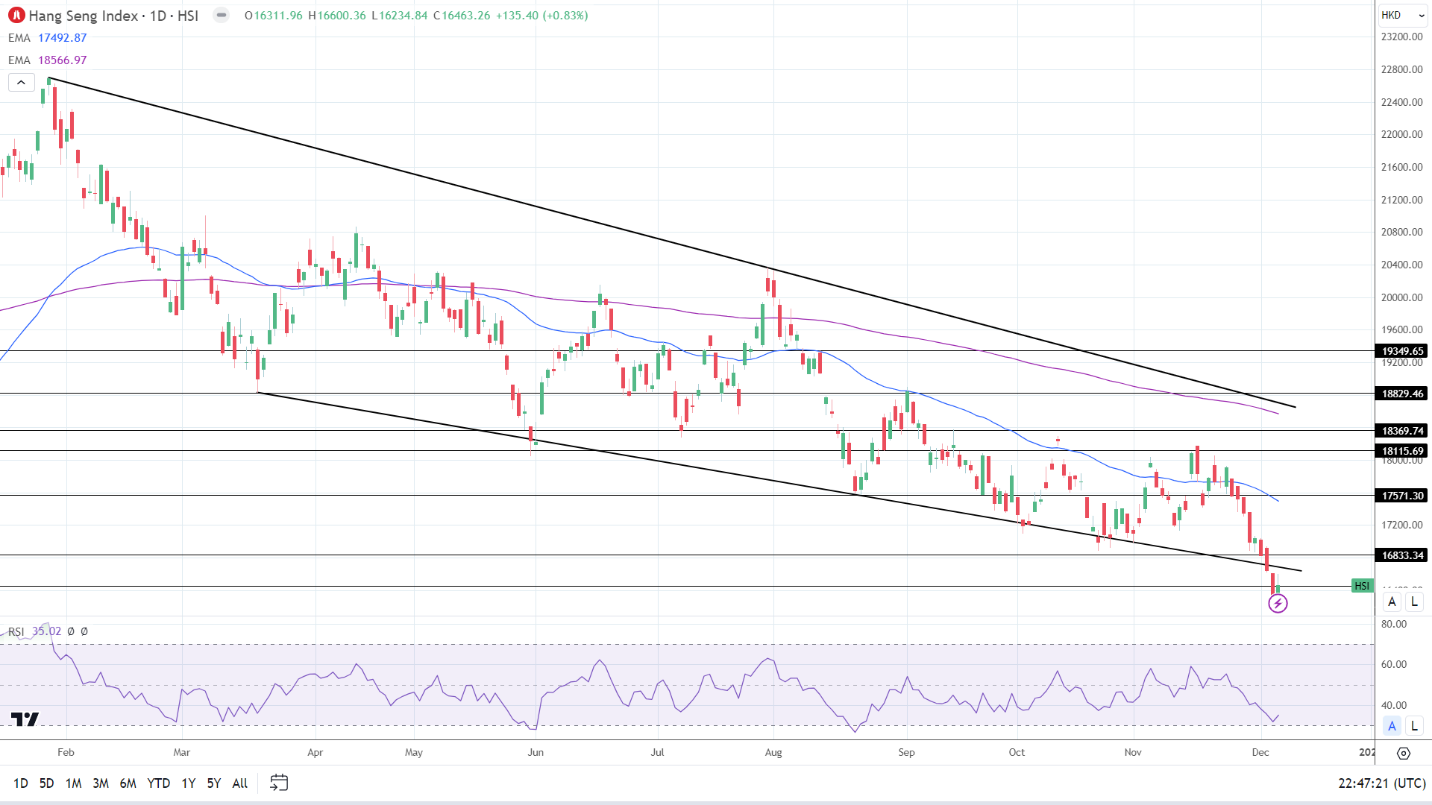
Hang Seng Index trailed the front runners.
HSI 071223 Daily ChartThe Hang Seng Index rose by 0.83% on Wednesday. However, the gains were more modest, with Moody’s rating action capping the upside.

Alibaba (9988) declined by 0.50%, while Tencent (0700) rose by 0.91%.

However, bank stocks had a positive session. HSBC (0005) increased by 0.59%. China Construction Bank (0939) and Industrial and Commercial Bank (1398) ended the day with gains of 0.45% and 0.28%, respectively.

The Nikkei 225

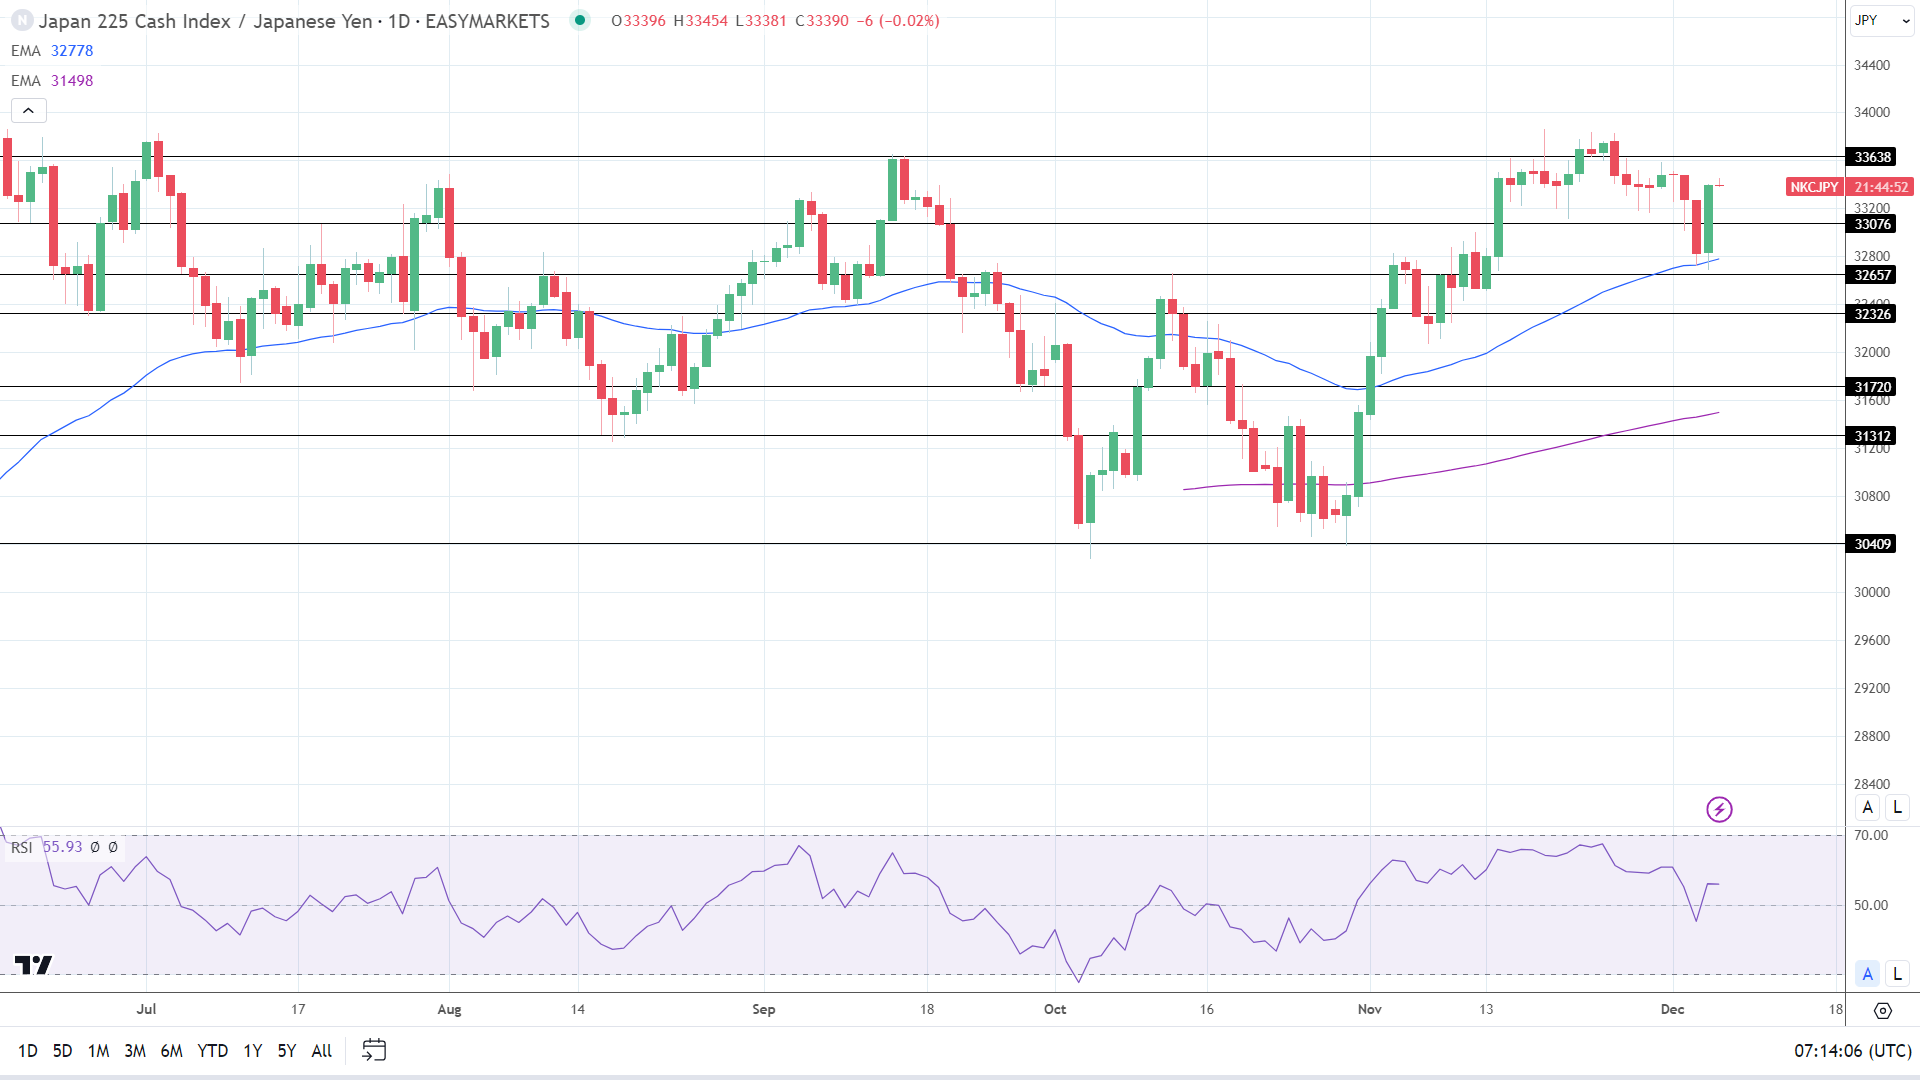
Nikkei had a breakout Wednesday session.
Nikkei 071223 Daily Chart(Graph for reference purposes only)

The Nikkei 225 rallied 2.04% on Wednesday.

Bank stocks found much-needed support. Sumitomo Mitsui Financial Group Inc. (8316) and Mitsubishi UFJ Financial Group Inc. (8306) gained 0.69% and 0.61%. It was also a positive session for the main components of the Nikkei.

Sony Group Corp. (6758) rallied 3.96%. Tokyo Electron Ltd. (8035) and Fast Retailing Co. Ltd. (9983) ended the session up 2.20% and 2.01%. Softbank Group Corp. (9948) and KDDI Corp. (9433) increased by 0.61% and 1.48%, respectively.

China Trade Data Signals a Weaker Demand Outlook

China Trade Data Signals a Weaker Demand Outlook

China Trade Data Delivered Mixed Signals

China’s US dollar trade surplus widened from $56.53 billion to $68.39 billion in November. Exports unexpectedly increased by 0.5% year-over-year. Economists forecast exports to decline by 1.1%. In October, exports were down 6.4%. However, imports fell by 0.6% after increasing by 3.0% in October. Economists forecast imports to rise by 3.3% in November.

While the pickup in exports signaled improving trade terms in November, import numbers disappointed. A marked reverse in imports suggested a sluggish demand outlook.

Australian trade data from earlier in the session delivered a similar demand layout. Falling imports countered rising exports, also suggesting a weaker demand outlook.

AUD/USD Reaction to the Trade Data

Before the trade data from China, the AUD/USD rose to a high of $0.65586 before falling to a low of $0.65318.

However, in response to the trade data, the AUD/USD climbed to a high of $0.65368 before dipping to a low of $0.65335.

On Thursday, the AUD/USD was down 0.22% to $0.65339.

AUD/USD falls on China trade numbers for November.
071223 AUDUSD 3 Minute Chart

German Industrial Production to Influence Demand Outlook Sentiment

Later today, German industrial production and Eurozone GDP numbers need investor consideration. Improving production figures could ease concerns about the demand outlook.

Economists forecast industrial production to increase by 0.2% in October after falling 1.4% in September.

However, a larger-than-expected contraction in the Eurozone economy could sour the mood before the US session. According to second estimate numbers, the Eurozone economy contracted by 0.1% in Q3.

US Labor Market Stats to Drive Q2 2024 Fed Rate Cut Bets

The US labor market will be in focus again on Thursday. US jobless claims warrant investor attention. After weaker-than-expected ADP employment numbers, a spike in jobless claims would drive bets on a Q1 2024 Fed rate cut.

Economists forecast initial jobless claims to increase from 218k to 222k in the week ending December 2.

Crude Oil Forecast: Prices in Freefall as Pivotal Technical Support Caves In

Crude Oil Forecast: Prices in Freefall as Pivotal Technical Support Caves In

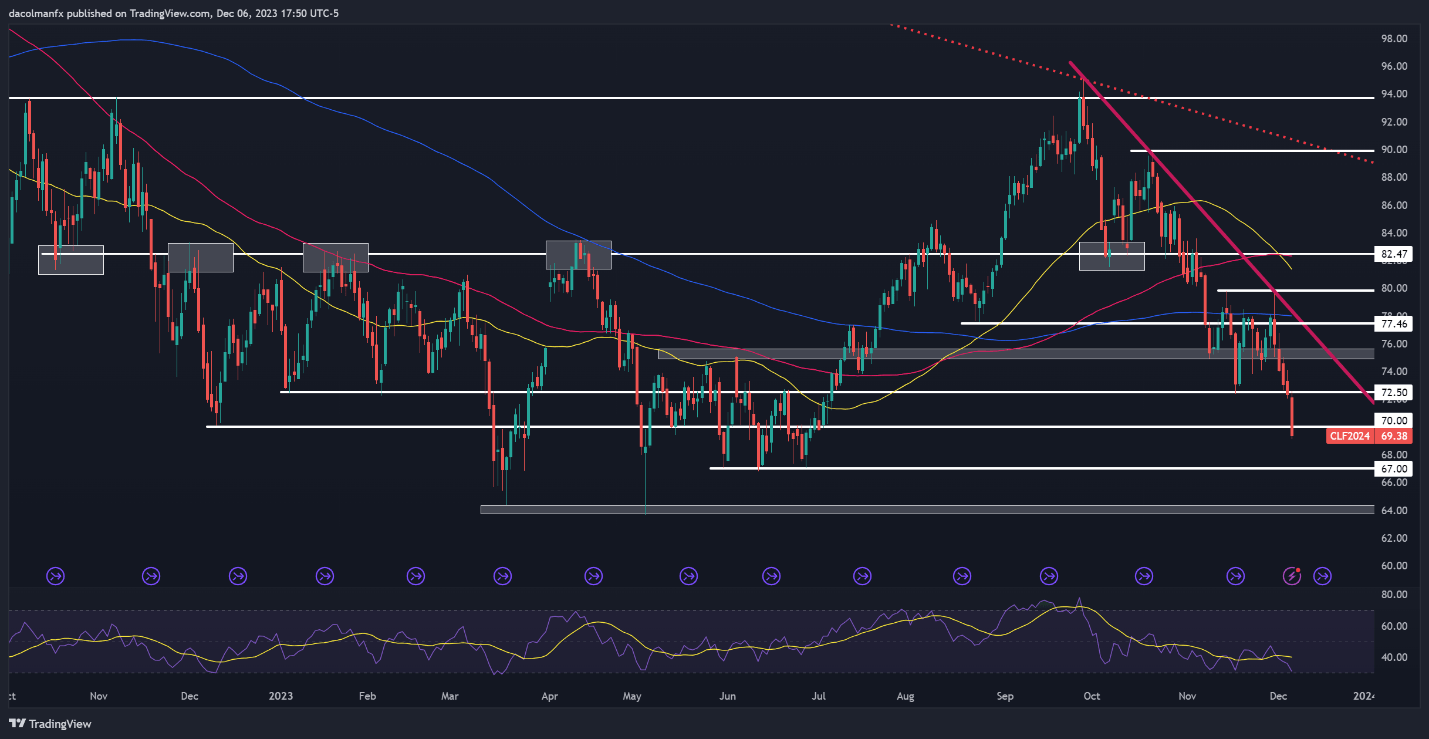
Crude oil prices, as measured by WTI futures, plummeted on Wednesday, falling for the fourth straight session and reaching the lowest level since late June. Factoring in today’s precipitous decline (about 4%), WTI has lost nearly 9% of its value in December and has broken below the psychological $70.00 level, a bearish development from a technical standpoint.

The recent selloff in energy markets hasn’t been driven by a singular catalyst but rather a convergence of multiple factors. First off, investors have been dismayed by OPEC+ supply cuts announced in late November because they will be voluntary rather than mandatory, which can potentially enable members to circumvent individually committed reductions.

Disappointing growth in China, coupled with record U.S. crude production at a time of slowing economic activity, has also created a hostile environment for the commodity. The uptick in U.S. fuel stockpiles beyond the seasonal norm in recent weeks has strengthened the belief that demand destruction is taking place, further weighing on sentiment.

Eager to gain a better understanding of where the oil market is headed? Download our quarterly trading forecast for enlightening insights!

Speculative activity by over-leveraged CTAs, which tend to be trend followers, has reinforced oil’s weakness, bolstering volatility and exacerbating prevailing directional moves. With CTAs becoming increasingly dominant, their influence on markets will continue to grow, giving way to more and more episodes of rapid and significant price swings.

Focusing on the outlook, oil’s path will likely hinge on the health of the U.S. economy. That said, if incoming information validates the view that a recession might emerge soon, prices could remain depressed and even head lower, with the next bearish zone of interest at $67.00. Subsequent losses could draw attention to March and May’s swing lows near $64.00.

In the event of a bullish turnaround, a possibility worth considering given some of the disconnects between physical and paper markets, initial resistance lies around $70.00. A successful breach and price consolidation above this threshold might rekindle buying interest, setting the stage for a rally towards $72.50. Further upside progress would shift the focus to the $75.00 mark.

Start your voyage to becoming a knowledgeable oil trader today. Don’t let the occasion to acquire vital insights and strategies pass you by – obtain your ‘How to Trade Oil’ guide immediately!

CRUDE OIL PRICES (WTI FUTURES) TECHNICAL CHART

A screenshot of a computer screen  Description automatically generated