Gold Trading: Three Top Tips for Trading Gold

Gold Trading: Three Top Tips for Trading Gold

Gold Trading Tips

Few markets on Earth have the historical appeal and attraction as Gold. While traders have numerous trading options today, in a number of different currencies or asset classes or geographies, Gold has been a long-standing store of value that’s piqued speculators’ interest for about as long as human beings have traded with each other.

We previously looked at some of the basics around Gold trading in the What is Gold article a little earlier in this sub-module. And we also have a ‘How to Trade Gold’ article on the Gold page of DailyFX. But, in this article, we’re going to get a bit more granular as we investigate Gold Trading Strategies, Tips and Tactics.

Gold Trading Tips

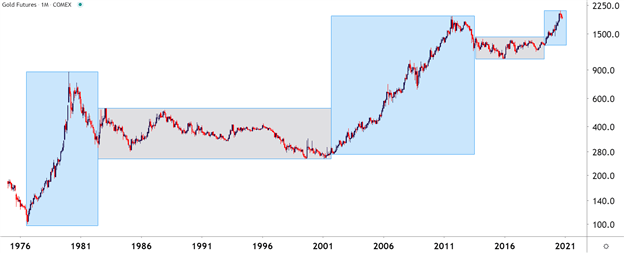
Probably one of the more obvious aspects of Gold, particularly on a longer-term basis, is the cycle sensitivity that will often show around the metal – and this isn’t a new phenomenon. As markets themselves are cyclical animals, Gold often moves to a similar type of tune, although timing may be differentiated from other markets at the time. Looking at Gold prices over the past 45 years, and this becomes a bit more clear. On the below chart, trends and ranges have been identified by blue or grey boxes, and that leads us into tip number one:

Gold Trading Tip #1: Adapt to the Present Condition

The key takeaway here is the importance of adaptation: Because if a trend trader approaches Gold with their typical approach while Gold markets are in a range, there’s high odds they could see unfavorable results. If Gold markets are mean-reverting and range-bound, the trader would likely want to approach the matter with a range-based approach. But, when Gold markets are trending, such as the case from 2001-2011 or 1976-1980, then traders are going to want to utilize trend strategies to adapt to the present condition.

Gold Futures Monthly Chart

Gold Trading Tip #2: Watch the US Dollar

The US Dollar is traded in a number of markets but, in the largest venues, Gold is traded in US Dollars. As a matter of fact, one common equation on CFD platforms presents a quote for Gold prices as ‘XAU/USD.’ The chemical symbol for Gold on the periodic table of elements is ‘AU’ and the denominator in that quote is the US Dollar, highlighting how Gold is being priced in terms of US Dollars.

This also means that, all factors held equal, and if Gold made no move at all but the US Dollar increased in value – the price of Gold could go down. Because in the function above, the value of the denominator, or USD, would increase in value thereby decreasing the value of the function as a whole.

So, there could be a tendency for Gold to display an inverse correlation with the US Dollar. This isn’t all of the time, there are scenarios where both Gold and the Dollar may increase in value although those are somewhat rare, historically speaking.

On the below chart, that correlation is highlighted in the bottom portion of the image. Reads or values above the zero line indicate positive correlation which, again, is somewhat rare but not unheard of. Reads below zero highlight inverse correlation, with a value of -1 highlighting a perfect inverse relationship.

Gold Monthly Price Chart: An Inverse Relationship with the US Dollar

Chart prepared by James Stanley; Gold on Tradingview

Gold Trading Tip #3: Know Your Time Frames

On the above charts we’re looking at the bigger picture behind Gold prices using the Monthly variety. But these conditions and market changes can take place on shorter-terms, as well, and it’s key for traders to have some type of consistent framework for their analysis so that they can properly implement their strategies in the ways that they want.

As we looked at in the multiple time frames article, traders should analyze markets from more than a single vantage point. The above monthly variety can be helpful to see the bigger picture – but for actually setting up trades and implementing strategies, traders will likely want to look to shorter time frames.

In the above graphic, the blue box on the right side of the chart shows a trend that’s been going for a little over two years now. But, looking at the shorter-term daily chart below to get a more granular look at that two-year-outlay shows that Gold prices were not trending the entire time. As a matter of fact, the same type of trend-range-trend-range relationship presented itself inside of this longer-term trend.

This is again important for traders when setting up strategy because for those that are looking to trade a trend, waiting for the monthly chart to highlight that potential may be too late. On the below chart, that blue box has been expanded so we can take a more granular look at the trend; but this time, I’ve added green boxes around the shorter-term trends and grey boxes around the mean-reverting or range-bound periods.

Gold Daily Price Chart

Gold Trading Strategies

Perhaps more important than the specific strategy that one is using to analyze or set up trades in Gold is the ‘fit’ to that specific market condition. For instance, if we look at the above image and focus on the green boxes, when the short-term trend is moving in the direction of the longer-term trend, traders are going to want to follow the age-old adage of ‘buying low and selling high.’ In the grey portions, however, when prices are ranging, traders want to similarly buy low and sell high but they’re going to want to do that in a slightly different way; closing the entirety of the long position while ‘high’ and then looking at potentially getting short to play the other side of the range.

Right up front – this means that no trader is always going to be ‘right’ because conditions, similar to trends, will change; and its impossible to know that until after the fact. This is where items like trade and risk management come into play, potentially helping to mitigate the downside in those instances where something changes or shifts away from their expectations.

Simplifying Market Behaviors by Assigning ‘Conditions’

With any market, if you think about it, there’s really only a couple of things that prices might do: Trend or not. Either prices are trending in a directional move for some reason, or they’re not trending at all: And the transitory state between mean-reversion and trends are breakouts, which are technically a market condition, itself. So, in that effort of simplification, analysts can break down market conditions into three specific types:

  1. Trend – a directional move is showing and there’s often a fundamental reason for it as traders are bidding higher-highs and higher-lows (or selling lower-lows and lower-highs).
  2. Range/Mean-Reversion – devoid of a driver, prices will often display no trend, which can open the door for range-bound or mean-reversion strategies.
  3. Breakouts – this is what happens when new information gets priced-in, and this can create a breakout move from a range and into a new trend. That new trend may last for a while or it may merely propel price action into a new range.

Bespoke Approach for the Proper Condition

Knowing what state a market is in isn’t enough, as traders are usually going to want to cater their approach to that specific condition. For instance, a trader focusing on breakouts likely won’t be able to withstand as much excursion as a trader picking on range/mean reversion setups.

At DailyFX, we help traders learn more about strategies for each of these conditions. But, perhaps the most important aspect of customizing a strategy to a specific traders’ needs is the risk management component, which is explored in-depth our Traits of Successful Traders research series, which is available completely free-of-charge and can be accessed by clicking on the link below:

Forex Correlation: Using Currency Correlation in Forex Trading

Forex Correlation: Using Currency Correlation in Forex Trading

What is currency correlation?

Currency correlation, or forex correlation, denotes the extent to which a given currency is interrelated with another, helping traders understand the price movements of currencies over time and influencing their forex decisions.

Currencies are traded in pairs, meaning no single currency pair is ever isolated. This means traders need to understand how currency pairs move in relation to others, particularly if they are trading multiple pairs at the same time.

Using currency correlation in forex trading

When using currency correlation in forex trading, traders can gain knowledge of the positions that cancel each other out, so they know to avoid those positions. Traders can also use currency pair correlation for diversifying a portfolio. More on these strategies will be discussed below.

Fx correlation is represented on a numerical scale. This ‘correlation coefficient’ ranges between -1 and +1 and shows the degree of correlation. For example, +1 would be a positive linear correlation, and implies that the two currencies will always move in the same direction. A correlation coefficient of -1 implies the currency pair will always move in the opposite direction, while if the correlation is 0, the relationship between the currencies in the pair will be random, with no correlation.

As an example, a positive correlation of, say, 0.50 between AUD/USD and EUR/USD would mean that when AUD/USD rallies, EUR/USD has also rallied 50% of the time, according to previous data. This can be observed in the charts below.

The below chart shows the currency correlation between EUR/USD (blue) and GBP/USD (red). The currency coefficient measure can be seen in the red secondary chart, revealing that while the currency pair moves in a similar direction most of the time, it is sometimes negatively correlated. The peaks represent the points in the chart showing positive correlation, with the troughs showing negative correlation.

EUR/USD-GBP/USD chart showing currency coefficient

Meanwhile, this second chart shows the currency correlation between USD/CHF (gold) and EUR/USD (blue). The currency coefficient shows that while this correlation is mainly negative, it is occasionally positively correlated.

SD/CHF-EUR/USD chart showing currency coefficient

Reading a currency correlation table

Currency correlation tables show the relationship between main forex pairs and other pairs over different time periods but, as seen in the charts above, currency correlations can and do change over time.

For example, the following table shows GBP/USD against five prominent currency pairs over a sample of 20 days, 60 days and 90 days:

GBP/USD EUR/USD USD/JPY USD/CHF USD/CAD AUD/USD NZD/USD
20 days -0.16 0.25 0.50 -0.35 -0.33 -0.57
60 days 0.77 -0.29 -0.58 -0.67 -0.12 -0.46
90 days 0.61 0.20 -0.36 -0.45 -0.01 -0.03

Source: https://tradecaptain.com/correlation-studies

GBP/USD and USD/CHF, as an example, shows a positive correlation over the shorter timeframe of 20 days. However, the pairing is overall regarded as a negative correlation for similar reasons to USD/CHF and EUR/USD. CHF is a safe haven currency and can appreciate dramatically when economic turmoil hits and equities fall, which is one reason that might explain the negative figures.

Why traders use currency correlation

Traders typically use currency correlation for inter-market trading, hedging a position, and diversifying risk.

Inter-market trading

Identifying markets that are closely correlated with each other can be useful because, if patterns are not clear in one market, clearer patterns can be used in the second market to help traders place trades in the first.

The commodities market can be particularly useful for correlation and an example of inter-market trading is the pair of USD/CAD and oil . Since Canada is the largest exporter of oil to the US, the currency pair is sensitive to the commodity price, and when the oil price rises CAD will tend to strengthen against USD. Another example is the correlation of the Australian Dollar (AUD) with gold, with price rises in the precious metal equating to rises in AUD due to the country being one of the leading gold producers in the world.

Currency correlation is useful for traders

Hedging a position

Hedging a position is also a reason to trade forex correlations. If you are bullish about AUD and want to buy AUD/USD, then buying USD/CHF to hedge off some of the USD exposure may be a wise move.

Different pip or point values can be used to a trader’s advantage when hedging exposure. Where the value of a pip move for a given pair may be $10 for a lot of 100,000 units, a negatively correlated pair with the value of a pip move at $9.20 for the same number of units can represent a useful hedge.

Diversifying risk

Traders can also use currency correlation for diversifying risk. For example, having three trades on (GBP/NZD, USD/JPY, and EUR/JPY) means you can run an analysis between the three markets to make sure they are not correlated, effectively diversifying your trades.

Summary: Forex correlation trading tips

In summary, when creating a forex correlation trading strategy, some factors to consider when trading are:

  1. Use Intermarket correlations to your advantage: Find markets that have strong positive or negative correlations with the exposure you are seeking, such as major stock indices . Forex trading, in many cases, may provide more liquidity and 24-hour access to the market.
  2. Find currency markets with strong positive or inverse correlations: Correlations above +0.5 and below -0.5 suggest a strong correlation exists. Use those strong correlations for hedging exposures.
  3. Diversify risk: If you want to diversify risk, look for markets with correlation figures between -0.3 and +0.3 as that suggested they are not correlated
The Most Volatile Currency Pairs and How to Trade Them

The Most Volatile Currency Pairs and How to Trade Them

What are the most volatile currency pairs?

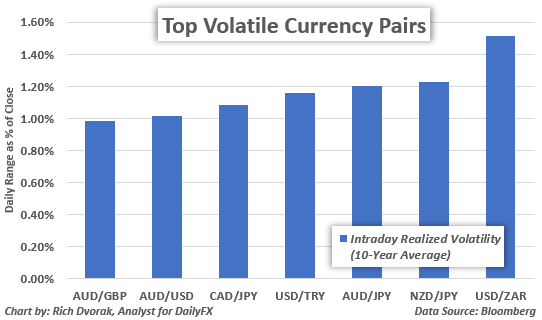
The most volatile major currency pairs are:

Most Volatile Currency Pairs

Other major currency pairs, like EUR/USD, USD/JPY, GBP/USD and USD/CHF, are generally more liquid and less volatile as a result. That said, emerging market currency pairs, such as USD/ZAR, USD/TRY and USD/MXN, can clock some of the highest volatility readings.

MOST VOLATILE CURRENCY PAIRS

Majors – AUD/JPY, NZD/JPY, AUD/USD, CAD/JPY, GBP/AUD

Emerging Markets – USD/ZAR, USD/TRY, USD/MXN

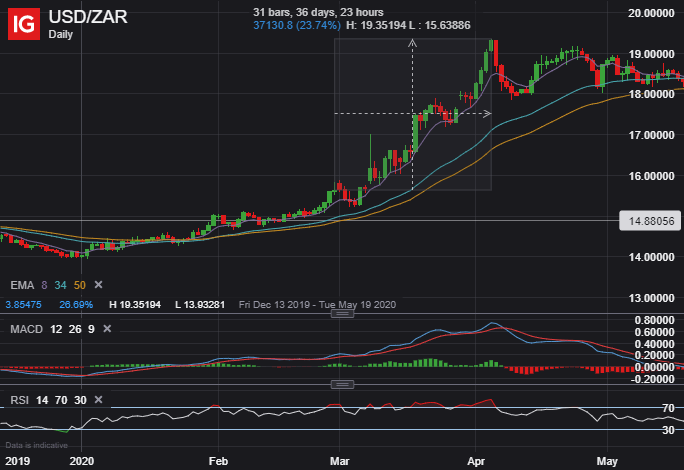
Aside from relatively low liquidity, emerging market currencies tend to be highly volatile in particular due to inherent risk underpinning emerging market economies. The chart below gives an example of how volatile emerging market currencies can be, which shows USD/ZAR (US Dollar/South Africa Rand) exploding nearly 25% higher in just over a month’s time. There are several other examples of emerging market currency pairs swinging drastically like this throughout history.

USDZAR Daily Price Chart

What about the least volatile currency pairs?

The least volatile currency pairs tend to be the major currency pairs which are also the most liquid. Also, these economies tend to be larger and more developed. This attracts more trading volume and facilitates greater price stability in turn. To that end, considering EUR/USD, USD/CHF and EUR/GBP trade with high volumes of liquidity, it comes as little surprise they are among the lease volatile currency pairs.

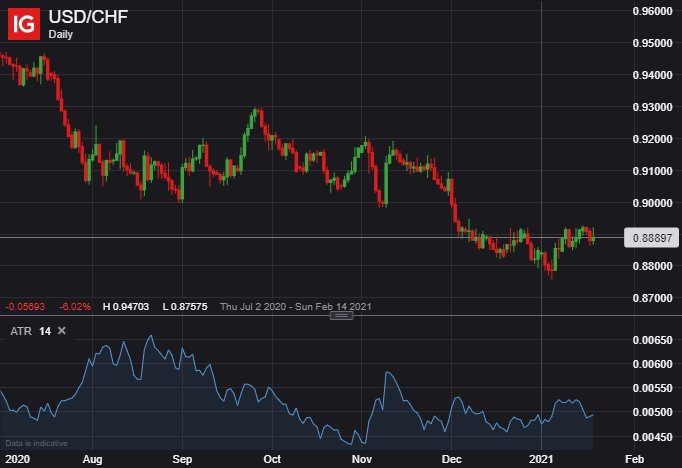
Illustrated below, the average true range (ATR) on USD/CHF ranges between 45-pips and 65-pips, a low average true range compared to other pairs. The average true range of a currency is one of the many ways to measure the volatility of a currency pair. Bollinger Band width is another popular technical indicator used to measure volatility.

USDCHF Daily Price Chart

Correlation between two currencies can also have an impact on their volatility. The more positively two currencies are correlated to one another might lead to less volatility. Continuing with our USD/CHF example, we note that the US Dollar and Swiss Franc are both viewed as safe-haven currencies.

The US Dollar and Swiss Franc tend to strengthen against their sentiment-linked peers when the market experiences episodes of risk aversion, but the two currencies may not deviate much from each other. This contributes to relatively low volatility readings for USD/CHF.

How to trade currency pair volatility

Forex traders should take into account current readings of volatility and potential changes in volatility when trading. Market participants should also consider adjusting their position sizes with respect to how volatile a currency pair is. Trading a volatile currency pair might warrant a reduced position size.

Awareness of volatility can also help traders determine appropriate levels for stop loss and take profit limit orders. Furthermore, it is important to understand the key characteristics separating the most volatile currencies from currencies with low volatility readings. Traders should also know how to measure volatility and have an awareness of events that might create big changes in volatility.

The difference between trading currency pairs with high volatility versus low volatility

  1. Currencies with high volatility will normally move more pips over a certain period than currencies with low volatility. This leads to increased risk when trading currency pairs with high volatility.
  2. Currencies with high volatility are more prone to slippage than currency pairs with low volatility.
  3. Due to high-volatility currency pairs making bigger moves, you should determine the correct position size to take when trading them.

There are several ways to measure volatility

To determine the correct position size, traders need to have an expectation of how volatile a currency can be. A variety of indicators can be used to measure volatility like:

Traders can also look at implied volatility readings, which reflect the level of expected volatility derived from options.

Key things traders should know about volatility:

  • Big news events like Brexit or trade wars can have a major impact on a currency’s volatility. Data releases can also influence volatility. Traders can stay ahead of data releases by using an economic calendar.
  • Volatile currency pairs still obey many technical aspects of trading, like support and resistance levels, trendlines and price patterns. Traders can take advantage of the volatility using technical analysis in combination with strict risk management principles.
  • Staying up to date with the latest forex pair news, analysis and rates can help you predict possible changes in volatility. We provide comprehensive trading forecasts to help you navigate the market.
  • DailyFX hosts daily webinars to answer questions and help traders prepare for volatile market conditions.
  • Supplement your forex learning and strategy development with the DailyFX Education Center.
Euro Price Forecast: EUR Threatened by Dovish ECB & Bleak Forecasts

Euro Price Forecast: EUR Threatened by Dovish ECB & Bleak Forecasts

EURO FUNDAMENTAL BACKDROP

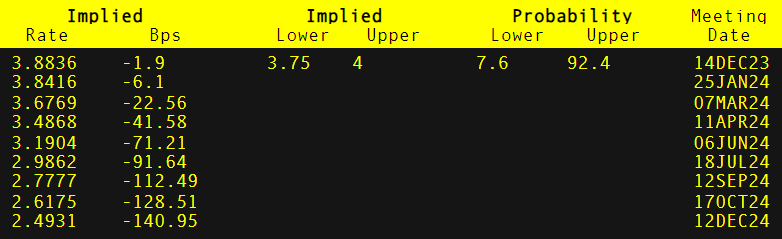
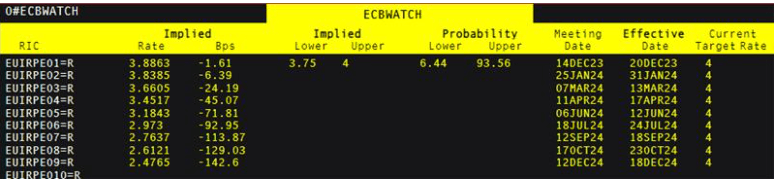
The euro has opened flat this morning after a slew of daily closes in the red. Weak economic data from the euro area including yesterday’s composite and services PMI’s that remain in contractionary territory as well as increasingly negative economic growth over the next 12 months (European Central Bank (ECB) survey). Adding to EUR downside was the fact that US ISM services PMI’s surprised to the upside although JOLTs openings did miss to the downside reaching its lowest level for 2023. ECB officials have been become increasingly dovish of recent and this reflects in money market pricing of the ECB’s rate path (refer to table below):

ECB INTEREST RATE PROBABILITIES

image1.png

Markets see the first round of rate cuts around March 2024 and could really weigh negatively on the euro should we continue to see weak euro area economic data. The significant repricing occurred after the ECB’s Schnabel (known hawk) stated that “INFLATION DEVELOPMENTS ARE ENCOURAGING AND THE FALL IN CORE PRICES IS REMARKABLE.”

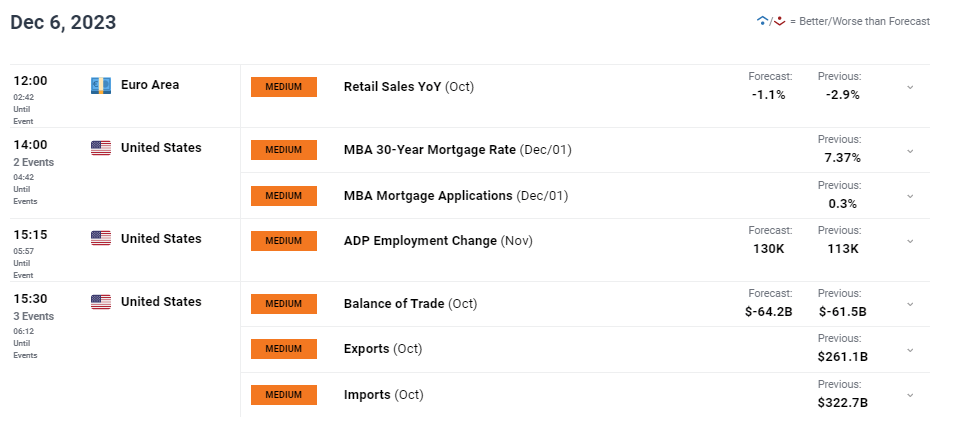
Later today, eurozone retail sales will come into focus while the main volatility driver is likely to stem from ADP employment change ahead of Friday’s Non-Farm Payrolls (NFP). The ECB’s Nagel is also scheduled to speak and will give some additional insight into the ECB’s thinking.

ECONOMIC CALENDAR (GMT+02:00)

image2.png

Want to stay updated with the most relevant trading information? Sign up for our bi-weekly newsletter and keep abreast of the latest market moving events!

TECHNICAL ANALYSIS

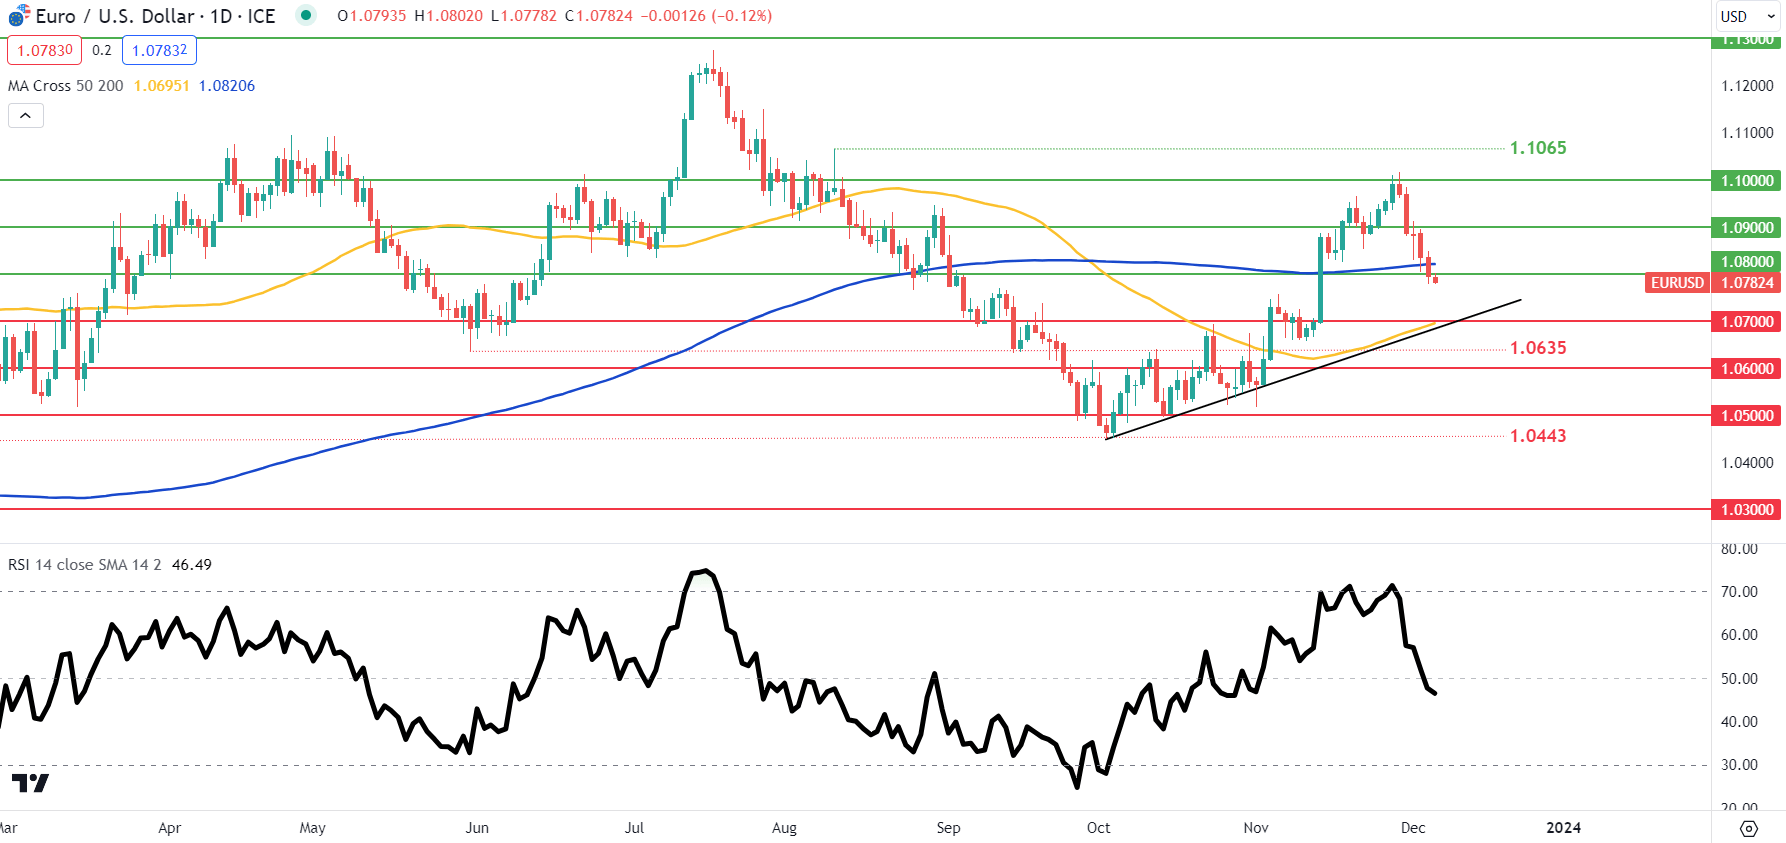
EUR/USD DAILY CHART

image3.png

The daily EUR/USD chart above has the pair below both the 200-day moving average (blue) and the 1.0800 psychological handle. The Relative Strength Index (RSI) now suggests a preference towards bearish momentum which brings into consideration the 50-day moving average (yellow), 1.0700 and trendline support (black).


Death Cross: What is it and How to Identify it When Trading?

Death Cross: What is it and How to Identify it When Trading?

Death cross: What is it and How to Identify it when Trading?

The ‘death cross’ is a term often mentioned in trading circles due to its usefulness in spotting changes in trends while also being incredibly easy to use. This article will explain the concept of the death cross and how to identify it on price charts. Furthermore, read our article on the Golden Cross to discover complementary indicators to use alongside the simple moving averages when analyzing changing trends.

Death Cross

What is a Death cross?

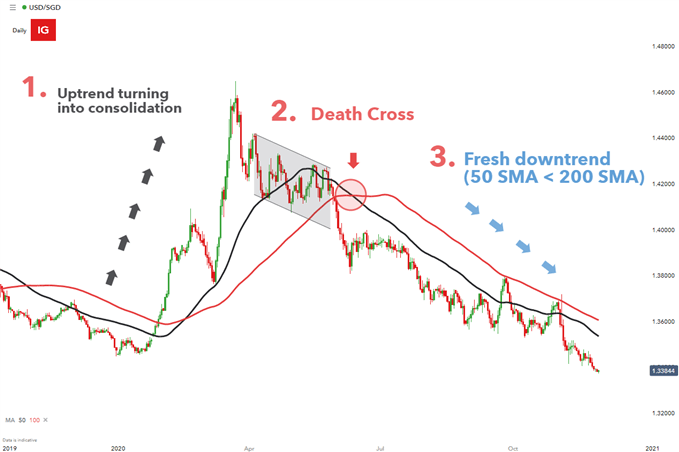
A death cross occurs when the 50 simple moving average (SMA) crosses below the 200 SMA. The death cross provides a bearish backdrop to the market as short-term price momentum advances lower, with the potential to evolve into a new long-term trend (downtrend).

The 50 SMA is an arithmetic average of closing price levels over the last 50 periods or days, if you are using the daily chart for example. Therefore, the 50 SMA is more reactive to more recent price movement than the 200 SMA, which averages out the last 200 closing prices and tends to create a smoother line, less reactive to recent prices than the 50 SMA.

Learn how to calculate simple moving average in our article, ‘Moving Average Explained for Traders’

How to Identify a Death cross

There are three main stages to the formation of the death cross:

1. The lead up: Price action consolidates or, in some scenarios, turns sharply lower after trending higher for a considerable period of time. A period of consolidation provides the initial clue that the uptrend may be starting to lose momentum and could even result in an eventual trend reversal. The 50 SMA remains above the 200 SMA during this stage.

2. The death cross: This is the exact moment the 50 SMA crosses below the 200 SMA, providing the bearish backdrop for the market known as the death cross. The death cross is often interpreted as a trigger to look for entries into the market.

3. Continued downward momentum: Price action advances lower after the death cross is observed, often creating a fresh new trend (downtrend). Ideally, in this stage you may observe the shorter 50 SMA acting as dynamic resistance for price action and price continues to trade below the 50 SMA for some time.

Death cross on Daily USD/SGD Chart 2019-2020

The Simple Moving Average as a Lagging Indicator

By its very nature the simple moving average is a lagging indicator, meaning that it relies on past price action to provide assistance when analyzing current market conditions. Inherently, the SMA has a lag period, resulting in the signal being produced some time after the move has occurred.

Some may view this as a lost opportunity while others may appreciate the delayed signal as it may provide a greater level of conviction that the trend has indeed changed and we aren’t simply witnessing a short term retracement. Shorter-term traders like scalpers and day traders, seeking to capitalize on smaller moves, can make the indicator more responsive by simply reducing the short-term and longer-term moving averages when adjusting the input criteria.

Silver Trading Strategies, Tips and Tactics

Silver Trading Strategies, Tips and Tactics

Silver Trading

As discussed in the ‘what is silver’ article, silver is a precious metal which is predominately used for industrial purposes, but it is also one of the most popular tradeable commodities. Although gold is perceived to hold more economic value, these two commodities are highly correlated and both fall into the category of safe-haven assets.

During periods of high volatility and economic uncertainty, investors have often sought refuge in silver as an inflationary hedge as well as a long-term investment, increasing its safe-haven appeal. Much like its Gold counterpart, there is an inverse relationship between silver and the US Dollar, making it an attractive investment for the purpose of portfolio diversification.

As with any financial instrument, it is important to understand the factors that may influence the price of Silver and in turn, its investment appeal.

Three Factors which Influence Silver as an Investment:

  1. Supply and Demand

Although all assets are a function of supply and demand, precious metals are often in high demand due to the limited supply available. However, the demand for silver is largely attributed to its industrial application. Because silver is the most electrical and thermally conductive metal, it is often used for medical equipment, electrical appliances and other industrial items.

During economic slumps, although the demand for physical silver as an industrial item may decrease, the demand for it as an investment often increases, resulting in an increase in price. As far as supply is concerned, a majority of industrial silver is either consumed or destroyed during the fabrication process, limiting the supply that can be returned to the market upon completion of the industrial cycle and potentially hindering future supply of the metal.

2. Global Economics

In periods of economic uncertainty and political instability, investors have been known to invest in gold, but silver’s safe-haven appeal is definitely gaining the attention of many investors as an alternative. During a global recession, adjustments to monetary and fiscal policies often result in investors looking towards alternate investments that may yield higher returns as governments often lower interest rates to stimulate consumer spending, simultaneously increasing inflation expectations. While rising inflation results in a loss of purchasing power with paper money and a depreciation in currencies, investors may use silver as an inflationary hedge against such losses. In addition to this, silver, like gold, often displays an inverse relationship with the US Dollar. As the Dollar weakens, the demand for silver is likely to grow as traders diversify their portfolios to mitigate the risk associated with Dollar depreciation.

  1. Gold Prices

Throughout this article, the relationship between gold and silver has been mentioned numerous times, and is represented by the gold-silver ratio, the measurement used to determine the amount of silver (in ounces) that one would need to buy one ounce of gold. Although the price of silver tends to follow that of gold, it does not mean that the two commodities will move at the same rate, and these discrepancies will likely either increase or decrease the ratio level. However, understanding the gold-silver ratio may be beneficial for silver traders as it may provide potential signals of when the market is reaching extreme levels.

From a historical perspective, during the financial crisis, gold had a tendency of outperforming silver which meant that the ratio would increase, with highs breaching 80 and lows sinking to around 40. At these extreme levels, traders may be looking for additional confirmation that a correction will occur to bring the ratio back to its perceived normal level of around 60.

Silver as a Tradeable Commodity

Ample liquidity, high trade volumes, tight spreads and flexible trading hours are attractive attributes which make silver a popular commodity for traders. When market volatility increases, a smaller market size makes silver more susceptible to large price swings which will often be greater than that of gold. For short-term traders, such as day traders or scalpers, this may be an opportunity to take advantage of the large price swings that may occur.

In addition to this, silver is becoming increasingly popular as a means of portfolio diversification, with traders using it as a hedge against positions with a high correlation to the US Dollar and the same factors that influence silver as an investment will generally impact it as a tradeable commodity.

Silver Trading Strategies

Although a variety of strategies exist, it is important that the strategy chosen, is in alignment with current market conditions. When the market is in a trending phase, traders may apply a Trend Trading strategy and when in a rangebound state, a Range Trading strategy may be used.

3 Steps to a Silver Trend Trading Strategy:

  1. Determine the direction of the trend

A trending market is one that is consistently reaching new extremes. In an uptrend, this would be characterized by a series of higher highs and higher lows, while a strong downtrend trend would be characterized by a series of lower lows and lower highs.

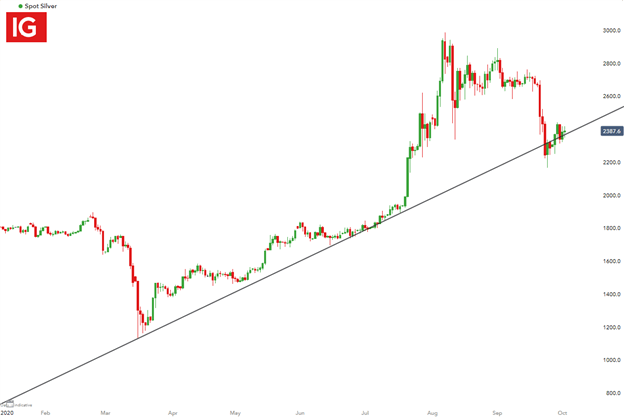
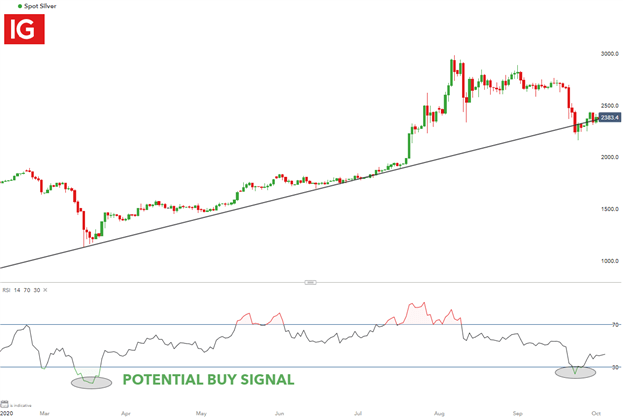
Although determining the trend may sound simple, deciding on an appropriate time-frame can be a challenging task. While intraday traders often make use of short-term charts to determine potential entry and exit signals, there are benefits to multiple time-frame analysis, which includes analysis from both long and short-term charts. As depicted on the daily chart below, a trendline can be used as a guide to determine the direction of the trend, with three touching points confirming the presence of the upward trend.

Silver Daily Chart

2. Filter signals in the direction of the trend

Once the trader has identified the direction of the current trend, the second step would be to identify potential entry signals by making use of technical indicators. The Relative Strength Index (RSI), is a popular momentum oscillator that indicates when an instrument may be overbought or oversold. When the value of the RSI falls below 30, it is considered oversold and when it is above 70, it is considered overbought.

By applying the RSI to the daily chart above, a potential entry signal may exist at the highlighted areas below 30, where silver is considered to be in oversold territory.

3. Implement risk management

Risk management is probably the most important component of a trading plan which should be determined prior to entering a trade.

At DailyFX Education, risk management is front and center as this is one of the few factors that a trader actually has in their control. This is also derived from data, featured in our Traits of Successful Traders research. Point blank – no trader will even be able to accurately predict the future much less in a perfect manner. And with that being the case, any trader that isn’t controlling the size of their losses is vulnerable to one ‘bad’ trade wiping out the gain from numerous ‘winning’ trades. To learn more about our risk management and our Traits of Successful Traders research, click on the link below:

Silver Range-bound Trading Strategy

The silver market does not always trend upwards or downwards, it often enters periods of consolidation when the prices move ‘sideways’, which is when a range-bound strategy would be suitable.

A range-bound strategy may be implemented by using a similar three-step process as above.

  1. Determine the range

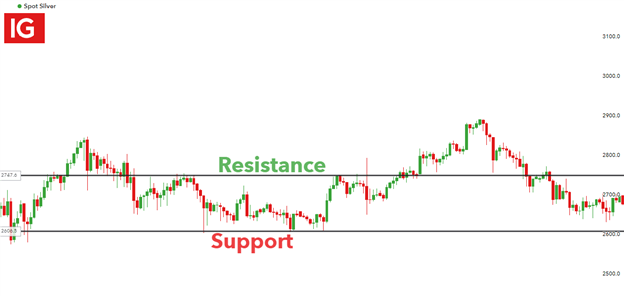
When price action is in a range-bound state, it generally means that prices are reaching the same levels over a period of time, which is referred to as a consolidation. To determine the range, a trader may use support and resistance levels to assist in identifying the upper and lower limits within the range. A support zone can be established by connecting a series of lows while a resistance zone can be established by connecting a series of highs.

The silver two-hour chart below demonstrates how a trader may determine the range when the market is in a period of consolidation.

Silver 2 Hour Chart

2. Filter signals

If the silver price moves to the bottom of the range, traders could look to buy silver and could look to sell silver when the price moves to the higher end of the range. An advantage of a range trading strategy is that a trader can use tight stop-losses. This means that a trader can risk less and generally aim for a higher risk-reward ratio on the trade.

3. Implement risk management

Any complete trading strategy will include strict risk-management principles. If the silver price breaks out of the support or resistance levels, which it eventually will, it is important that a trader is prepared. Traders can use stop-losses and take-profits to predetermine the risk-reward ratio before entering a trade.

If a trader sells silver at a resistance level they would place their stop-loss above the resistance level, and likewise if a trader bought silver they would place their stop-loss below the support level.

How to Trade Silver with Technical Analysis

The strategies above focused on the use of chart patterns and technical indicators to assist with determining possible points of interest, which, although cannot be guaranteed, may assist traders in identifying high probability areas, that have proven to be important in the past.Although hundreds of indicators exist, each with unique characteristics, the use of one or two simple indicators is often sufficient.

Four effective indicators that are used by both novice and experienced traders include the moving average (MA), relative strength index (RSI), the moving average divergence/convergence (MACD) and the stochastic.

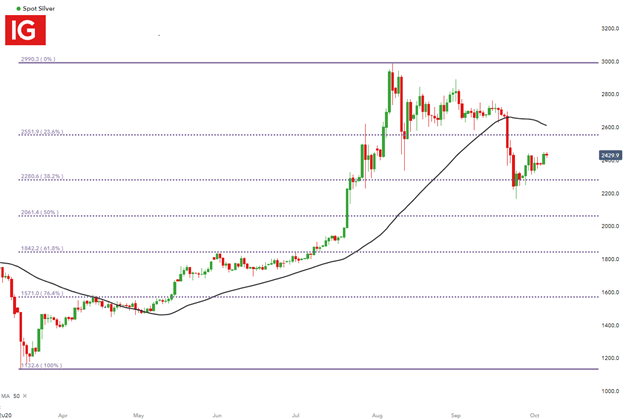
However, price action is also useful guide for traders, with Fibonacci levels guiding support and resistance. An example of how the Fibonacci retracement can be used for technical analysis can be seen in the silver chart below, where the Fibonacci retracement is taken from two relevant points (usually a high and a low of importance).

Using the daily chart below, the Fibonacci retracement is taken from the low and high of 2020, with the 50-day moving average acting as an additional guide for price action.

Risk Management Techniques for Trading

Risk Management Techniques for Trading

Why is trading risk management important?

Many traders see trading as an opportunity to make money but the potential for loss is often overlooked. By implementing a risk management strategy, a trader will be able to limit the negative effects of a losing trade when the market moves in the opposite direction.

A trader who incorporates risk management into the trading strategy will be able to benefit from upside movement while minimizing downside risk. This is achieved through the use of risk management tools like stops and limits and by trading a diversified portfolio.

Traders that opt to forgo the use of trading stops run the risk of holding onto positions for too long in the hope that the market will turn around. This has been identified as the number one mistake traders make, and can be avoided by adopting the traits of successful traders to all trades.

How to Manage Risk in Trading: Top Tips and Strategies

Below are six risk management techniques that traders of all levels should consider:

  1. Determine the risk/exposure upfront
  2. Optimal stop loss level
  3. Diversify your portfolio: the lower the correlation, the better the diversification
  4. Keep your risk consistent and manage your emotions
  5. Maintaining a positive risk to reward ratio

1) Determine the risk/exposure upfront:

Risk is inherent in every trade which is why it is essential to determine your risk before entering the trade. A general rule would be to risk 1% of the account equity on a single position and no more than 5% across all open positions, at any time. For example, the 1% rule applied to $10,000 account would mean no more than $100 should be risked on a single position. Traders will then need to calculate their trade size based on how far away the stop is placed in order to risk $100 or less.

The benefit of this approach is that it helps to preserve the account equity after a run of unsuccessful trades. An additional benefit of this approach is that traders are more likely to have free margin available to take advantage of new opportunities in the market. This avoids having to forgo such opportunities due to margin being tied up in existing trades.

2) Optimal stop loss level

There are many different approaches that traders can utilize when deciding where to place a stop.

Traders can set stops in accordance with:

  • Moving averages – set stops above (below) the specified MA for long (short) positions. The chart below shows how traders can use the moving average as a dynamic stop loss.

using moving average as a risk management tool

  • Support and resistance – set stops below (above) support (resistance) for long (short) positions. The chart below shows the stop being placed below support in a ranging market , allowing the trade enough room to breathe while protecting against a large downward move.

stops near support and resistance as a risk management strategy

  • Using the Average True Range (ATR) – ATR measures the average pip/point movement in any security over a specified period and provides traders with a minimum distance away to set their stops. The chart below adopts a cautious approach to the ATR by setting the stop distance in accordance with the maximum ATR reading from recent price action.

using average true range in a risk management strategy

*Advanced Tip : Instead of using a normal stop loss, traders can use a trailing stop to mitigate risk when the market is moving in your favor. The trailing stop, as the name suggests, moves the stop loss up on winning positions while maintaining the stop distance, at all times.

3) Diversify your portfolio: The lower the correlation, the better the diversification

Even if the 1% rule is adhered to, it is crucial to know how positions may be correlated. For example, the EUR/USD and GBP/USD currency pairs have a high correlation, meaning they tend to move closely together and in the same direction. Trading highly correlated markets is great when trades move in your favour but becomes an issue on losing trades as the loss on the one trade now applies to the correlated trade too.

The chart below depicts the high correlation observed between EUR/USD and GBP/USD. Notice how closely the two price lines track each other.

correlation between eur/usd and gbp/usd

Having a good understanding of the markets you are trading and avoiding highly correlated currencies, helps to achieve a more diversified portfolio with reduced risk.

4) Keep your risk consistent and manage your emotions

Once traders make a few winning trades, greed can easily set in and entice traders to increase trading sizes. This is the easiest way to burn through capital and place the trading account in jeopardy. For more established traders however, it is alright to add to existing winning positions but maintaining a consistent framework when it comes to risk should be the general rule.

Fear and greed rear their ugly head many times when trading. Learn how to manage fear and greed in trading .

5) Maintaining a positive risk to reward ratio

Maintaining a positive risk to reward ratio is crucially important to managing risk over time. There may be losses early on but maintaining a positive risk to reward ratio and keeping to the 1% rule on each trade, greatly enhances the consistency of your trading account over time.

The risk to reward ratio calculates how many pips a trader is prepared to risk, compared with the number pips a trader will receive if the target/limit is hit. A 1:2 risk to reward ratio means that the trader is risking one pip to make two pips, if the trade works out.

The magic within the risk to reward ratio lies in its repeated use. We discovered in our Traits of Successful Traders research that the percentage of traders who used a positive risk to reward ratio tended to show profitable results versus those with a negative risk to reward ratio (page 7 of the guide). Traders can still be successful, even if they only win 50% of their trades, as long as a positive risk to reward ratio is maintained.

*Advanced Tip : Traders often get frustrated when the trade moves in the right direction only for the market to turn right around and trigger the stop. One way to avoid this happening is to make use of a two-lot system. This strategy looks to close out half of the position when it is midway to the target and then bring the stop on the remaining position to break-even. This way the traders gets to bank the profit on the one position while essentially being left with a risk-free trade in the remaining position (if using a guaranteed stop).

Trading risk management tools

1) Normal Stop Loss : These stops are the standard stops offered by most forex brokers. They tend to work best in non-volatile markets as they are prone to slippage . Slippage is a phenomenon where the market doesn’t actually trade at the specified price, either because there is no liquidity at that price or due to a gap in the market. As a result, the trader has to take the next best price, which may be significantly worse, as shown in the USD/BRL chart below:

usd/brl market gapping risk management

2) Guaranteed Stop Loss : A guaranteed stop eliminates the issue of slippage entirely. Even in volatile markets where price can gap, the broker will honor the exact stop level. However, this feature comes with a cost as brokers will charge a small percentage of the trade to guarantee the stop level.

3) Trailing Stop Loss : A trailing stop moves the stop closer to the current price on winning positions while maintaining the same stop distance at inception of the trade. For example, the GBP/USD chart below shows a short entry that moves favorably. Every time the market moves 200 pips the stop will automatically move along with it, while maintaining the initial stop distance of 160 pips.

Trailing stop as a form of risk management

Gold Price Update: XAU/USD Calmer after Massive Same-Day Reversal

Gold Price Update: XAU/USD Calmer after Massive Same-Day Reversal

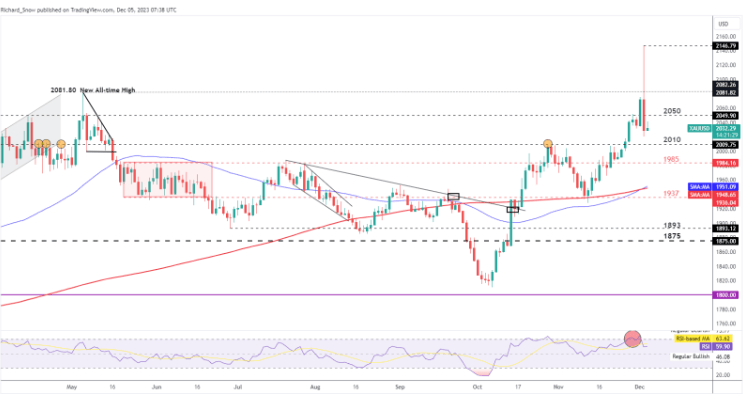
The gold market attempted to catch its breath after a phenomenal day of trading yesterday. Registering a 5.42% round trip, the price of gold obliterated the prior swing all-time-high around $2081 only to retrace the move and end the day significantly lower.The RSI surged into overbought territory and has already recovered – highlighting the massive amount of volatility experienced yesterday. Today, however, trading has been more moderate, trading below the $2050 level but the uptrend remains well intact and well above the 200-day simple moving average (SMA).

Gold bulls appear to be in the driving seat after US yields topped and markets continue to price in interest rate cuts in 2024. Lower interest rates typically deflate the value of the dollar which provides a relative discount for foreign (non-US domiciled) purchases of the dollar-based commodity.

The safe-haven appeal also remains as Israel continued its aggression on Hamas targets after the ceasefire had come to an end. Support resides at $2010 with immediate resistance at $2050, followed by $2081.80.

Gold Daily Chart

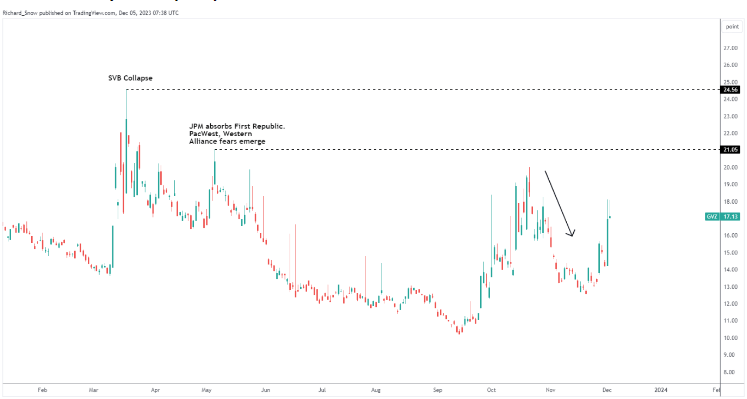
The chart below pertains to expected 30-day gold volatility and shows just how much of a move we saw yesterday, sending the GVZ index massively higher. In the lead-up to yesterday, gold volatility has subsided as the initial impact of the Israel-Hamas war dragged on.

Gold Volatility Index (GVZ)

Fibonacci in the Forex Market

Fibonacci in the Forex Market

How to Create a Fibonacci Retracement on a Forex Pair

Before delving deeper into practical examples, traders need to have a basic view of the overall market being analyzed (EUR/USD or USD/ZAR etc.). This starts by identifying the trend; this can be long, medium or short-term depending on trading style. Various methods can be used to identify the trend such as simple price action, indicators like Moving Averages (MA) , as well as other methods. The reason why identifying the trend is important is because the Fibonacci tool itself does not determine a trend bias, rather it identifies key support and resistance levels.

Further your knowledge on trend trading

Implementing the Fibonacci retracement requires identifying a large move either up/down on the forex price chart. This will produce key levels using Fibonacci metrics. The dueling nature of a forex pair has the tendency for mean reversion, which can produce major moves from which Fibonacci retracements can be drawn.

The key levels to look out for are 38.2% and 61.8% respectively. The 50% level is not technically a Fibonacci level but is often included in charting packages and regarded as an important threshold. This level simply marks half the market move between the initial high and low or vice versa. The chart below shows a simple implementation of the Fibonacci retracement on a GBP/ZAR daily chart. Highlighted in black are the respective low to high points which are used to plot the Fibonacci levels.

GBP/ZAR daily chart – uptrend:

GBP/ZAR daily chart with Fibonacci

Traders may also utilize the Fibonacci retracement from a high to low price level as expressed on the USD/SGD chart below.

USD/SGD daily chart – downtrend:

USD/SGD Daily chart with Fibonacci

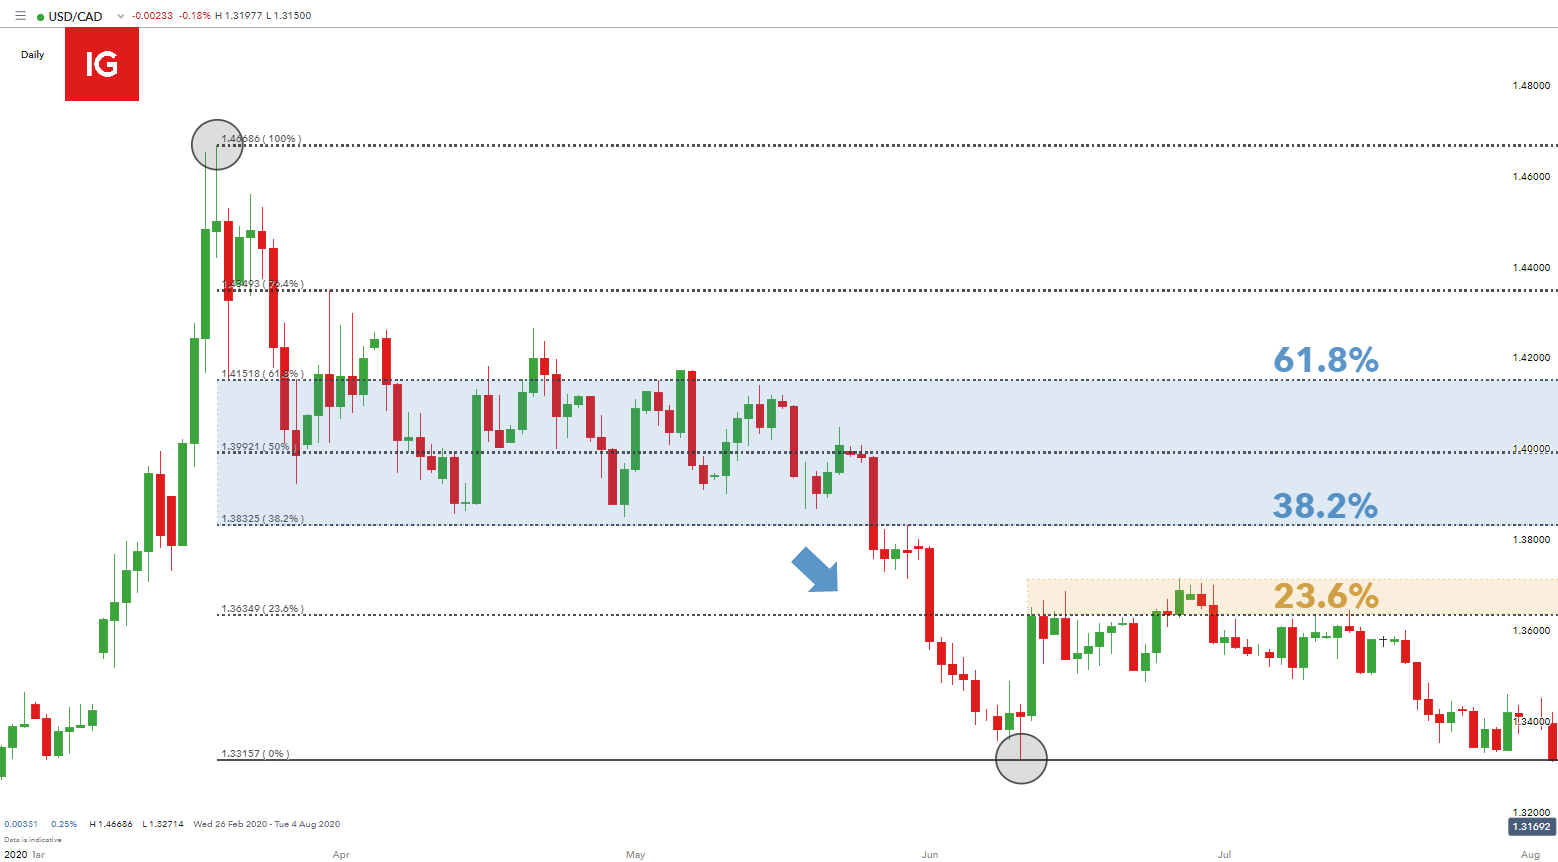
Once the Fibonacci retracement is drawn, traders can use these price levels for possible entry and exit signals. The USD/CAD example below shows how price action tends to revert to the various Fibonacci levels. The blue rectangle highlights the area between the 61.8% and 38.2% Fibonacci levels. It is evident that price respects these two key support and resistance points. Traders may look to enter into short positions at the 61.8% – as a result of the preceding downward trend, with initial support coming from the 38.2% level.

It is important to note that the Fibonacci points should not be seen as concrete levels but rather guidelines or reference points. Price will not always trade at these exact levels. It is common to see price just falling short or pushing passed a level which can frustrate traders who look at exact levels. With reference to stop and limit orders, traders should give themselves some leeway for potential price fluctuations around the Fibonacci level. The chart below shows an example of this above the 23.6% level (yellow) where bulls are seen pushing price up but quickly reverting back down below the 23.6% level.

USD/CAD daily chart:

USD/CAD Daily chart with Fibonacci

This is the most simplistic form of the Fibonacci retracement within forex markets. The versatility of the Fibonacci retracement function means that it is not limited to one time frame as seen above. A more complicated approach involves several Fibonacci retracements across different time frames. Instituting multiple time frame analysis can allow for multiple Fibonacci retracements drawn from major moves. The next article in the Fibonacci series will go into more depth with and practical examples to show how exactly traders can implement this strategy.

Fibonacci Retracements to Help to See the Bigger Picture

Forex traders often make the mistake of relying solely on Fibonacci levels to take positions in the market but this can be detrimental as this can make them too one dimensional. Additional support from other indicators, chart patterns, candlestick patterns and fundamentals are essential to formulate a better overall strategy; and ultimately a well-informed trade decision. The Fibonacci can be an extremely powerful tool in forex trading so fully understanding its foundations can be beneficial to any trader looking to implement the tool within their trading strategy.

Euro (EUR) Latest: Dovish ECB Commentary Weighs on EUR/USD, Yields Slump

Euro (EUR) Latest: Dovish ECB Commentary Weighs on EUR/USD, Yields Slump

In a recent interview with Reuters, Isabel Schnabel, a member of the executive board of the ECB, said that the central bank’s monetary policy is working and that they remain on track to get inflation back to target (2%). What is notable is that before today’s dovish interview, Ms. Schnabel has been a known hawk, giving her strong backing when the ECB was hiking interest rates. The interview started on a telling note. When Ms. Schnabel was asked if she was surprised by the recent benign inflation reading, she quoted Keynes saying’

‘When the facts change, I change my mind, what do you do sir?’

During the interview, Ms. Schnabel added that ‘inflation developments have been encouraging’, the recent inflation number has made a ‘further rate increase rather unlikely’, and that underlying inflation is now ‘falling more quickly than we had expected’.

Euro Zone annual inflation fell to 2.4% in November, below market forecasts and sharply lower than October’s reading of 2.9%

Financial markets took note of Ms. Schnabel’s comments and priced in deeper rate cuts in 2024. The latest market forecast is for over 140 basis points of rate cuts next year with the first 25bp cut seen at the March ECB meeting.

image1.png

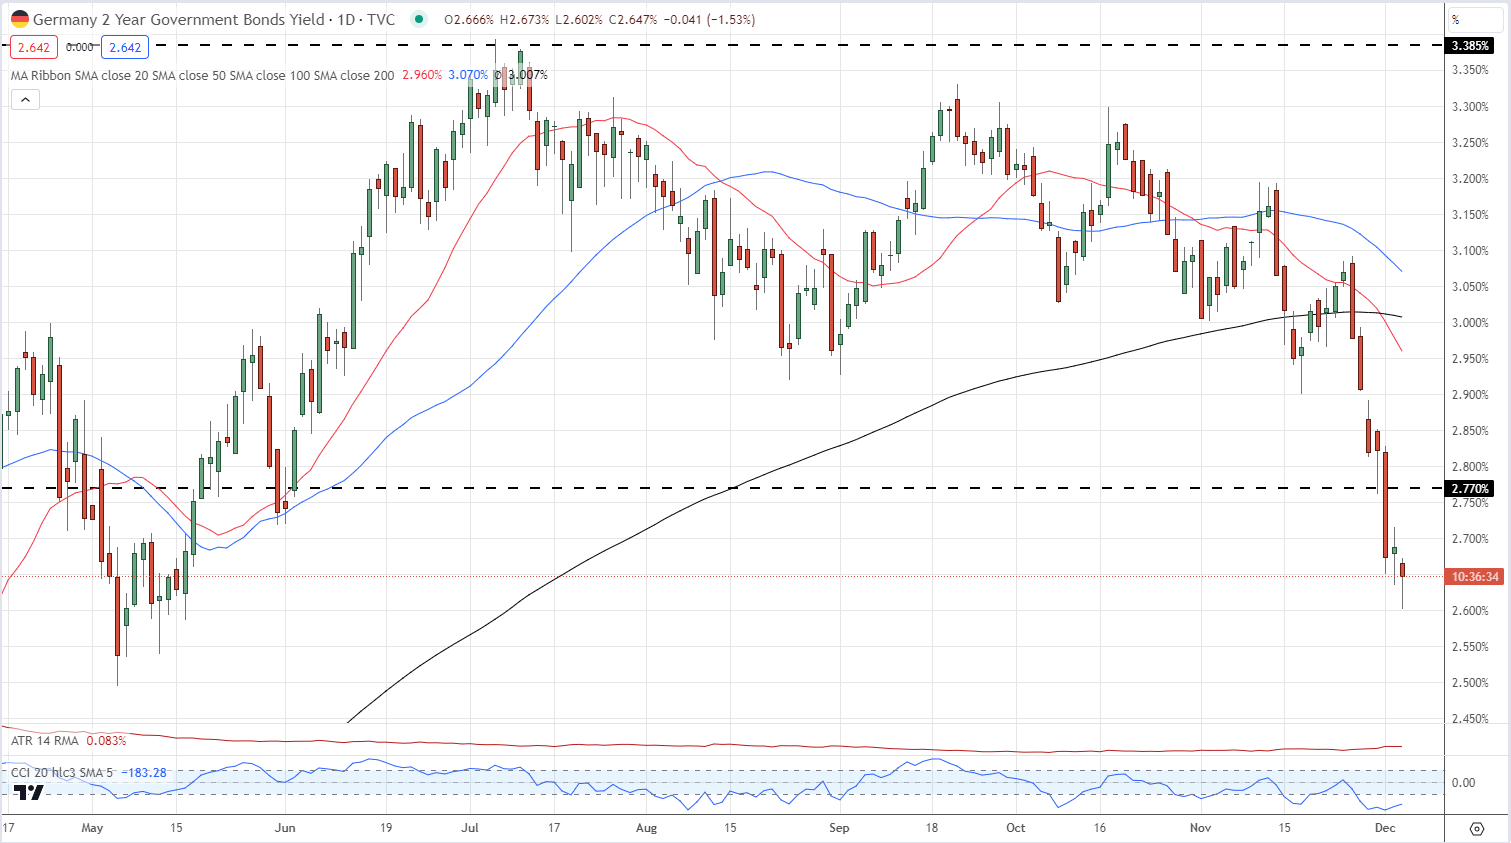
German government bond yields – the ECB proxy – continue their recent sell-off this morning, making a fresh multi-month low. The yield on the rate-sensitive 2-year touched 2.60%, a level last seen in mid-May and around 80 basis points lower than the early July high.

German 2-Year Schatz Yield

image2.png

An increasingly dovish outlook and lower government bond yields have left the Euro struggling against a range of currencies. The Euro has fallen for seven days in a row against the Japanese Yen, another currency with a dovish background, while EUR/GBP has fallen by around two big figures in the last two weeks.

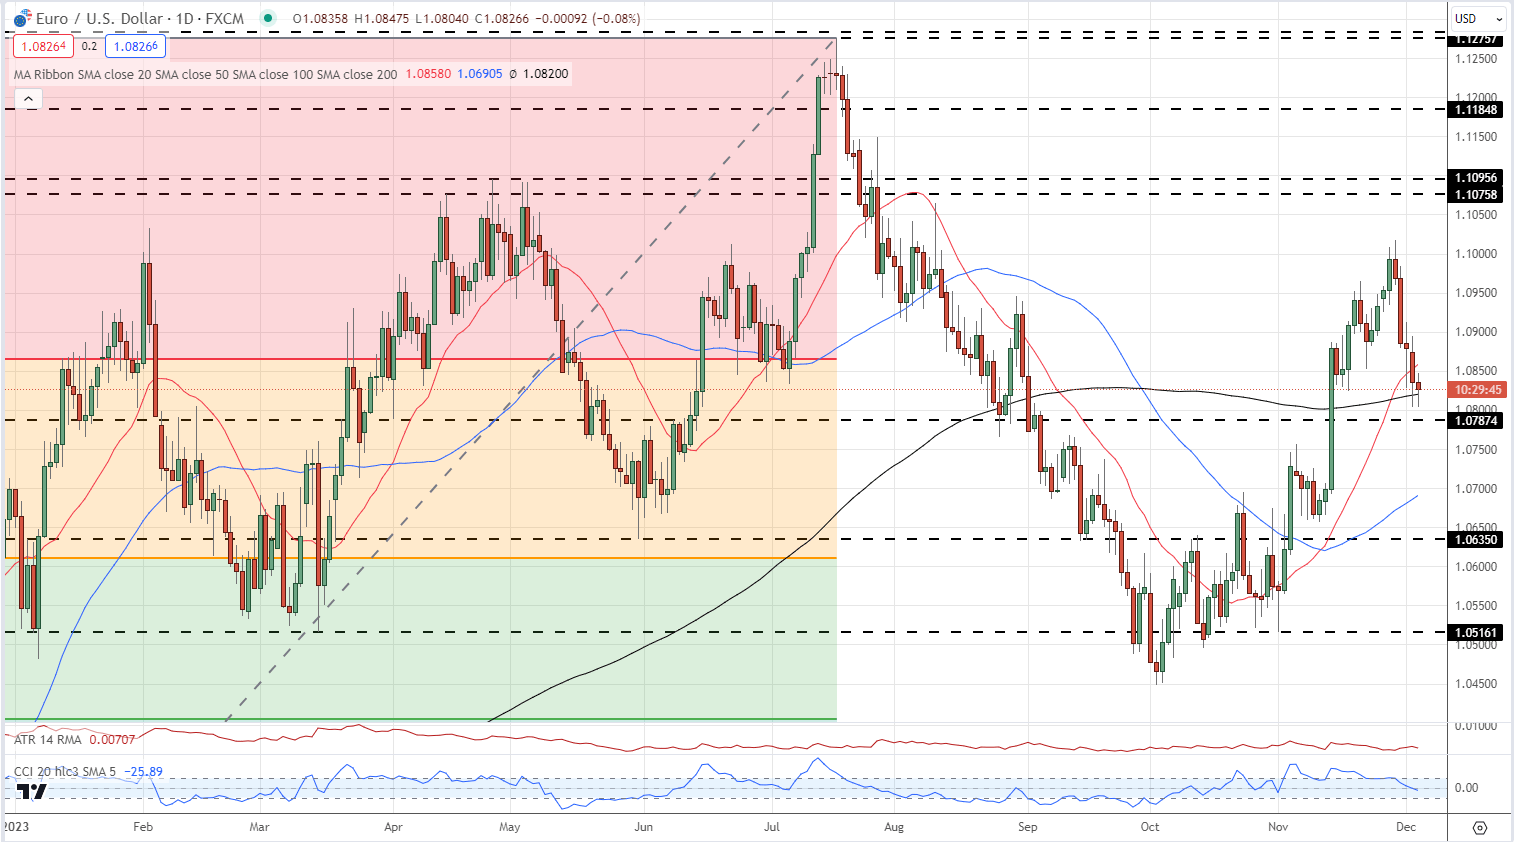
EUR/USD is also moving lower, despite growing rate cut expectations in the US. The pair currently trade a fraction above the 200-day simple moving average and a break below would see EUR/USD trading with a 1.07 handle. Support is seen at 1.0787 before 1.0750 comes into view.

EUR/USD Daily Chart

image3.png

All Charts via TradingView

IG Retail trader data 50.01% of traders are net-long with the ratio of traders long to short at 1.00 to 1.The number of traders net-long is 5.19% higher than yesterday and 24.92% higher than last week, while the number of traders net-short is 1.77% higher than yesterday and 25.16% lower than last week.