Silver price today: Silver rises

Silver price today: Silver rises

Silver prices (XAG/USD) rose on Tuesday, according to FXStreet data. Silver trades at $34.18 per troy ounce, up 1.48% from the $33.68 it cost on Monday.

Silver prices have increased by 43.64% since the beginning of the year.

Unit measure Silver Price Today in USD
Troy Ounce 34.18
1 Gram 1.10

The Gold/Silver ratio, which shows the number of ounces of Silver needed to equal the value of one ounce of Gold, stood at 80.59 on Tuesday, down from 81.42 on Monday.

Mexican Peso edges higher as market turns risk-on

Mexican Peso edges higher as market turns risk-on

The Mexican Peso (MXN) edges higher on Tuesday, rising by about a quarter of a percent across its most-heavily traded pairs. Positive risk appetite during the US sessions on Monday, which led to further gains for the S&P 500 stock index, may have been a factor supporting the Peso since this tends to benefit emerging market currencies.

A revival of carry trade inflows might be a further factor providing support for the Mexican Peso. This involves traders borrowing in a currency with low interest rates such as the Japanese Yen (JPY) and purchasing a currency with high interest rates such as the Mexican Peso. The difference between the interest earned on the Peso investment and that paid on the Yen loan represents the profit discounting fluctuations in the exchange rate.

The outlook for the Japanese Yen (JPY) is not looking bright after the weekend elections saw the ruling Liberal Democratic Party (LDP) coalition lose its grip on power. Opposition parties are generally against raising interest rates in Japan, which is weighing on the Yen and making the carry trade more attractive. Overnight, Yuichiro Tamaki, leader of the Japan Democratic Party for the People (DPP), said he was opposed to further rate hikes by the Bank of Japan (BoJ).

Mexican Peso impacted by political risk

The Mexican Peso may also be finding support after the news that the Mexican Supreme Court Judge, Juan Luis González Alcántara Carrancá, a staunch opponent of the controversial judicial reforms the Sheinbaum administration is trying to implement, attempted a new tactic to block their implementation. The reforms enable the election of judges rather than their appointment, but Carrancá, argued on Monday, that the creation of the “Evaluation Committees” used to short-list candidates for elections in the first step, was unconstitutional in itself, according to El Financiero.

For context, the Peso depreciated over 10% in value after the June election in which Sheinbaum and her Morena party coalition gained a super majority in the Mexican Congress. Many western investors fretted over the consequences of the result since it would enable the new government to make radical reforms to the constitution, which critics viewed as market unfriendly.

On the data front, the Peso sees a busy week ahead, especially with Mexican preliminary Gross Domestic Product (GDP) data for Q3 and the Fiscal Balance out on Wednesday,  and the Jobless Rate on Friday.

Recently, the International Monetary Fund (IMF) downgraded its forecasts for growth for the Mexican economy to 1.5% in 2024. GDP grew a robust 2.1% YoY in Q2, but corroboration of the IMF’s gloomy assessment from weak Q3 GDP data might weigh on the Peso.

Technical Analysis: USD/MXN unfolding leg higher

USD/MXN broadly continues unfolding a leg higher after a mild pullback. The up leg is probably the “c wave” of a bullish “abc” pattern, which began at the October 14 swing low. It will probably reach the Fibonacci 61.8% of the length of wave “a”, giving an upside target of 20.29. Such a move would gain confirmation from a break above the high of wave “b” at 20.09.

USD/MXN Daily Chart
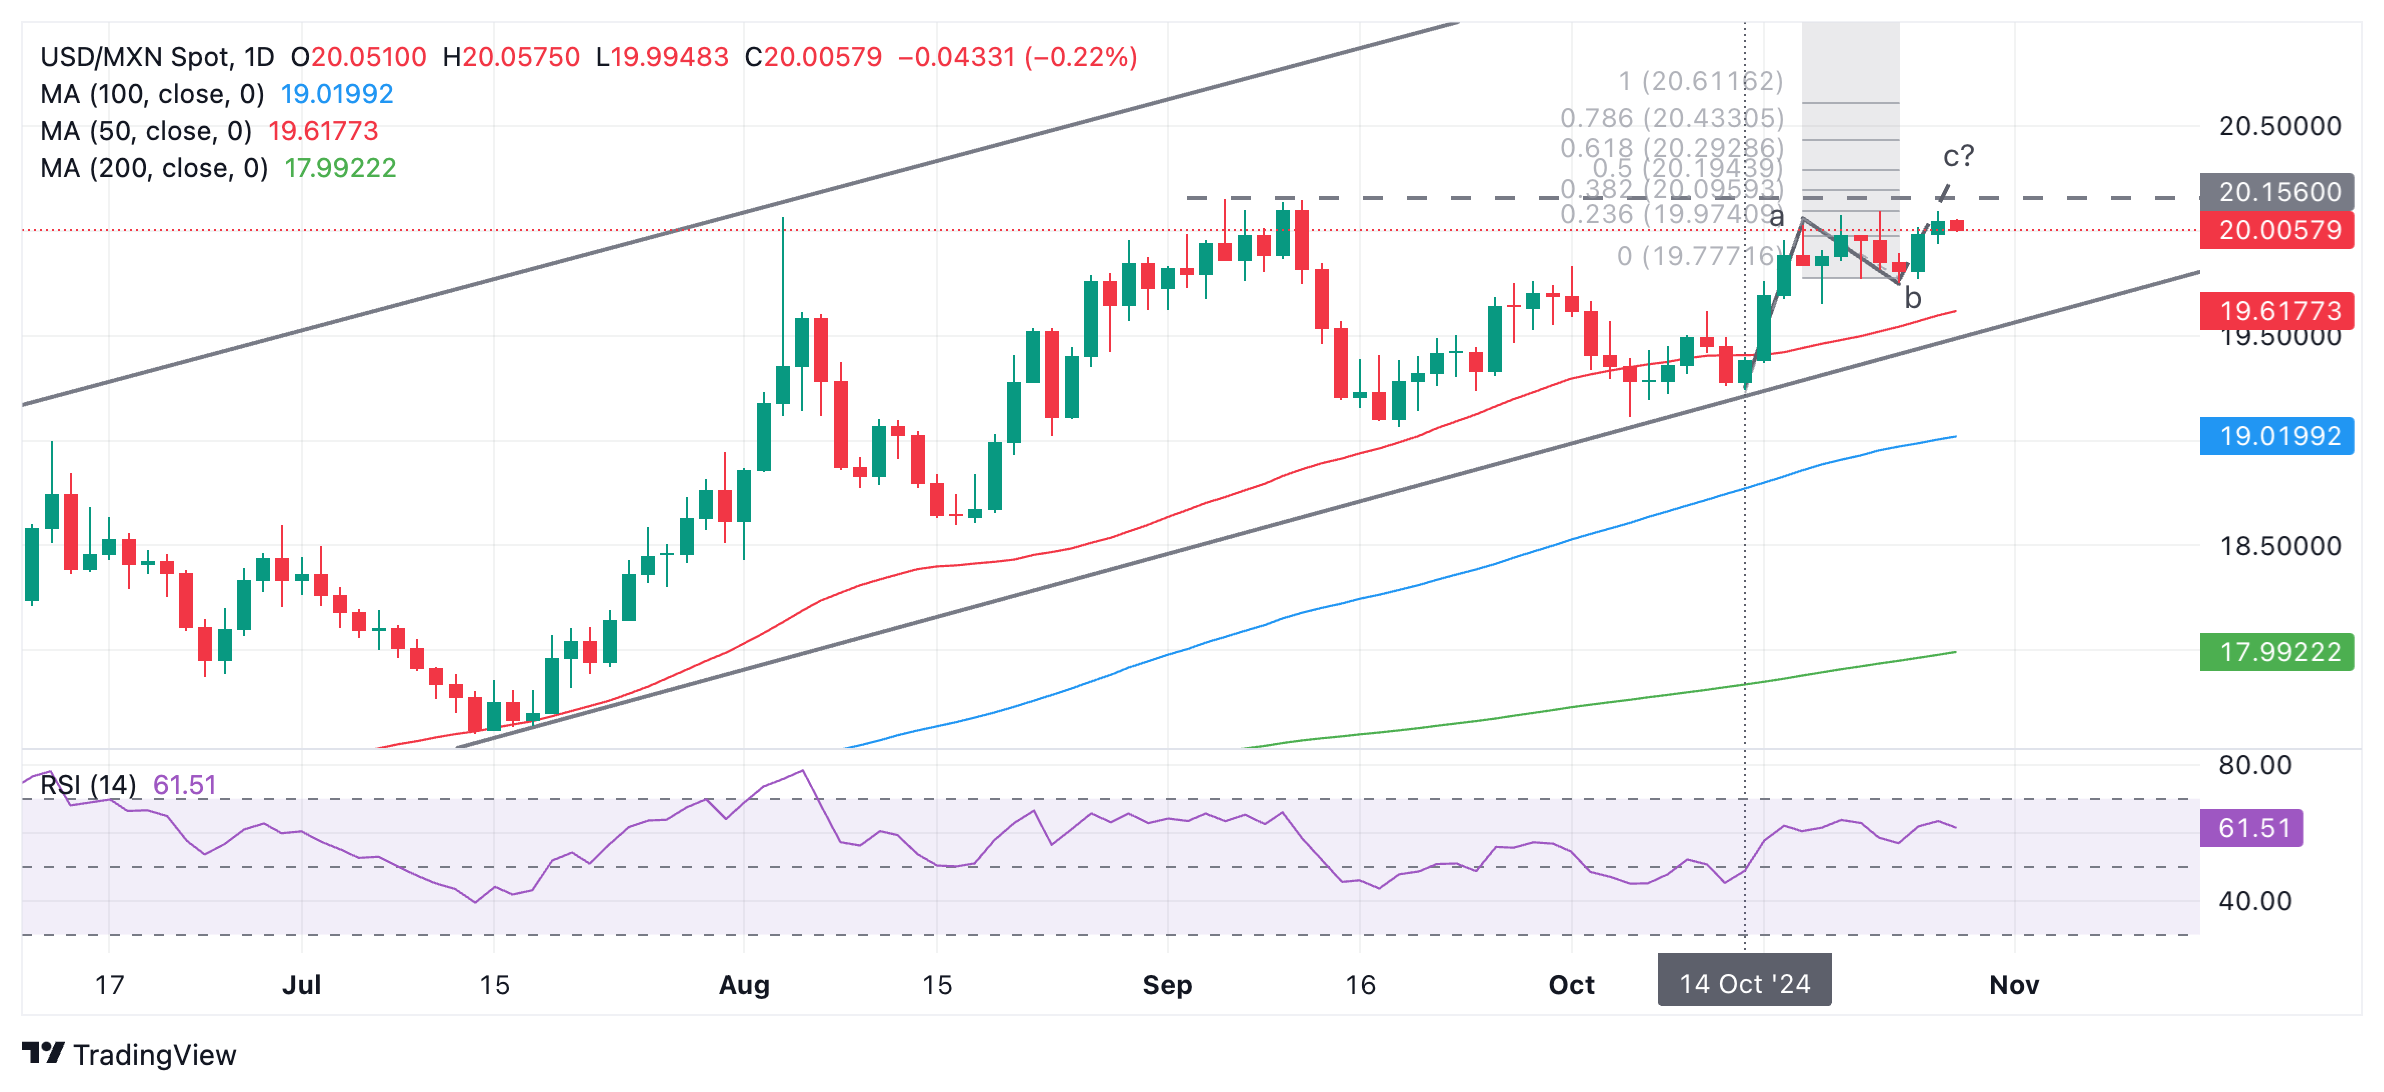
USD/MXN is probably in an uptrend on a short, medium and long-term basis and is trading in a rising channel. Given the technical dictum “the trend is your friend,” the odds favor a continuation higher.

In addition, the original break above 19.83 (October 1 high) has already confirmed a probable move up, with a target in the vicinity of the September 10 high at 20.13.


Pound Sterling consolidates with UK budget on the horizon

Pound Sterling consolidates with UK budget on the horizon

The Pound Sterling (GBP) exhibits a subdued performance against its major peers on Tuesday. The British currency trades cautiously ahead of the United Kingdom (UK) Autumn Forecast Statement, which will be unveiled on Wednesday. This will be the first budget announcement by a Labor government in over 15 years.

UK Chancellor of the Exchequer Rachel Reeves is expected to raise taxes and increase public spending as suggested by Prime Minister Keir Starmer in his speech at Birmingham on Monday, reported by BBC News. The government would take “tough decisions,” opting to raise taxes in order to “prevent austerity and rebuild public services,” Starmer said.

Meanwhile, Rachel Reeves discussed the need to spend heavily on the National Health Service (NHS) in order to improve medical facilities, Reuters reported. “I am putting an end to the neglect and underinvestment (the NHS) has seen for over a decade now”, Reeves said.

Market participants will keenly focus on the overall spending plans as these will influence the Bank of England’s (BoE) interest rate path. According to a Reuters poll, the BoE is all set to cut interest rates by 25 basis points (bps) to 4.75% in its monetary policy meeting on November 7. This will be the BoE’s second interest rate cut this year. The central bank left its key borrowing rates unchanged at 5% in its last policy meeting in September.

Daily digest market movers: Pound Sterling traces US Dollar’s sideways performance

  • The Pound Sterling trades in a tight range below the psychological resistance of 1.3000 against the US Dollar (USD) in Tuesday’s London session. The GBP/USD pair consolidates as investors await a slew of United States (US) economic data, which will provide cues about the direction of the Federal Reserve’s (Fed) monetary policy by the year-end.
  • This week, investors will mainly focus on the first estimate of the Q3 Gross Domestic Product (GDP), the Personal Consumption Expenditure Price Index (PCE), the Nonfarm Payrolls (NFP), and the ISM Manufacturing Purchasing Managers’ Index (PMI) data to understand the current status of economic growth and inflation.
  • Meanwhile, recent commentaries from an array of Fed officials have shown that they are more worried about downside risks to economic growth, with firm confidence that inflation remains on track toward the bank’s target of 2%.
  • If the data to be published later this week show signs of robust economic expansion and upbeat labor demand, bets that the Fed will cut interest rates sharply will diminish. On the contrary, Fed rate cut bets would strengthen if the data points to slower growth and a weak job market.
  • According to the CME FedWatch tool, 30-day Federal Fund Futures pricing data shows that the central bank is expected to cut interest rates by 25 basis points (bps) in both policy meetings in November and December.
  • In Tuesday’s New York session, investors will pay close attention to the US JOLTS Job Openings data for September, which will be published at 14:00 GMT. Economists expect US employers to have posted 7.99 million job vacancies, marginally lower than the 8.04 million in August.

Technical Analysis: Pound Sterling trades below 1.3000

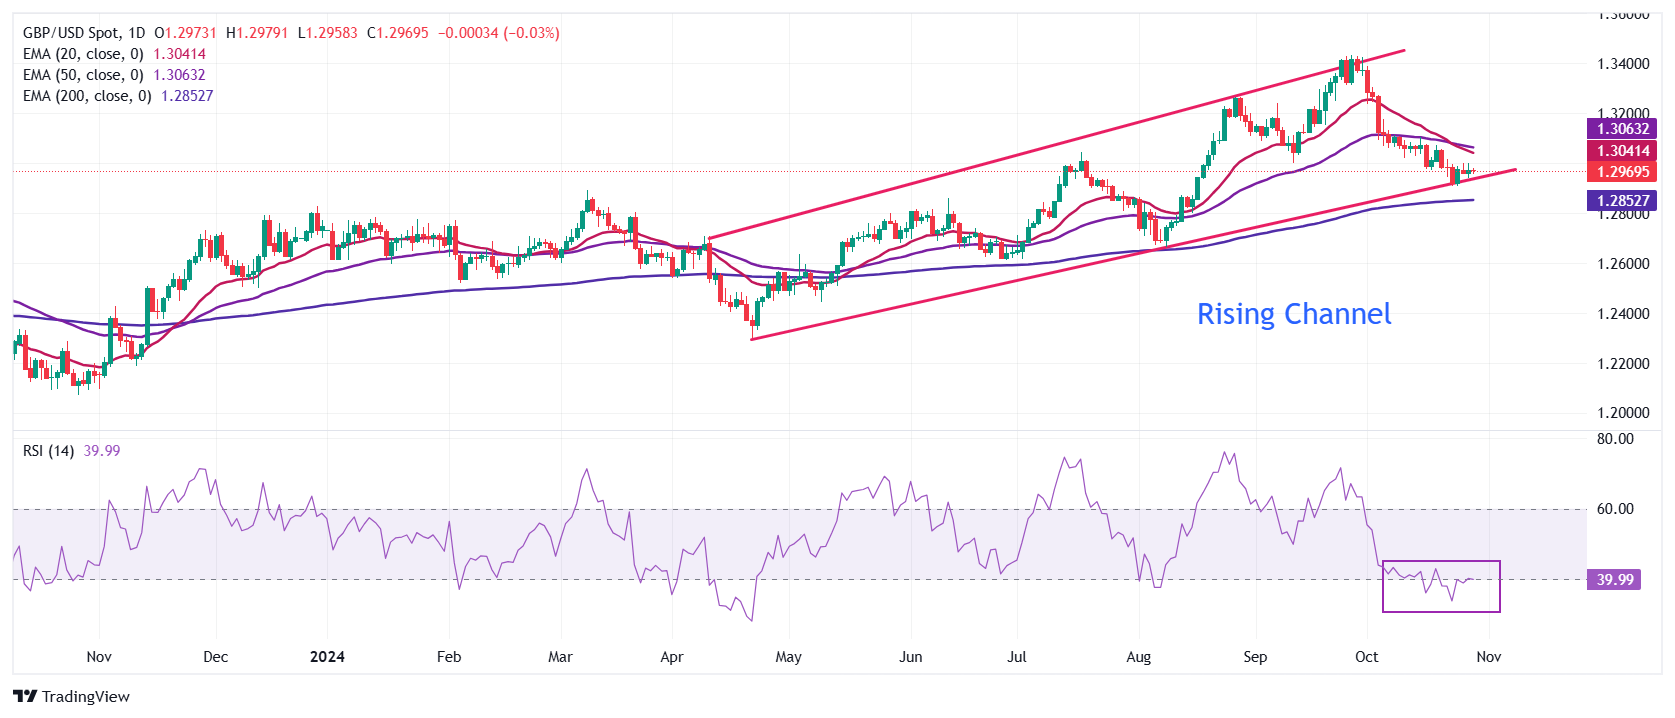
The Pound Sterling trades inside Monday’s trading range against the US Dollar (USD) in European trading hours on Monday. The GBP/USD pair remains at make or a break near the lower boundary of a Rising Channel chart formation around 1.2900 on the daily time frame.

The near-term trend of the Cable remains uncertain as it stays below the 50-day Exponential Moving Average (EMA), which trades around 1.3070.

The 14-day Relative Strength Index (RSI) rebounds to nearly 40.00. A fresh bearish momentum would trigger if it fails to climb above it.

Looking down, the 200-day EMA near 1.2845 will be a major support zone for Pound Sterling bulls. On the upside, the Cable will face resistance near the 20-day EMA around 1.3060.

AUD/USD: To continue to decline to 0.6560

AUD/USD: To continue to decline to 0.6560

Oversold decline in Australian Dollar (AUD) could extend to 0.6560 before stabilisation can be expected. In the longer run, potential for AUD to continue to decline to 0.6560, possibly 0.6520, UOB Group’s FX analysts Quek Ser Leang and Lee Sue Ann note.

AUD can slide towards 0.6520

24-HOUR VIEW: “We expected AUD to ‘decline further’ yesterday. We pointed out that ‘the significant support level at 0.6585 might not be easy to break.’ However, AUD broke below 0.6585, reaching a low of 0.6580. AUD closed on a soft note at 0.6583 (-0.33%). While oversold, the decline could extend to 0.6560 before stabilisation can be expected. A sustained break below 0.6560 is unlikely today. Resistance is at 0.6600; a breach of 0.6615 would mean that the weakness has stabilised.”

1-3 WEEKS VIEW: “In our most recent narrative from last Thursday (24 Oct, spot at 0.6635), we highlighted that AUD ‘is expected to continue to decline, and the level to watch is a significant support at 0.6585.’ Yesterday (Monday), AUD broke below 0.6585 (low has been 0.6580). While oversold, the weakness is not showing signs of stabilisation just yet. Only a breach of 0.6640 (‘strong resistance’ previously at 0.6670) would mean that the weakness that started early this month (as annotated in the chart below) has stabilised. Until then, there is potential for AUD to continue to decline to 0.6560, possibly 0.6525.”

Speculative shorts on JPY are rising further

Speculative shorts on JPY are rising further

The Japanese Yen (JPY) is playing the outlier role, being the developed currency with the greatest influence from domestic events, OCBC’s FX analysts Frances Cheung and Christopher Wong note.

Risks of further JPY near-term selling remain elevated

“Speculative shorts on JPY are rising further after the ruling coalition lost parliament majority: now, the focus is back on the level at which authorities will want to put a stop to the USD/JPY rally. Remember that the latest round of FX intervention was initiated right after a JPY-positive market event.”

“Following a similar script, the Minister of Finance may not have a line in the sand for the pair (for example 155.0), but perhaps adopt a more opportunistic approach based on market moves. Anyway, risks of further JPY near-term selling remain elevated into Thursday’s Bank of Japan meeting and the US election next week.”

Japanese Yen slides back closer to mid-153.00s against USD, ahead of US macro data

Japanese Yen slides back closer to mid-153.00s against USD, ahead of US macro data

The Japanese Yen (JPY) attracts fresh sellers following an intraday uptick and slides closer to mid-153.00s against its American counterpart during the first half of the European session on Tuesday. Comments from Japan’s Democratic Party for the People (DPP) leader Yuichiro Tamaki earlier today added to the uncertainty over the Bank of Japan’s (BoJ) ability to hike interest rates further. This, along with a generally positive tone around the European equity markets, undermines the safe-haven JPY.

Apart from this, the emergence of some US Dollar (USD) dip-buying turns out to be another factor behind the USD/JPY pair’s goodish intraday rise of around 65 pips from the 152.75 region. However, speculations that Japanese authorities will intervene in the markets to prop up the domestic currency could help limit deeper JPY losses. Trades might also prefer to wait on the sidelines ahead of the highly-anticipated BoJ policy decision and important US macro releases due this week.

Technical Outlook: USD/JPY is likely to accelerate the positive move once the 154.00 mark is cleared decisively

From a technical perspective, last week’s breakout through the 150.65 confluence – comprising the 100-day Simple Moving Average (SMA) and the 50% Fibonacci retracement level of the July-September downfall – was seen as a fresh trigger for bulls. That said, the overnight failure to find acceptance or build on the momentum beyond the 61.8% Fibo. level warrants some caution. Moreover, the Relative Strength Index (RSI) on the daily chart remains close to the overbought zone, making it prudent to wait for some near-term consolidation or a further pullback before positioning for further gains.

Any subsequent slide, however, is likely to attract some dip-buyers and remain limited near the overnight swing low, around the 152.65 region. Some follow-through selling, however, could drag the USD/JPY pair to the 152.00 mark en route to the 151.45 support and the 151.00 mark. The downward trajectory could extend further towards challenging the 150.65 confluence resistance breakpoint, which should now act as a key pivotal point and a strong base for spot prices.

On the flip side, the 154.00 mark could offer some resistance ahead of the 154.35-154.40 supply zone. Some follow-through buying should pave the way for a move towards reclaiming the 155.00 psychological mark, above which the USD/JPY pair seems all set to test the late-July swing high, around the 155.20 region.

GBP/USD: Downward momentum is slowing

GBP/USD: Downward momentum is slowing

The Pound Sterling (GBP) is expected to trade in a sideways range of 1.2940/1.2995. In the longer run, downward momentum is slowing; should GBP break above 1.3000, it would indicate that GBP is not declining further, UOB Group’s FX analysts Quek Ser Leang and Lee Sue Ann note.

GBP has a chance of breaking above 1.3000

24-HOUR VIEW: “We expected GBP to trade sideways between 1.2930 and 1.2990 yesterday. It subsequently traded in a higher range of 1.2942/1.3001, closing largely unchanged at 1.2972. The price action still appears to be part of a sideways trading phase. Today, we expect GBP to trade in a 1.2940/1.2995 range.”

1-3 WEEKS VIEW: “Yesterday (28 Oct, spot at 1.2960), we indicated that ‘downward momentum is slowing, and should GBP break above 1.3000 (‘strong resistance’ level), it would indicate that GBP is not declining further.’ In NY trading, GBP rose briefly to 1.3001, pulling back to close little changed at 1.2972 (+0.09%). As our ‘strong resistance’ has not been clearly breached, we will continue to hold the same view for now. That said, the likelihood for GBP to decline further is not high.”

NZD/USD Price Forecast: Falls toward 0.5950 within the descending channel

NZD/USD Price Forecast: Falls toward 0.5950 within the descending channel

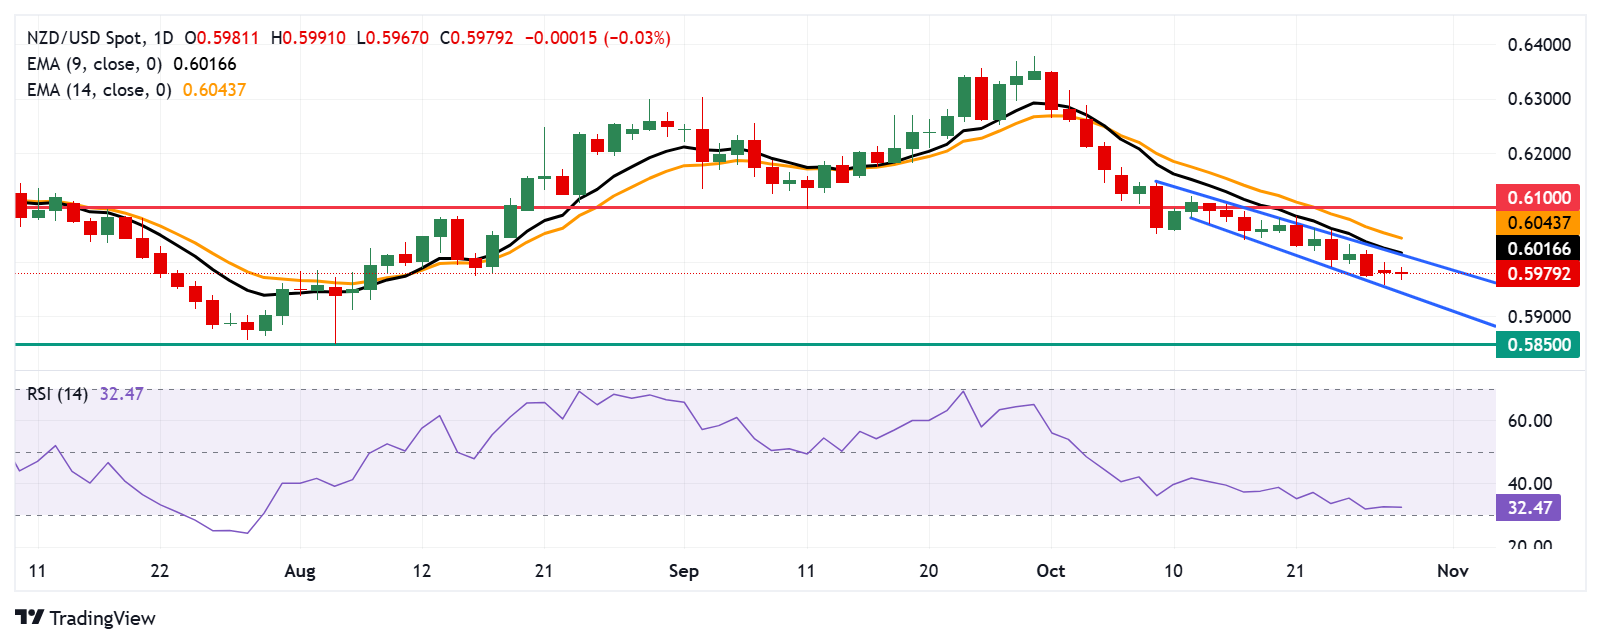
The NZD/USD pair continues its losing streak for a third consecutive session, trading near 0.5980 during Tuesday’s European session. Daily chart analysis indicates the pair moves downward within a descending channel pattern, signaling a bearish bias.

Furthermore, the nine-day Exponential Moving Average (EMA) is positioned below the 14-day EMA, reinforcing the ongoing bearish trend for the NZD/USD pair. Short-term price momentum remains weak, suggesting that downward pressure may persist.

The 14-day Relative Strength Index (RSI), a key momentum indicator, currently sits just above the 30 level. Should it fall below this threshold, it would indicate an oversold condition, potentially signaling a forthcoming upward correction for the NZD/USD pair.

On the downside, the NZD/USD pair may target the lower boundary of the descending channel near the 0.5940 level. A break below this support level could push the pair toward the “pullback support” around 0.5850.

For resistance, the initial hurdle lies at the upper boundary of the descending channel, near the nine-day Exponential Moving Average (EMA) around 0.6016, followed by the 14-day EMA at 0.6043. A sustained break above these EMAs could shift the pair toward a short-term bullish bias, potentially setting up a move toward the psychological 0.6100 level.

NZD/USD: Daily Chart

New Zealand Dollar PRICE Today

The table below shows the p

EUR/USD stays sidelined near 1.0800 ahead of key US data

EUR/USD stays sidelined near 1.0800 ahead of key US data

EUR/USD is trading sidelined near 1.0800 in the European morning on Tuesday. A pause in the US Dollar correction amid sluggish Treasury bond yields and a cautious market mood undermine the pair ahead of top-tier US economic data releases.

EUR/USD was last seen trading slightly above the upper limit of the descending regression channel coming from late September. Meanwhile, the Relative Strength Index (RSI) indicator on the 4-hour chart moves sideways at around 50, reflecting the pair’s indecisiveness.

On the upside, 1.0830 (static level) aligns as interim resistance before 1.0870 (200-day Simple Moving Average) and 1.0900 (round level). In case the pair retreats below 1.0800 (round level) and starts using this level as resistance, 1.0750 (mid-point of the descending channel) and 1.0700 (lower limit of the descending channel) could be seen as next support levels.

EUR/USD moves sideways slightly above 1.0800 early Tuesday after managing to post small daily gains on Monday. The pair’s technical outlook highlights a neutral stance in the near term.

The US Dollar (USD) started the week on a bullish note but failed to preserve its strength in the second half of the day as investors refrained from taking large positions in the absence of fundamental drivers.

Meanwhile, European Central Bank (ECB)  Vice President Luis de Guindos said late Monday that the central bank has made significant progress in bringing down inflation but added that they can’t declare victory just yet. Speaking again early Tuesday, de Guindos noted that they will keep all options open at forthcoming policy meetings.

The US Bureau of Labor Statistics will publish JOLTS Job Openings data for September later in the day. Markets expect the number of job openings to stand at 7.99 million, down slightly from 8.04 million announced in August. A significant upside surprise, with a reading of 8.5 million or higher, could boost the USD with the immediate reaction and weigh on the pair. On the other hand, a print of 7.5 million or lower could have the opposite impact on the USD’s valuation.

The US economic calendar will also feature the Conference Board’s Consumer Confidence Index data for October. Ahead of the Gross Domestic Product (GDP) and Nonfarm Payrolls (NFP) releases later in the week, the market reaction to Tuesday’s data could remain short-lived.

DXY: Bullish momentum but overbought

DXY: Bullish momentum but overbought

US Dollar (USD) rose, alongside the rise in UST yields. Dollar Index (DXY) was last at 104.26 levels. US data, including durable goods orders, Uni of Michigan sentiment surprised to the upside, OCBC’s FX analysts Frances Cheung and Christopher Wong note.

Daily momentum remains bullish

“RSI eased lower from overbought conditions. While the recent run up continues to look stretched technically, the move higher may still extend in the interim. That said, we do also caution that the subsequent snapback may also be sharp, on any triggers or data surprises. Resistance at 104.60 (61.8% fibo), 105.20 levels. Support at 103.80 levels (200 DMA, 50% fibo), 102.90/103.20 levels (21, 100 DMAs, 38.2% fibo retracement of 2023 high to 2024 low) and 101.90 (50 DMA).”

“This week marks the start of a busy, eventful 2 weeks with JOLTS job openings, consumer sentiment (Tuesday); ADP employment (Wednesday); core PCE (Thursday) and NFP (Friday) before US elections (5 November) and FOMC (7 November) the following week. Between now and then, we should see 2-way trades in USD.”

“While top side may look stretched technically, any pullback may also be shallow due to interests to buy USD (proxy for Trump hedges) ahead of US elections. Traditional polls remain too close to call while prediction market pointed to Trump lead.”