EUR/USD rises as traders brace for crucial data this week for both Eurozone, US

EUR/USD rises as traders brace for crucial data this week for both Eurozone, US

EUR/USD rises slightly above 1.0800 in European trading hours on Monday. The major currency pair broadly remains sideways ahead of a data-packed week in which traders will get economic growth and inflation data for both the United States (US) and the Eurozone, two key metrics that usually determine the path of interest rates, a crucial driver for currencies.

In the Eurozone, investors are likely to pay closer attention to the economic growth data because inflation is expected to remain near the European Central Bank’s (ECB)  target of 2%. Economists expect the Eurozone economy to have grown by 0.8% on year, higher than the 0.6% expansion seen in the second quarter. When compared with 2Q 2024, economists expect the Eurozone to have grown by 0.2% in Q3, the same pace as the previous quarter.

A major contribution to the Eurozone economy is expected to have come from Spain and other economies as the economy of its largest nation, Germany, is forecasted to have declined by 0.3% in Q3 compared with the same quarter a year earlier.

At the sidelines of the International Monetary Fund (IMF) meeting last week, ECB policymaker and President of the Deutsche Bundesbank Joachim Nagel emphasized the need to implement the growth package, which has already been announced by the German government, to prevent the economy from getting worse.

“This would make an important contribution to strengthening the forces of growth. But anything that could go beyond that in 2025 would certainly be welcome from the central bank point of view,” Nagel said, Reuters reported.

On the interest rate outlook, Nagel said: “We shouldn’t be too hasty,” adding that the decision in December will be based on a slew of indicators such as the US presidential election outcome and inflation data. His comments came after a few ECB officials had supported a larger-than-usual 50-basis points (bps) interest rate cut in December.

Technical Analysis: EUR/USD holds above 1.0750
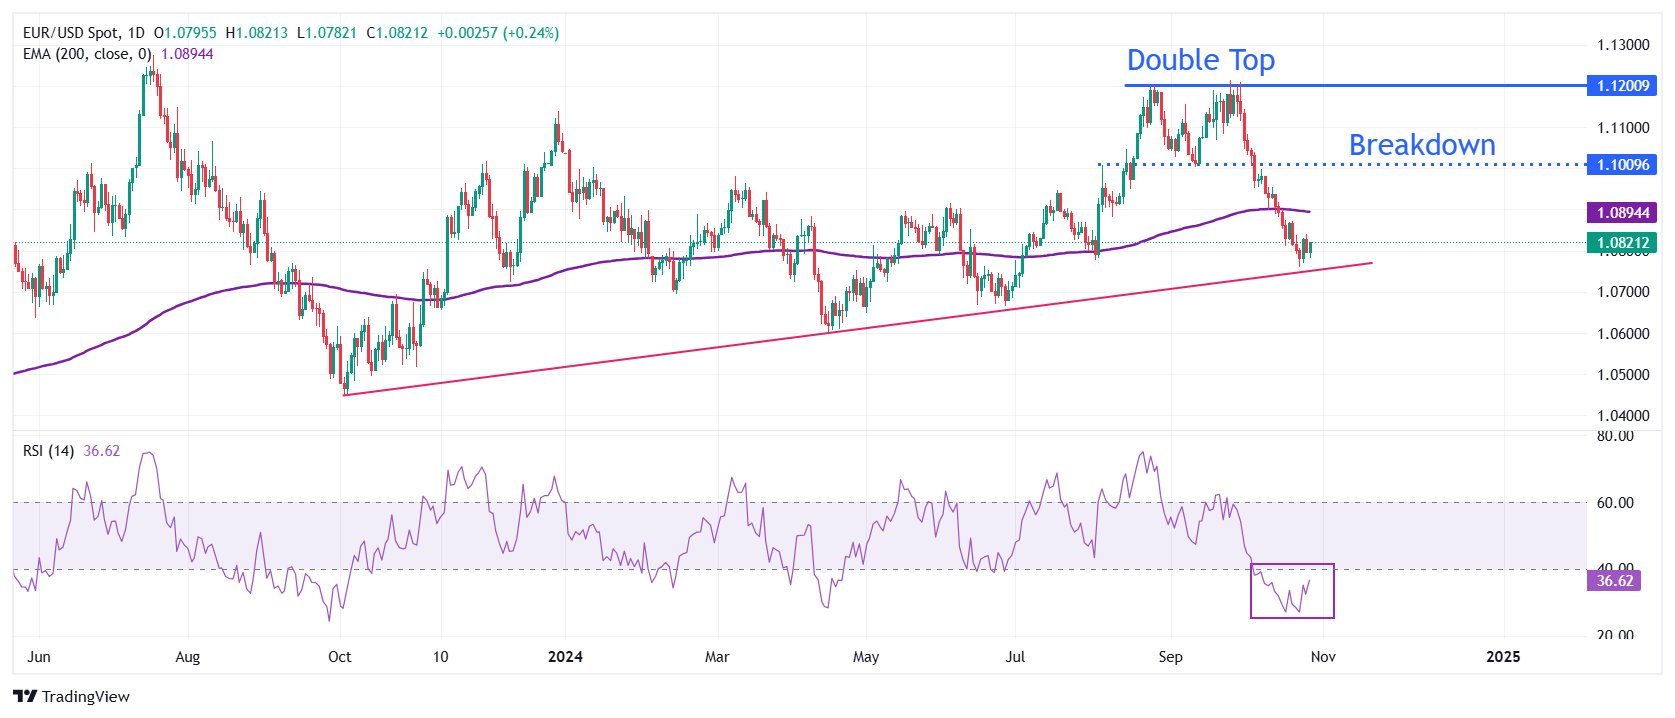
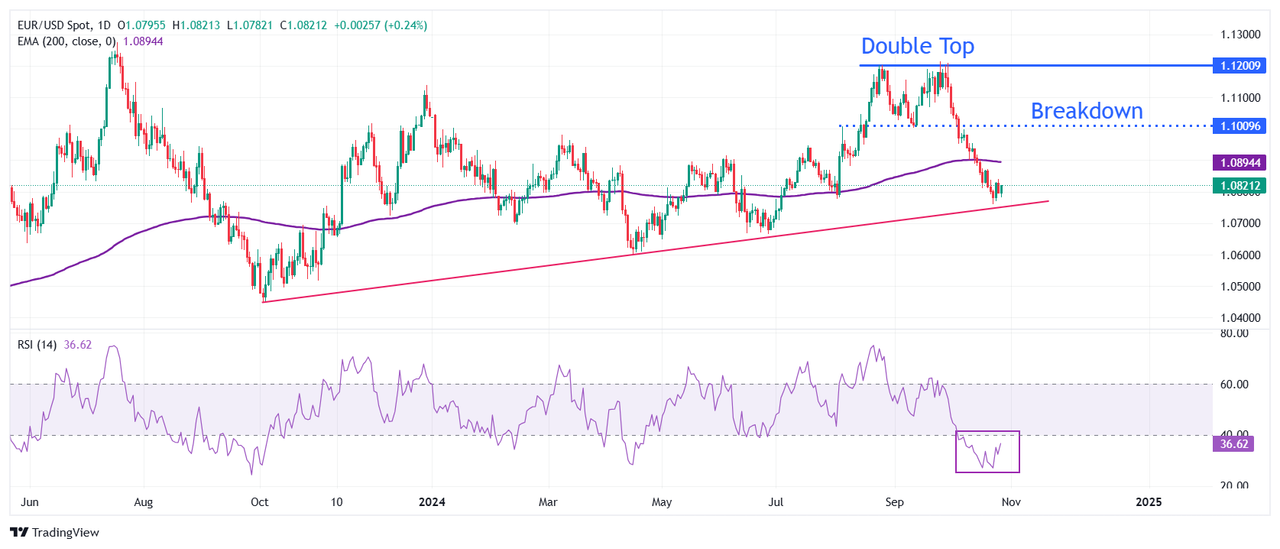
EUR/USD continues to hold above the upward-sloping trendline near 1.0750, which is plotted from the October 3, 2023, low at around 1.0450 on the daily time frame. However, the outlook of the major currency pair remains downbeat as it stays below the 200-day Exponential Moving Average (EMA), which trades around 1.0900.

The downside move in the shared currency pair started after a breakdown of a Double Top formation on the daily time frame near the September 11 low at around 1.1000, which resulted in a bearish reversal.

The 14-day Relative Strength Index (RSI) remains in the 20.00-40.00 range, indicating a strong bearish momentum.

On the downside, the major pair could see more weakness towards the round-level support of 1.0700 if it slips below 1.0750. Meanwhile, the 200-day EMA near 1.0900, and the psychological figure of 1.1000 emerge as key resistances.


GBP/USD: Set to break above 1.3000

GBP/USD: Set to break above 1.3000

The Pound Sterling (GBP) is expected to trade sideways between 1.2930 and 1.2990. In the longer run, downward momentum is slowing; should GBP break above 1.3000, it would indicate that GBP is not declining further, UOB Group’s FX analysts Quek Ser Leang and Lee Sue Ann note.

GBP expected to trade between 1.2930 and 1.2990

24-HOUR VIEW: “GBP traded sideways between 1.2959 and 1.2998 last Friday, narrower than our expected range of 1.2930/1.3000. The price action did not result in an increase in either downward or upward momentum. Today, GBP is expected to continue to trade sideways, probably between 1.2930 and 1.2990.”

1-3 WEEKS VIEW: “In our most recent narrative from last Thursday (24 Oct, spot at 1.2915), we indicated that ‘The price action indicates GBP could decline further to 1.2860.’ Since then, GBP has not been able to make further headway on the downside. Downward momentum is slowing, and should GBP break above 1.3000 (no change in ‘strong resistance’ level), it would indicate that GBP is not declining further.”

EUR/USD extends gains above 1.0800 amid risk appetite

EUR/USD extends gains above 1.0800 amid risk appetite

EUR/USD has regained traction above 1.0800 in European trading on Monday. The pair is finding fresh demand amid a modest pullback in the US Dollar and persisting risk flows. However, elevated US Treasury yields and dovish ECB bets cap the pair’s upswing.

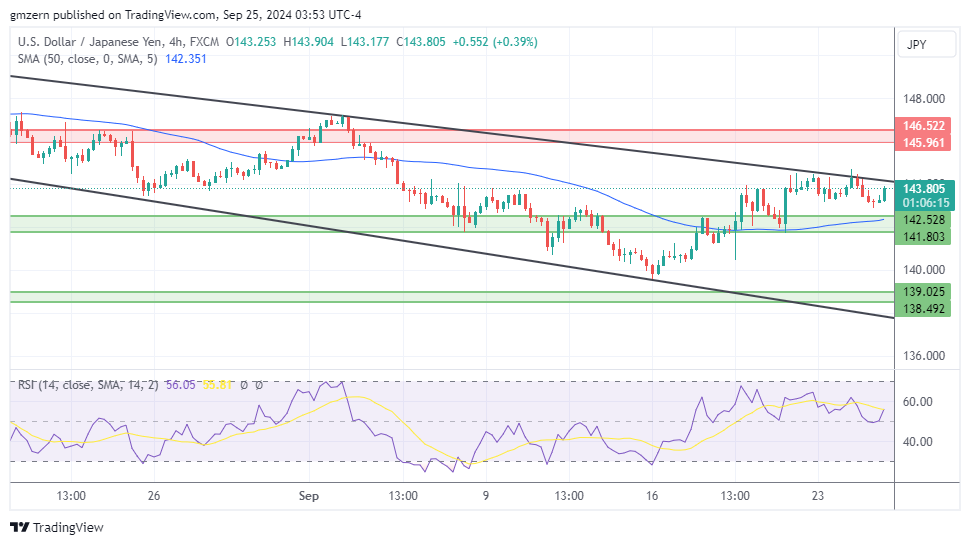
EUR/USD was last seen trading near the upper limit of the descending regression channel coming from late September, currently located at 1.0800. Once the pair rises above this level and confirms it as support, technical buyers could show interest. In this scenario, the 50-period Simple Moving Average (SMA) on the 4-hour chart could act as interim resistance at 1.0830 before 1.0870 (200-day SMA).

On the downside, 1.0760 (mid-point of the descending channel) aligns as first support ahead of 1.0710-1.0700 (lower limit of the descending channel, static level).

In the meantime, the Relative Strength Index (RSI) indicator on the 4-hour chart rises toward 50, reflecting sellers’ hesitancy.

EUR/USD holds its ground and trades in a narrow channel at around 1.0800 after closing the fourth consecutive week in negative territory. The positive shift seen in risk mood could help the pair edge higher in the second half of the day.

The US Dollar (USD) preserved its strength heading into the weekend and forced EUR/USD to stay on the back foot. Rising US Treasury bond yields helped the currency find demand on Friday.

Early Monday, US stock index futures rise between 0.5% and 0.7%. A bullish opening in Wall Street, followed by a risk rally, could weigh on the USD and open the door for an extended EUR/USD rebound in the American session on Monday.

The only data featured in the US economic calendar will be the Federal Reserve Bank of Dallas’ Texas Manufacturing Business Index, which is unlikely to trigger a noticeable market reaction. Later in the week, third-quarter Gross Domestic Product (GDP) data from Germany, the Eurozone and the US will be watched closely by market participants. On Friday, the US Bureau of Labor Statistics will release the October employment report, which will include Unemployment Rate, Nonfarm Payrolls and wage inflation figures.

Gold price keeps the red below $2,650, remains confined in a familiar trading range

Gold price keeps the red below $2,650, remains confined in a familiar trading range

Gold price (XAU/USD) trades with a negative bias for the fourth straight day on Monday, albeit it lacks follow-through selling and remains confined in a familiar range held over the past week or so amid mixed fundamental cues. Friday’s upbeat US jobs report smashed market expectations for a more aggressive policy easing by the Federal Reserve (Fed), which keeps the US Dollar (USD) elevated near a seven-week high and exerts some pressure on the non-yielding yellow metal.

Apart from this, the underlying bullish tone across the global equity markets further undermine the safe-haven Gold price. That said, any meaningful corrective decline still seems elusive in the wake of persistent geopolitical risks stemming from the ongoing conflicts in the Middle East, which tends to benefit the precious metal. Traders might also prefer to wait for this week’s release of FOMC meeting minutes on Wednesday and the US consumer inflation figures on Thursday.

Technical Outlook: Gold price needs to break below $2,635-2,630 support for bears to seize control

From a technical perspective, the range-bound price action might still be categorized as a bullish consolidation phase against the backdrop of the recent strong runup to the record peak. Moreover, oscillators on the daily chart are holding comfortably in positive territory and have also eased from the overbought zone. This, in turn, suggests that the path of least resistance for the Gold price remains to the upside and supports prospects for an eventual break to the upside. That said, it will still be prudent to wait for some follow-through buying above the $2,670-$2,672 hurdle before placing fresh bullish bets. This is followed by the $2,685-2,686 zone, or the all-time high, and the $2,700 mark, which if cleared will set the stage for an extension of a well-established multi-month-old uptrend.

On the flip side, the lower end of the aforementioned trading range, around the $2,630 area, might continue to offer immediate support to the Gold price and act as a key pivotal point for short-term traders. A convincing break below might prompt some technical selling and drag the XAU/USD below the $2,600 mark, towards the next relevant support near the $2,560 zone. The corrective decline could extend further towards the next relevant support near the $2,535-2,530 region en route to the $2,500 psychological mark.

XAG/USD bulls need to wait for close above $32.00 mark

XAG/USD bulls need to wait for close above $32.00 mark

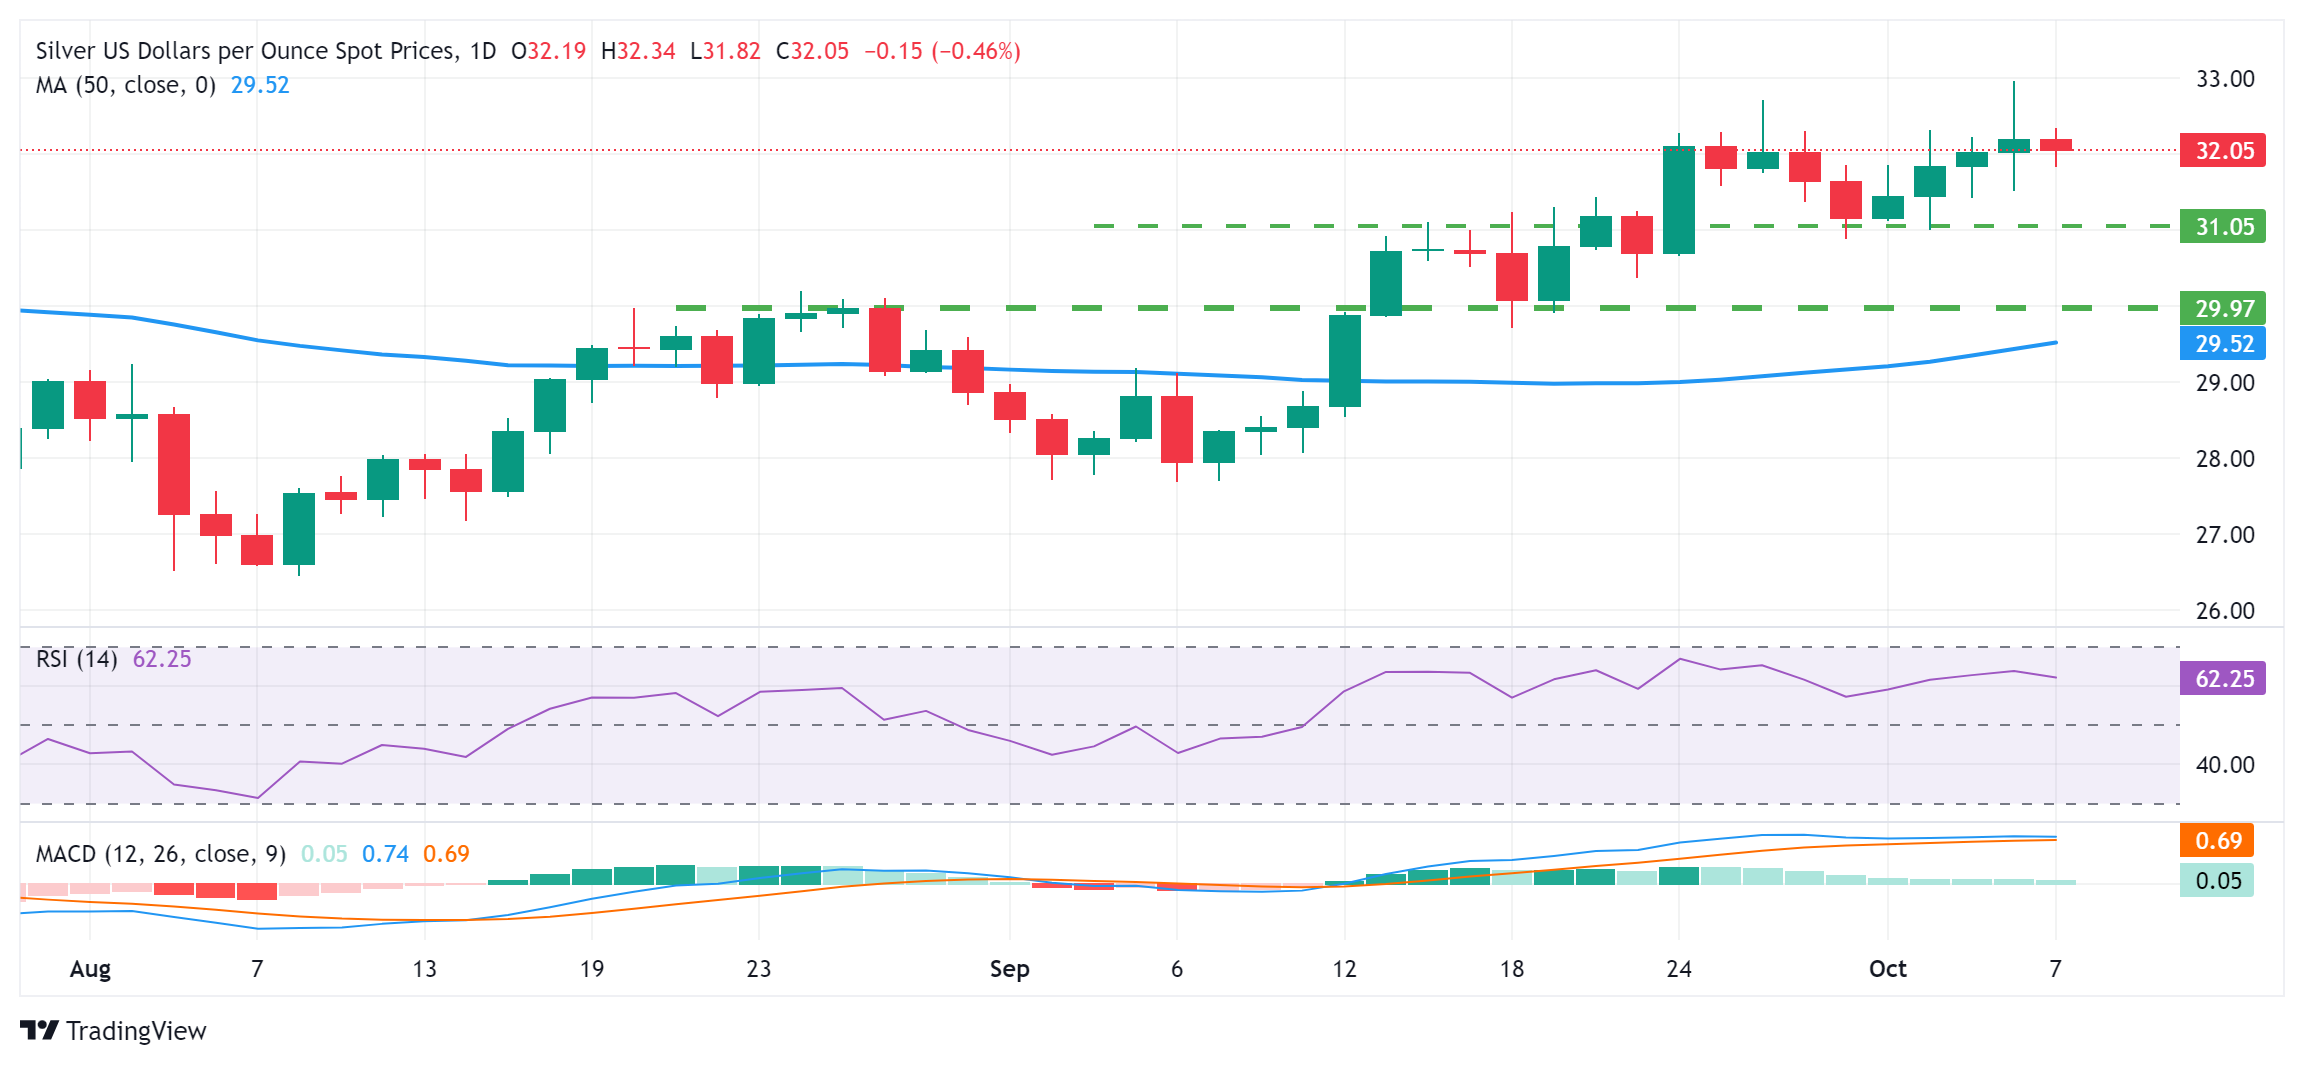
Silver (XAG/USD) kicks off the new week on a weaker note and extends Friday’s late pullback from the vicinity of the $33.00 mark, or its highest level since December 2012. The white metal remains depressed around the $32.00 round figure during the first half of the European session, though the mixed technical setup warrants some caution before placing aggressive bearish bets.

The recent repeated failures to find acceptance above the $32.00 mark constitute the formation of a bearish multiple-tops pattern on the daily chart. That said, oscillators on the daily chart are holding comfortably in positive territory and support prospects for the emergence of some dip-buying near the $31.65 area. This should limit the downside for the XAG/USD near the $31.40-$31.35 horizontal support.

The subsequent fall has the potential to drag the commodity towards the $31.00 mark. Some follow-through selling below last week’s low, around the $30.90-$30.85 area, could make the XAG/USD vulnerable to accelerate the slide further towards the $30.40-$30.35 intermediate support en route to the $30.00 psychological mark and the 50-day Simple Moving Average (SMA), around the $29.55 zone.

Meanwhile, bulls need to wait for acceptance above the $32.00 mark and a sustained strength beyond the $32.25 supply zone before positioning for an extension of a two-month-old uptrend. The XAG/USD might then make a fresh attempt to conquer the $33.00 round figure before climbing further towards the December 2012 swing high, around the $33.85 region.

Silver daily chart

fxsoriginal

EUR/USD extends gains above 1.0800 amid risk appetite

EUR/USD stays depressed toward 1.0950 ahead of EU data

The Relative Strength Index (RSI) indicator on the 4-hour chart stays above 30, suggesting that EUR/USD has more room on the downside before turning technically oversold.

Looking south, 1.1000 (Fibonacci 50% retracement of the latest uptrend) could be seen as next support before 1.0940 (Fibonacci 61.8% retracement) and 1.0900 (round level). On the upside, 1.1040 (Fibonacci 38.2% retracement) aligns as first resistance ahead of 1.1100, where the 100-period and the 200-period Simple Moving Averages (SMA) meet the Fibonacci 23.6% retracement, and 1.1150 (static level).

EUR/USD extended its slide into a fifth consecutive day on Thursday and touched its weakest level in three weeks below 1.1010. The pair struggles to stage a rebound early Friday as investors refrain from betting against the US Dollar (USD) ahead of the key September labor market data.

On Thursday, the data from the US showed that the ISM Services PMI improved to 54.9 in September from 51.5 in August. This reading surpassed the market expectation of 51.7 and showed an acceleration in the service sector’s pace of growth, supporting the USD and not allowing EUR/USD to gain traction.

Nonfarm Payrolls (NFP) in the US are forecast to rise by 140,000 in September, following the 142,000 increase recorded in August. In case the NFP reading surprises to the upside by arriving at or above 160,000, the immediate reaction could boost the USD and trigger another leg lower in EUR/USD. On the flip side, a disappointing print near or below 100,000 could open the door for a USD selloff and help EUR/USD a portion of its weekly losses heading into the weekend.

If the data arrives near the market expectation, the risk perception could drive EUR/USD’s action in the American trading hours. A risk rally fuelled by a bullish opening in Wall Street’s main indexes could force the USD to weaken against its major rivals.

AUD/USD Price Forecast: Falls back inside range signaling possible bearish reversal

AUD/USD Price Forecast: Falls back inside range signaling possible bearish reversal

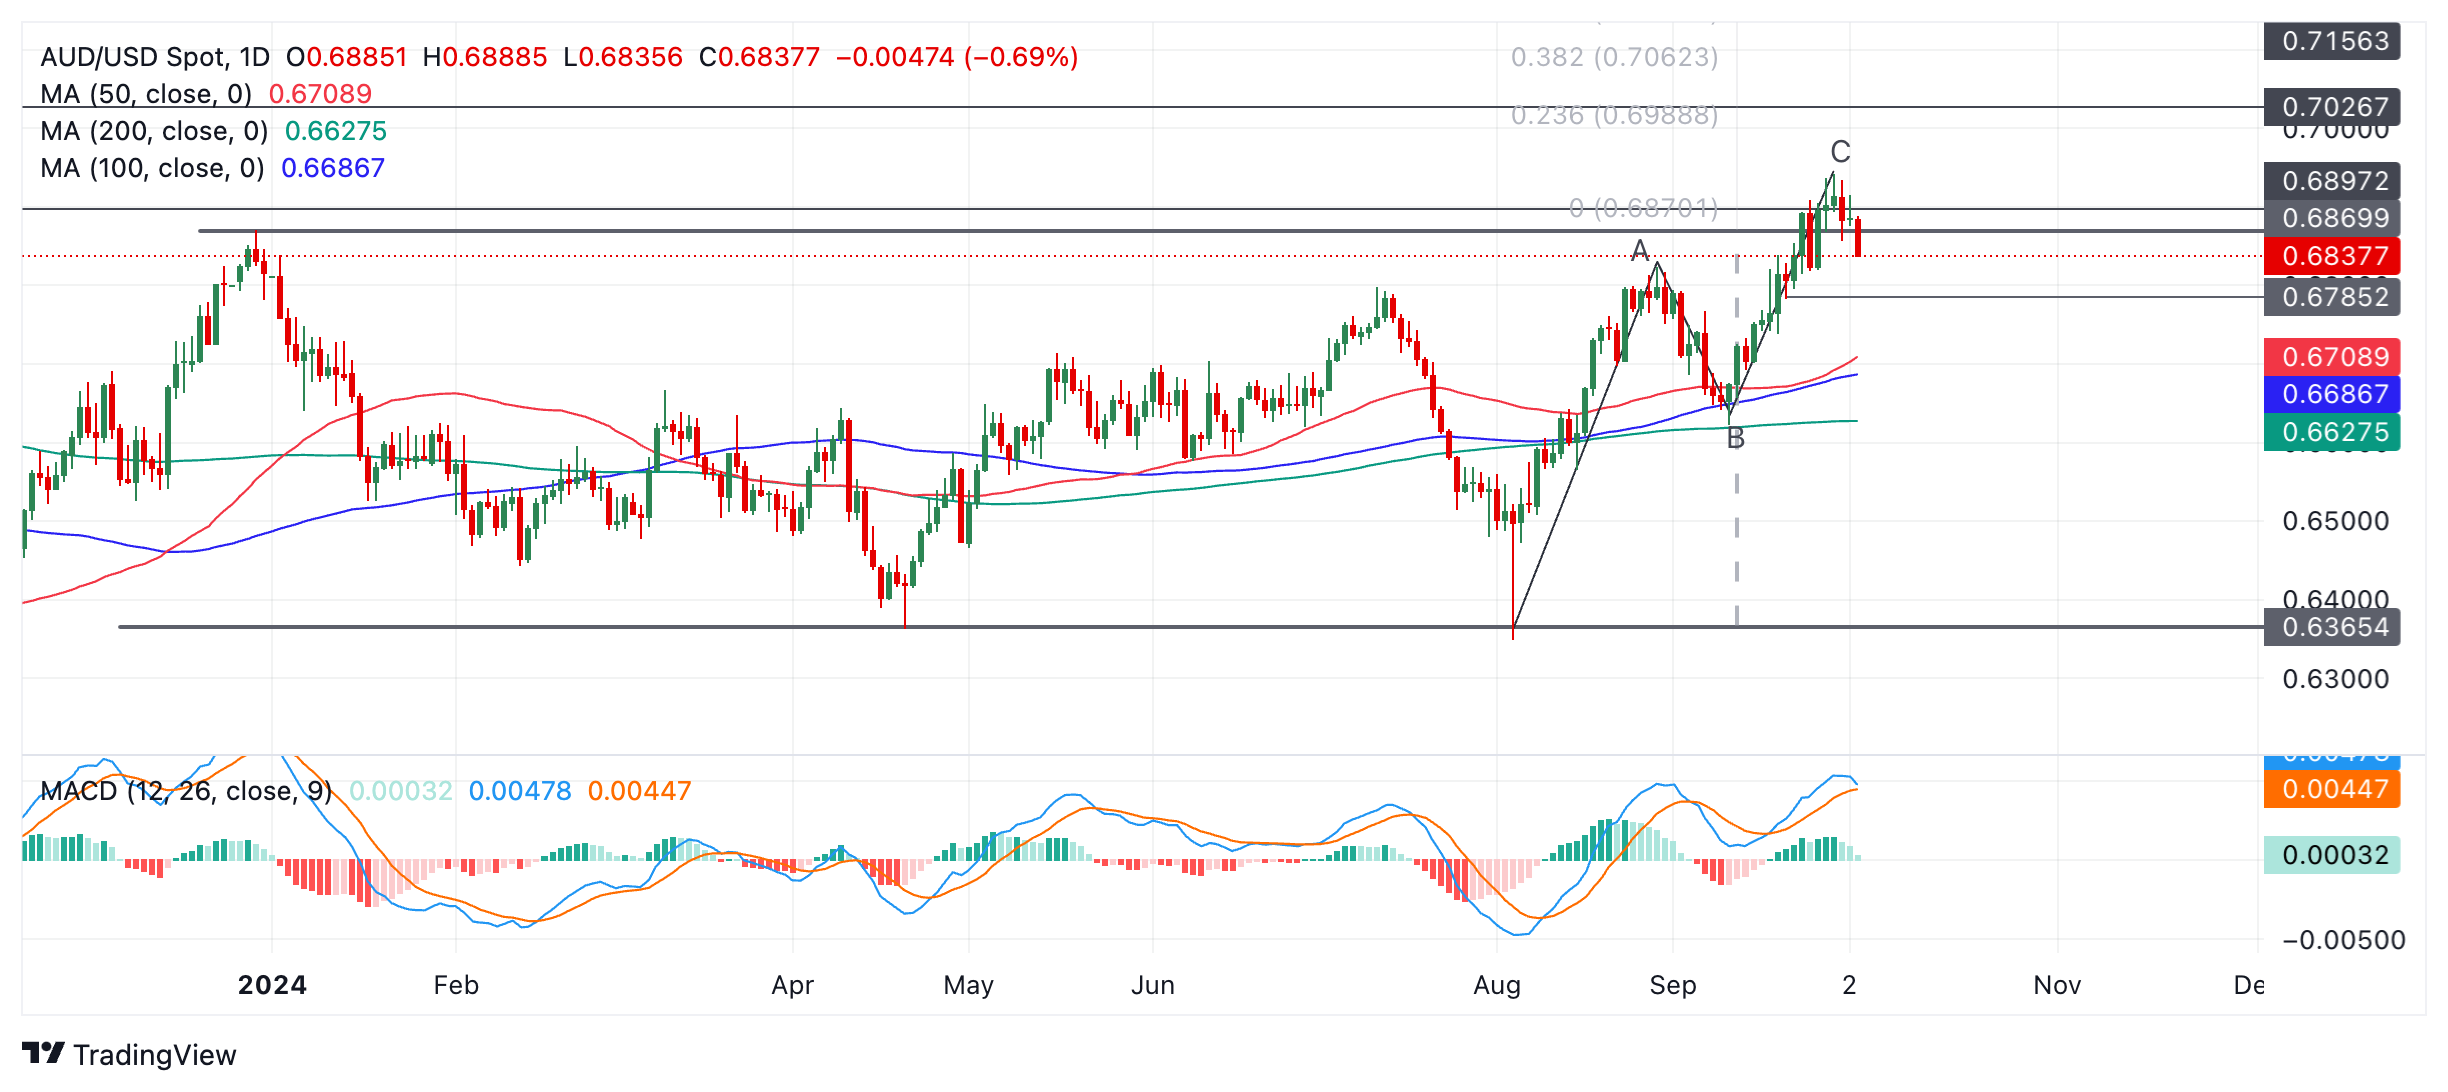
AUD/USD reverses and starts falling after what appears to be a false breakout above the top of the range.

AUD/USD Daily Chart

The Aussie pair has now started falling back inside the range. It is possible this could be the start of a new short-term downtrend that might take AUD/USD back down towards the range lows in the 0.63s, however, it is still too early to say with any confidence.

The blue Moving Average Convergence Divergence (MACD) line is threatening to cross below the red signal line and if it does that would add further evidence to the argument that AUD/USD is reversing trend.

AUD/USD may have formed a Measured Move pattern during August and September as it rose from the bottom to the top of the range. Such patterns resemble zig-zags and lengths of waves A and C are similar or related by Fibonacci.

The Aussie pair reached an initial upside target based on extrapolating wave A of the Measured Move higher by a 61.8% Fibonacci. This target lies at around 0.6115. This is further evidence the uptrend may have reached its zenith and a new downtrend is currently forming. For more confirmation price would have to break below the 0.6785 level (September 20 swing low). Such a move would be expected to reach an initial downside target of 0.6709, the level of the 50-day Simple Moving Average (SMA).

Until then, there is still a risk the move down could stall and the uptrend resume, taking AUD/USD higher again. A break above the 0.6942 September 30 peak would confirm a resumption of the uptrend and target 0.6988 (14 February ‘23 swing high), followed by 0.7156 in a bullish case (2 February ‘23 high).


Bitcoin stabilizes at crucial support after major crash

Bitcoin stabilizes at crucial support after major crash

Bitcoin (BTC) trades slightly down on Thursday, after declining over 7% this week, and holds near a crucial support level; a sustained close below this threshold could signal further declines ahead. However, BlackRock data indicates that Bitcoin outperforms Gold in the long term during geopolitical tensions, and Ki Young Ju, the founder of CryptoQuant, suggests that BTC whales are unlikely to sell now.

Bitcoin has performed better than Gold in the longer term

Bitcoin may behave like traditional risk assets in the short term. Still, a BlackRock report last month showed that BTC has shown more resilience during geopolitical tension periods than Gold in the longer term.

The table below shows that, through major geopolitical events, Bitcoin’s 10-day return and 60-day return have generally performed better than Gold and the US S&P 500 equity index.

Moreover, the recent fourth Bitcoin halving has reduced Bitcoin’s steady-state issuance rate to 0.83%, lower than Gold’s approximately 2.3%, according to a Glassnode report. This marks a historic shift in the title of the scarcest asset.

Bitcoin vs Gold Inflation Rate Chart


Crude Oil higher with explosions head in Beirut on Thursday

Crude Oil higher with explosions head in Beirut on Thursday

Crude Oil jumps near 1%  on Thursday with tensions lingering on after Reuters reports large consecutive explosions were heard in Beirut on Thursday, despite the surprise buildup in US inventories. Traders try to assess what the next step could be in the standoff between Israel and Iran,  either further escalation or easing in tensions. Meanwhile, the unexpected buildup in US Crude stockpiles on Wednesday was completely ignored by markets.

The US Dollar Index (DXY), which tracks the performance of the Greenback against six other currencies, is set for a fourth straight day of gains and is testing the September high at 101.90. Another big batch of data will be released on Thursday, with special importance to the Institute for Supply Management (ISM) numbers for the Services sector. The weekly Jobless Claims will also be closely watched in the light of the Nonfarm Payrolls number on Friday.

Oil Technical Analysis: Things are cooking

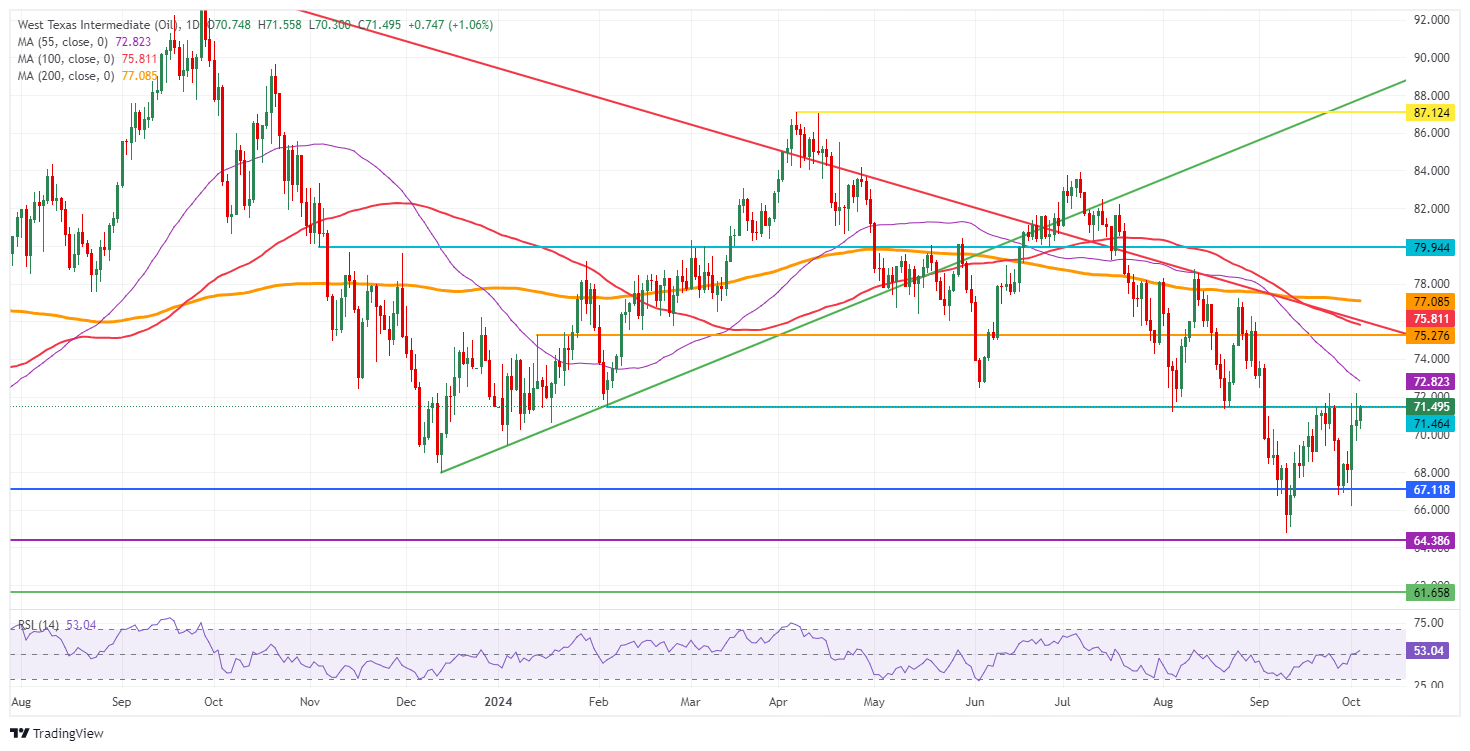
Crude Oil prices are hitting a small curb at $71.46, a level that was also tested and rejected. on September 24 and 25. In case the situation does not further escalate in the Middle East, a quick unwind could happen on the back of this risk premium trade, with a slide back to $67.11 possible.

At current levels, $71.46 remains in focus after a brief false break last week. If a supportive catalyst remains present, a return to $75.27 (the January 12 high) could play out. Along the way towards that level, the 55-day Simple Moving Average (SMA) at $72.80 could ease the rally a bit. Once above $75.27, the first resistance to follow is $75.80, which aligns with the 100-day SMA.

On the downside, $67.11, a triple bottom in the summer of 2023, could still hold as support. If that is not the case, further down the next level is $64.38, the low from March and May 2023. Even $61.65 could come into play should a ceasefire emerge or if Israel signals it is done with its special operation into Lebanon.

US WTI Crude Oil: Daily Chart

US WTI Crude Oil: Daily Chart

USD/CHF holds position above 0.8500 due to waning likelihood of a Fed bumper rate cut

USD/CHF holds position above 0.8500 due to waning likelihood of a Fed bumper rate cut

USD/CHF continues its winning streak for the fourth successive session, trading around 0.8510 during the European hours on Thursday. This upside of the USD/CHF pair could be attributed to recent strong US labor data, which decreased the likelihood of the Federal Reserve (Fed) delivering another aggressive rate cut in November.

The ADP US Employment Change reported an increase of 143,000 jobs in September, exceeding the anticipated 120,000 jobs. Furthermore, annual pay increased by 4.7% year-over-year. The total number of jobs added in August was revised upward from 99,000 to 103,000. This report indicates that the labor market is in better condition than previously perceived at the start of the third quarter.

The CME FedWatch Tool indicates that markets are assigning a 65.9% probability to a 25 basis point rate cut by the Federal Reserve in November, while the likelihood of a 50 basis point cut is 31.4%, down from 49.3% a week ago.

The Swiss Franc (CHF) might have received downward pressure following weaker-than-expected inflation data released on Thursday. Switzerland’s Consumer Price Index slowed to 0.8% year-over-year in September, down from both market expectations and August’s figure of 1.1%. This is the lowest inflation rate since September 2021. Additionally, the monthly inflation rate dropped by 0.3%, exceeding forecasts of a 0.1% decline, after remaining flat in August.

The downside of the Swiss Franc (CHF) could be restrained due to safe-haven flows amid escalating Middle-East tensions. The Israeli Broadcasting Authority (IBA) reported that Israel’s security cabinet has resolved to take decisive action in response to the recent Iranian attack. On Tuesday night, Iran launched more than 200 ballistic missiles and drone strikes targeting Israel.