World oil demand is scaling record highs, boosted by strong summer air travel, increased oil use in power generation and surging Chinese petrochemical activity. Global oil demand is set to expand by 2.2 mb/d to 102.2 mb/d in 2023.
IEA #oott— Giovanni Staunovo???? (@staunovo) August 11, 2023
Euro makes a date with year-to-date highs on the back of confidence-boosting bank earnings
The Euro (EUR) almost touches year-to-date highs above 1.1000 against the US Dollar (USD) during the early European session, on Tuesday. The single currency is supported by confidence-boosting Eurozone bank earnings, which suggest the sector has weathered the March crisis better than expected. Hawkish comments from rate-setters at the European Central Bank (ECB) further aid the Euro, as expectation of higher interest rates would lift capital inflows into Europe. From a technical perspective, despite an intraday pullback, the overall trend is up, with the probabilities favoring longs over shorts.
EUR/USD technical analysis: Nearing year-to-date highs
EUR/USD breaks out of a right-angled triangle (more clearly seen on the 4-hour chart) and unfolds another leg higher, in line with the broader medium-term uptrend that began over eight months ago. The pair is fast approaching the year-to-date highs at 1.1075. The odds favor a continuation of the dominant Euro bullish trend.
A decisive break above 1.1075, which was touched on April 14, would confirm a continuation of the Euro’s uptrend to the next key resistance level at around 1.1190, where the 200-week Simple Moving Average (SMA) sits.
For the sake of clarity, the definition of a ‘decisive break’ either includes a ‘breakout candle’ – a long green bullish daily candle that extends above the 1.1075 highs and closes near its high, or three smaller bullish green candles in a row that break above the highs.
Alternatively, a break and daily close below the key lower high at 1.0830 would bring into doubt the validity of the uptrend and could see losses extend down to a confluence of support at 1.0775-1.0800, marking a possible reversal of the dominant trend.

Using the Rising Wedge Pattern in Forex Trading
What is a rising wedge pattern?
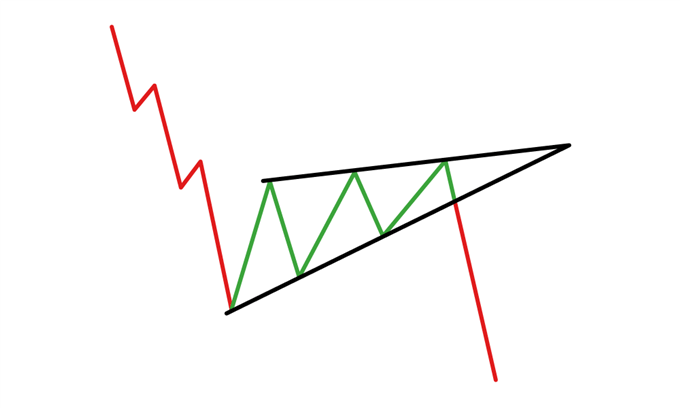
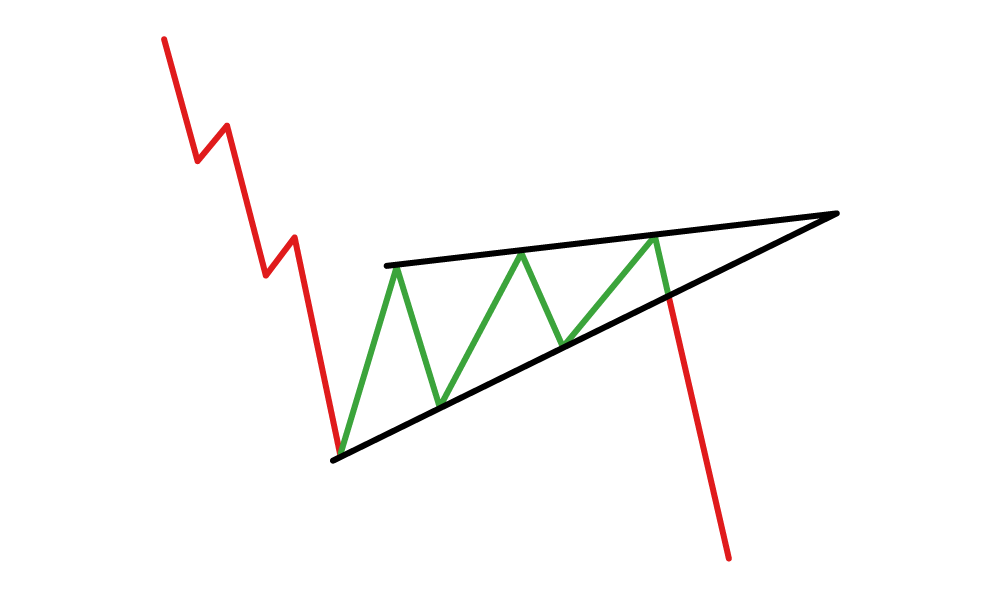
The forex rising wedge (also known as the ascending wedge) pattern is a powerful consolidation price pattern formed when price is bound between two rising trend lines. It is considered a bearish chart formation which can indicate both reversal and continuation patterns – depending on location and trend bias. Regardless of where the rising wedge appears, traders should always maintain the guideline that this pattern is inherently bearish in nature (see image below).
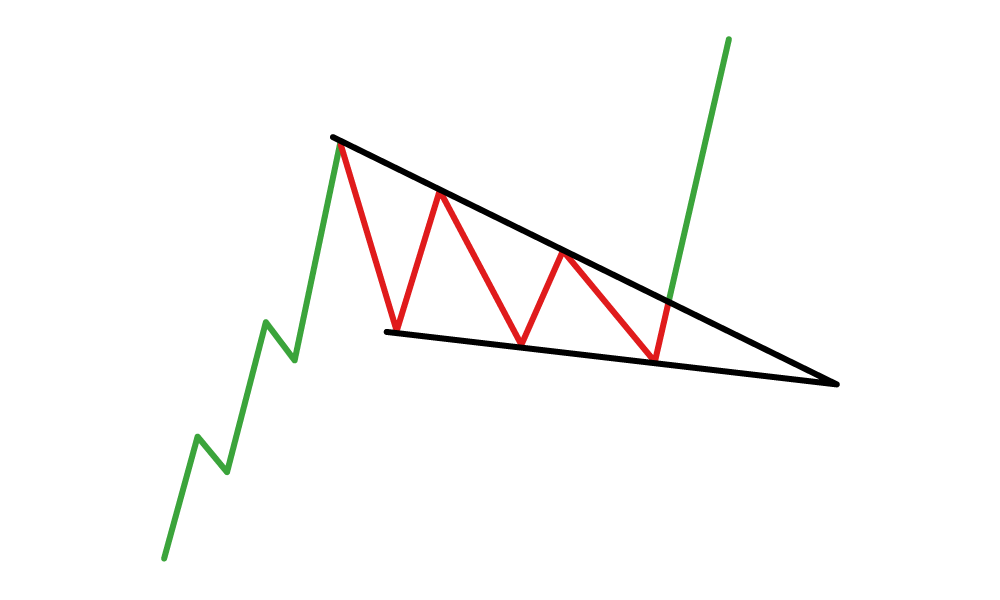
The falling (descending) wedge differentiates itself from the rising wedge by the slant of the triangle. The falling wedge declines downwards between two converging trend lines to reach an apex point which is respected as a bullish pattern (see image below).
How to identify a Rising Wedge Pattern on Forex Charts
The rising wedge pattern is interpreted as both a bearish continuation and bearish reversal pattern which gives rise to some confusion in the identification of the pattern. Both scenarios contain a different set of observation dynamics which must be taken into consideration.
Continuation Pattern:
- Established downtrend
- Rising wedge consolidation formation
- Linking higher highs and lower lows using a trend line assembling towards a narrowing point
- Confirm divergence between price and volume using volume function – MACD may also be used
- Overbought signal can be confirmed by other technical tools like oscillators
- Look for break below support for short entry
Reversal Pattern:
- Established uptrend
- Rising wedge consolidation formation
- Linking higher highs and lower lows using a trend line assembling towards a narrowing point
- Confirm divergence between price and volume using volume function – MACD may also be used
- Overbought signal can be confirmed by other technical tools like oscillators
- Look for break below support for short entry
How to Trade the Rising Wedge Pattern
The rising wedge forex pattern is linked with both continuation and reversal patterns as mentioned above. The example below shows the formation of a rising wedge on a forex pair depicting a continuation.
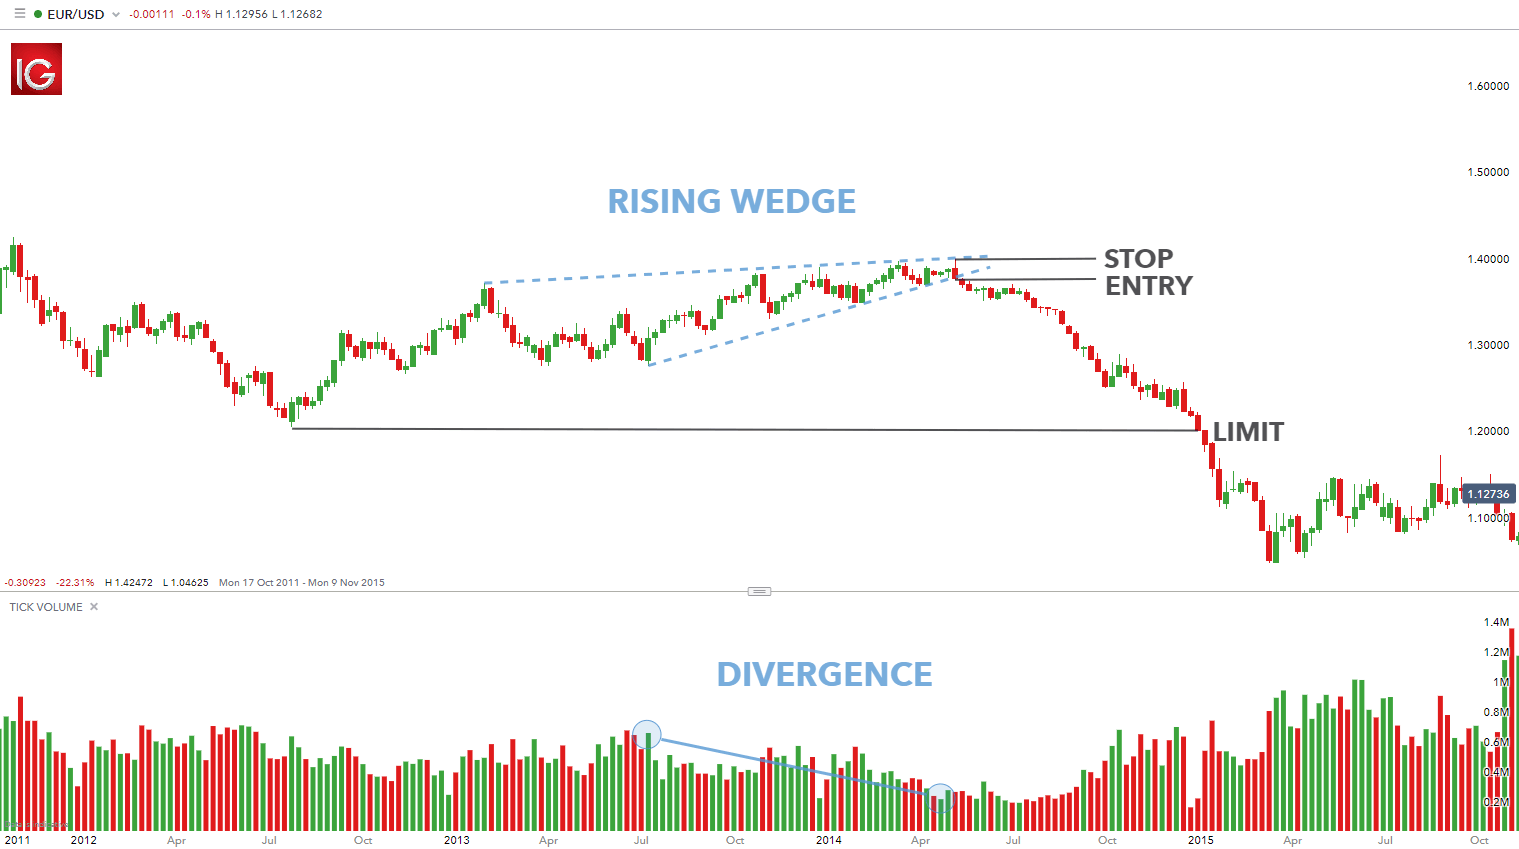
EUR/USD rising wedge forex chart pattern:
The chart above shows a rising wedge ‘continuation’ pattern after a determined downtrend. The rising wedge is outlined by the blue dashed lines showing diminishing bull strength in the uptrend. Confirmation of the uptrend waning in strength can be seen using the volume tool on the chart which depicts fading volume in concurrence with the ascending price in the market. This is known as divergence, showing that the upward movement is coming to an end.
The entry point (labelled) occurs once the trend support line of the rising wedge has been breached. There are two common methods of entry:
- Wait for a candle close below the support trend line before entry
- Enter into the short position as soon as the price breaks the support line, regardless of the candle close
The stop level as highlighted on the chart is elected from the high point of the rising wedge located on the resistance trend line. This identification point makes it relatively simple to locate the stop level for novice traders. The limit in this example was taken from the previous swing low giving this trade an extremely positive risk-reward ratio.


-638180075791018996.png)