Crypto News: Meme Coins Make a Comeback on the Return of the Bulls

Crypto News: Meme Coins Make a Comeback on the Return of the Bulls

VanEck Amended Filing Draws Investor Interest

On Sunday, the crypto market looked more closely at the VanEck Bitcoin Trust ETF amended filing. Finance lawyer Scott Johnsson observed a nuance in the VenEck filing, saying,

“Similar language to the BlackRock amendment re: seeding. Perhaps not too surprising given both issuers are represented by the same lawyers at Clifford Chance. Except here, instead of seeding with cash like iShares, VanEck suggests they’ll seed with bitcoin.”

Trading Derivatives carries a high level of risk to your capital and you should only trade with money you can afford to lose. Trading Derivatives may not be suitable for all investors, so please ensure that you fully understand the risks involved, and seek independent advice if necessary. A Product Disclosure Statement (PDS) can be obtained either from this website or on request from our offices and should be considered before entering into a transaction with us. Raw Spread accounts offer spreads from 0.0 pips with a commission charge of USD $3.50 per 100k traded. Standard account offer spreads from 1 pips with no additional commission charges. Spreads on CFD indices start at 0.4 points. The information on this site is not directed at residents in any country or jurisdiction where such distribution or use would be contrary to local law or regulation.

Johnsson added,

“Caution not to read too much into this. Still, it’s an affirmative addition so either suggestive of actual intent or maybe just rather lazy lawyering.”

Meme Coins and Gaming Tokens Enjoyed a Bullish Week

Floki (FLOKI) and Pepe (PEPE) were among the front runners in the week ending October 29.

FLOKI jumped 40% on a new staking program, with the launch of a sister token, TokenFI, to reward FLOKI stakers. Notably, Floki imposed a 20% buy/sell transaction tax for the first hour of launch before reducing the tax to 5%. Floki raised the tax to address the impact of snipers and to give the Floki treasury access to the tax income for growth and development.

PEPE surged by 54%. While benefiting from a broad-based crypto rally, the PEPE token burn likely contributed to the gains. PEPE burned 6.9 trillion tokens, equivalent to $5.5 million, fueling the breakout week. Token burns reduce the number of tokens in circulation.

Injective (INJ), Mina (MINA), Gala (GALA), and Conflux (CFX) were also among the front runners. MINA gained 52%, GALA and INJ rose by 44% and 51%, with CFX ending the week up 44%.

In contrast, BTC and ETH ended the week with gains of 15% and 8%, respectively.

Technical Analysis

Bitcoin Analysis

BTC held above the 50-day and 200-day EMAs, affirming bullish price signals.

A BTC break above the $35,265 resistance level would support a move toward the $36,400 resistance level. BTC-spot ETF application-related news will continue to influence investor sentiment.

However, a BTC fall below $34,000 would bring the $32,436 support level into view.

The 14-Daily RSI reading of 79.45 shows BTC sitting in overbought territory.
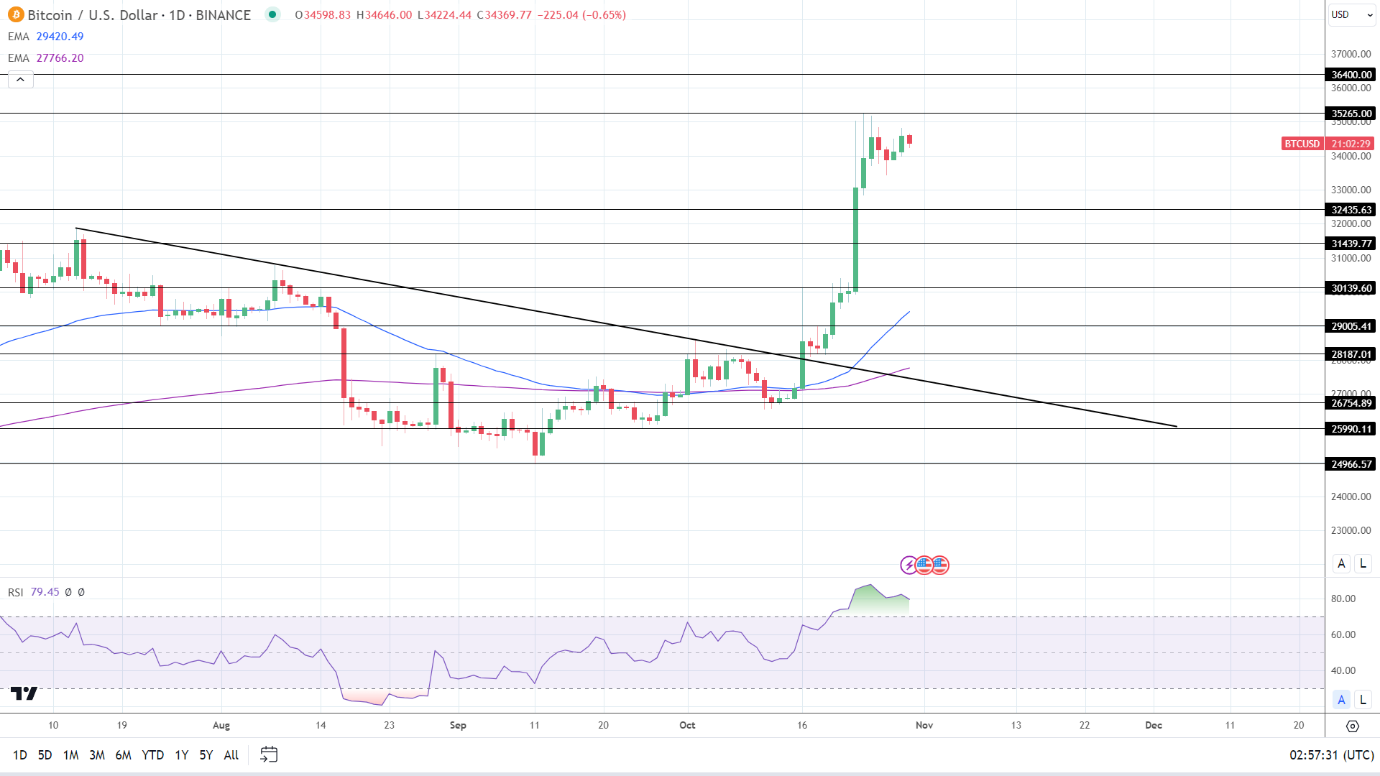
BTC Daily Chart sends bullish price signals.

BTCUSD 301023 Daily Chart

Ethereum Analysis

ETH remained above the 50-day and 200-day EMAs, affirming bullish price signals.

An ETH move through the $1,805 resistance level would bring the trend line into play.

SEC activity, updates from the ongoing SEC cases against Coinbase (COIN) and Ripple, and crypto-spot ETF-related news will dictate buyer appetite.

An ETH break below the $1,741 support level would support a move to the 200-day EMA.

ETH sits on the border of overbought territory with a 14-Daily RSI reading of 67.41. Seller demand could intensify at 70, barring a favorable crypto market event.
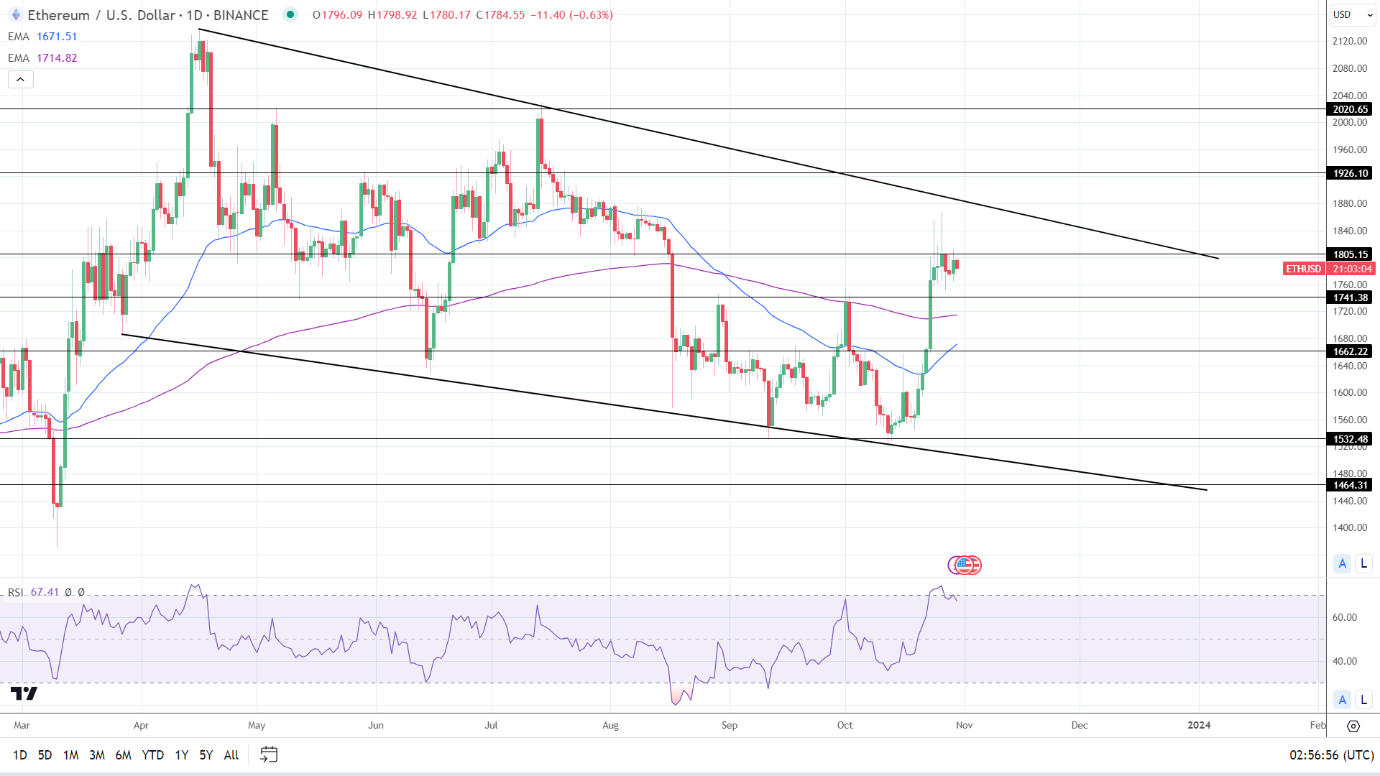
ETH Daily Chart sends bullish price signals.
ETHUSD 301023 Daily Chart
DAX Index: German GDP and Inflation to Test DAX Resilience

DAX Index: German GDP and Inflation to Test DAX Resilience

DAX Friday Overview

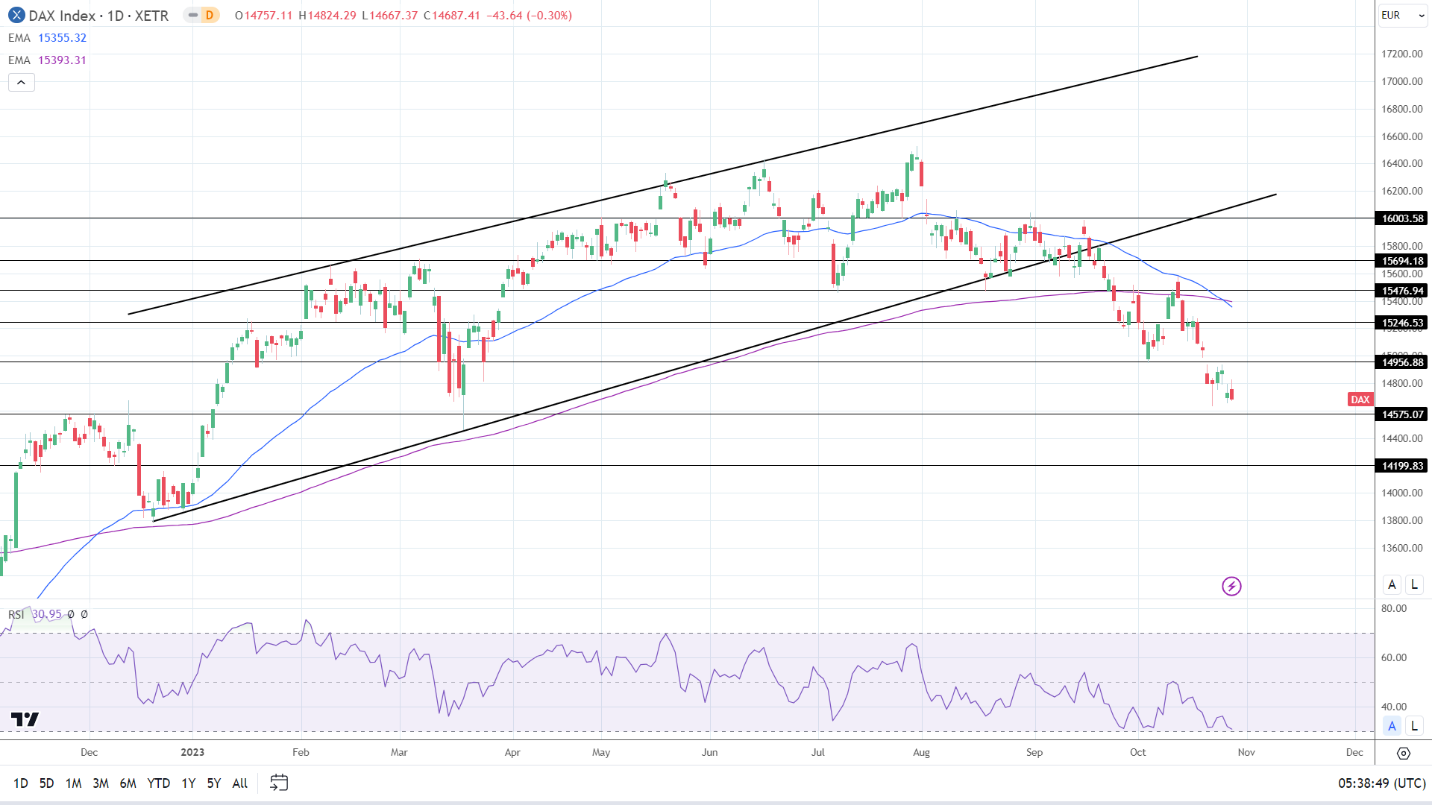
The DAX declined by 0.30% on Friday. Following a 1.08% loss on Thursday, the DAX ended the week down 0.75% to 14,687.

Corporate Earnings, Macroeconomics, and Siemens in Focus

On Friday, corporate earnings results resonated amid an uncertain macroeconomic backdrop. Investor jitters over higher-for-longer ECB and Fed rate paths weighed on the appetite for riskier assets.

Trading Derivatives carries a high level of risk to your capital and you should only trade with money you can afford to lose. Trading Derivatives may not be suitable for all investors, so please ensure that you fully understand the risks involved, and seek independent advice if necessary. A Product Disclosure Statement (PDS) can be obtained either from this website or on request from our offices and should be considered before entering into a transaction with us. Raw Spread accounts offer spreads from 0.0 pips with a commission charge of USD $3.50 per 100k traded. Standard account offer spreads from 1 pips with no additional commission charges. Spreads on CFD indices start at 0.4 points. The information on this site is not directed at residents in any country or jurisdiction where such distribution or use would be contrary to local law or regulation.

ECB President Christine Lagarde poured cold water on talk of interest rate cuts during the ECB press conference on Thursday. Lagarde dismissed rate cuts despite the Eurozone economy heading toward a recession.

There were no economic indicators from Germany or the Eurozone to influence investor sentiment. However, US economic indicators affirmed the need for higher for longer. US personal spending beat forecasts, while Core PCE Price Index figures signaled sticky inflation.

Amazon.com (AMZN) and Intel Corp. (INTC) beat profit forecasts after the closing bell on Thursday. Amazon.com surged 6.83% on Friday, delivering a positive end to the week for the Nasdaq Composite Index.

On Friday, the Nasdaq Composite Index gained 0.38%, while the S&P 500 and Dow saw losses of 0.48% and 1.12%.

The Friday Market Movers

Mercedes Benz Group declined by 2.82%, with investors continuing to respond to the earnings release on Thursday. Porsche and Volkswagen ended the day with losses of 1.03% and 0.68%. BMW and Daimler Truck Holding declined by 0.16% and 0.47%.

Bank stocks made gains following the better-than-forecast earnings results of Deutsche Bank. Deutsche Bank and Commerzbank ended the day up 0.25% and 0.46%, respectively.

However, Siemens Energy AG rallied by 9.00%. Investors responded to comments from German Chancellor Olaf Scholz, who reportedly referred to the company as very important.

On Thursday, Siemens Energy AG slumped by 35.49% after news broke that the firm sought state guarantees.

German GDP and Inflation in the Spotlight

On Monday, the German economy will be in the spotlight. GDP numbers for Q3 and October inflation figures will garner investor interest. A more marked contraction and sticky inflation will likely pressure the DAX.

Economists forecast the German economy to contract by 0.3% in Q3. Inflation forecasts support the ‘higher-for-longer’ forward guidance. Economists predict the German annual inflation rate to soften from 4.5% to 4.0%.

Beyond the economic indicators, ECB commentary also needs consideration. ECB Executive Board members Luis de Guindos and Andrea Enria are on the calendar to speak on Monday. References to the economy, inflation, and interest rates will influence investor appetite for DAX-listed stocks.

Away from the economic calendar, news updates from the Middle East will also impact the DAX.

US Corporate Earnings in Focus Pre-Fed

On Monday, the Dallas Fed Manufacturing Index will be in focus. A pickup in manufacturing sector activity will likely support the appetite for riskier assets. While the numbers are unlikely to influence the Fed, investors could respond favorably to stats that support a soft landing.

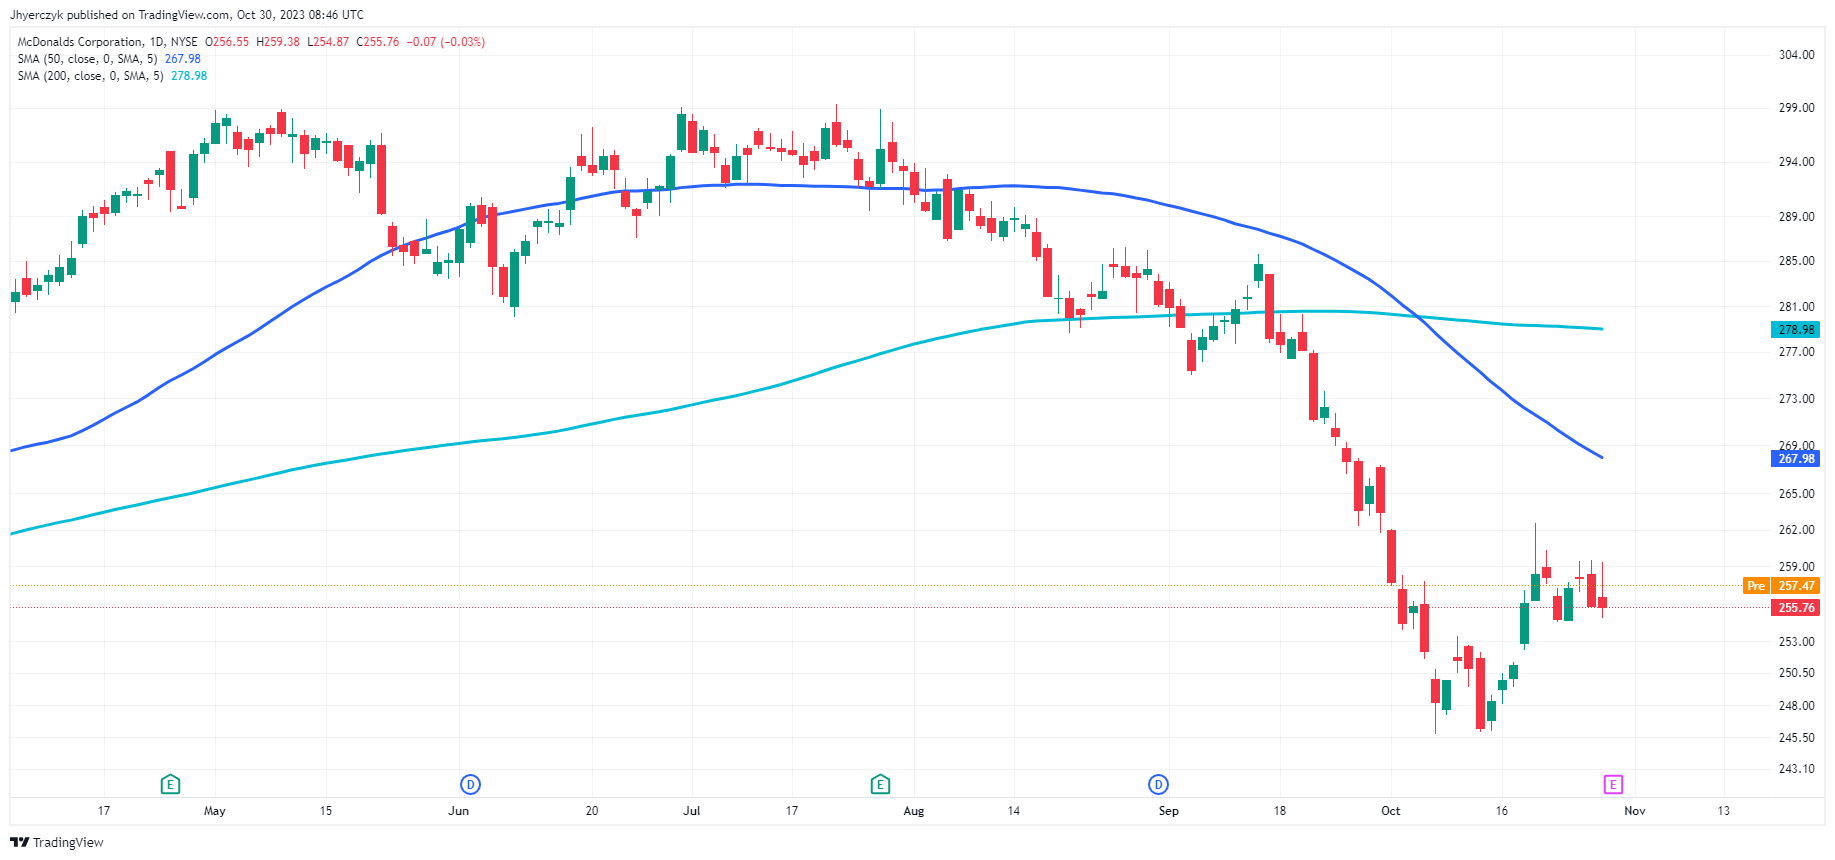
However, the economic calendar will likely play second fiddle to the US earnings calendar. The McDonald’s Corp. (MCD) is among the big names to release earnings results on Monday.

The futures markets point to a mixed start to the Monday session. The DAX was down 33 points, while the Nasdaq mini was up 76 points. On Monday morning, 10-year US Treasury yields were up 0.70% to 4.873%.

Short-Term Forecast

Near-term trends will hinge on German GDP and inflation figures ahead of the Fed interest rate decision on Wednesday. Eurozone inflation and GDP numbers will also influence buyer appetite ahead of the US Jobs Report and services PMIs on Friday. Signals supporting higher-for-longer rate paths will likely pressure the DAX.

DAX Technical Indicators

Daily Chart

The DAX sat below the 50-day and 200-day EMAs, sending bearish price signals. Significantly, the 50-day EMA pulled back from the 200-day EMA, supporting near-term bearish price signals.

A DAX fall through the 14,575 support level would give the bears a run at the 14,200 support level. Q3 GDP and October inflation figures will influence market risk appetite on Monday.

Softer inflation figures and better-than-expected GDP numbers would support a move to the 14,957 resistance level.

The 14-day RSI reading of 30.95 shows DAX on the border of oversold territory, suggesting a possible pickup in buyer appetite.

DAX Daily Chart sends bearish price signals.

DAX 301023 Daily Chart

4-Hourly Chart

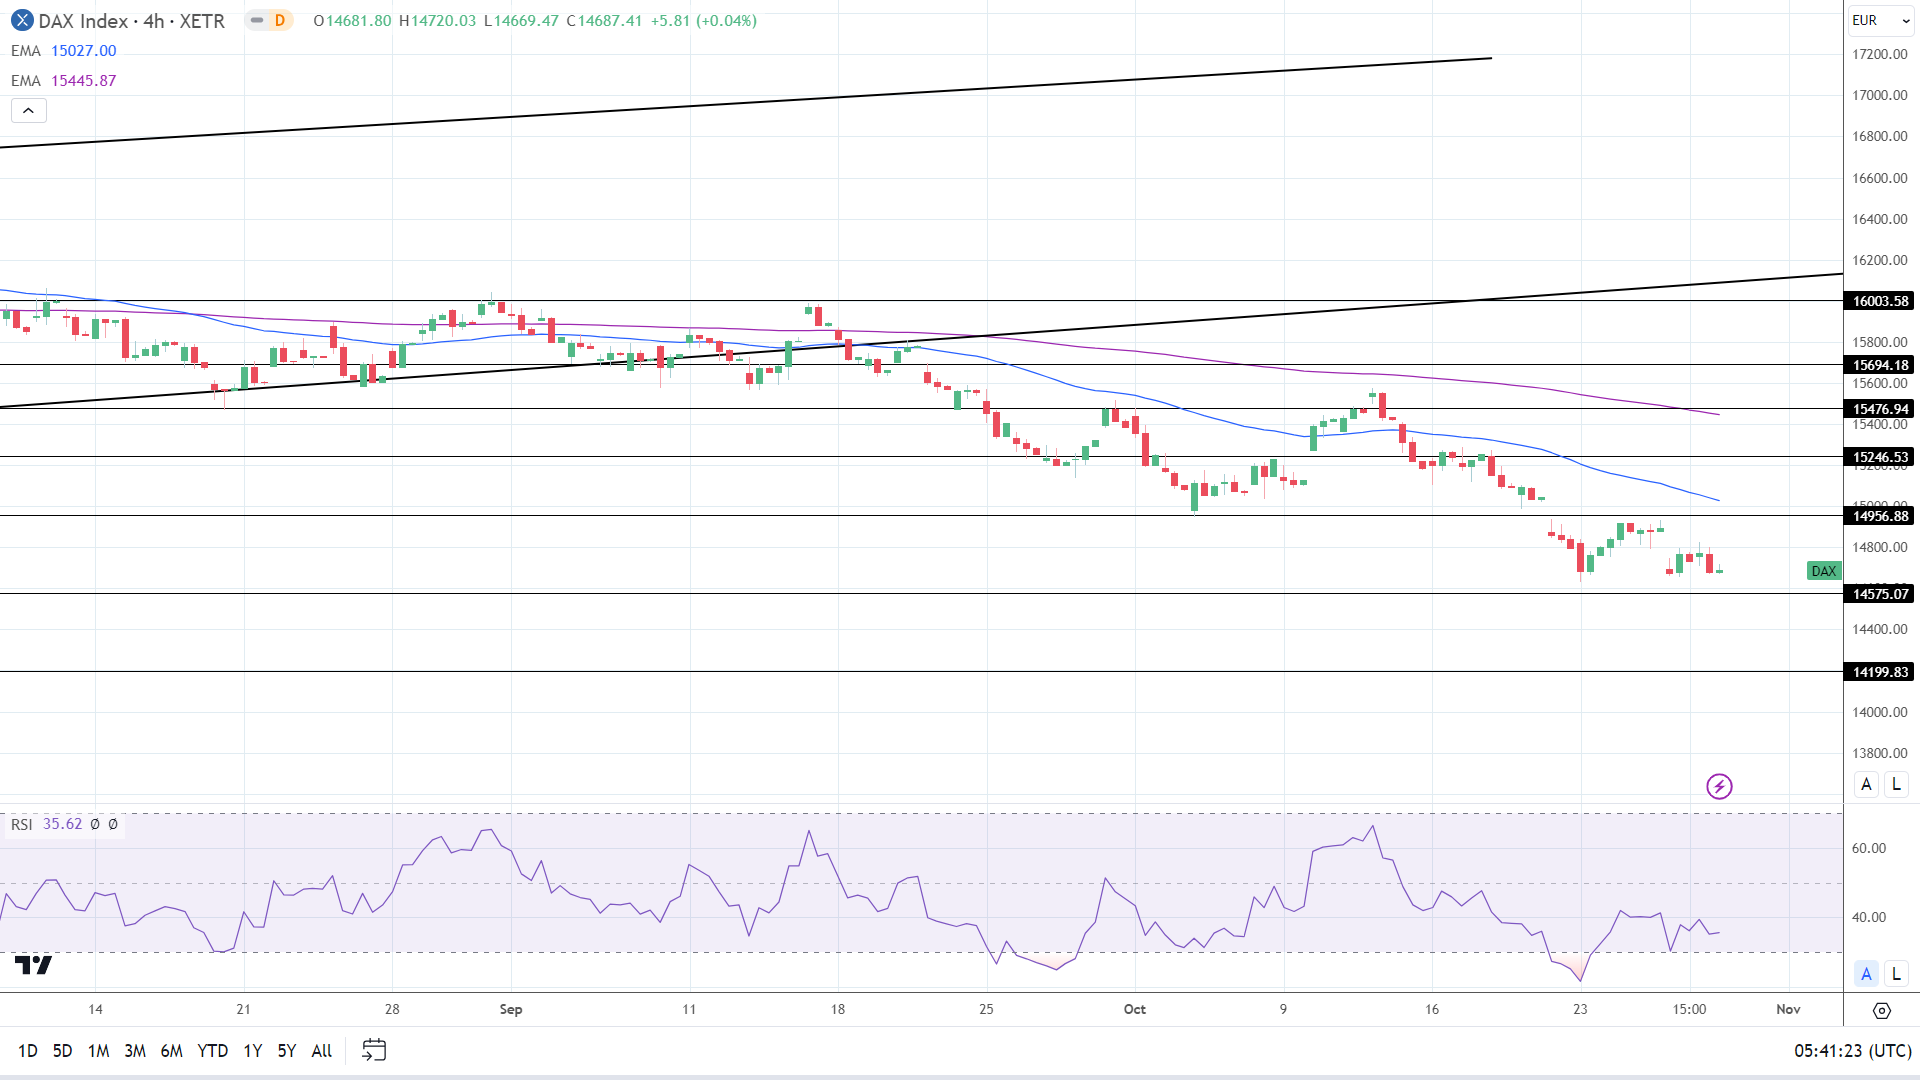
The DAX sits below the 50-day and 200-day EMAs, reaffirming bearish price signals. A DAX break below the 14,575 support level would bring the 14,200 support level into view.

However, a move through the 14,957 resistance level would support a break above the 50-day EMA.

The 35.62 14-4 hour RSI reading suggests a DAX break below the 14,575 support level before entering oversold territory.

4-Hourly Chart affirms bullish price signals.
DAX 301023 4-Hourly Chart
EUR/USD Forecast: German GDP and Inflation to Set the Tone for the Week

EUR/USD Forecast: German GDP and Inflation to Set the Tone for the Week

Friday Overview

The EUR/USD slipped by 0.03% on Friday. Following a 0.04% decline on Thursday, the EUR/USD ended the day at $1.05586. The EUR/USD fell to a low of $1.05352 before rising to a high of $1.05970.

German GDP and Inflation to Set the Tone

On Monday, the German economy will be in the spotlight. Q3 GPP and October inflation figures will garner investor interest.

Trading Derivatives carries a high level of risk to your capital and you should only trade with money you can afford to lose. Trading Derivatives may not be suitable for all investors, so please ensure that you fully understand the risks involved, and seek independent advice if necessary. A Product Disclosure Statement (PDS) can be obtained either from this website or on request from our offices and should be considered before entering into a transaction with us. Raw Spread accounts offer spreads from 0.0 pips with a commission charge of USD $3.50 per 100k traded. Standard account offer spreads from 1 pips with no additional commission charges. Spreads on CFD indices start at 0.4 points. The information on this site is not directed at residents in any country or jurisdiction where such distribution or use would be contrary to local law or regulation.

Third-quarter GDP numbers will impact the buyer appetite for the EUR/USD. A more marked contraction in the German economy will pressure the EUR. A prolonged German economic recession may limit the ECB’s ability to maintain higher interest rates for an extended period.

A deterioration in the macroeconomic environment could impact labor market conditions and disposable income. A downward trend in disposable income may ease demand-driven inflationary pressures, bringing forward the bets on the timing of an ECB rate cut.

Economists forecast the German economy to contract by 0.7% year-over-year in the third quarter. Quarter-on-quarter, economists expect the economy to contract by 0.3%.

Later in the Monday session, German inflation figures for October also warrant consideration. Sticky inflation would leave a higher-for-longer rate path on the table at the expense of the German economy. German private consumption accounts for over 50% of the German economy. A higher-for-longer interest rate environment could lead consumers to reduce spending, impacting the economy.

Beyond the economic indicators, ECB commentary will also move the EUR/USD dial. ECB Executive Board members Luis de Guindos and Andrea Enria are on the calendar to speak. ECB references to the economy, inflation, and monetary policy need monitoring.

Dallas Fed Manufacturing Index in Focus Pre-Fed

On Monday, the Dallas Manufacturing Index will draw investor attention. Economists forecast the Index to rise from -18.1 to -15.0. The Index is unlikely to sway bets on the Fed interest rate decision. The US manufacturing sector contributes less than 25% to the US economy.

However, investors will likely be sensitive to any cracks in the US economy. Positive numbers would ease fears of a hard landing.

Beyond the economic calendar, the Middle East conflict remains a focal point. News of an escalation would drive demand for the safety of the US dollar.

Short-Term Forecast:

Near-term trends hinge on the Fed, US services PMIs, and the US Jobs Report. A pickup in economic activity and wage growth could refuel bets on a December Fed rate hike. Parity remains off the table for now. But GDP and inflation numbers for the Eurozone (Tues) could redraw the EUR/USD trajectory.

EUR/USD Price Action

Daily Chart

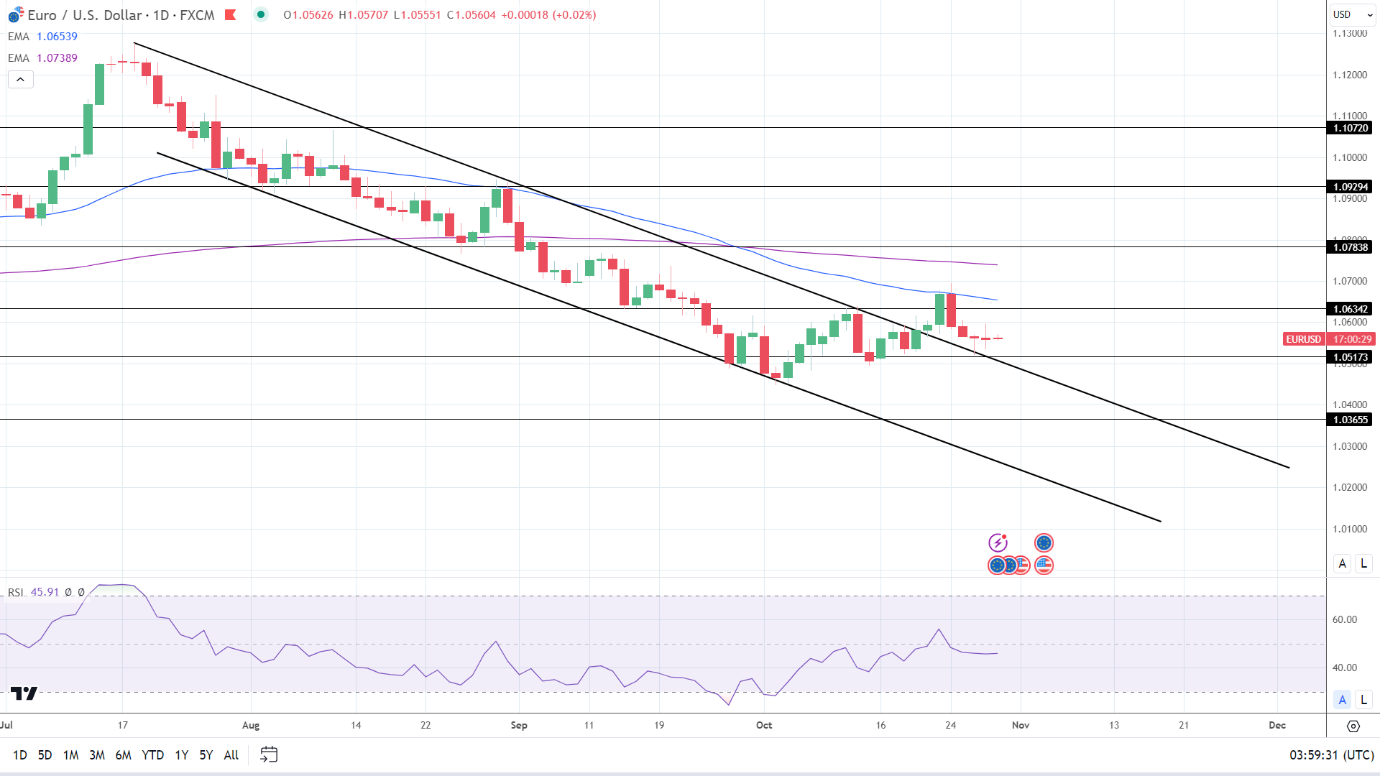
The EUR/USD remains below the 50-day and 200-day EMAs, affirming bearish price signals.

A EUR/USD break above $1.06 could support a move to the $1.06342 resistance level and the 50-day EMA. German GDP and inflation will be the focal points on Monday. Better-than-expected GDP and softer-than-expected inflation figures would fuel demand for the EUR.

However, a break below the trend line and $1.05173 support level would give the bears a look at sub-$1.05.

The 14-period Daily RSI, 45.91, indicates a EUR/USD break below the trend line and $1.05173 support level before entering oversold territory.

EUR/USD Daily Chart sends bearish price signals.
EURUSD 301023 Daily Chart

4-Hour Chart

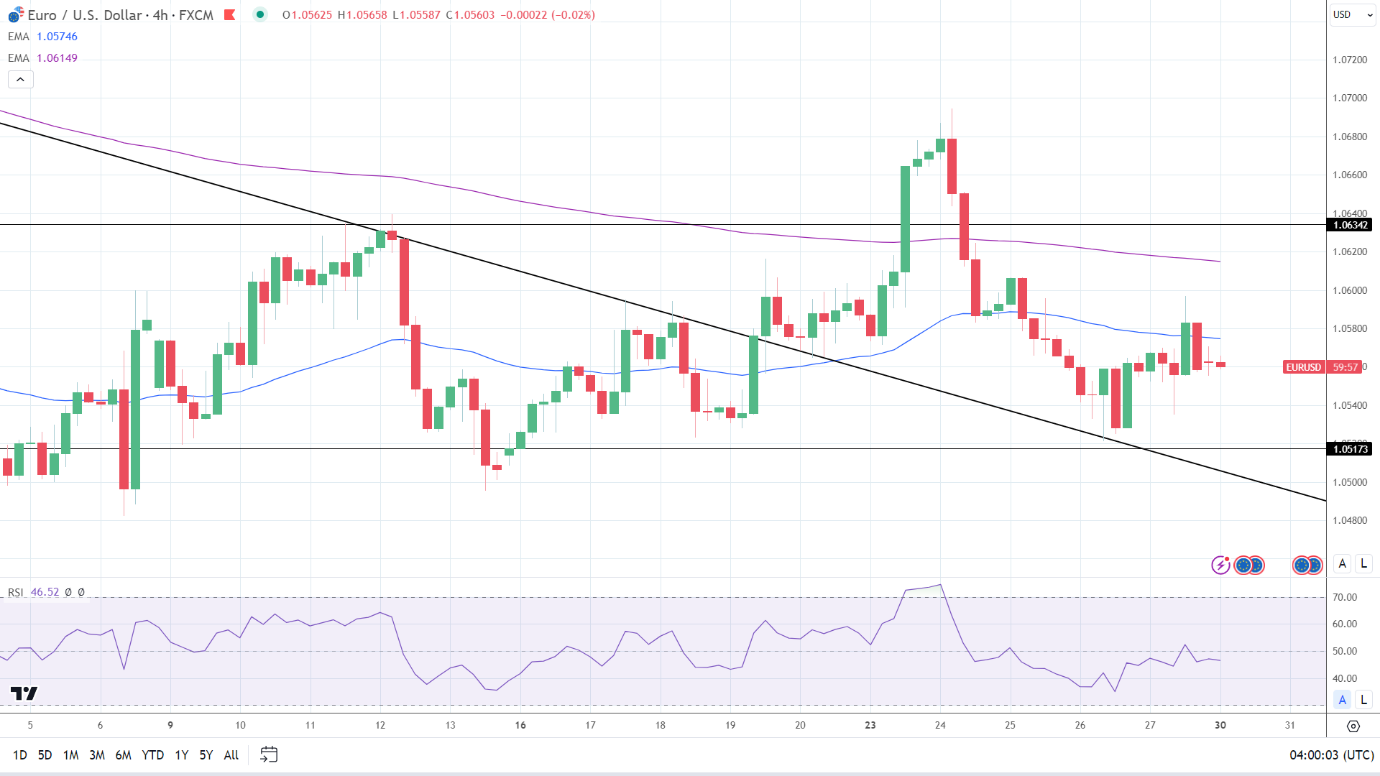
The EUR/USD sits below the 50-day and 200-day EMAs, reaffirming bearish price signals.

A EUR/USD break above the 50-day EMA could support a move to the 200-day EMA and $1.06342 resistance level.

However, a break below the $1.05173 support level would bring the trend line and sub-$1.05 into play.

The 14-period RSI on the 4-hour chart, 46.52, indicates a EUR/USD fall through the $1.05173 support level before entering oversold territory.

4-Hourly Chart affirms bearish price signals.
EURUSD 301023 4 Hourly Chart
Oil Prices Forecast: Lower as Investors Await Fed Decision, China PMI

Oil Prices Forecast: Lower as Investors Await Fed Decision, China PMI

Oil Prices Retrace Despite Middle East Tensions

Oil prices took a step back on Monday, dipping over 1% as investors opted for caution, awaiting key economic indicators. Brent crude and U.S. West Texas Intermediate (WTI) crude futures slid to $89.37 and $84.20 a barrel, respectively. The market seemed to dismiss heightened tensions in the Middle East and instead focused on economic drivers.

Investors Look Beyond Geopolitical Hotspots

Although the conflict between Israel and Hamas escalated over the weekend, the impact on oil prices was subdued. The market had largely priced in the invasion, and the lack of spread into a broader regional conflict led to a pullback in oil prices. Both Brent and WTI had ended Friday 3% higher due to the tension but retreated when the conflict didn’t escalate as feared.

Trading Derivatives carries a high level of risk to your capital and you should only trade with money you can afford to lose. Trading Derivatives may not be suitable for all investors, so please ensure that you fully understand the risks involved, and seek independent advice if necessary. A Product Disclosure Statement (PDS) can be obtained either from this website or on request from our offices and should be considered before entering into a transaction with us. Raw Spread accounts offer spreads from 0.0 pips with a commission charge of USD $3.50 per 100k traded. Standard account offer spreads from 1 pips with no additional commission charges. Spreads on CFD indices start at 0.4 points. The information on this site is not directed at residents in any country or jurisdiction where such distribution or use would be contrary to local law or regulation.

Upcoming Economic Indicators in Focus

Investors are keenly awaiting Wednesday’s Federal Reserve policy meeting, as well as upcoming U.S. jobs data and Apple Inc.’s earnings report. Despite geopolitical tensions, market participants are more concerned about signs of an economic slowdown affecting fuel demand. The Fed is expected to leave interest rates unchanged, while other key central banks are also set to review policies.

China’s Economic Health to Influence Prices

This week, China will release its manufacturing and services Purchasing Managers’ Index (PMI). Investors are looking for signs that the world’s top crude importer is stabilizing, and that fuel demand is picking up, following measures taken by Beijing to support its economy.

Short-term Outlook: Bearish

The decline in Brent and WTI last week, coupled with a situation in the Middle East that remains localized to Israel and Gaza, suggests that crude is overbought. In this context, the short-term outlook for oil appears bearish, and prices are likely to continue their slide.

The short-term outlook for crude oil could shift to bullish if there’s a sudden escalation in Middle East conflicts that disrupts supply, positive economic data from major economies that boosts demand, or a dovish shift in Federal Reserve policy that weakens the U.S. dollar. Additionally, unplanned supply disruptions or strong corporate earnings reports could also drive up oil prices by increasing market optimism and demand.

Technical Analysis

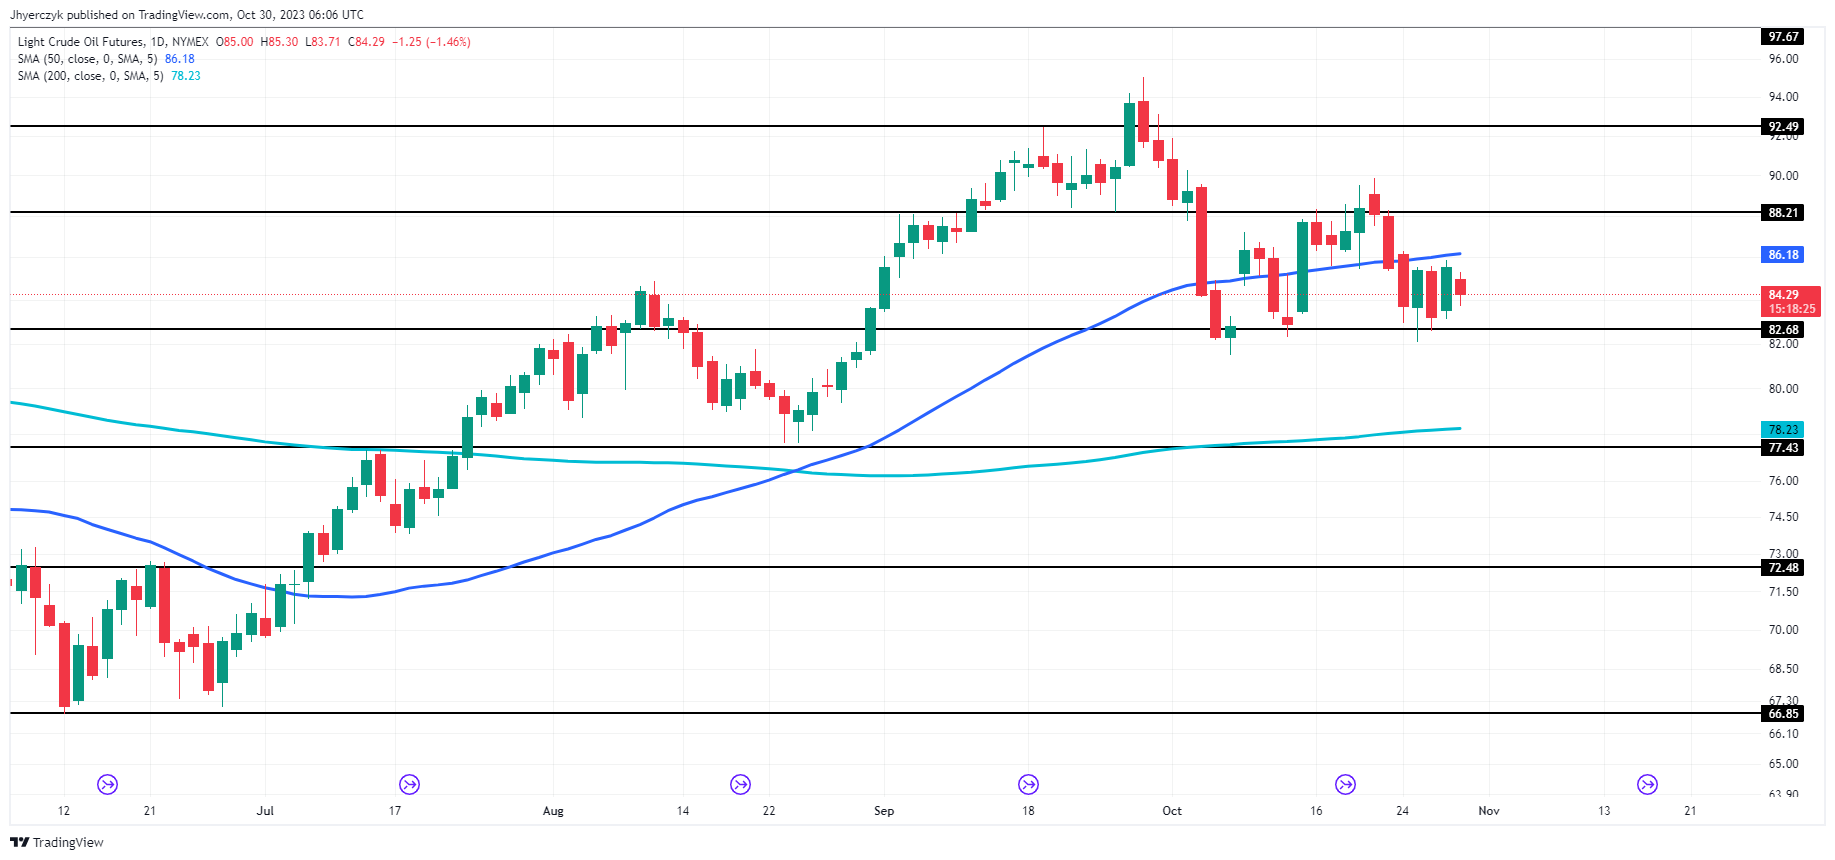
The current daily price of light crude oil futures is $84.31, which is below the 50-day moving average of $86.18 but above the 200-day moving average of $78.23. This indicates a mixed outlook: the asset is in a short-term bearish trend as it trades below the 50-day moving average, but maintains a long-term bullish trend by staying above the 200-day average.

Currently, the commodity is hovering just above its minor support level of $82.68, and well above the main support at $77.43. It is trading below both minor and major resistance levels at $88.21 and $92.49, respectively.

Given these factors, the market sentiment could be considered cautiously bearish in the near term, but with a potential for long-term bullishness.

Nasdaq 100, Dow Jones, S&P 500 News: Investors’ Gaze Turns to McDonald’s Earnings

Nasdaq 100, Dow Jones, S&P 500 News: Investors’ Gaze Turns to McDonald’s Earnings

Market Jitters Continue as Investors Await McDonald’s Earnings

With the S&P 500 still mired in correction territory, U.S. stock futures are hinting at a modest rebound, signaling some respite in a market fraught with volatility.

As investors brace for a turbulent week ahead, all eyes are on today’s Q3 earnings report from McDonald’s, a pivotal Dow Jones component. Despite losing about 2% since the year’s onset, the fast-food behemoth remains a focus of optimism among analysts. They anticipate a year-over-year earnings-per-share rise of 5.6% to $2.83, alongside an 8.9% surge in revenue to $6.2 billion.

Trading Derivatives carries a high level of risk to your capital and you should only trade with money you can afford to lose. Trading Derivatives may not be suitable for all investors, so please ensure that you fully understand the risks involved, and seek independent advice if necessary. A Product Disclosure Statement (PDS) can be obtained either from this website or on request from our offices and should be considered before entering into a transaction with us. Raw Spread accounts offer spreads from 0.0 pips with a commission charge of USD $3.50 per 100k traded. Standard account offer spreads from 1 pips with no additional commission charges. Spreads on CFD indices start at 0.4 points. The information on this site is not directed at residents in any country or jurisdiction where such distribution or use would be contrary to local law or regulation.

All Eyes on the FedAs the Federal Reserve’s Wednesday meeting draws near, anticipation builds over the central bank’s next moves. While the Fed is expected to maintain its current benchmark interest rate, traders remain hopeful for signals that the central bank might halt rate hikes for the rest of the year.

A further rate hike seems more likely than not, especially with persistent inflation rates at 3.7%, significantly above the Fed’s 2% target. However, strong GDP growth of 4.9% in Q3 2023 has led some to speculate that rates might remain unchanged.

Tech Sector Under Pressure

The spotlight will also shine on Apple, which reports its earnings on Thursday. Tech stocks have been hit hardest amid rising interest rates, with the Nasdaq Composite dropping more than 12% from its 2023 high. Recent disappointing earnings from Big Tech players like Google-parent Alphabet have further aggravated the situation, driving all three major U.S. indices towards their third consecutive negative month.

Interest Rates and the Labor Market

The 10-year Treasury yield, after peaking at over 5% last week, settled at 4.84%. This Friday’s October jobs report could offer the Federal Reserve more context on whether to proceed with rate hikes. Investors are eyeing this data, hoping that a slowdown in labor market growth may encourage the Fed to maintain the status quo on interest rates for the remainder of the year.

Short-Term Forecast: Cautiously Bearish

Given the array of economic crosswinds and upcoming events, the market’s short-term outlook appears cautiously bearish. While McDonald’s earnings could provide a temporary lift, the broader concerns about the Federal Reserve’s actions and the tech sector’s vulnerability continue to weigh down market sentiment.

Technical Analysis

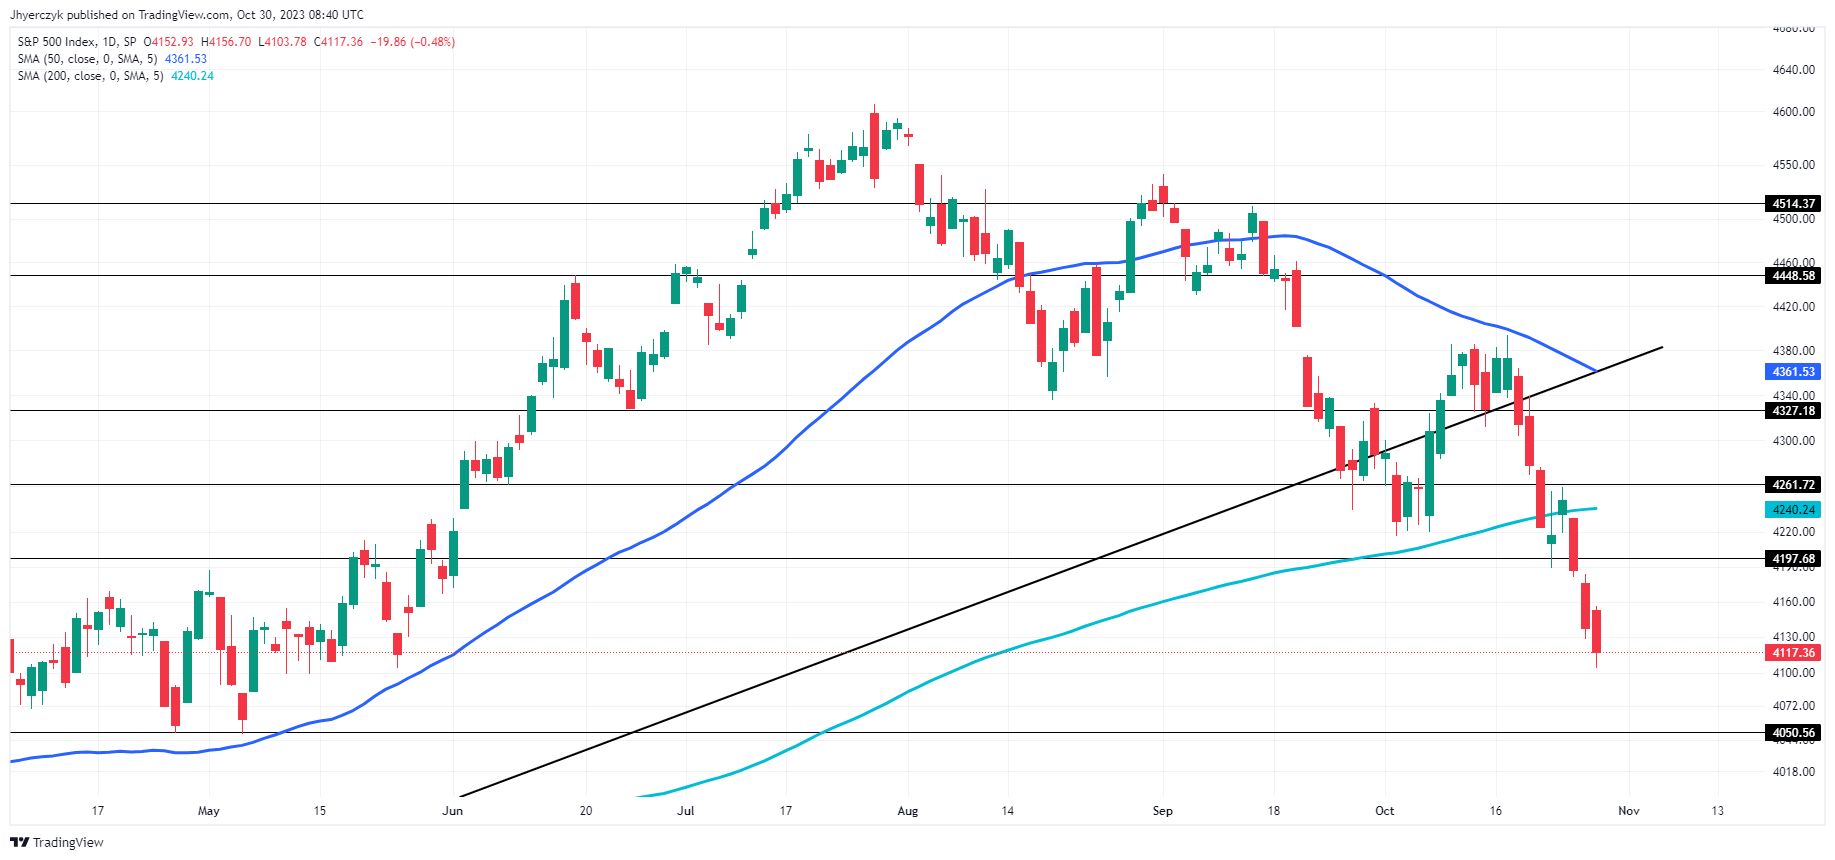
Daily S&P 500 Index (SPX)The S&P 500 Index’s current daily price of 4117.36 is trading below both its 200-day and 50-day moving averages, at 4240.24 and 4361.53 respectively, indicating a bearish trend. While minor support is at 4050.56, the index faces resistance at 4197.68 and a more significant level at 4261.72.

With these factors in mind, the market sentiment appears to be bearish. The index is more susceptible to testing its minor support level, and any attempt to rally will likely face resistance, especially at the 200-day moving average, which serves as a critical psychological barrier for investors.

Silver Prices Forecast: Traders Balancing Geopolitical Tensions, Fed Uncertainty

Silver Prices Forecast: Traders Balancing Geopolitical Tensions, Fed Uncertainty

Silver Oscillates Amid Geopolitical and Economic Crosswinds

Silver (XAG/USD) prices found their footing back at the $23.00 level at the start of the week, regaining losses experienced on Friday. Yet, the asset remains confined below the formidable $24.00 resistance mark. As traders weigh the implications of rising geopolitical tensions and an upcoming Federal Reserve meeting, gains in the silver market appear constrained.

Market Dynamics: Caution in the Air

Safe-haven buying propelled by the escalating conflict in the Middle East has provided some lift for silver, but the gains are subdued. With spot silver down 0.09% at 06:58 GMT and U.S. December Comex silver futures up 1.43%, the market’s enthusiasm is clearly lagging compared to gold. This dynamic has put traders on the fence, hesitant to push the asset significantly higher.

Trading Derivatives carries a high level of risk to your capital and you should only trade with money you can afford to lose. Trading Derivatives may not be suitable for all investors, so please ensure that you fully understand the risks involved, and seek independent advice if necessary. A Product Disclosure Statement (PDS) can be obtained either from this website or on request from our offices and should be considered before entering into a transaction with us. Raw Spread accounts offer spreads from 0.0 pips with a commission charge of USD $3.50 per 100k traded. Standard account offer spreads from 1 pips with no additional commission charges. Spreads on CFD indices start at 0.4 points. The information on this site is not directed at residents in any country or jurisdiction where such distribution or use would be contrary to local law or regulation.

The Fed and Inflation: A Balancing Act

The question of inflation continues to loom large. Inflation rates spiked in July and August and remained stable in September. Now, with the Fed’s benchmark interest rates at a 22-year peak, ranging from 5.25% to 5.50%, the central bank’s upcoming meeting on October 31 – November 1 becomes the focal point. Eyes are peeled for any shifts in the rate trajectory, particularly as Federal Reserve Chair Jerome Powell has previously signaled a readiness for further rate hikes, if warranted.

Global Economic Metrics

The market is also absorbing other bullish economic indicators like the 4.9% GDP growth in Q3 2023 and a surge in U.S. consumer spending. These metrics, although positive, add another layer of complexity to the Fed’s decision-making, potentially supporting a hawkish stance despite geopolitical concerns.

Short-Term Outlook: Cautiously Bearish

Taking into account the various market influencers, the short-term outlook for silver leans towards a cautious bearishness. While geopolitical tensions would typically offer a bullish angle, the Federal Reserve’s potential hawkish inclination could cap gains and exert downward pressure. As traders grapple with these conflicting signals, staying vigilant and nimble remains the prudent course of action.

Technical Analysis

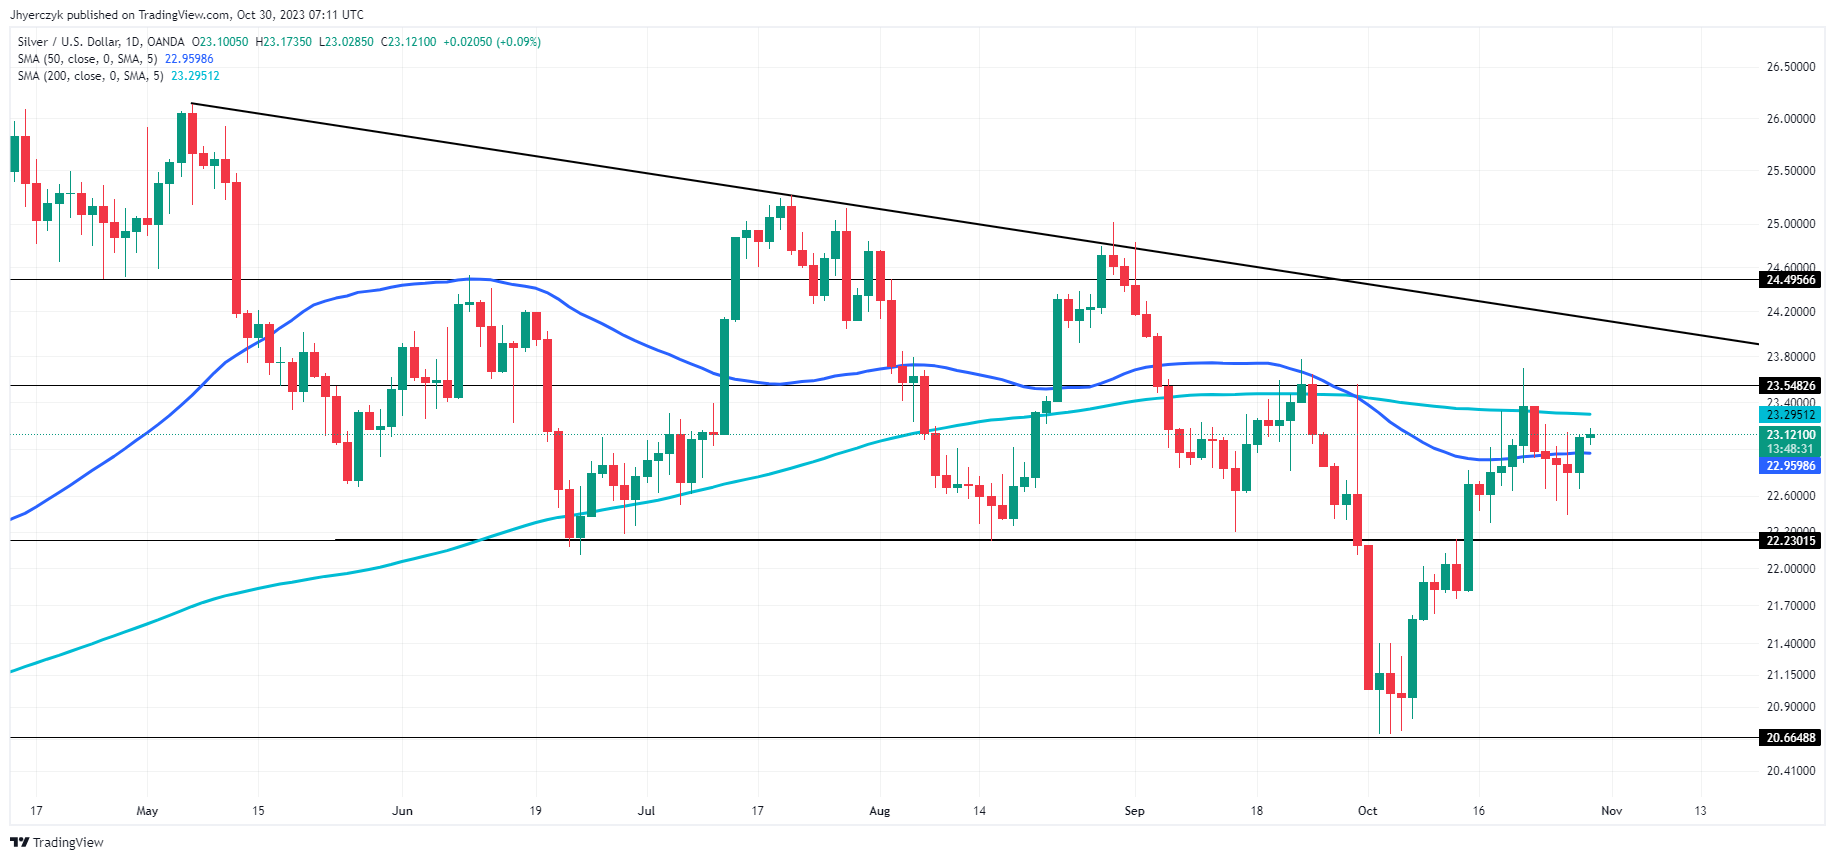
Daily Silver (XAG/USD)The current daily price of silver at $23.14 sits below the 200-day moving average of $23.30, but above the 50-day moving average of $22.96. This suggests that the asset is in a transitional phase.

While it may be showing short-term bullish potential by staying above the 50-day moving average, the failure to break above the 200-day moving average signals enduring caution.

Additionally, with minor resistance at $23.55 and major resistance at $24.50, the asset faces an uphill battle. Conversely, minor support at $22.23 and major support at $20.66 offer downside cushions.

Overall, the market sentiment leans cautiously bullish.

Gold Price Jumps Hurdles Ahead of Fed and Despite a USD Rally. Higher XAU/USD?

Gold Price Jumps Hurdles Ahead of Fed and Despite a USD Rally. Higher XAU/USD?

The spot gold price cleared the psychological US$ 2,000 level last Friday as markets prepare for this week’s Federal Open Market Committee (FOMC) meeting that will conclude on Wednesday.

Treasury yields have eased from recent peaks but remain elevated with the benchmark 10-year bond trading at 5.02% last week, its highest yield since 2007. It consequently raced back down toward 4.80% and has seen whippy price action since.

The run-up in the return on US Government debt has helped to underpin the US Dollar. In addition, perceived haven assets such as USD and gold have appreciated with the geopolitical situation in the Middle East assisting to undermine growth and risk-orientated assets.

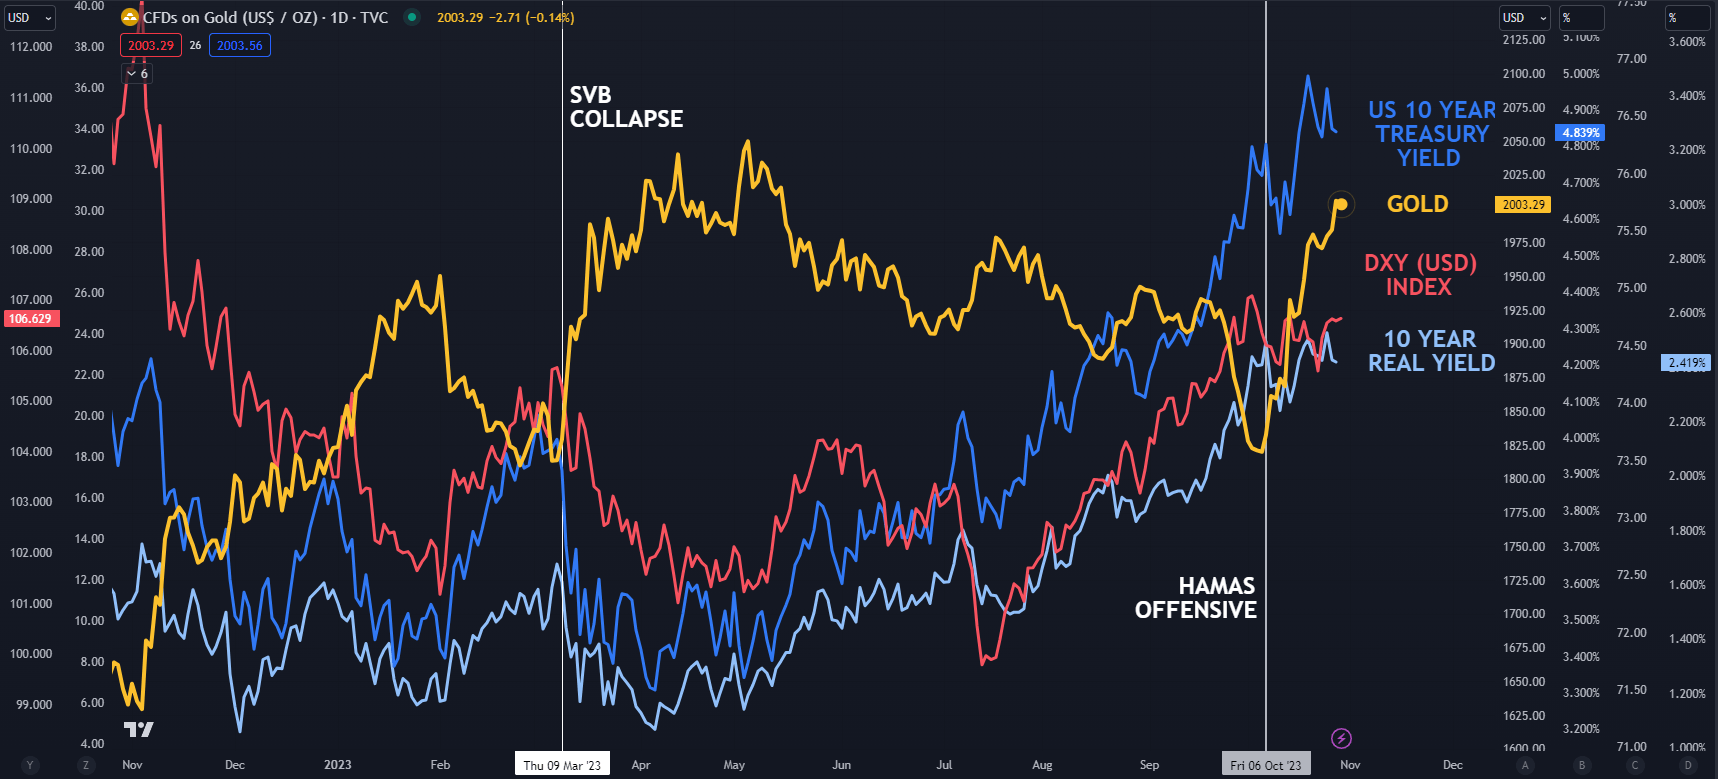
In loose terms, when the US Dollar and Treasury yields rise, gold sometimes comes under selling pressure. Similarly, when US real yields are advancing, gold occasionally slips as it is a non-interest-bearing asset.

US real yields have been on the march higher through 2023 and recently stretched to a 15-year peak at the 10-year part of the curve, trading above 2.60%.

The real yield is the nominal yield less the market-priced inflation rate derived from Treasury inflation-protected securities (TIPS) for the same tenor.

A combination of higher nominal yields and an easing of inflation expectations has boosted it in this latest surge.

Looking at the chart below, the elevated 10-year Treasury yields, real yields and DXY (USD) index are yet to impact the gold price, but it might be worth watching should those markets move abruptly.

The interest rate market is pricing no change for the Fed funds target rate at Wednesday’s FOMC conclave but the post-decision discussion from Fed Chair Jerome Powell could provide some impetus for the gold price. To learn more about the impact that central banks have on markets, click on the banner.

SPOT GOLD, DXY (USD) INDEX, US 10-YEAR TREASURY AND REAL YIELD

image1.png

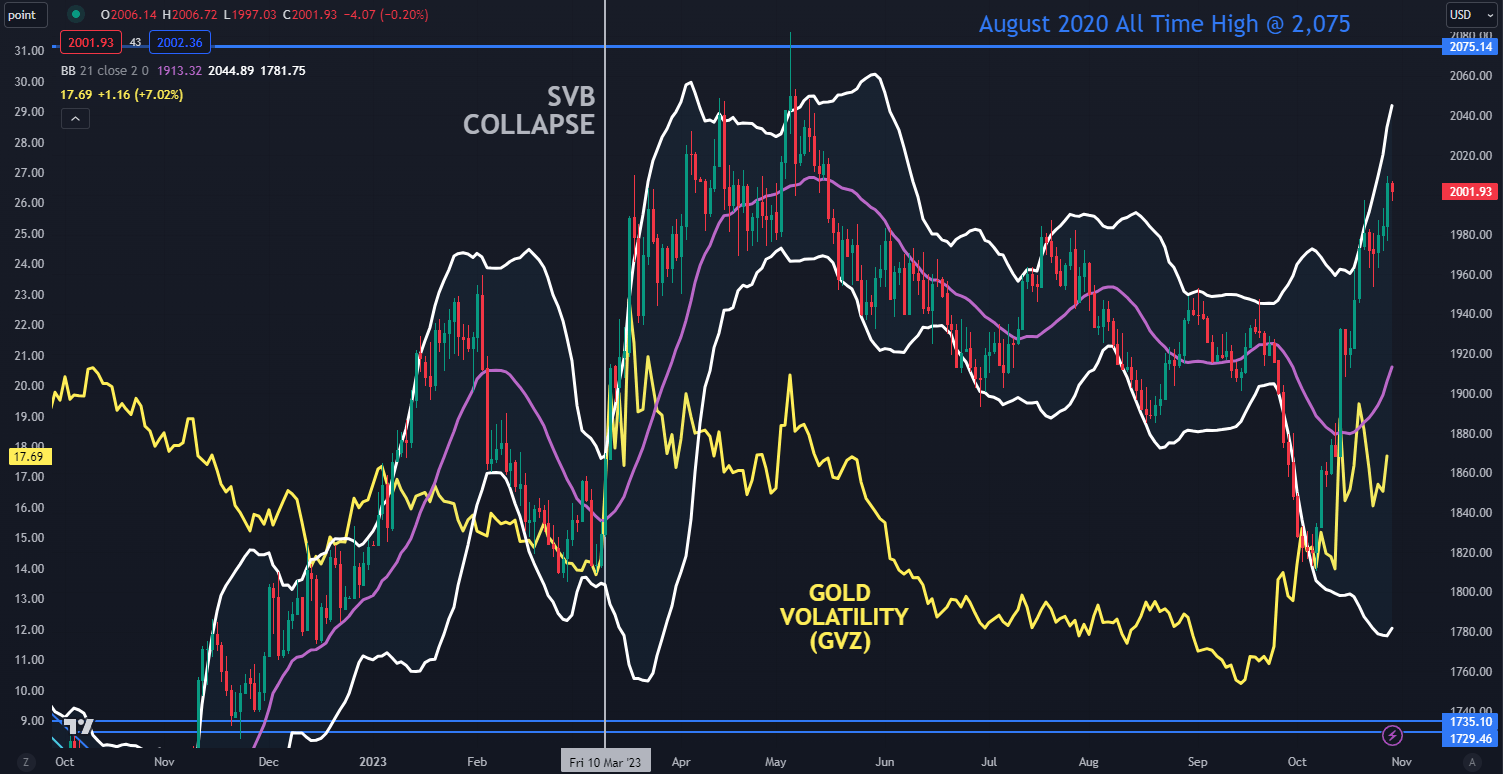
All this price action across markets has seen gold volatility tick higher as measured by the GVZ index. The GVZ index measures implied volatility in the gold price in a similar way that the VIX index gauges volatility in the S&P 500.

At the same time, the width of the 21-day simple moving average (SMA) based Bollinger Bands. has expanded. The Bolling Bands represent historical volatility.

SPOT GOLD, BOLLINGER BANDS AND GVZ INDEX

image2.png


Canadian Dollar Outlook After BoC Stands Pat: USD/CAD, EUR/CAD, AUD/CAD

Canadian Dollar Outlook After BoC Stands Pat: USD/CAD, EUR/CAD, AUD/CAD

The Canadian dollar is testing the lower end of the past one-year range against the US dollar after the Bank of Canada (BoC) governor last week indicated that interest rates may have peaked.

BoC Governor Tiff Macklem indicated last week that the central bank may not need to raise rates further if inflation continues to moderate. However, the central bank governor added that the BoC would be looking for “clear evidence” that inflation is heading toward the 2% target before it would cut interest rates. BoC kept benchmark rates at a 22-year high on Wednesday but left the door open for more hikes saying inflation could exceed its target for another two years.Meanwhile, markets are pricing in a very small chance of another rate hike at its next meeting in December.

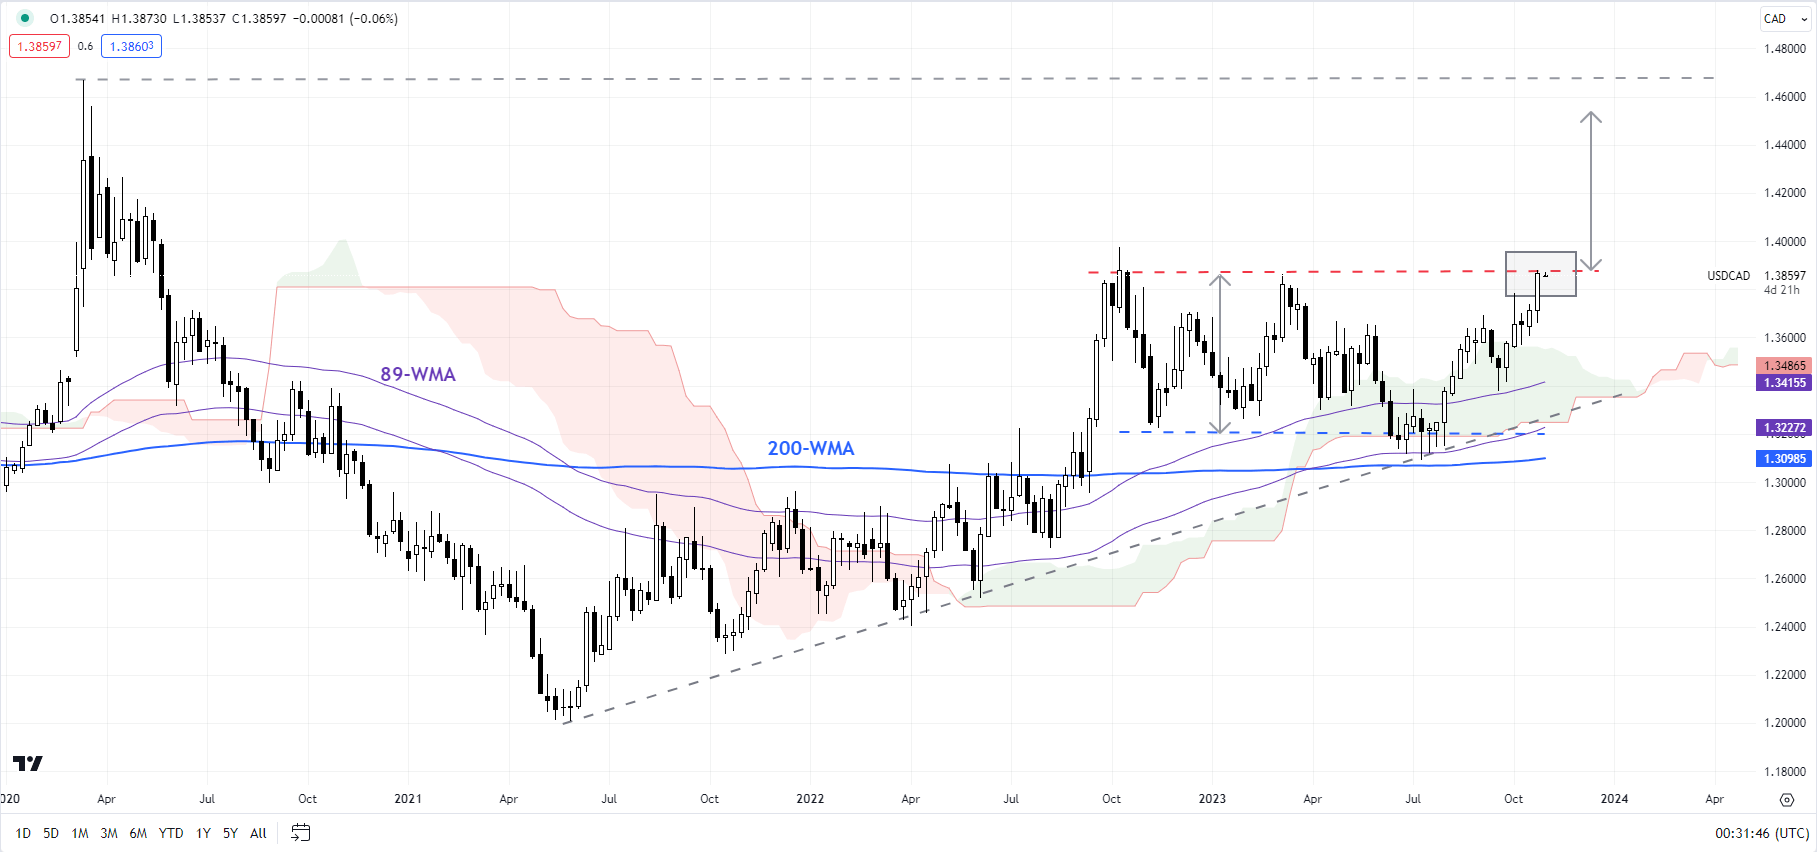
USD/CAD Weekly Chart

image1.png

USD/CAD: Looming bullish break?

USD/CAD has been testing a major barrier on the upper edge of a sideways channel since late 2022 (that comes at about 1.3900-1.3975). This resistance is strong and may not be easily broken – at least in the first attempt. However, any break above could open the way toward the 2020 high of 1.4675. For the upward pressure to begin fading, USD/CAD would need to fall under the early October high of 1.3785. However, the broader upward pressure is unlikely to ease while it holds above the September low of 1.3375. USD/CAD has maintained a steady uptrend since mid-2023, rebounding from a crucial cushion on the 200-week moving average, coinciding with an uptrend line from 2021.

Curious to learn how market positioning can affect asset prices? Our sentiment guide holds the insights—download it now!

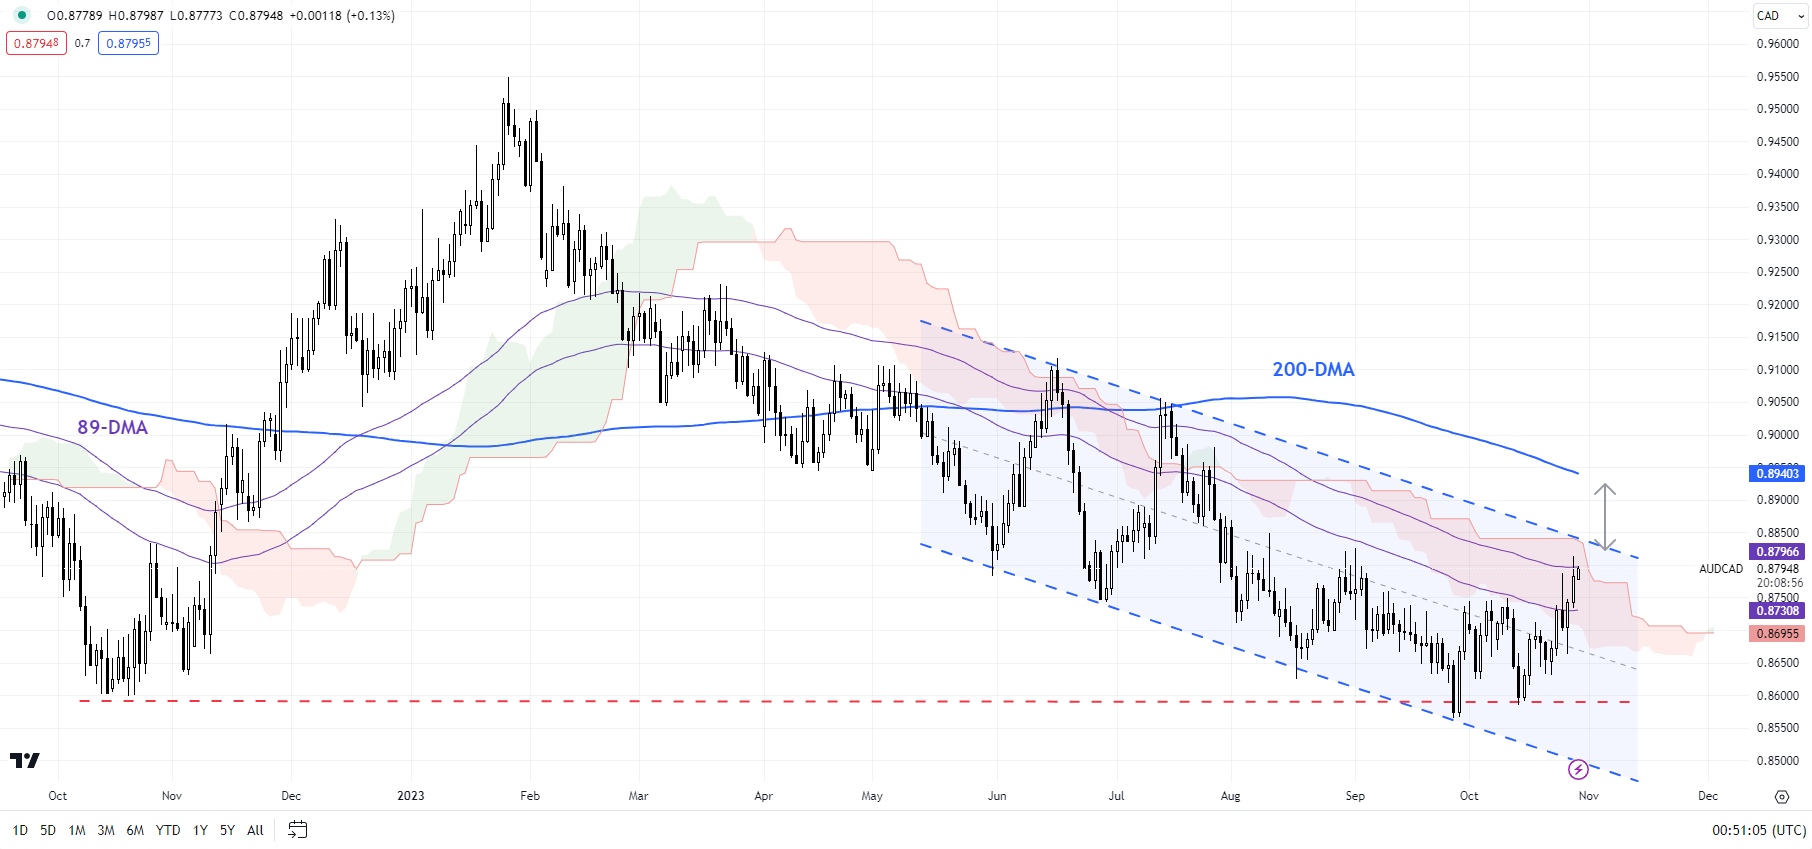
AUD/CAD Daily Chart

image2.png

AUD/CAD: Holding support for now

AUD/CAD is holding above strong support at the end-2022 low of 0.8600. Still, this wouldn’t necessarily mean that the downtrend is reversing – it could, but for that the cross would need to initially break above the 89-day moving average, coinciding with the upper edge of a declining channel since mid-2023. For a sustained rebound to occur the cross would need to clear the June high of 0.9100.

EUR/CAD Daily Chart

image3.png

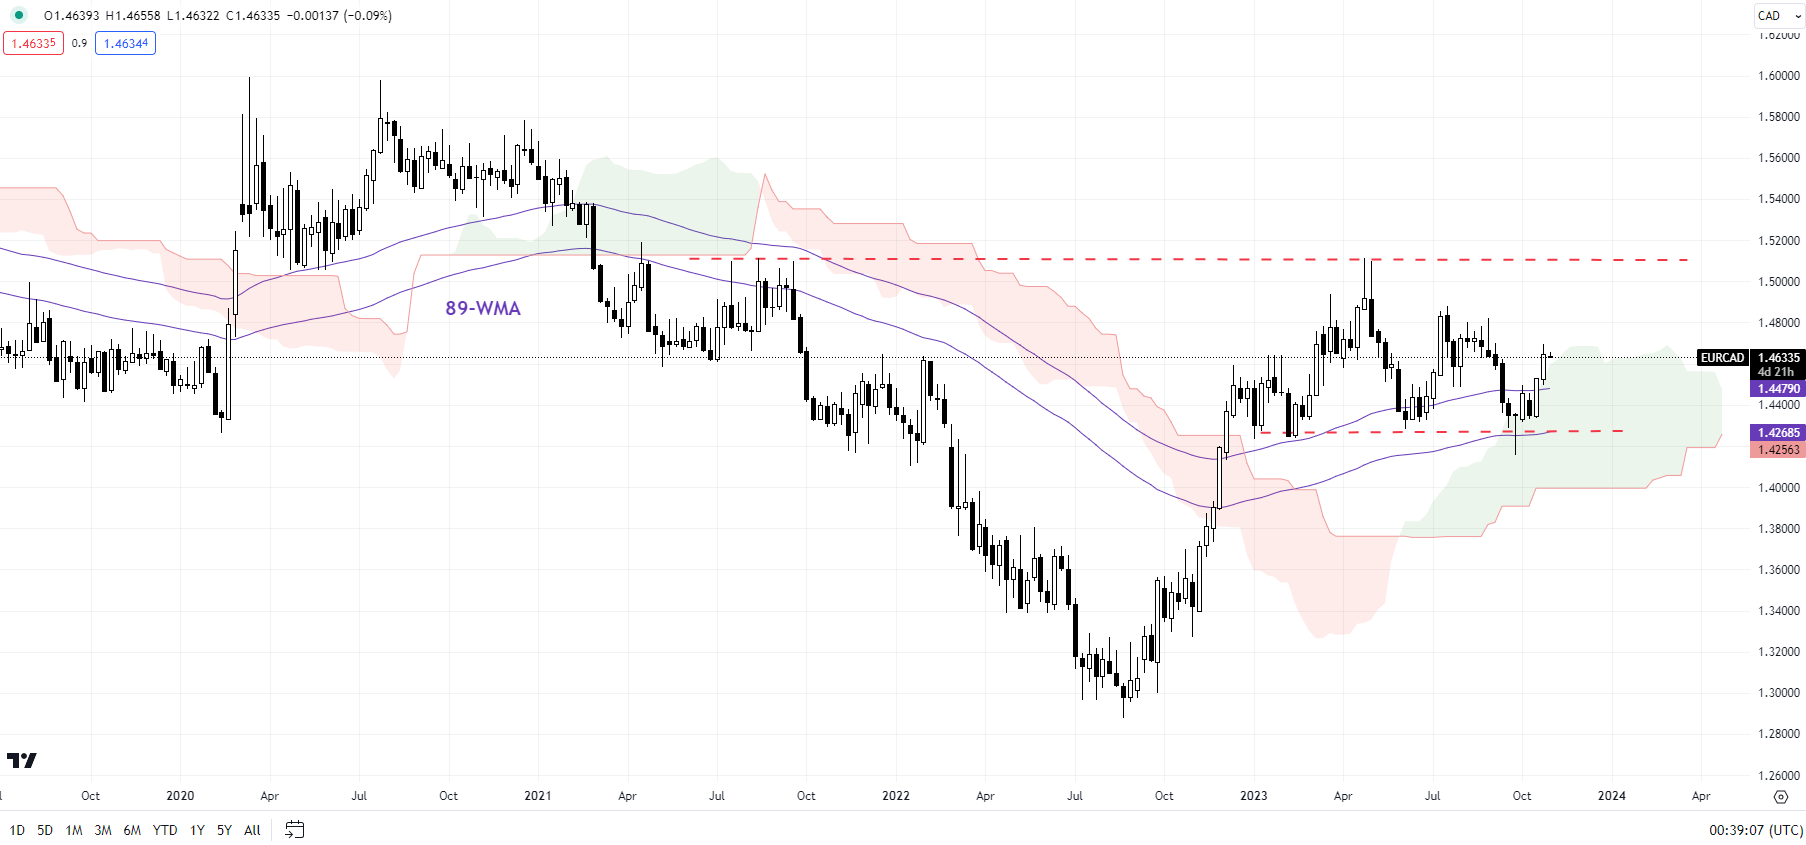
EUR/CAD: Consolidation within a bullish phase

EUR/CAD has remained sideways for much of this year. However, there is no sign of a reversal of the bullish structure that began last year. The cross holds quite strong support on a horizontal trendline from early 2023, slightly above the lower edge of the Ichimoku cloud on the daily charts (at about 1.4000). Only a break below 1.4000 would confirm that the upward pressure had faded.

Crude Oil Steadies as Markets Assess Middle East Risks Ahead of the Fed

Crude Oil Steadies as Markets Assess Middle East Risks Ahead of the Fed

Crude oil is contained in the range to start the week, but it has eased slightly through the Asian session. The market remains cautious and concerned about the potential disruption to the global oil supply as a result of the fighting in the Middle East.

Israel began to move ground troops into the Gaza Strip over the weekend and there are hopes that the conflict will not expand across the region. The US and Iran have voiced concerns that the theatre of war might not be contained.

The WTI futures contract has traded below US$ 85 bbl while the Brent contract has dipped under US$ 90 bbl at the time of going to print.

Perceived haven assets have had a mixed start to the week with gold easing slightly after another stellar rally on Friday, dipping toward US$ 2,000 an ounce.

Currency markets have had a quiet start to the week and all eyes will be on the Bank of Japan (BoJ) this week as they contemplate a tilt in monetary policy.

Most pundits are anticipating a shift in yield curve control (YCC) although there has been some speculation that the negative interest rate policy (NIRP) might be addressed.

Meanwhile, the Federal Open Market Committee (FOMC) meeting decision will be known on Wednesday and the interest rate market is not anticipating any change in the Fed funds target rate. The focus will be on the post-conclave press conference.

APAC equities are softer overall after Wall Street finished last week lower while Treasury yields have ticked up slightly after easing on Friday.

WTI CRUDE OIL TECHNICAL SNAPSHOT

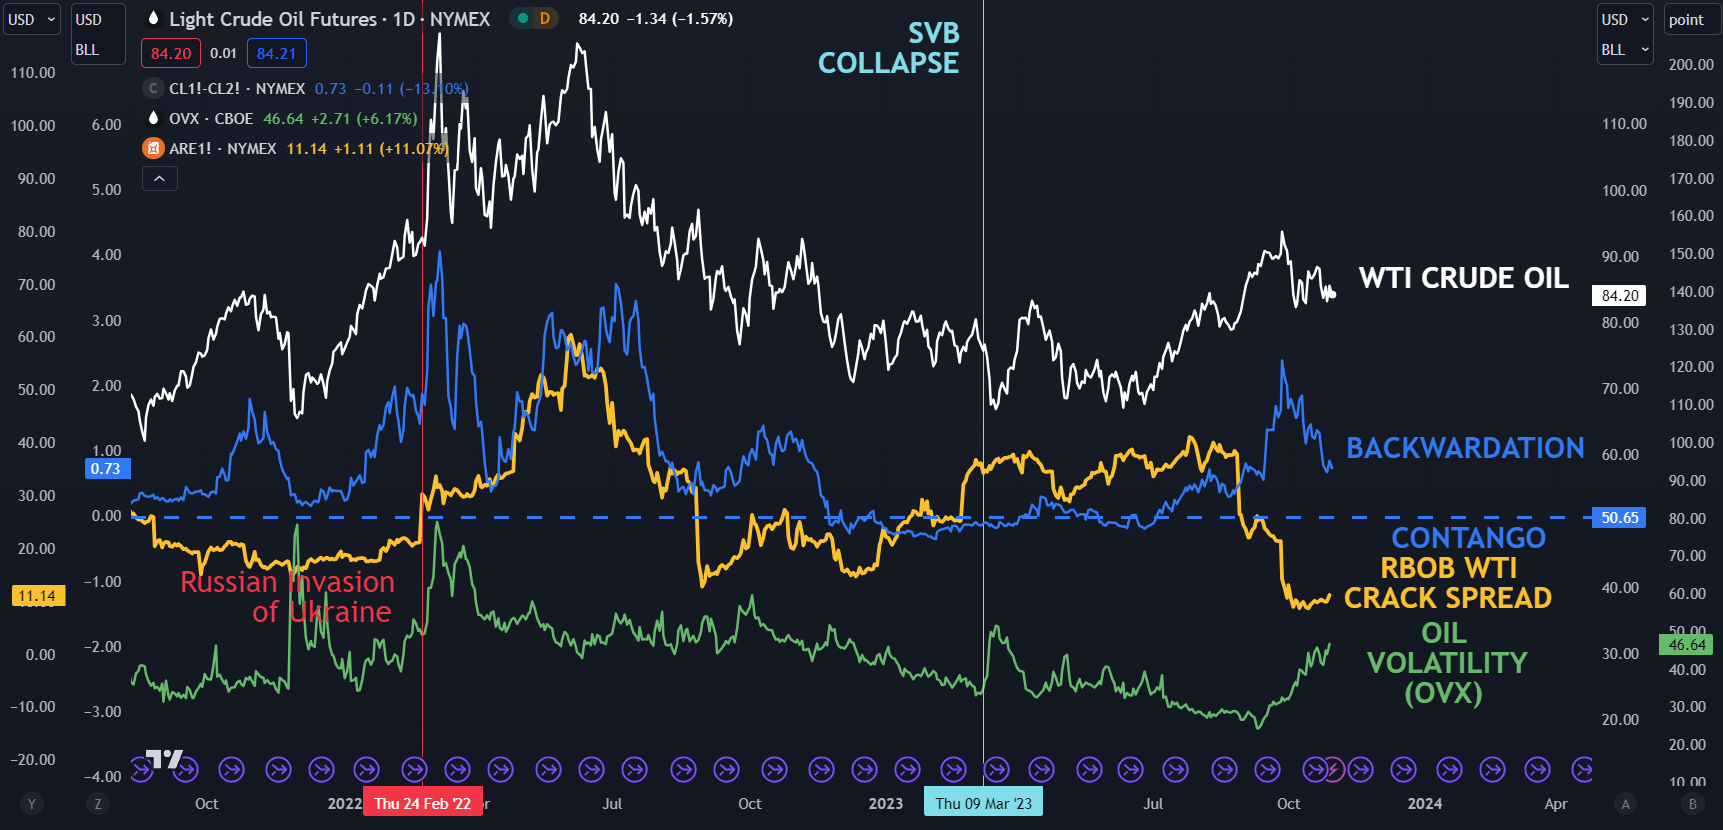
The structural backdrop for crude oil might not be as supportive as initially thought from the prospect of tighter global supply from the war in the Middle East.

Crack spreads are lower as is backwardation at a time when volatility is ticking up.

Backwardation occurs when the futures contract closest to settlement is more expensive than the contract that is settling after the first one. It highlights a willingness by the market to pay more to have immediate delivery, rather than having to wait.

The RBOB crack spread is the gauge of gasoline prices relative to crude oil prices and reflects the profit margin of refiners.

RBOB stands for reformulated blendstock for oxygenate blending. It is a tradable grade of gasoline. If profitability increases for refiners, it may lead to more demand for the crude product.

WTI CHART

image1.png


Pound Price Forecast: Upcoming BoE Expectations Keep GBP Subdued

Pound Price Forecast: Upcoming BoE Expectations Keep GBP Subdued

GBPUSD FUNDAMENTAL BACKDROP

The British pound ended the previous week on the backfoot as inflationary pressures in the UK via the labor market softened in conjunction with weak PMI preliminary data.

The ongoing war between Israel-Hamas remains volatile and will ultimately safe haven currencies like the USD over sterling. Cracks in global stock markets have also contributed to souring risk sentiment as corporate earnings disappoint.

With the Bank of England (BoE) and Federal Reserve interest rate decisions in focus this week, of which none of the respective central banks are expected to hike rates. Emphasis will be placed on revised forecasts and guidance in terms of possible policy shifts.

BOE INTEREST RATE PROBABILITIES

image1.png

Later today, UK housing and consumer credit data is scheduled (see economic calendar below). Since June, both metrics have diverged from one another with approvals falling and lending increasing so it will be interesting to see whether this continues or not. Ultimately, today’s data will have minimal impact on the pair but will provide valuable information for the BoE.

GBP/USD ECONOMIC CALENDAR (GMT +02:00)

image2.png

TECHNICAL ANALYSIS

GBP/USD DAILY CHART

image3.png

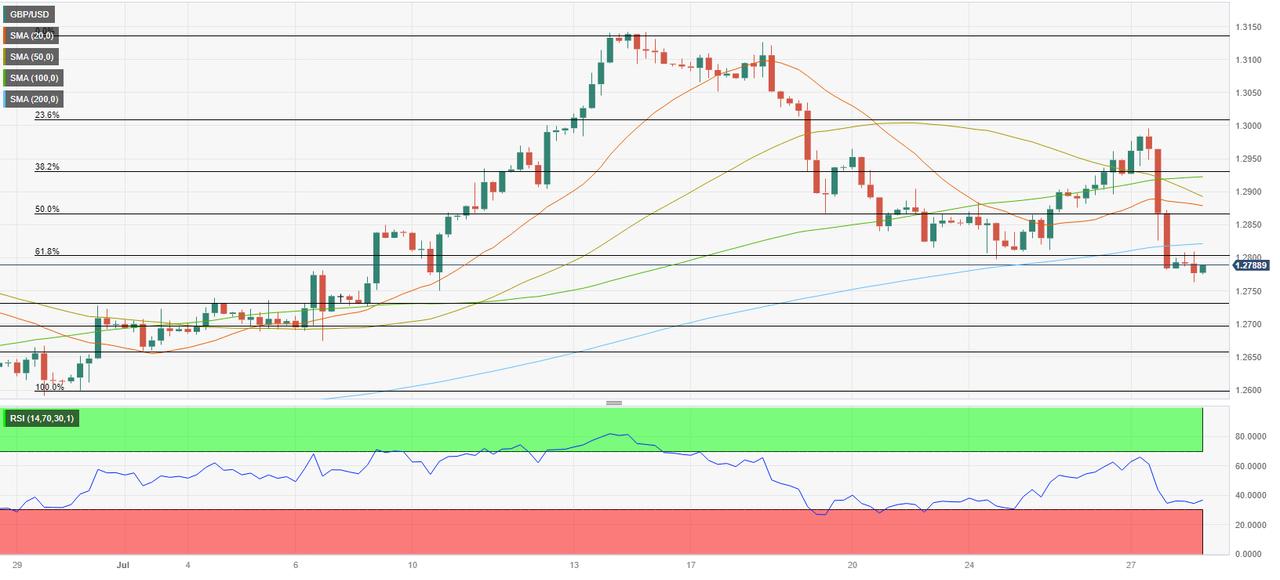
GBP/USD price action holds above the 1.2100 psychological level for now with trendline support nearby. After the death cross (blue) formation earlier this month, downside has been slight but can breakdown further if the aforementioned support zones are breached. Last week’s weekly candle closed with a long upper wick and may add to the bearish bias short-term.